Article

Features of Secular Changes in the Flux Density of the Cas a Supernova Remnant, from Centimeter to Decameter Wavelengths

1
Department of Theoretical Physics and Astronomy, Odessa I.I. Mechnikov National University, Pastera Str. 42, 65023 Odessa, Ukraine
2
Ventspils International Radio Astronomy Centre (VIRAC), Inzenieru Str. 101, LV-3601 Ventspils, Latvia
3
Odessa Observatory “URAN-4” of the Institute of Radio Astronomy NAS of Ukraine, Marazlievskaya Str. 1V, 65014 Odessa, Ukraine
*
Authors to whom correspondence should be addressed.
Galaxies 2021, 9(2), 30; https://doi.org/10.3390/galaxies9020030
Submission received: 20 March 2021 / Revised: 19 April 2021 / Accepted: 30 April 2021 / Published: 4 May 2021

Abstract

:
The purpose of this work is to summarize a large amount of observational data about the secular decrease of Cas A flux in the radio range, as an indicator of physical processes both in the source itself and as a consequence of the influence of the propagation medium. This paper presents results of observations Cas A and Cyg A on radio telescopes of International Radio Astronomy Center (Latvia), and URAN-4 phased array antenna (Institute of Radio Astronomy NAS of Ukraine). According to URAN-4 observations, there were seasonal–diurnal changes in Cas A/Cyg A flux ratios due to the effects of solar activity on the ionosphere, and there may be no secular decrease in Cas A flux density, or a weak tendency to decrease it. The significant influence of the ionosphere makes it difficult to use Cyg A as a reference source in the decameter radio range. In the centimeter radio range, there were episodic intra-day variations at the level 8–10% of Cas A averaged flux. Additionally, in the period January–February 2021, Cas A flux was about 1.7 times that of Cyg A. Taking into account the observed complex type of secular decrease in Cas A flux against the background of changes in space weather variations, further observations of Cas A were planned at radio observatories in Latvia and Ukraine.

1. Introduction

The Cas A radio source (3C 461) was discovered in 1947 and turned out to be the most powerful source in the radio range up to 1 GHz with the flux maximum at 16.5 MHz. For a long time, it was not possible to identify it with a visible object, but in 1950, the radio source was identified with a nebula formed as a result of a supernova explosion. This supernova remnant is quite young, the supernova explosion dates back to about 1680. Carrying out absolute changes in the fluxes of radio emission from sources, especially at low frequencies, is associated with technical difficulties in organizing and conducting them. In this regard, the most widely used methodology is proposed by I.S. Shklovsky for making relative measurements [1]. In this case, the ratio of the fluxes Cas A and the radio galaxy Cyg A is measured (designation Cas A/Cyg A). Cyg A is used as a reference source since it is located at a small angular distance from Cas A. It is assumed that the Cyg A radio galaxy has a constant radio flux for a long time. Episodic observations of the radio source Cas A in this mode were carried out with a variety of radio telescopes and wavelengths, for example, in Jodrell Bank Observatory [2], Clark Lake Radio Observatory [3], Mullard Radio Astronomy Observatory [4], Ryle Telescope [5], DKR-1000 ASC FIAN, radio telescopes of NIRFI, UTR-2, system of low-frequency radio telescopes URAN, GURT, as well as VLA [6], and many others. By now, extensive observational material has been accumulated for the secular decrease of the Cas A flux and its variations in millimeter, centimeter, decimeter, meter, and decameter wavelengths, for example, from one of the earliest classical works about the evolution of the Cas A source flux [7] to the mapping of the Cas A source at low frequencies [8]. The disadvantage of most data sets is the episodic observations in different seasons of the year, and used individual frequencies, which makes it difficult to separate the natural variations of the radio source flux from the effect of changes in the state of the propagation medium. Using aperture synthesis systems, Cas A images were obtained at all wavelengths. This allows studying the structure of images and the dynamics of its changes. An additional intriguing moment was the discovery by the Chandra space X-ray observatory of a point component in the Cas A remnant, a neutron star [9].

2. Materials and Methods

In this work, observations of the Cas A radio source in the decameter radio range were carried out on the URAN-4 phased antenna array with an operating frequency range 10–30 MHz. The antenna belongs to The Institute of Radio Astronomy of the National Academy of Sciences of Ukraine (http://rian.kharkov.ua/index.php/en/ (accessed on 17 April 2021)) and is part of the URAN low-frequency interferometer, which is used to study ionospheric and interplanetary scintillations of powerful space radio sources.
To observe the Cas A source in the centimeter radio range, the 32-m and 16-m parabolic radio telescopes of Ventspils International Radio Astronomy Centre of Latvia (https://www.virac.eu/en (accessed on 17 April 2021)) were used. These radio telescopes are used to study the variability of extragalactic radio sources, as well as maser sources. The main operating frequencies are 5, 6.1, 6.7, 8–8.8 GHz and additionally, 1.3–1.7 GHz on the 32-m antenna.
To analyze small fast variations in the Cas A flux density, the Lomb–Scargle method was used for constructing periodograms for uneven time series [10].
To calculate the time–frequency spectrograms of the Cas A data and solar wind parameters data, the classical Short-Time Fourier Transform (STFT) method was used, which is quite common in radio astronomy and is described in many articles, for example, in [11].
Reducing observation data of the Cas A to a uniform time scale (which is necessary for constructing STFT spectrograms and using FFT-bandpass filtering) and reducing noise in the data was done by the interpolation method using a smoothing cubic spline, which is described, for example, in the article [12].

3. Results

After a supernova explosion, the ejected shell expands with supersonic speed into the interstellar medium and forms a shock wave. The kinetic energy of the envelope is spent on heating the gas behind the front of a powerful shock wave and on accelerating the interstellar gas that the envelope rakes in front of it. When the mass of this gas becomes much larger M0 (initial mass of the remainder), the motion of the shell is rather accurately described by L.I.Sedov’s theory [13] for a strong explosion in the environment. At the end of the stage of free expansion, a backward shock wave appears, propagating inside the shell (in coordinate system associated with the shock front). Since plasma radiation is proportional to the square of the density, it is the backward shock wave that makes the largest contribution to the X-ray emission of young supernova remnants [14].
“Snow-plow” stage. This stage begins after the catastrophic cooling of the shell gas, when the temperature drops below ≈ 6 · 10 5 K , and the plasma begins to intensely emit the stored thermal energy. In this case, the shock wave becomes isothermal. The shell becomes thin and cold because the velocity of the gas that has passed through the shock wave is less than the velocity of the front through the medium, and the gas, compressed by the pressure of the shell from the inside, remains for a long time near the front of the shock wave. The transition to this regime occurs when the shell radius:
R c = 24 · ( E 51 n 0 ) 1 / 3 P c ,
where E 51 = E 0 10 51 Erg/s, E 0 —initial explosion energy, n 0 —concentration of atoms.
The rarefied hot gas inside the shell practically does not cool down and is an additional source of expansion of the shells. At this stage, the envelope of the supernova remnant is clearly visible in the optical emission from the recombination of ionized hydrogen atoms and ionized oxygen. Further, the shell continues to expand due to its own momentum. This stage is better seen in the radio emission of neutral hydrogen atoms. However, in reality, significant inhomogeneity of the density of the interstellar medium, magnetic fields, various instabilities (thermal instabilities, Rayleigh–Taylor instability, instability of the Richtmyer–Meshkov shock front) and other astrophysical factors significantly complicate this schematic picture of the evolution of remnants supernovae [15].
The model of secular decrease in the supernova remnant flux was presented by I.S. Shklovsky. The predictions of the theory of I.S. Shklovsky about the nature of the secular decrease in the flux were refined according to the data of numerous observations at frequencies from the meter to the millimeter range. According to I.S. Shklovsky, it was assumed that the rate of secular flux decrease does not depend on frequency. In this regard, in a number of works, the data were averaged over all frequencies. Subsequently, E.N. Vinyaykin, used observational data of the frequency range 36 MHz–250 GHz, obtained an empirical dependence that describes the rate of secular decrease in the flux [16,17] and its dependence from frequency:
d ν [ % year 1 ] = ( 0.63 ± 0.02 ) + ( 0.04 ± 0.01 ) ln ν [ GHz ] + ( 1.51 ± 0.16 ) · 10 5 ( ν [ GHz ] ) 2.1
The totality of observational data indicates a slowdown in the rate of expansion the Cas A remnant due to its interaction with the environment. Currently, a scientists from the LOFAR group is working on building a model that will describe the secular decrease in the Cas A flux based on the Sedov model [18,19]. Frequency model of secular flux decrease Cas A [20] calculated for a frequency of 1405 MHz, shows the rate of its change –0.93 ± 0.04 % year−1:
100 F ν d F ν d t = ( 0.97 ± 0.04 ) ( 0.30 ± 0.04 ) log ν GHz
The secular decrease in the Cas A flux is irregular over time, wave-like deviations from the linear trend were observed, as well as the dependence of the secular decrease from frequency. The irregularity of the decrease in flux over time is probably due to random changes in the contribution to the integral radio emission from many compact features observed in the angular structure of this source [21]. However, the information on wave-like oscillations in different radio ranges has not yet been fully structured and there is still no complete picture of the similarities and differences between them, depending on the radio range of observations. An increase in brightness or dimming of compact components is effectively described by the development of the Rayleigh–Taylor instability in various parts of the Cas A shell. Convective instabilities can form along the entire leading edge of the shock wave if the degree of compression of the material is sufficiently large. Modern numerical simulations show that this type of instability prevails in young supernova remnants and develops as long as there is a backward shock wave in the remnant. The arising convective instabilities can create typical filamentary structures in the Cas A shell. Increased turbulence can enhance magnetic fields, and radio emission in these regions is enhanced. [22]. Thus, many factors affect the secular decrease in the flux of Cas A. Therefore, monitoring observations of Cas A in a wide range of radio frequencies is very important to improve the existing models of secular flux decrease.

3.1. Evolution of the Spectra Cas A and Cyg A

For a long time, the research works of the secular decrease in the Cas A flux were based on the relative method of flux measurement; the Cyg A radio galaxy was used as a reference source. It was believed that the flux of this source does not change with time. The Cas A/Cyg A flux ratio was used to determine the dynamics of changes in the secular decrease in the Cas A flux. At the same time, it is important to compare the Cyg A spectrum taking into account the nature of the Cas A spectrum variation. The Cas A spectrum has a typical form of a nonthermal synchrotron spectrum of young supernova remnants. To approximate the secular decrease in the Cas A flux, a power function is usually used; in addition, linear and exponential time dependences are often used.
The maximum of the Cas A flux density, 38,124 Jy in the 2015.5 epoch, occurred at 15.6 MHz. Flattening of the spectrum with increasing frequency at centimeter and millimeter waves is noted. The fall in the spectrum is due to absorption in the HII zone. It is interesting to compare the spectra of Cas A and the reference source Cyg A.
In the 1965 epoch, the Cyg A spectrum was located below the Cas A spectrum in the entire radio wave range. A different picture is observed half a century later. The Cas A and Cyg A spectra were crossed at ν = 43 MHz. These data are confirmed by observations in the frequency range 35–65 MHz, which were obtained in the work [23] on the GURT radio telescope for epoch 2014. There was an excess of the Cyg A flux density over the flux of Cas A, which in the epoch 2015.5 reached 10% at a frequency of 115 MHz. At the same time, the Cas A flux at decameter and centimeter waves continues to dominate over the Cyg A flux. The features of secular variations in the Cas A flux in different ranges are presented in the brief overview below. According to the data of absolute measurements of the Cas A flux, carried out in the period from 1971 to 1984 in the frequency range 0.5–10 GHz, presented in the work of K.S. Stankevich, quasiperiodic changes in the spectral index were found with an assumed period close to 6 years [24].

3.2. Secular Decrease in the Flux of Cassiopeia A in the Centimeter and Millimeter Radio Bands

At millimeter and centimeter radio bands, according to observations carried out in the period 2001–2009, there is accordance with the theory of secular flux decrease, described by Shklovsky. The fall of flux in the interval 10–15 years corresponds to the empirical formula for the rate of secular flux decrease obtained in the work [17]. The data were obtained by the method of absolute measurements of the Cas A flux density at a wavelength of 8.1 mm at the Kara–Dag radio astronomy station using a radio telescope with a mirror diameter of 7 m [25]. The rate of secular flux decrease, according to Formula (3), was 0.56% per year:
1 S ν d S ν d t = ( 0.56 ± 0.01 )
The authors of the work noted that the flux decrease rate is not constant and alternately accelerates and decelerates over 10–15-year intervals [26]. Observations at the frequency 7.8 GHz, which were made over an 11-year time interval, showed that the Cas A flux density, at this frequency, decreased at a rate of 0.70 ± 0.1% per year [20].
It is worth noting that a compact central object (neutron star), in the radio range, has not yet been reliably detected in Cas A. However, observations of another young supernova remnant (which were carried out on the ALMA millimeter-wave antenna array), namely SN 1987A—a supernova that exploded in the Large Magellanic Cloud, showed that in the SN 1987A system there is a section of dust and gas with a high temperature, relative to the surrounding area, which allowed the authors to assert about a probable compact source, a neutron star hiding behind the dust and heating it [27]. Since that supernova remnant is quite similar to the Cas A angular structure with ring-like elements, it can be assumed that there also will be evidence of a neutron star in Cas A, in the radio range.

3.3. Secular Decrease in the Flux of Cassiopeia A in the Decimeter Radio Band

Data at a frequency of 927 MHz were obtained at the Staraya Pustyn radio astronomical observatory by measuring the Cas A radio flux density relative to the Cyg A radio galaxy [28]. At the decimeter wavelength, the secular flux decrease is consistent with the model proposed by I.S. Shklovsky. Value of the rate of secular flux decrease was, in that experiment:
d ν = ( 0.72 ± 0.03 ) % year 1
(observation interval from 1977.8 to 2004.6).
At decimeter waves, where the secular flux decrease in the ratio Cas A/Cyg A is well traced, a trend line can be identified and the rate of the secular decrease in flux ratios can quite accurately be determined [29].
At the same time, observations at a frequency of 1405 MHz show that the rate of the Cas A flux decrease in 1970 was d ν = ( 0.886 ± 0.021 ) % . Subsequently, from 1970 to the end of the 1990s, it slowed down to d ν = ( 0.516 ± 0.056 ) % , then accelerated again and by the end of 2010 and was equal to d ν = ( 0.798 ± 0.058 ) % . After 2010, the rate of secular flux decrease was decreased to d ν = ( 0.654 ± 0.019 ) % [30,31]. The possible periodicity of this phenomenon has not yet been determined. A similar type of behavior of the flux density is also observed at meter waves.

3.4. Secular Decrease in the Flux of Cassiopeia A in the Meter Radio Band

In work [32], the results of long-term measurements of flux density of the young Cas A supernova remnant relative to the Cyg A radio galaxy flux at frequencies 38, 151.5, 290 MHz and earlier measurements at a frequency of 81.5 MHz are presented. Data at 151.5 and 290 MHz were obtained at the Staraya Pustyn radio astronomical observatory. Measurements of the radio flux density Cas A relatively to Cyg A at a frequency of 38 MHz were carried out using the East–West antenna of the DKR-1000 radio telescope [33]. The data of long-term observations of the Cas A at frequencies 81.5, 102, 152 MHz were obtained on the DKR-1000 radio telescope. For example, at a frequency of 102 MHz, the flux decreased at a rate-per-year of d ν = ( 0.8 ± 0.12 ) % [34].
Long-term observations of changes in the Cas A/Cyg A flux density ratios were carried out at a wavelength 4.2 m on interferometer at the BAO and IRFE NAS of Armenia (R.M. Martirosyan, A.G. Gulyan, G.A. Pirumyan, S.A. Sargisyan, G. S. Avetisyan), which were organized at the suggestion of academician V.A. Ambartsumyan.
In the time interval from 1953 to 2001, the secular flux decrease was 0.7% per year. Moreover, the slowdown of the secular decrease is noticeable, corresponding to a maximum of the 19-cycle of solar activity in 1959. [35]. In the subsequent work, analysis data of daily observations of the ratios spectral flux density Cas A/Cyg A in 2002–2006 showed the presence of periodic changes 2.5–3 years against the background of the secular flux decrease trend. [36,37]. As a result, the rate dν of secular flux decrease of the Cas A radio emission at different frequencies of the meter radio range in different periods of time was (under condition stability of flux of the radio galaxy Cyg A):
( 0.71 ± 0.06 ) % year 1 (observation period 1949–2008.9), as well as ( 0.78 ± 0.04 ) % year 1 (observation period 1966.5–2006.6), and ( 0.61 ± 0.03 ) % year 1 (observation period 1978.8–2011.7). Analysis of long-term observations at 38 MHz [38,39] demonstrated significant flux variations relative to the monotonic trend of the secular decrease in the Cas A flux density. Such effects require separate studies. A large piece of work for the study of variations in secular decrease the Cas A flux was carried out at the VLA antenna system in the USA. In work [6], the analysis of data over a period of about 15 years, performed mainly at the frequency 74 MHz, is considered. It is known that the Cas A flux density, against a background of secular decrease trend, has variations that have been mentioned by many authors. In the work performed at the VLA, it was shown that, in fact, there are near-cyclic variations in the flux density Cas A, with quasi-periods 3.1, 5.1, 9.0 and 24.0 years. The nature of these long-term variations is not yet fully understood and is under discussion. Therefore, continuous monitoring of Cas A at low frequencies is an important scientific task.

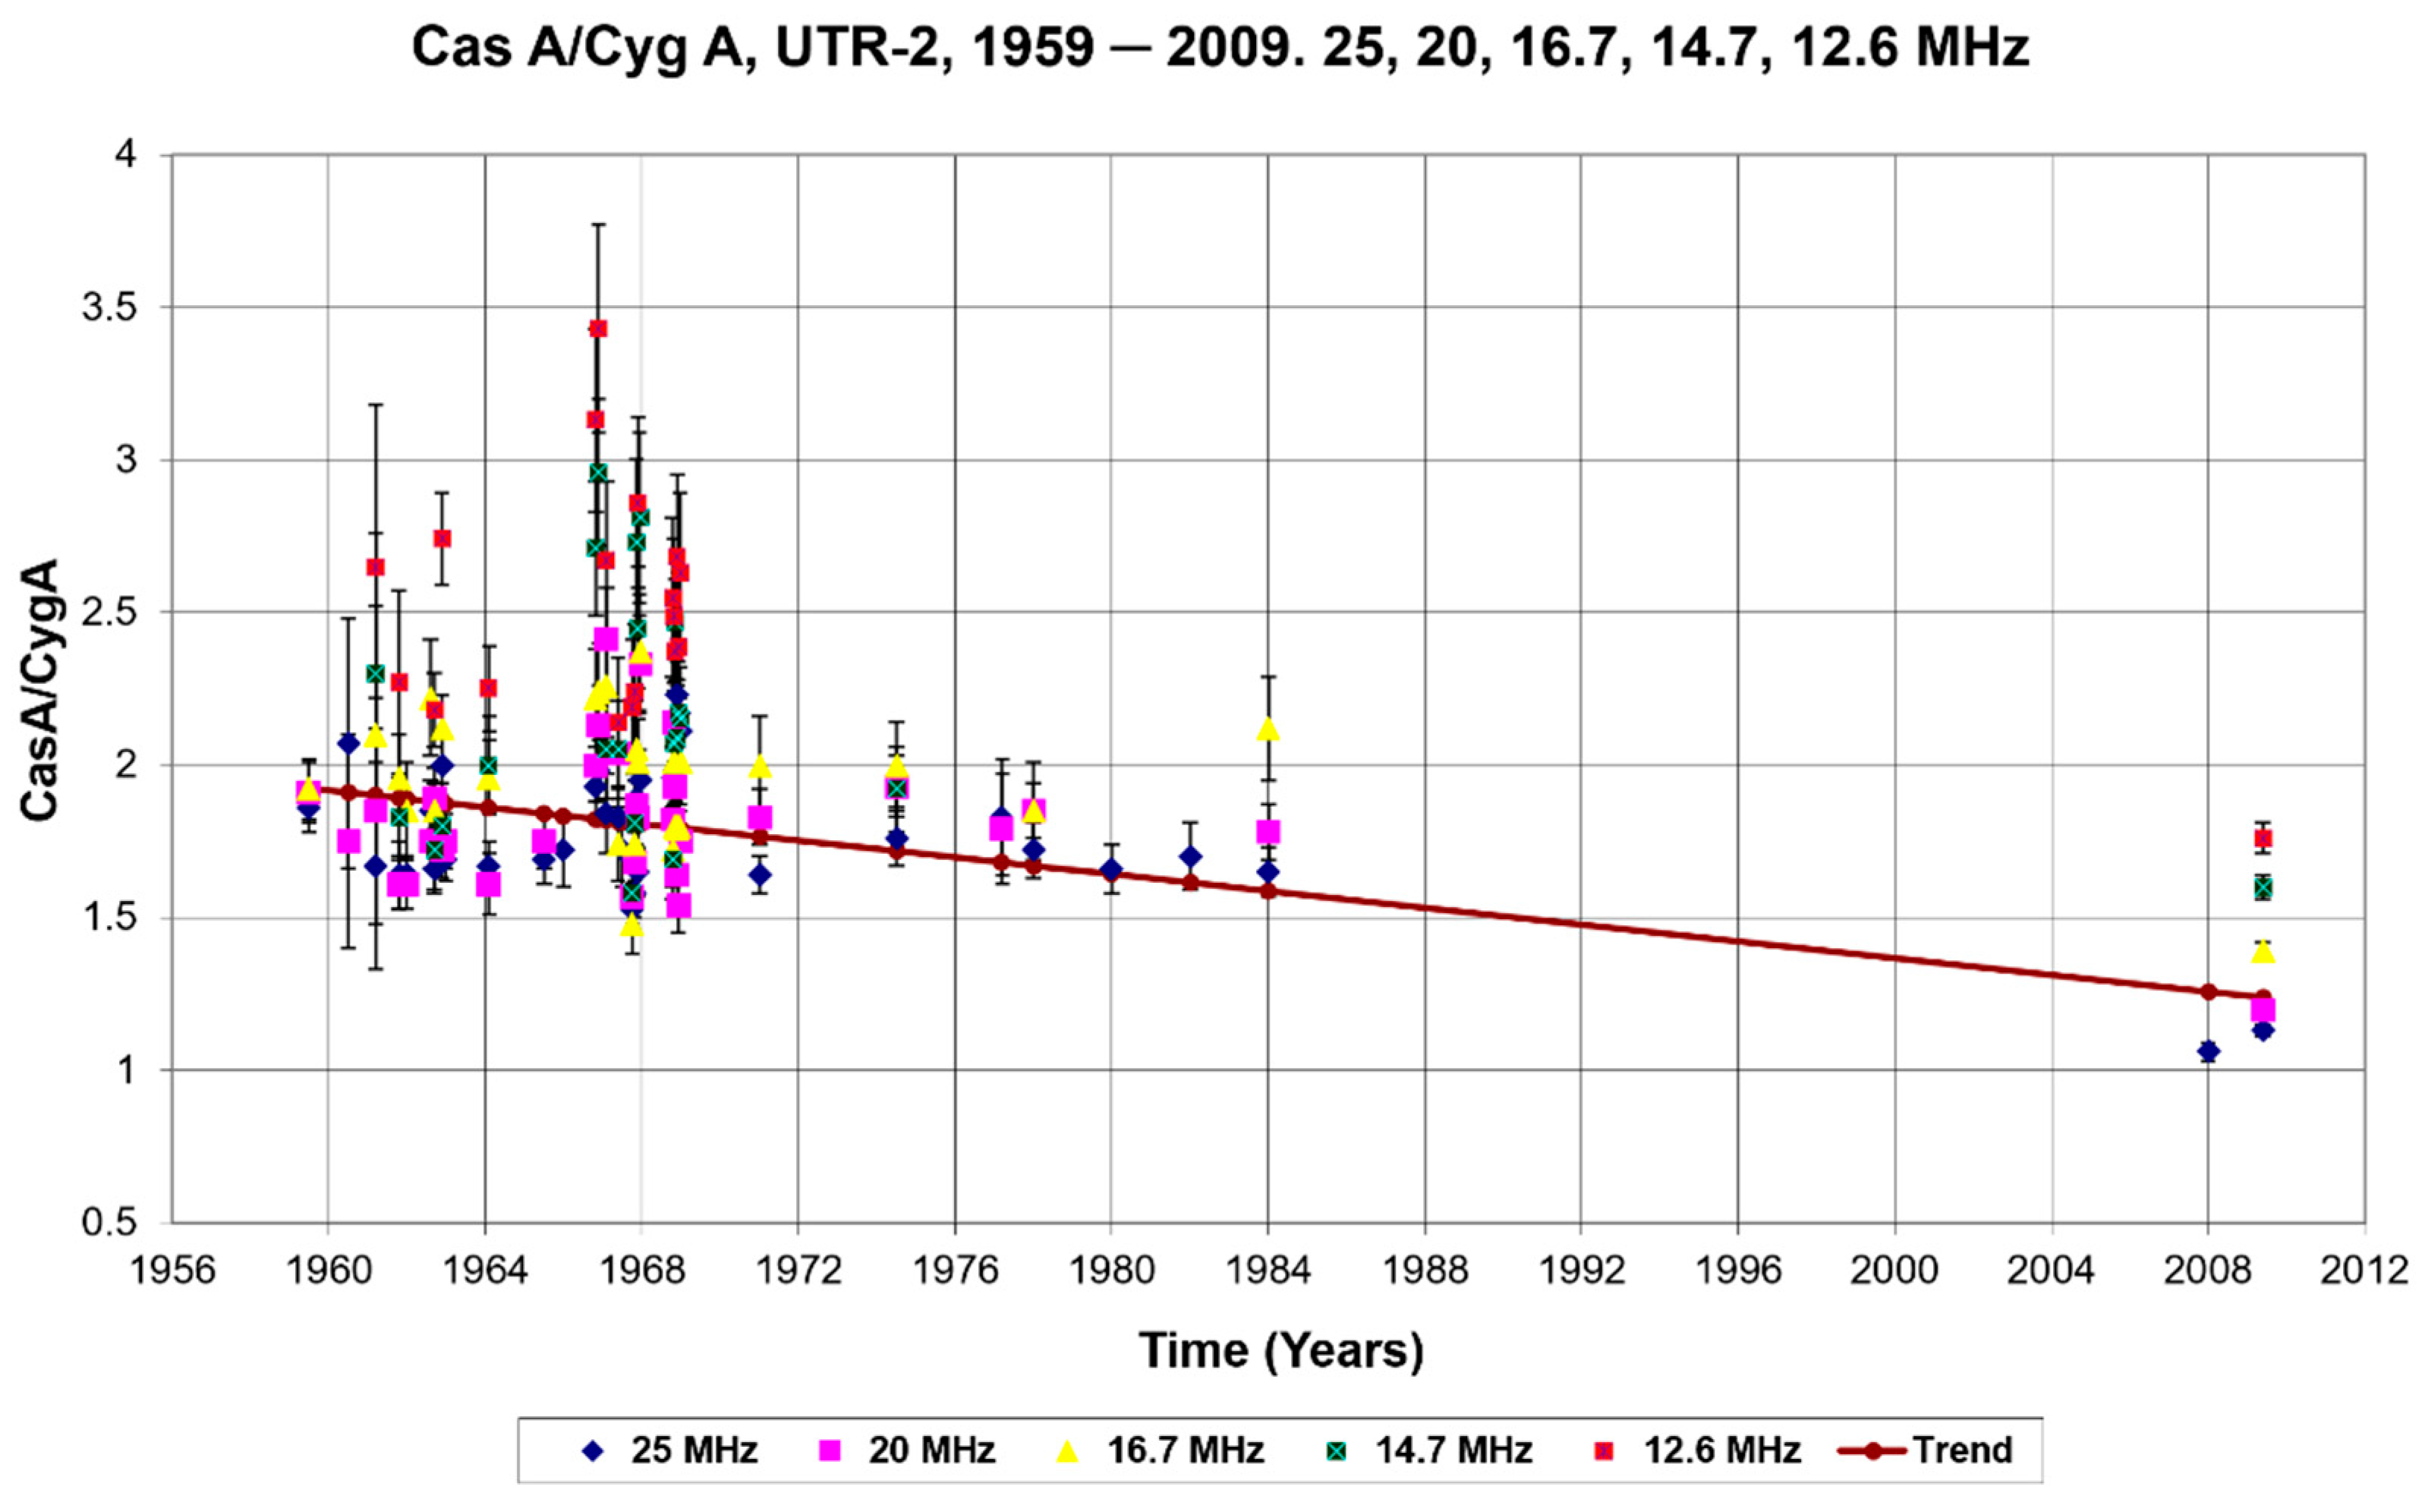
3.5. Results of the Cas A Observations in the Decameter Radio Band with the UTR-2 and GURT Radio Telescopes

In work [40], the results of fifty-year observations of Cas A radio emission at frequencies 12.6, 14.7, 16.7, 20 and 25 MHz on the UTR-2 radio telescope (one of the world’s largest T-shaped phased array with a frequency range 10–30 MHz, IRA NASU, Ukraine) have been analyzed. In the period from 1959 to 1990, observations were carried out at the same time of the year (winter period), which made it possible to exclude the influence of the seasonal–diurnal effect. During this period, the effect of secular flux decrease did not manifest itself against the background of large fluctuations in the Cas A/Cyg A flux ratio, and from 1966 to 1969 the Cas A flux even sharply and systematically increased at all five frequencies of the decameter radio range.
After the inclusion of observational data from 2009, the value of the rate of flux secular decrease according to the measurements of the Cas A/Cyg A flux ratios during one observation session in the decameter wavelength range was estimated as (0.81 ± 0.04) % per year at all investigated frequencies. Example plots of the Cas A observations (12.6, 14.7, 16.7, 20, 25 MHz) on the UTR-2 antenna are shown in Figure 1. Based on the results of measurements on sections of the GURT radio telescope (phased antenna array with the frequency range 10–80 MHz, Ukraine), the frequency of intersection of the Cas A and Cyg A spectra for the epoch 2014 was established. It is 45 ± 5 MHz. According to work [41], the intersection frequency has shifted towards lower frequencies. Returning to Figure 1, it can be seen that the trend line has a slope of the secular decrease in the Cas A flux only taking into account the points of 2009, but before that, for almost 25 years, the Cas A radio flux decreased very weakly and the trend of the secular flux decrease is very weak, and is only better visible at 25 MHz. Linear trend parameters are shown in Table 1. It should be noted here that in this example, and further in the text of the article, all approximations are performed using the least-squares method.
It should be noted that analysis of some problems for accurate observations of the Cas A source in the low-frequency radio range, associated with both ionospheric effects and the typically large antenna beamwidth (which can in some cases lead to side lobes of beam pattern, other radio sources), are considered in some detail in the work [42].

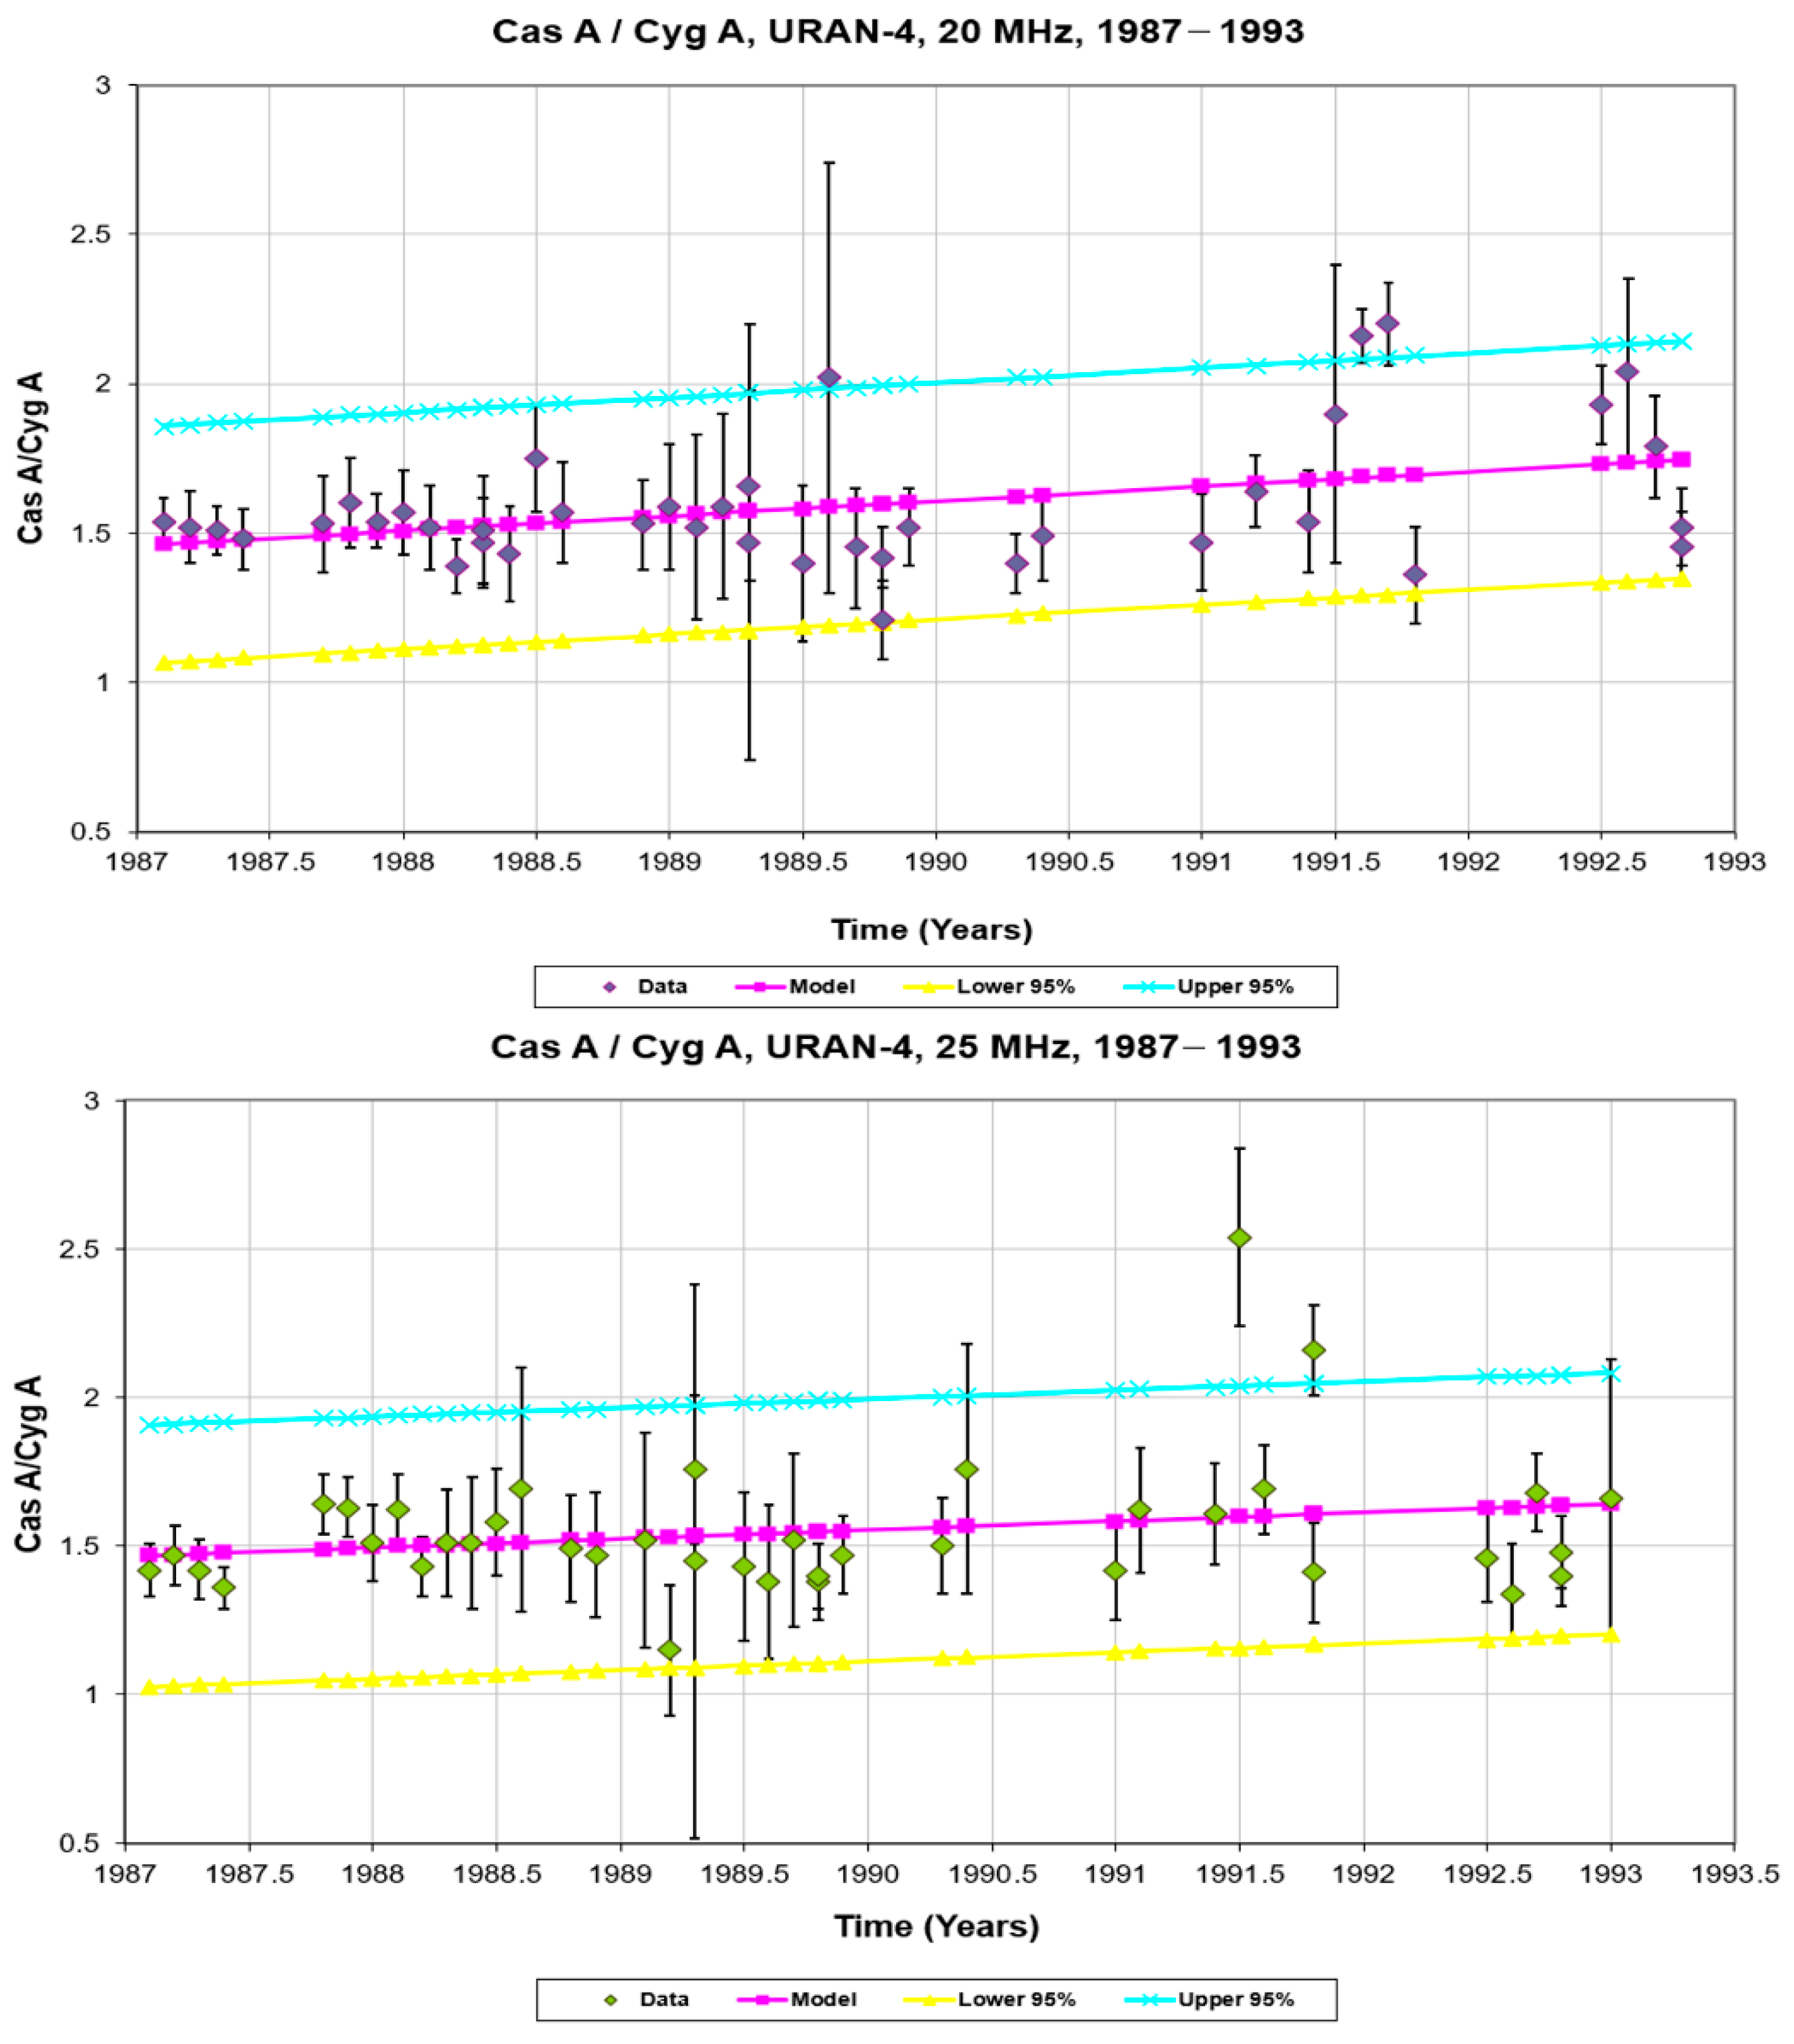
3.6. Results of Monitoring the Cas A Observations in the Decameter Radio Band with the URAN-4 Radio Telescope

At the radio telescope of the Odessa observatory URAN-4 (Institute of Radio Astronomy of the National Academy of Sciences of Ukraine (IRA NASU)), from the moment it was put into operation in 1987 and up to the present time (more than 30 years of observations), continued a program for monitoring fluxes of powerful space radio sources 3C 144 (supernova remnant Tau A), 3C 274 (radio galaxy Vir A), 3C 405 (radio galaxy Cyg A), 3C 461 (supernova remnant Cas A) [43,44]. URAN-4 is a multi-element phased antenna array, consisting from 128 antenna vibrators, placed in four rows of 32 vibrators, which are oriented along the parallel. The antenna size is 238 × 28 meters with a geometric area of approximately 7000 square meters. Antenna beamwidth at half power at 25 MHz—2.7 × 22 degrees, when working as part of the URAN interferometer, the angular resolution is approximately 2”. The antenna beam is controlled electrically by the angular coordinates U and V. The position of the antenna beam in space is changed by synchronous remote switching of delay lines in time-type phase shifters with a fixed phase center. When there is pointing to the source, the signals from the vibrators are first phased in the North–South direction, and then the West–East direction is phased. In this case, 128 beam positions are provided along the U (West–East) coordinate, and 16 beam positions along the V coordinate (North–South direction). At present, the main frequencies of monitoring observations are 20 and 25 MHz in two linear polarizations A and B (receiving of which is provided by two mutually orthogonal broadband horizontal dipoles on each column of the antenna array). The radio telescope operates both as part of the URAN low-frequency interferometer of the Radio Astronomy Institute of the National Academy of Sciences of Ukraine, and in a single mode.
During the period of use of analog recordings from 1987 to 1992, observations were carried out in separate monthly sessions of 10–12 days at frequencies 20 and 25 MHz. After use of digital recording (since 1998), observations were carried out continuously, with the exception for the time of VLBI observation sessions and technical maintenance periods. As a result of data processing, the average values of the Cas A/Cyg A flux ratios were obtained for a session or month of observations. Such an extensive observational material allows to trace in detail the presence of various factors affecting to observations of radio sources in the decameter radio range, including seasonal–diurnal effects and manifestations of solar and geomagnetic activity in terms of their influence to the ionosphere [45]. Based on the results of observation data at frequencies 20 and 25 MHz, it was found that for a correct consideration, changes in the ratio of flux densities Cas A/Cyg A are best divided into two data sets (examples in Figure 2 and Figure 3). Observational data are in Appendix A, Table A1 and Table A2. Observations from 1987 to 1993 were assigned to the first array.
The second set of measurements included data from 1998 to 2001.
The linear regression parameters for each data set at frequencies 20 and 25 MHz are shown in Table 2.
In general, the data demonstrate a very weak tendency for a decrease in the flux near the maximum of the 23-solar activity cycle (1998–2001) in the presence of strong variations determined by seasonal–diurnal effects and episodes of increased solar and geomagnetic activity. Linear regression shows that the significance of the linear trend is very low for both datasets.
Thus, as a result of the entire observation cycle, a very weak tendency towards a decrease in the Cas A/Cyg A flux ratios is almost lost against the background of presence large scatter of data.
Example of linear approximation for the entire dataset at a frequency of 20 MHz (1987 –2001) (Figure 4) shows that there is a very weak decrease in flux, at the limit of significance, but at a frequency of 25 MHz for 1987–2001, there is no flux decrease at all. The approximation parameters for 20 MHz are shown in Table 3.
The state of the ionosphere associated with seasonal–diurnal effects, as well as solar and geomagnetic activity, has a significant effect on the variations of the Cas A and Cyg A fluxes, and under the influence of external factors, fluxes change slightly different for each radio source, the Cas A and the Cyg A, which further increases the scatter of the points of the Cas A/Cyg A flux density ratio. Usually, sudden and sharp increase energy of ultraviolet and X-ray emission from the Sun at the beginning of the flare reaches the Earth and causes additional ionization of the ionospheric layers at heights about 75 km (layer D) and 110 km (layer E). This leads to the fact that the absorption of radio waves increases in the part of the Earth, illuminated by the Sun, especially in the low-frequency range. Even in the mid-latitude region, ionospheric effects have a strong influence on the receiving of signals from powerful space sources. Thus, the secular decrease of the Cas A flux at decameter wavelength is weakly manifested against the background of seasonal and diurnal factors and changes of the state of solar and geomagnetic activity. Further, an attempt was made to approximate the observational data with a trigonometric polynomial inscribed in the series of observations at frequencies of 20 and 25 MHz from 1987 to 2001. The quality of the obtained approximation turned out to be much better, an example for a frequency of 20 MHz is shown in Figure 5.
Thus, in relation to the Cas A/Cyg A fluxes, according to observations with the URAN-4 radio telescope, there could be cyclic variations with quasi-periods 3.2 and 5.6 years. Of course, the quality of the approximation is still not high and it is possible that this assumption can be better confirmed using observational data for 2020. However, the obtained values of quasi-periods at a frequency of 20 MHz turned out to be quite close to the values 3.1 and 5.1 years, obtained from long-term observations on the VLA antenna system, at a frequency of 74 MHz. It should be noted, that the quasi-period with a value of 5.5 years has long been known as the element of long-term variations in the Ap index (the Ap index reflects the daily value of the geomagnetic activity, while days with a higher level of geomagnetic activity have a higher Ap value) [46]. Quasi-period with a value of about 3 years is also episodically found in the time series of solar activity data, sizes of the regions of solar coronal holes, in variations of the total monthly number of interplanetary shocks, and so on, in many previous works about the study of short-term variability within solar cycles (for more details, for example, set out in work [47]). Thus, it is quite possible that the observed quasiperiodic variations in the Cas A/Cyg A ratio with quasi-periods about 3 and 5 years at low radio frequencies are not the result of real quasiperiodic changes in the Cas A flux, but are caused by long-term variations in the state of the ionosphere under the influence of solar and geomagnetic activity, which especially strongly affects to the observations of space radio sources in the low-frequency range. For a reliable conclusion that the quasiperiodic variations of the Cas A flux on the background of secular flux decrease trend, belong to the processes in the source itself, it is important to analyze long-term data in the centimeter and millimeter radio bands, which are much less influenced by long-term ionospheric processes.

3.7. Observations of the Cas A with Radio Telescopes of the Ventspils International Radio Astronomy Center, Latvia

Ventspils International Radio Astronomy Center operates two radio telescopes with parabolic antennas, 16 m and 32 m in diameter, as well as a low-frequency antenna array LOFAR-Latvia, located in Irbene village, Latvia. The main office is located in the Ventspils University of Applied Sciences building in Ventspils, Latvia. Antennas control and observations of space radio sources are carried out entirely in remote mode.
In the observations, we used a full power receiver (in two circular polarizations, right (RCP) and left (LCP)), cooled with liquid helium, with a backend SDR detector, which made it possible to quite accurately adjust the receiving parameters taking into account possible radio interference. Operating frequencies for both radio telescopes are 5, 6.1, 6.7, 8–8.8 GHz. Additionally, the uncooled “warm” receiver with main operating frequencies 1.3–1.7 GHz was used on the 32-m antenna. The main technique for measuring flux density on VIRAC radio telescopes, which is the same for the 16-m and 32-m antennas, is as follows. After pointing the telescope to the source and choosing observation frequency, the source is measured (TPsrc1), then the background of the sky area is measured (TPsky), then measuring background in the sky with the switched-on noise generator (calibrated noise diode) (TPcal) and control measurement of the source (TPsrc2), to reduce the influence of external noise and change the telescope elevation angle. The flux of investigated radio source in Janskies:
S j = T c a l D P F U · G ( e l ) · T P s r c a v g T P s k y T P c a l T P s k y
where D P F U = T s y s S f · T P s r c T P s k y T P s k y , T s y s = T c a l · T P s k y T P c a l T P s k y , where T c a l —noise generator signal temperature, where DPFU—receiver temperature increment per flux unit in K/Jy (gain), Tsys—system temperature in K, G(el)—curve of gain versus angle of antenna elevation, Sf—calibration radio source flux. As a result, according to formula (4), the sample points of flux density in Jansky, as well as its standard deviation, are written to the file. One measurement of the radio source flux density Sf takes about 20 s. Seven consecutive measurements at the same frequency are averaged to reduce atmospheric influences (eg light clouds) and noise. More details about the study of the 16-m VIRAC antenna, the receiving system and its parameters are described in the work [48]. Brief technical characteristics of the 16-m VIRAC radio telescope are shown in Table 4. The main observations of the Cas A radio source for this work were made on this radio telescope. The 32-m antenna has quite similar parameters to the positioning system.
In addition to the flux density measurement mode in Jansky, the telescope control software allows observations in decibels (dB), relative to a high stable noise generator signal, precisely calibrated for the used observation frequencies. Thus, a quite high time resolution is achieved, about 15 s, which was improved to 1.4 s between data samples, in January 2021. This makes it possible to record very fast variations in the flux density of space radio sources, with characteristic times about several minutes.
The observations of the radio source Cas A were carried out using the 32-m and 16-m antennas, both in the mode of “relative” observations and in the mode of flux measuring in Jansky. Observations were carried out on January 15, 16, 17, 2021, at a frequency of 8.7 GHz, showed quite high stability of the source during these days. An example is shown in Figure 6.
After removing the “outliers” points of the radio interference, analysis for check “normal distribution” of the data was performed using the modified Kolmogorov and Smirnov criteria, as well as the Cramer–Mises, Anderson–Darling, asymmetry and kurtosis criteria [49,50]. This analysis showed that the data is not normally distributed, that is, it is not purely noisy. Additionally, to reduce noise, smoothing was applied using the Savitzky–Golay filter, with the following parameters: anti-aliasing window half-width—10 points, polynomial degree—4, number of passes—3 [51]. Further, periodograms were constructed using the Lomb–Scargle method for uneven time series of the analyzed data for 15–17 January 2021, with confidence intervals showing the significance of the peaks on periodograms. As a result, analyzed data showed the presence of quasi-cyclic components with a time scale of variations ranging from about 4 min to 30 s. Figure 7 shows an example of signal spectrogram at 8.7 GHz for 16 January 2021 data in right circular polarization (RCP), with a wider spectrum of variations.
Further, for comparison, consider the series of Cas A observations, from 11 June 2020 to 19 June 2020, carried out at close frequencies 8.6 and 8.7 GHz, in the Jansky flux density measurement mode. An example of 8.6 GHz recordings is shown in Figure 8. For this example, the flux density standard deviations for left (LCP) and right (RCP) circular polarizations are shown in Table 5.
For the specified observation interval, at a frequency of 8.6 GHz, the averaged (in two circular polarizations, left and right) total Cas A flux density was 426.71 ± 10 Jy. Measurements published in 1967 at 8.25 GHz showed a flux density of 620 Jy [52]. According to work [53] calculated secular decrease in the Cas A flux density, for the 2000 epoch, the flux at 8.25 GHz should have decreased to 497 Jy. The secular flux decrease is reported as 0.55% per year at 8.25 GHz. Subsequently, observations of the Cas A and Cyg A radio sources were carried out at a frequency of 8.8 GHz on 4–5 February 2021. The average total flux of Cas A in two days turned out to be 407.12 ± 7 Jy and the average flux of Cyg A, over the same time interval, turned out to be 237.55 ± 6 Jy. Thus, at centimeter wavelength, the flux density of Cas A noticeably exceeds the flux density of the radio galaxy Cyg A, (the ratio between mean flux Cas A/Cyg A ≈ 1.71 at a frequency of 8.8 GHz) despite the presence of a systematic secular decrease in flux density. The current state of separation between the Cas A and Cyg A flux densities is shown in Figure 9. Further, the observational data (3 days) at a frequency of 6.7 GHz, obtained at VIRAC in May 2020, were analyzed. The average value of the Cas A flux density at this frequency was 460 ± 9 Jy. At a very close frequency of 6.6 GHz (measurements were made in 1965), the Cas A flux decreased from 684 Jy (1965) to 548 Jy (2000), that is, by 136 Jy in 35 years or by 0.57% per year. Taking into account the observations of 2020, at a frequency of 6.7 GHz, the Cas A flux density decreased from 548 Jy (2000) to 460 Jy (2020), that is, by 88 Jy over 20 years or by 0.8% per year (relative to measurement in 2000), which is the rate of decrease is slightly larger than earlier published data [53]. Monitoring of the Cas A and Cyg A fluxes on VIRAC radio telescopes will continue with the expansion of the frequency range and conducting measurement sessions throughout the year.
At the same time, for accurate precision measurements of the Cas A flux, the observation time interval of 10 days is very small, since the measurements can occasionally be distorted by random atmospheric or radio interference. For more accurate measurements, observations are needed in different seasons of the year and at different states of solar activity. Nevertheless, the main trend of the secular decrease in the Cas A flux density is clearly manifested. To visualize the degree of change in the Cas A radio spectrum, tabular data for the 2000 epoch were taken from the article [53]. Added to them, are results of measurements of the Cas A flux density performed in VIRAC at frequencies 6.7, 8.6 and 8.8 GHz. Next, a linear regression was performed (with 95% confidence levels), in logarithmic coordinates. This shows that the VIRAC measurements at 8.6 and 8.8 GHz are approximately at the lower 95% confidence level, while the 6.7 GHz measurement is slightly below 95% level. Thus, in general, the secular decrease in the flux of Cas A as measured in 2020 and 2021 is located near the statistical boundaries, without an anomalous decrease, but nevertheless, the drop in flux over 20 years turned out to be notable, which is shown by the graph of residuals (Figure 10) after subtracting the linear trend (residuals are recalculated in Jy taking into account that l o g 10 x = b ,   x = 10 b ). Linear regression parameters are shown in Table 6.
In the graph shown in Figure 10, it can be seen that for 2020—2021, the Cas A flux density at frequencies around 7 and 8 GHz has noticeably decreased.
For greater clarity, we have placed on one plot (Figure 11), spectra of the Cas A source from literature (combined and described in the article [17]), for different observation epochs—1965, 2000, 2015 plus observation points obtained in VIRAC. We also added the spectrum of the radio galaxy Cyg A [30], in order to see the ratio of Cas A and Cyg A flux densities for different observation epochs (because the flux of the radio source Cyg A practically does not change over time for many years and in a wide frequency range, it is very stable). The second intersection spectra of the Cas A and Cyg A sources occurs at a frequency of about 1 GHz. This is due to the secular decrease in the Cas A flux, because in 1965 the Cas A flux was higher than the Cyg A flux, and the entire radio spectrum of Cyg A was below the Cas A radio spectrum. Over time, the Cas A flux decreased and the spectrum “dropped” relatively stable spectrum of Cyg A, which led to a double intersection of the convex part of the radio spectrum of Cyg A, at two points.
One of the possible reasons for the frequency dependence in secular decrease of the Cas A flux, is the presence of two electron populations. If a supernova remnant has multiple electron populations, one or the other may dominate radio emission earlier than at later times. The Cas A is a young radio source with a moderately steep radio spectrum. This means that it can be a transition period between phases, when both electron populations make a significant contribution to the radio spectrum, but they decrease in different ways, as a result, the spectrum changes over time differently. Adiabatic cooling and weakening of the magnetic field due to expansion are the most important processes that change the emissivity of old electron populations, but they do not significantly change spectral index. The spectral index can change markedly with a new acceleration of electrons, which have different power-law distribution, if there are two different electron populations with different spectral indices, this can provide different parameters of the secular flux decrease at different frequencies. However, this is a tedious task to verify, since it is necessary to spatially identify regions with different spectral indices and measure the flux decrease in these regions. In practice, this will require long-term mapping of the Cas A source with high accuracy of flux density measurements [54].
In previous works, it was noted that, in addition to the secular flux decrease in the radio range, the Cas A demonstrated the presence of variations on different time scales. However, episodic observations did not allow obtaining a general picture of their origin. Long-term measurements, in particular at high frequencies, show that there are significant variations in the flux density of Cas A. The radio brightness of individual elements in the extended structure of Cas A changes slowly with time, and also the variability of spectral indices (according to VLBI data) in different regions of the remnant was found, where shock waves propagate. There are also more stable sections of a bright radio ring, which are discussed in the works [55,56]. In general, such changes are quite slow and can be noticeable in the radio range on long time scales for about a year or more. As for the fast-flux density variations associated with physical processes occurring in the Cas A remnant itself, repeated searches for them did not provide unambiguous information about the presence or absence of sources of these variations. For example, the search for pulsations in radio flux from an X-ray point source in the central region of Cas A, at frequencies 327 MHz and 1.43 GHz, did not give a positive result, but an upper limit 30 and 1.3 mJy at 327 MHz and 1.43 GHz is assumed for the phase-averaged flux density pulses [57].
According to observations made at VIRAC, weak flux density variations were present during one week of observations. To estimate the characteristic times and features of these variations (cyclical or irregular), periodograms were constructed for irregular time series. An example is shown in Figure 12.
In the considered series of observations, only records for two days, 11 and 17 June 2020, showed the possible presence of quasiperiodic variations, since the maxima on periodograms exceeded the confidence interval 99% of probability that the found peaks of the periodogram will be significant. The characteristic time of variations in both days was about 44 min. The rest of the days showed a typical noise shape of the spectra with the absence of significant regular variations in flux density.
Thus, observations at frequencies above 8 GHz showed the presence of high stability of the radio source Cas A, in general, and episodical presence of small (about 8–10% or less, deviations from the mean) and short-term rapid variations in the flux density, which are clearly not associated with the noise radio interference and possibly ionospheric effects, since the influence of ionosphere causing signal variations known as “ionospheric scintillations” diminishes rapidly at frequencies higher than 1.6 GHz and practically nonexistent at frequencies above 8 GHz, in the middle latitudes. The main possible explanation for the observed variations in the Cas A flux density is the refractive variability of radio emission at large solar wind irregularities. However, Cas A also has its own source variability in the X-ray range, but in the radio range, its own variability has not yet been found in the integral flux the Cas A, and this is a quite long variability on time scales about several months [58]. In work [59] a large series of data from different measurements of the Cas A flux density by different authors is analyzed and it is shown that the radio spectrum of the Cas A is aligned with increasing frequency. It is most likely that significant nonlinear effects in particle acceleration occur in the Cas A. Possible contribution of the refractive variability is supported by the fact of presence variability components with quasi-periods about 30–40 min in parameters of the solar wind, for example, in the density and pressure of the solar corpuscular flow [60].

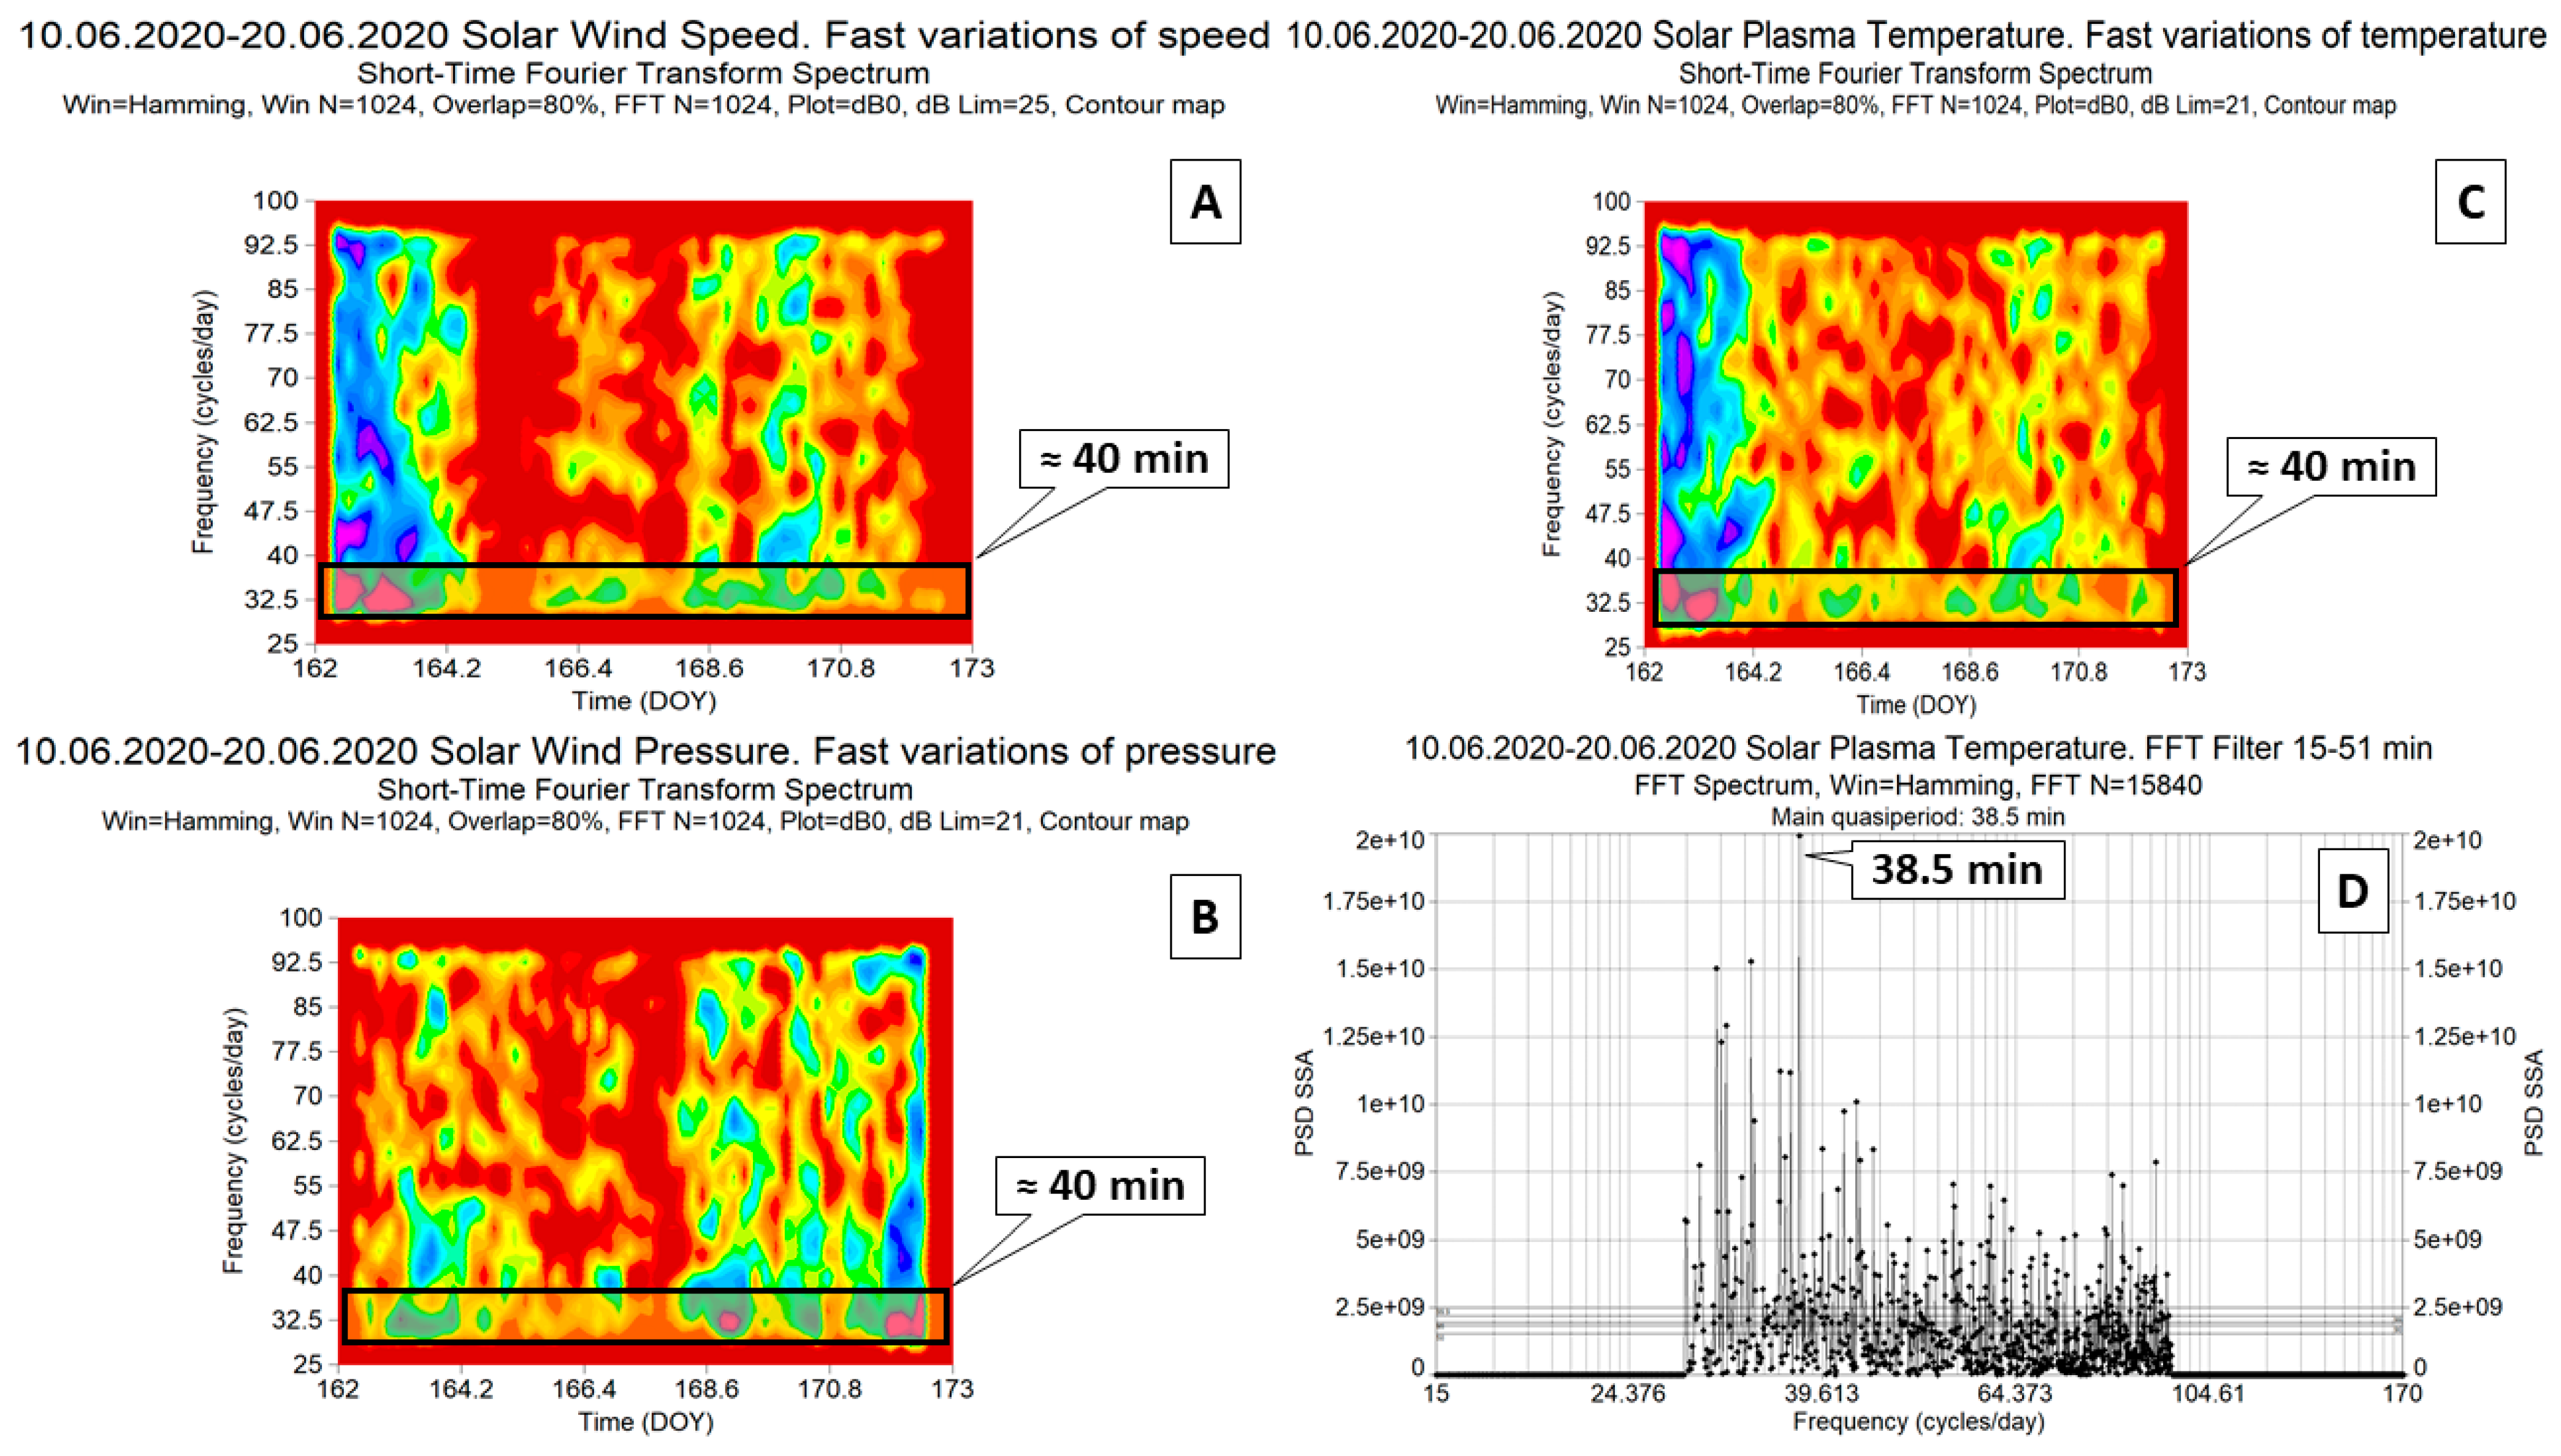
3.8. Comparison of Solar Wind Variations with Radio Observations of the Cas A

To check the possible effect of the influence of solar wind irregularities on the Cas A variations in the radio range, additional data on the solar wind parameters were analyzed, which were taken from the data catalog NASA OmniWeb (https://omniweb.gsfc.nasa.gov/ (accessed on 15 April 2021)). For this study, the time series of variations of the following parameters were taken: plasma flow temperature, solar wind pressure, solar wind speed, proton density, with a time resolution of 1 min, for the time interval from June 10, 2020 to June 20, 2020, that is, overlapping the time of radio observations Cas A in VIRAC. The data was cleared of outliers and then smoothed and interpolated with a cubic smoothing spline, which effectively eliminated noise and prepared the data for FFT bandpass filtering (to extract a short-period part of the data). Then, was using FFT bandpass filtering (with a Hamming spectral window, which has low edge distortion, to isolate weak low-amplitude components in the data) [61] the trend, long-term component of variability in the data of the solar wind parameters at indicated time interval was removed, and noise component of data was also removed. This is done because longer variations in solar wind parameters suppress fast and low-amplitude variations in digital spectra. An example of spectrograms built with a Hamming spectral window for data, filtered in a periods band 15–51 min, is shown in Figure 13.
As a result, it was found that on 10–20 June, in the variations of the solar wind parameters, quasiperiodic, unevenly spaced oscillations, with characteristic times of about 40 min, were manifested. The Cas A radio data at 8.6 GHz also has had weak cycling with a characteristic time of about 40 min. Thus, it can be assumed that the recorded variations in the Cas A flux density were associated either with disturbances in the solar wind passing through the line of sight to this radio source, or with disturbances in the ionosphere caused by the solar wind. In favor of this assumption, there were weak coronal mass ejections (CMEs) on 12–19 June 2020, according to the catalog of CME (SOHO/LASCO https://cdaw.gsfc.nasa.gov/CME_list/UNIVERSAL/2020_06/univ2020_06.html (accessed on 16 April 2021)) which could cause observed disturbances in the solar wind with the appearance of variations close to cyclical.
Of course, fast variations on the time scales from several minutes to several tens of minutes are clearly from the external origin, not related to the radio source itself. The influence of the solar wind on the propagation of radio emission at frequencies from 5 GHz to 8 GHz and higher, has been shown in many works about studies of interplanetary scintillations of space radio sources in the centimeter radio range, for example [62]. However, the variations, that were in our observations of the Cas A source, of course, much slower than interplanetary scintillations, which have characteristic times about 1 s. A similar effect was observed earlier, as, for example, described in the work [63] where it is shown that the observed long-term (compared to interplanetary scintillations) variations in radio emission (fluctuations with timescales from several minutes to tens of minutes) in the cosmic source radiointensity episodically registered during many sessions of radio astronomical observations) often has a non-ionospheric origin and is associated with large-scale disturbances in the solar wind and large plasma irregularities, on which the radio emission from cosmic sources is refracted. However, the measurements described were made at much lower frequencies of the meter radio range. Currently, there are still quite a few high-frequency observations of Cas A in the centimeter ranges with good time resolution. Therefore, for more reasoned conclusions, not only longer-term observations of Cas A with a high temporal resolution are necessary, but also a direct comparison with the parameters of the solar wind and geomagnetic activity, at the time intervals of radio observations.

3.9. Stability of the Radio Galaxy Cyg A in the Decameter Radio Band

The Cyg A radio galaxy (3C 405) is an important calibration source and is almost always used for observations of the Cas A in radio range. The multi-frequency radio spectrum of the Cyg A galaxy is almost always used as a reference to compare the secular decrease in the Cas A flux density. This is due to the fact that the flux density of the Cyg A radio galaxy remains practically unchanged over the entire observation time interval, in the radio range. Long-term observations of the Cyg A source at many radio frequencies of the decimeter, centimeter, and even millimeter bands, carried out at many observatories, have shown an almost complete absence of its own long-term variability of this object. The results of such studies can be seen, for example, in the work [64]. High-precision interferometric observations of Cyg A at a frequency of 90 GHz showed an upper limit for the variability of source core at the level <10% on a timescale from 10 months to 10 years [65]. However, it is well known that 3C 405 (Cyg A) is an important radio source for studying ionospheric scintillations (rapid variations in flux density due to scintillations of radio signal on ionospheric plasma irregularities) as well as interplanetary scintillations (weak variations in flux density with characteristic times about 1 s, on solar wind irregularities) in meter and decameter wavelength range [66].
In addition, at low radio frequencies, especially in the 10–30 MHz range, the Cyg A flux density is subject to significant distortions, associated with a change in the state of the ionosphere as a result of solar and geomagnetic activity, during the development of individual solar activity cycles. Therefore, despite the fact that, according to a long tradition, in low-frequency radio observations, the Cyg A source is used as a comparison source in the study of long-term changes in the Cas A flux density, its flux variations, as a response to manifestations of ionospheric disturbances, are quite large. For example, results of long-term observations of the Cyg A radio galaxy on the URAN-4 phased array antenna (IRA NASU) at frequencies 20 and 25 MHz and changes in the power spectra in different seasons and different phases of solar activity are shown in the work [67]. An example of a long-term change in the flux density of the Cyg A source at a frequency of 25 MHz is shown in Figure 14. The flux minimum between 2001 and 2002 corresponds to the maximum of the monthly mean values of the Wolf number in 2001. It is already known that, during the period of increased solar activity, the absorption in the ionosphere at decameter waves slowly increases, leading to a systematic decrease in the flux density with the development of the solar cycle activity, which can be seen in the plot (Figure 14) (observational data are in Appendix A, Table A3).
The parameters of polynomial approximation for the plot of long-term flux variation of the radio galaxy Cyg A at a frequency of 25 MHz are given in Table 7.
Observations of the Cyg A radio galaxy carried out on the VIRAC (Latvia) antennas at frequencies 6.7 and 8.8 GHz showed the absence any variability of the flux, on time scales more than 10 min, during individual days. For example, the flux density record (in decibels dB, relative to the noise generator signal) of the Cyg A source at 6.7 GHz, obtained on 16 July 2020, is shown in Figure 15.
Thus, in the centimeter radio range, for single parabolic antennas, the Cyg A radio galaxy is a constant source, that retains its high stability for many years, and possible episodic occurrences of fast and weak flux density variations are most likely caused by the influence of the radio emission propagation environment (effects associated with the ionosphere and solar wind) and do not relate to the source’s own variability.

4. Discussion

The analysis of the accumulated absolute and relative flux density measurements of the supernova remnant Cas A, obtained in different ranges of the radio spectrum, provides a variety of information about the secular decrease rates at different frequencies and at different times. Investigation of the secular decrease of radio flux from the supernova remnant Cas A in the entire range of radio spectrum is an effective method for revealing the effects of its evolution. At the same time, in addition to trend changes of the flux, periodic variations are also manifested, which were most noticeable at meter wavelengths. In the range of decameter wavelengths, the secular flux decrease is not so noticeable. Its strongest variations are associated with the influence of seasonal and diurnal factors and episodes of solar and geomagnetic activity on the state of the ionosphere. Of particular importance are data on the nature of changes in the rate of secular flux decrease as a function of frequency in the radio range. Specific features of the Cas A flux variation at decameter wavelengths can also presumably be associated with the influence of a point component in the remnant, discovered by the Chandra space X-ray observatory, which is not visible in the radio range, as well as with the evolution of the remnant itself. It is fundamentally important that Cas A belongs to a certain type of supernova remnant. According to the existing classification, there can be three such basic types [68]: shell, plerions and combined supernova remnants. Shell remnants are characterized by a dense hot shell that appears as an annular structure with a sharp outer border. Plerions have an amorphous structure, the emission is concentrated towards the center of supernova remnants. Combined supernova remnants can look like shells or plerions depending on the range of emission in which the observations are made. According to data in different ranges of the electromagnetic spectrum, the Cas A images contain various structural formations, such as condensations and filaments, resulting from a supernova explosion, as well as survived structural formations that arisen at the presupernova stage, including jets [69]. All of them make a certain contribution to changes in the Cas A flux over time. The principal moment was the discovery by Chandra of a whole class of supernova remnants containing in the center a compact object formed after a supernova explosion. Among them, the neutron star at the center of Cas A may provide a certain contribution to radio emission, especially in the low-frequency radio range. Until now, this radio emission has not been detected, but this does not exclude the possibility of their episodic manifestation in the future [70].
Thus, the diversity of the frequency dependence of the secular decrease in the supernova remnant flux Cas A may indicate that it belongs to the class of combined remnants. By the nature of the secular decrease in the flux at high frequencies, the properties of a shell remnant are manifested in it. A weak secular decrease at low frequencies, a presence of periodic changes in the flux, and the possible existence of a neutron star in the center of the Cas A demonstrate properties of a plerion. The tendency of secular flux decrease indicates the gradual deceleration of the supernova remnant expansion due to the interaction with the surrounding interstellar medium. In the future, this trend is likely to intensify. It should be noted that, at low radio frequencies, the Cyg A flux is also subject to changes under influence of the ionosphere state. This fact casts doubt on its correct use as a comparison source for determining the secular decrease in the Cas A flux in the decameter radio band. Summarizing the above information, it can be noted that in the decimeter, centimeter and millimeter radio bands, the uneven secular decrease of the Cas A flux is influenced by the evolution of many radio-bright regions in the supernova remnant shell, which introduces some variations in the integral radio flux of the source, and the frequency-dependent nature of the flux decrease shows the possible acceleration of particles in the supernova remnant, and also the influence of some types of instabilities, as well as the possible contribution of several populations of electrons. All of this supports the interest in intensive observations of the Cas A radio source, because new observations allow researchers to correct and refine the existing theoretical models of the Cas A evolution in radio and other higher-frequency ranges.

5. Conclusions

Taking into account all the above information, observations of the unique object Cas A take on a special perspective, since they will reveal previously unknown factors characterizing the features of its secular flux decrease, thereby refining the theory of this process. The previous observations of Cas A were carried out at different frequencies and different epochs, which makes it difficult to separate the intrinsic flux changes from the effects of state radio emission propagation medium (ionosphere and solar wind).
In this work, the following main results were obtained:
Analysis of long-term (1987–1993 and 1998–2001) averaged data of the Cas A/Cyg A flux ratio, performed at frequencies 20 and 25 MHz, showed the near-absence of explicit linear trend of secular decrease in the Cas A flux. This is probably due to the strong influence (in decameter radio band) on the fluxes of radio sources Cas A and Cyg A, seasonal–diurnal effects and solar-geomagnetic activity, against the background of which the secular decrease in the flux of Cas A is hardly distinguishable.
The presence of cyclic variations in the Cas A/Cyg A flux ratio at frequencies 20 and 25 MHz is possible. Approximation of these data with a sinusoidal wave showed the presence of two cycles, 3.2 and 5.6 years, which is very close to some values of quasi-periods (3.1 and 5.1 years) obtained from long-term measurements on the VLA antenna system at a frequency of 74 MHz.
Measurements of the Cas A flux density performed at frequencies 6.7, 8.6, 8.8 GHz on the VIRAC radio telescopes (Latvia) showed that the secular decrease the Cas A flux density is quite close to the results of earlier observations at frequencies around 8 GHz, but at 6.7 GHz, the secular flux decrease was slightly larger than at the 2000 epoch. The secular flux density decrease rate according to measurements in 2020 and 2021 turned out to be ≈0.8% per year (6.7 GHz) relative to data at 2000 epoch at 6.6 GHz, and ≈0.5% per year (8.6 Ghz), ≈0.6% per year (8.8 GHz) relatively linear approximation of the radio spectrum 2000 (for epoch 2000, the secular flux decrease rate at 8.25 GHz was 0.55% per year).
Comparison of episodic low-amplitude variations in the Cas A flux at a frequency of 8.6 GHz and variations in solar wind parameters over one observation time interval, showed the presence of significant variations with a characteristic time of about 40 min, both in the radio data and in the data on solar wind parameters (from the NASA OmniWeb catalog). This can be caused, in particular, by the refraction of radio emission at large solar wind irregularities, since there were several weak coronal mass ejections in the observation time interval. A similar effect of slow flux variations with a characteristic time of several tens of minutes was noted earlier in other works, but based on observations in the meter radio range.
A program for coordinated regular observations of the powerful radio sources Cas A and Cyg A in various radio bands is planned, including the 32-m and 16-m radio telescopes, as well as LOFAR—Latvia of Ventspils International Radio Astronomy Center (Latvia) and low-frequency radio telescopes UTR-2, GURT, URAN-4 of The Institute of Radio Astronomy (Ukraine) (in the cities Kharkov and Odessa). Quasi-simultaneous observations in different radio bands will make it possible to obtain data on changes in flux density and spectral index at the same time. Thus, it will be possible to separate the intrinsic changes in the Cas A flux from the effect of changes in the state of space weather on it.

Author Contributions

A.G. prepared a review of the literature and the results of studies the Cassiopeia A secular flux density decrease, and also processed observational data from a phased antenna array URAN-4. A.S. wrote a section about observations of Cassiopeia A on VIRAC antennas in Latvia, processed and analyzed observation data in the centimeter radio range, and also prepared some images for article. M.R. was checked and supplemented, improved the text of the article. V.B. performed observations of the Cassiopeia A radio source on VIRAC radio telescopes. A.O. provided wrote of control scripts for VIRAC radio telescopes and scripts of control parameters of receivers. All authors have read and agreed to the published version of the manuscript.

Funding

The contribution of Artem Sukharev has been funded by ERDF postdoctoral grant No. 1.1.1.2/VIAA/2/18/363 ‘Investigation of intra-day and inter-day variability of various types of extragalactic radio sources using telescopes of the Ventspils International Radio Astronomy Centre (RISE)’. Project is being implemented in Ventspils University of Applied Sciences.

Institutional Review Board Statement

Not applicable.

Informed Consent Statement

Not applicable.

Data Availability Statement

The study did not report any data which could have been shown by external links.

Acknowledgments

The authors are grateful to the VIRAC engineering team, that provided operation of radio telescopes and helped to get the observational data for this article. We also thank anonymous reviewers for advice and provided very constructive help. The contributions of Michail Ryabov and Vladislavs Bezrukovs were supported by the Latvian Council of Science project “Joint Latvian-Ukrainian study of peculiar radio galaxy” Perseus A “in radio and optical bands. Nr: lzp-2020 / 2-0121”. Project is being implemented in Ventspils University of Applied Sciences.

Conflicts of Interest

The authors declare no conflict of interest.

Appendix A

Table A1. Table of the Cas A decameter observation data obtained in a phased antenna array URAN-4 at frequencies 20 and 25 MHz, for the period 1987–1993.
Time, YearsCasA/CygA, 20 MHzStd.Err. (20 MHz)Time, YearsCasA/CygA, 25 MHzStd.Err. (25 MHz)
1987.11.540.081987.11.420.09
1987.21.520.121987.21.470.10
1987.31.510.081987.31.420.10
1987.41.480.101987.41.360.07
1987.71.530.161987.81.640.10
1987.81.600.151987.91.630.10
1987.91.540.091988.01.510.13
1988.01.570.141988.11.620.12
1988.11.520.141988.21.430.10
1988.21.390.091988.31.510.18
1988.31.470.151988.41.510.22
1988.31.510.181988.51.580.18
1988.41.430.161988.61.690.41
1988.51.750.181988.81.490.18
1988.61.570.171988.91.470.21
1988.91.530.151989.11.520.36
1989.01.590.211989.21.150.22
1989.11.520.311989.31.760.93
1989.21.590.311989.31.450.25
1989.31.660.731989.51.430.25
1989.31.470.321989.61.380.26
1989.51.400.261989.71.520.29
1989.62.020.721989.81.400.13
1989.71.450.201989.81.380.11
1989.81.210.131989.91.470.13
1989.81.420.101990.31.500.16
1989.91.520.131990.41.760.42
1990.31.400.101991.01.420.17
1990.41.490.151991.11.620.21
1991.01.470.161991.41.610.17
1991.21.640.121991.52.540.30
1991.41.540.171991.61.690.15
1991.51.900.501991.82.160.17
1991.62.160.091991.81.410.15
1991.72.200.141992.51.460.15
1991.81.360.161992.61.340.17
1992.51.930.131992.71.680.13
1992.62.040.311992.81.400.10
1992.71.790.171992.81.480.12
1992.81.450.121993.01.660.47
1992.81.520.13---------------------
Table A2. Table of the Cas A decameter observation data obtained in a phased antenna array URAN-4 at frequencies 20 and 25 MHz, for the period 1998–2001.
Time, YearsCasA/CygA, 20 MHzStd.Err. (20 MHz)Time, YearsCasA/CygA, 25 MHzStd.Err. (25 MHz)
1998.61.750.051998.82.220.07
1998.71.840.171998.81.900.17
1998.92.410.421998.91.720.18
1998.93.150.901998.91.720.31
1999.11.680.131999.12.020.21
1999.11.450.191999.11.410.17
1999.11.670.151999.11.550.15
1999.21.710.131999.21.750.09
1999.21.820.141999.21.750.12
1999.31.570.081999.31.570.10
1999.31.600.081999.31.680.07
1999.31.660.091999.31.790.21
1999.41.510.181999.41.550.19
1999.41.360.181999.41.330.19
1999.41.000.211999.41.000.21
1999.51.330.101999.51.110.03
1999.71.100.101999.71.220.14
1999.71.090.041999.81.060.08
1999.81.240.061999.81.090.08
1999.81.410.051999.91.250.01
1999.80.980.112000.01.470.18
2000.01.650.152000.10.950.14
2000.11.010.062000.11.100.24
2000.10.890.232000.51.230.15
2000.20.790.012000.61.070.15
2000.51.120.212001.01.850.18
2000.61.190.212001.11.800.23
2001.01.000.122001.12.550.49
2001.11.910.102001.11.650.16
2001.11.580.252001.22.230.51
2001.12.240.242001.21.570.27
2001.21.400.392001.31.130.16
2001.21.690.212001.31.300.16
2001.31.450.17---------------------
2001.31.670.38---------------------
Table A3. Table of the Cyg A decameter observation data obtained in a phased antenna array URAN-4 at the frequency 25 MHz, for the period 1998–2005.
Time, YearsIntensity (25 MHz)Std.Err.+Std.Err.–Time, YearsIntensity (25 MHz)Std.Err.+Std.Err.–
1998.6860.680.010.082002.6190.560.020.14
1999.0851.570.140.382002.6470.960.020.12
1999.1621.310.010.122002.6660.770.020.15
1999.1901.340.020.152002.6781.360.050.23
1999.2151.300.010.092002.6931.410.050.21
1999.2321.250.010.112002.7081.140.100.31
1999.2751.360.020.122002.7231.090.050.23
1999.2931.500.030.172003.5031.390.010.11
1999.3081.370.000.062003.5381.230.030.18
1999.3271.270.020.132003.5951.260.050.22
1999.3561.280.020.132003.6120.900.070.27
1999.3751.070.030.162003.6371.160.050.23
1999.3971.160.020.122003.7011.560.210.45
1999.4301.000.020.132003.7471.400.020.13
1999.4891.160.120.342003.7821.470.010.07
1999.6791.130.010.112003.8121.440.050.22
2000.5191.080.040.212003.8451.430.000.07
2001.2210.850.010.072003.8921.490.010.09
2001.2440.820.000.052003.9100.750.180.42
2001.2550.870.000.062003.9961.290.020.14
2001.2880.890.010.072004.0071.420.010.10
2001.3790.890.000.042004.0251.120.120.35
2001.4520.850.070.262004.0711.380.020.16
2001.4770.900.010.082004.0901.440.020.13
2001.5040.760.020.142004.1171.410.010.12
2001.5340.770.010.112004.1671.320.100.31
2001.5490.840.000.052004.1971.390.020.12
2001.5620.820.060.252004.2351.480.010.08
2001.5860.710.010.122004.2661.130.110.33
2001.6580.800.010.122004.2841.330.030.16
2001.7360.820.010.092004.3111.200.070.26
2002.1821.150.040.212004.3551.550.020.13
2002.1961.090.040.212004.3991.540.010.12
2002.2811.080.010.082004.4361.480.020.13
2002.3101.320.010.092004.4691.510.070.26
2002.3510.520.000.052004.5031.420.030.18
2002.3750.370.010.072004.5251.710.560.75
2002.4141.060.050.232004.5521.660.070.26
2002.4400.920.060.252004.7341.480.060.24
2002.4661.160.030.192004.8701.460.020.14
2002.4891.060.050.212004.8831.310.020.13
2002.5550.920.040.202004.8931.390.010.09
2002.5671.020.020.122004.9331.330.090.30
2002.5890.870.050.22----------------------------

References

  1. Shklovsky, I.S. Possible secular variation of the flux and intensity of radio emission from some discrete sources. Astron. J. 1960, 37, 256–264. [Google Scholar]
  2. Lamden, R.J.; Lovell, A.C.B. The low-frequency spectrum of Cygnus A and Cassiopeia A. In Radio Astronomy, Proceedings of the 4th IAU Symposium, International Astronomical Union, Macclesfield, UK, 25–27 August 1955; Symposium No., 4; Van de Hulst, H.C., Ed.; Cambridge University Press: Cambridge, UK, 1957; p. 145. [Google Scholar]
  3. Erickson, W.C.; Perley, R.A. An anomaly in the flux of Cassiopeia A at 38 MHz. Astrophys. J. 1975, 200 Pt 2, L83–L87. [Google Scholar] [CrossRef]
  4. Bridle, A.H. Flux densities of Cassiopeia A and Cygnus A at 10.05 MHz. Observatory 1967, 87, 60–63. [Google Scholar]
  5. Tuffs, R.J. The Expansion of Cassiopeia A. In Supernova Remnants and their X-ray Emission, Proceedings of the International Astronomical Union Symposium No. 101, Venice, Italy, 30 August–2 September 1982; Springer: Heidelberg, Germany, 1983; Volume 101, pp. 49–54. [Google Scholar]
  6. Helmboldt, J.F.; Kassim, N.E. The evolution of Cassiopeia A at low radio frequencies. Astron. J. 2009, 138, 838. [Google Scholar] [CrossRef] [Green Version]
  7. Högbom, J.A.; Shakeshaft, J.R. Secular variations of the flux density of the radio source Cassiopeia A. Nature 1961, 189, 561–562. [Google Scholar] [CrossRef]
  8. De Gasperin, F.; Vink, J.; McKean, J.P.; Asgekar, A.; Avruch, I.; Bentum, M.J.; Blaauw, R.; Bonafede, A.; Broderick, J.W.; Brüggen, M.; et al. Cassiopeia A, Cygnus A, Taurus A, and Virgo A at ultra-low radio frequencies. Astron. Astrophys. 2020, 635, A150. [Google Scholar] [CrossRef]
  9. Tananbaum, H. Cassiopeia A. Int. Astron. Union Circ. 1999, 7246, 1. [Google Scholar]
  10. VanderPlas, J.T. Understanding the Lomb–Scargle Periodogram. Astrophys. J. Suppl. Ser. 2018, 236, 16. [Google Scholar] [CrossRef]
  11. Jacobsen, E.; Lyons, R. The sliding DFT. IEEE Signal Process. Mag. 2003, 20, 74–80. [Google Scholar]
  12. Christian, H. Reinsch. Smoothing by Spline Functions. Numer. Math. 1967, 10, 177–183. [Google Scholar]
  13. Chernov, I.A. Interpretation of the Sedov solution as a series of intermediate asymptotics in the flow from a strong explosion. Izvestiya VUZ. Appl. Nonlinear Dyn. 2010, 18, 33. [Google Scholar]
  14. McKee, C.F. X-ray emission drom an inward-propagating shock in young supernova remnants. Astrophys. J. 1974, 188, 335–339. [Google Scholar] [CrossRef]
  15. Jones, T.W.; Rudnick, L.; Jun, B.I.; Borkowski, K.J.; Dubner, G.; Frail, D.A.; Kang, H.; Kassim, N.E.; McCray, R. 1051 Ergs: The Evolution of Shell Supernova Remnants. Publ. Astron. Soc. Pac. 1998, 110, 125–151. [Google Scholar] [CrossRef] [Green Version]
  16. Vinyaykin, E.N. Evolution of the radio emission spectrum of Cassiopeia A based on long-term observations at frequencies 290 and 927 MHz. Astron. J. 2007, 84, 105–114. [Google Scholar]
  17. Vinyaykin, E.N. About the frequency dependence of the evolution of radio emission from the supernova remnant Cassiopeia A. Astron. J. 2014, 91, 720–734. [Google Scholar]
  18. Salas, P.; Oonk, J.B.R.; van Weeren, R.J.; Salgado, F.; Morabito, L.K.; Toribio, M.C.; Emig, K.; Röttgering, H.J.A.; Tielens, A.G.G.M. LOFAR observations of decameter carbon radio recombination lines towards Cassiopeia A. Mon. Not. R. Astron. Soc. 2017, 467, 2274–2287. [Google Scholar] [CrossRef] [Green Version]
  19. Asgekar, A.; Oonk, J.B.R.; Yatawatta, S.; Van Weeren, R.J.; McKean, J.P.; White, G.; Jackson, N.; Anderson, J.; Avruch, I.M.; Batejat, F.; et al. LOFAR detections of low-frequency radio recombination lines towards Cassiopeia A. Astron. Astrophys. 2013, 551, L11. [Google Scholar] [CrossRef] [Green Version]
  20. Dent, W.A.; Aller, H.D.; Olsen, E.T. The Evolution of the Radio Spectrum of Cassiopeia A. Astrophys. J. 1974, 188, L11. [Google Scholar] [CrossRef]
  21. DeLaney, T.; Rudnick, L.; Stage, M.D.; Smith, J.D.; Isensee, K.; Rho, J.; Allen, G.E.; Gomez, H.; Kozasa, T.; Reach, W.T.; et al. The three-dimensional structure of Cassiopeia A. Astrophys. J. 2010, 725, 2038. [Google Scholar] [CrossRef]
  22. Blondin, J.M.; Ellison, D.C. Rayleigh-Taylor Instabilities in Young Supernova Remnants Undergoing Efficient Particle Acceleration. arXiv 2001, arXiv:astro-ph/0104024v2. [Google Scholar] [CrossRef]
  23. Konovalenko, A.A. I.S. Shklovsky and low-frequency radio astronomy. Radiophys. Radio Astron. 2017, 22, 7–30. [Google Scholar] [CrossRef] [Green Version]
  24. Ivanov, V.P.; Stankevich, K.S. Periodic variations of the radio emission and evolution of the spectrum of the supernova remnant Cassiopeia A. Sov. Astron. 1989, 33, 15. [Google Scholar]
  25. Stankevich, R.S.; Ivanov, V.P.; Stolyarov, S.P. Fifty Years of Radio Observations of the Discrete Source Cassiopeia A. Astron. Lett. 1999, 25, 501–507. [Google Scholar]
  26. Barabanov, A.P.; Ivanov, V.P.; Stankevich, K.S.; Stolyarov, S.P. Evolution of the Cassiopeia A radio spectrum: Evidence for cyclic variability. Sov. Astron. 1986, 30, 549. [Google Scholar]
  27. Cigan, P.; Matsuura, M.; Gomez, H.L.; Indebetouw, R.; Abellán, F.; Gabler, M.; Richards, A.; Alp, D.; Davis, T.A.; Janka, H.-T.; et al. High Angular Resolution ALMA Images of Dust and Molecules in the SN 1987A Ejecta. Astrophys. J. 2019, 886, 51. [Google Scholar] [CrossRef]
  28. Vinyajkin, E.N.; Razin, V.A. Secular Decreases in the 927 MHz Emission from the Supernova Remnants Cas A and Tau A. Aust. J. Phys. 1979, 32, 93. [Google Scholar] [CrossRef] [Green Version]
  29. Vinyajkin, E.N.; Razin, V.A. Secular Decrease and Random Variations of Cassiopeia A at 151.5 and 927 MHz. arXiv 2004, arXiv:astro-ph/0412593. [Google Scholar]
  30. Baars, J.W.M.; Genzel, R.; Pauliny-Toth, I.I.K.; Witzel, A. The Absolute spectrum of Cas A: An Accurate Flux Density Scale and Set of Secondary Calibrators. Astron. Astrophys 1977, 61, 99–106. [Google Scholar]
  31. Trotter, A.S.; Reichart, D.E.; Egger, R.E.; Stýblová, J.; Paggen, M.L.; Martin, J.R.; Dutton, D.A.; Reichart, J.E.; Kumar, N.D.; Maples, M.P.; et al. The fading of Cassiopeia A, and improved models for the absolute spectrum of primary radio calibration sources. Mon. Not. R. Astron. Soc. 2017, 469, 1299–1313. [Google Scholar] [CrossRef] [Green Version]
  32. Vinyajkin, E.N. Secular Decrease and Random Variations of the Flux Density of Cas A at 927, 290, 151.5 and 38 MHz from Long-Term Measurements. Astrophys. Space Sci. 1997, 252, 249. [Google Scholar] [CrossRef]
  33. Vinyajkin, E.N.; Volodin, A.G.; Koval’Chuk, O.M. On secular decrease of flux density of Cassiopeia A at the frequency 38 MHz. Pis′ma v Astronomičeskij Žurnal 1992, 18, 755–759. [Google Scholar]
  34. Agafonov, M.I. Cassiopeia A flux density secular decrease and variations at metre wavelengths. Astron. Astrophys. 1996, 306, 578. [Google Scholar]
  35. Martirossyan, R.M.; Goulyan, A.G.; Sanamyan, V.A.; Manaselyan, K.A. Variation of Flux Density of the Radio Source Cassiopeia A. Astrophysics 2002, 45, 365–369. [Google Scholar] [CrossRef]
  36. Martirossyan, R.M.; Goulyan, A.G.; Sanamyan, V.A.; Piroumyan, H.A. Note on a periodic intensity variation of the radio source Cassiopeia-A. Astrophysics 2007, 50, 203–206. [Google Scholar] [CrossRef]
  37. Martirosyan, R.M.; Gulyan, A.G.; Pirumyan, G.A.; Sargsyan, S.A.; Avetisyan, G.S. Variation in the Flux Density of the Radio Source Cassiopeia-A During the Period 2007–2015. Astrophysics 2017, 60, 83–89. [Google Scholar] [CrossRef]
  38. Read, P.L. Measurements of the flux density of Cas A and conformation of an anomaly at 38 MHz. Mon. Not. R. Astron. Soc. 1977, 178, 259–264. [Google Scholar] [CrossRef] [Green Version]
  39. Walczowski, L.T.; Smith, K.L. A recurrence of the Cassiopeia A flux anomaly. Mon. Not. R. Astron. Soc. 1985, 212, 27–31. [Google Scholar] [CrossRef] [Green Version]
  40. Bovkun, V.P.; Bubnov, I.N.; Zhuk, I.N.; Konovalenko, A.A. Evolution of radio emission from the supernova remnant Cassiopeia A based on fifty-years observations near frequencies 12.6, 14.7, 16.7, 20, and 25 MHz. Radiophys. Radio Astron. 2010, 15, 249–262. [Google Scholar]
  41. Bubnov, I.N.; Konovalenko, A.A.; Stanislavsky, A.A.; Bovkoon, V.P.; Zhouck, I.N.; Mukha, D.V. Evolution of the radio emission spectrum of supernova remnant Cassiopeia A at frequencies 35–65 MHz. Radiophys. Radio Astron. 2014, 19, 111–119. [Google Scholar] [CrossRef]
  42. Ajinkya, P.; Fisher, R. Measurement of Flux Density of Cas A at Low Frequencies. Am. Astron. Soc. 2012, 219, 239–309. [Google Scholar]
  43. Gorbynov, A.A.; Ryabov, M.I.; Panishko, S.K. Secular decrease the flux of supernova remnant Cas a on monitoring results to radiotelescope URAN-4” IRA NASU. Odessa Astron. Publ. 2015, 28, 224–226. [Google Scholar] [CrossRef] [Green Version]
  44. Ryabov, M.I.; Panishko, S.K.; Guglya, L.I. Space weather impacts on the Earth’s upper atmosphere according to the monitoring of powerful radio sources fluxes at the URAN-4 radio telescope. Odessa Astron. Publ. 2011, 24, 159–161. [Google Scholar]
  45. Ryabov, M.I.; Sobitnyak, L.I. Study of effects of lunar tidal wave passage in upper atmosphere of Earth according to monitoring data at radio telescope «URAN-4» RI NANU. Odessa Astron. Publ. 2019, 32, 132–136. [Google Scholar] [CrossRef]
  46. Prabhakaran Nayar, S.R. Periodicities in solar activity and their signature in the terrestrial environment. In Proceedings of the ILWS Workshop, Goa, India, 19–24 February 2006; p. 170. [Google Scholar]
  47. Valdes-Galicia, J.F.; Lara, A.; Maravilla, D. Heliospheric consequences of solar activity in geophysical and interplanetary phenomena. Geofis. Int. 2004, 43, 251–257. [Google Scholar]
  48. Bleiders, M.; Bezrukovs, V.; Orbidans, A. Performance Evaluation of Irbene RT-16 Radio Telescope Receiving System. Latv. J. Phys. Tech. Sci. 2017, 54, 42. [Google Scholar] [CrossRef] [Green Version]
  49. Emmert-Streib, F.; Dehmer, M. Understanding Statistical Hypothesis Testing: The Logic of Statistical Inference. Mach. Learn. Knowl. Extr. 2019, 1, 945–961. [Google Scholar] [CrossRef] [Green Version]
  50. Das, K.R.; Imon, A.H.M.R. A Brief Review of Tests for Normality. Am. J. Theor. Appl. Stat. 2016, 5, 5–12. [Google Scholar]
  51. Press, W.H.; Teukolsky, S.A. Savitzky-Golay Smoothing Filters. Comput. Phys. 1990, 4, 669. [Google Scholar] [CrossRef]
  52. Allen, R.J.; Barrett, A.H. Absolute Measurements of the Radio Flux from Cassiopeia a and Taurus a at 3.64 and 1.94 CM. Astrophys. J. 1967, 149, 1. [Google Scholar] [CrossRef]
  53. Hafez, Y.A.; Davies, R.D.; Davis, R.J.; Dickinson, C.; Battistelli, E.S.; Blanco, F.; Cleary, K.; Franzen, T.; Genova-Santos, R.; Grainge, K.; et al. Radio source calibration for the Very Small Array and other cosmic microwave background instruments at around 30 GHz. Mon. Not. R. Astron. Soc. 2008, 388, 1775–1786. [Google Scholar] [CrossRef] [Green Version]
  54. Arias, M.; Vink, J.; De Gasperin, F.; Salas, P.; Oonk, J.B.R.; Van Weeren, R.J.; Van Amesfoort, A.S.; Anderson, J.; Beck, R.; Bell, M.E.; et al. Low-frequency radio absorption in Cassiopeia. Astrono. Astrophys. 2018, 612, A110. [Google Scholar] [CrossRef] [Green Version]
  55. Anderson, M.; Rudnick, L.; Leppik, P.; Perley, R.; Braun, R. Relativistic Electron Populations in Cassiopeia A. Astrophys. J. 1991, 373, 146. [Google Scholar] [CrossRef]
  56. Wright, M.; Dickel, J.; Koralesky, B.; Rudnick, L. The Supernova Remnant Cassiopeia A at Millimeter Wavelengths. Astrophys. J. 1999, 518, 284–297. [Google Scholar] [CrossRef]
  57. McLaughlin, M.A.; Cordes, J.M.; Deshpande, A.A.; Gaensler, B.M.; Hankins, T.H.; Kaspi, V.M.; Kern, J.S. Upper Limits on Periodic, Pulsed Radio Emission from the X-ray Point Source in Cassiopeia A. Astrophys. J. Lett. 2001, 547, L41. [Google Scholar] [CrossRef] [Green Version]
  58. Patnaude, D.J.; Fesen, R.A. Small-scale X-ray variability in the Cassiopeia A supernova remnant. Astron. J. 2007, 133, 147–153. [Google Scholar] [CrossRef]
  59. Onić, D.; Urošević, D. On the continuum radio spectrum of Cas A: Possible evidence of nonlinear particle acceleration. Astrophys. J. 2015, 805, 119. [Google Scholar] [CrossRef] [Green Version]
  60. Liu, J.; Wang, W.; Zhang, B.; Huang, C.; Lin, D. Temporal Variation of Solar Wind in Controlling Solar Wind-Magnetosphere-Ionosphere Energy Budget. JGR Space Phys. 2018, 123, 5862–5869. [Google Scholar] [CrossRef]
  61. Gaberson, H.A. Applying the inverse FFT for filtering, transient details and resampling. Sound Vib. 2005, 39, 18–23. [Google Scholar]
  62. Tokumaru, M.; Mori, H.; Tanaka, T.; Kondo, T.; Takaba, H.; Koyama, Y. Solar wind near the Sun observed with interplanetary scintillation using three microwave frequencies. J. Geomagn. Geoelectr. 1991, 43, 619–630. [Google Scholar] [CrossRef]
  63. Vlasov, V.I. Variations in the cosmic source intensity during radio astronomical studies of the solar wind. Geomagn. Aeron. 2013, 53, 137–146. [Google Scholar] [CrossRef]
  64. Carilli, C.L.; Barthel, P.D. Cygnus A. Astron. Astrophys. Rev. 1996, 7, 1–54. [Google Scholar] [CrossRef]
  65. Wright, M.C.H.; Sault, R.J. Mapping Cygnus A at 3 Millimeter Wavelength with the MIRIAD System. Astrophys. J. 1993, 402, 546. [Google Scholar] [CrossRef]
  66. Briggs, B.H. Ionospheric irregularities and radio scintillations. Contemp. Phys. 1975, 16, 469–488. [Google Scholar] [CrossRef]
  67. Panishko, S.K. Power spectra of ionospheric scintillations obtained from observations of Cygnus A on the radio telescope URAN-4. Astron. Astrophys. Trans. 2006, 25, 411–413. [Google Scholar] [CrossRef]
  68. Vink, J. Supernova remnants: The X-ray perspective. Astron. Astrophys. Rev. 2012, 20, 49. [Google Scholar] [CrossRef] [Green Version]
  69. Mezger, P.G.; Tuffs, R.J.; Chini, R.; Kreysa, E.; Germund, H.P. Maps of Cassiopeia A and the Crab nebula at lambda 1.2 mm. Astron. Astrophys. 1986, 167, 145. [Google Scholar]
  70. Zakharenko, V.V.; Markova, A.V.; Yu, Y. Vasilyeva. Search for pulsed radiation of X-ray radio quiet single neutron stars in the decameter range. Radiophys. Radio Astron. 2010, 15, 263–270. [Google Scholar]
Figure 1. Observational data (1959–2009) obtained on the UTR-2 phased antenna array at frequencies 12.6, 14.7, 16.7, 20, 25 MHz. The linear dependence is quite weak in the area of the plot with a large scatter of points (the largest burst of the Cas A flux was at a frequency of 12.6 MHz). (Adapted with permission from ref. [40]. 2010 Bovkun V.P., Bubnov I.N., Zhuk I.N., Konovalenko A.A.)
Galaxies 09 00030 g001
Figure 2. The results of observations carried out on the URAN-4 radio telescope show no noticeable decrease in the ratio of Cas A/Cyg A flux densities at both frequencies 20 and 25 MHz in the period from 1987 to 1993; on the contrary, there is a weak trend towards increase in the Cas A flux, with an average flux ratio (Cas A/Cyg A) = 1.5 on 25 MHz).
Galaxies 09 00030 g002
Figure 3. Results of observations carried out on the URAN-4 radio telescope in the period 1998–2001. There is a very weak tendency for a secular decrease in the Cas A/Cyg A flux density ratio at both frequencies of 20 and 25 MHz. The linear trend of the secular flux decrease is almost not observed at 25 MHz.
Galaxies 09 00030 g003
Figure 4. Example of a linear approximation for a complete set of observational data of the Cas A from 1987 to 2001 at a frequency of 20 MHz made on the URAN-4 telescope. That the secular flux decrease can be seen on the plot, but very weakly.
Galaxies 09 00030 g004
Figure 5. Example of trigonometric approximation of observational data at the frequency 20 MHz, obtained on a phased array antenna URAN-4 (1987–2001). Previously, the data were cleared from repeated measurements in time and then normalized (average value was subtracted from time series, and then divided by standard deviation). The resulting curve consists of two sinusoids, with periods 5.6 years and 3.2 years. Determination coefficient—R2 = 0.446, standard error of approximation—SE = 0.780, and F-value of the Fisher statistic—F = 8.070.
Galaxies 09 00030 g005
Figure 6. Example of a plot of “relative” flux density data in dB (decibels) (in left (LCP) circular polarization) for the Cas A radio source, at a frequency of 8.7 GHz, 17 January 2021.
Galaxies 09 00030 g006
Figure 7. Spectrogram (normalized to 0 decibels (dB0)) for smoothed and interpolated the Cas A record, in right circular polarization (RCP), frequency of 8.7 GHz. It can be seen that the signal contains irregular short-term variations at different time scales, from 13 min to 30 s. However, quite strong background noise does not allow to clearly distinguish the elements of variability, on the spectrogram.
Galaxies 09 00030 g007
Figure 8. The Cas A flux density records at 8.6 GHz. (A) 17 June (B) 18 June (C) 13 June (D) 12 June 2020. It can be seen that the Cas A source is stable in time; however, there are small deviations from the mean value in the form of fast variations in the flux density.
Galaxies 09 00030 g008
Figure 9. The plot shows a comparison of total flux density (average between left (LCP) and right (RCP) circular polarizations) for the radio sources Cas A and Cyg A, at a frequency of 8.8 GHz, for 5 February 2021. It can be seen that at this frequency the flux density Cas A still exceeds the flux density of Cyg A by 1.7 times.
Galaxies 09 00030 g009
Figure 10. The top plot is the radio spectrum of the Cas A source in the range 1.3–300 GHz (for the epoch of 2000 (Adapted from Y.A. Hafez et al. (2008))), the X-axis is the decimal logarithm of the frequency in GHz and the Y-axis is the decimal logarithm of the flux density in Jy—Jansky (figure is shown on a double logarithmic scale for convenience of approximation by a linear trend). Trend equation y = 0.7135 · x + 3.3455 , similar trend equation with power-law approximation (without data logarithm): y = 2215.8870 · x 0.7135 . The points obtained at 6.7, 8.6 and 8.8 GHz in VIRAC are highlighted by arrows in the plots. Over 20 years, there has been a noticeable decrease in the Cas A flux density. The bottom is a plot of residuals after subtracting linear trend, the X-axis is shown in a logarithmic scale, and the Y-axis is the deviation of points from the trend, in Jy. It can be seen that the measurement points obtained in 2020 and 2021 deviate significantly more from the linear trend than the measurement points in 2000. Taking into account the deviation of VIRAC measurement points from linear trend of the Cas A spectrum for 2000, it can be assumed that over 20 years the rate of secular decrease was about 2.5 Jy per year at a frequency of 8.6 GHz and about 3.1 Jy per year at a frequency of 8.8 GHz.
Galaxies 09 00030 g010
Figure 11. This graph shows the Cas A radio spectra for the epochs 1965, 2000 and 2015 (Adapted from Vinyaykin E.N. (2014), Y.A. Hafez et al. (2008) and J.W.M. Baars et al. (1977)). For comparison, the stationary radio spectrum of the radio galaxy Cyg A has been added. It can be seen that in 2015, in frequency range about ≈45–600 MHz, the Cas A spectrum is observed to drift below the Cyg A spectrum, but in the decameter radio range (frequencies below 50 MHz), the Cas A spectrum remains above the spectrum of Cyg A. In the centimeter radio range, the spectrum of Cas A in all observation epochs noticeably exceeds the level of the Cyg A spectrum, which has a quite large bend in this range. Even in 2021, the Cas A flux density significantly exceeds the Cyg A flux density. This is confirmed by the latest observations at VIRAC at a frequency of 8.8 GHz.
Galaxies 09 00030 g011
Figure 12. Example of periodogram for the Cas A radio source, at 8.6 GHz, with a Hamming spectral window for reducing distortion from false harmonics on periodogram. Main peak on the periodogram exceeds the 99.9% confidence interval (which means that only 1 from 1000 sets of random noise can produce a similar peak on the periodogram, just due to randomness) and corresponds to a quasi-period 44.5 min.
Galaxies 09 00030 g012
Figure 13. Short-Time Fourier Transform (STFT) spectrograms for solar wind speed (A), solar flux pressure (B) and solar wind plasma temperature (C), for a filtered data in a band of 15–51 min. Segment (D) shows the FFT periodogram for solar wind temperature. As can be seen, the period band of about 40 min is dominant and the longest, despite the presence of a large number of short-term and irregular variations on different time scales.
Galaxies 09 00030 g013
Figure 14. This example shows a plot of a fragment flux density change (averaged and normalized measurements obtained relatively to the noise generator) of the Cyg A radio galaxy during the 23-solar activity cycle (1996–2008). The data were obtained on URAN-4 phased array antenna, frequency of 25 MHz, linear polarization A. The scatter of points on the plot is associated with two factors: (1) a large number of geomagnetic storms during the 23-cycle, and, accordingly, ionospheric disturbances; (2) seasonal–diurnal variations in the form of changes in flux density in different months and even days. In addition, a long-term trend is clearly visible. Thus, in the decameter radio range, the Cyg A flux density is not constant and depends on the state of the ionosphere, which responds to manifestations of solar activity, geomagnetic activity, and also seasonal–diurnal effects.
Galaxies 09 00030 g014
Figure 15. Example of 3C 405 (Cyg A) source record at a frequency of 6.7 GHz (in decibels dB) on 16 July 2020. In this example, apart from impulse noise, there are no significant variations in the intensity of the radio source during the observation session.
Galaxies 09 00030 g015
Table 1. Linear regression parameters for 25 MHz data obtained with the UTR-2 radio telescope from 1959 to 2009. The table uses the following designations: Coeff.A, Coeff.B—coefficients A and B of linear model, Disp.Data—dispersion of original data, Disp.Resid.—dispersion of residuals after subtracting linear trend, R2—coefficient of determination, T-Stat.A and T-Stat.B—values of T-statistics for coefficients A and B of linear model, p-val.A and p.val.B—critical (threshold) values for coefficients A and B of linear model, F-Stat is value of Fisher’s F statistic.
Linear Regression Parameters for the UTR-2, 1959–2009, 25 MHz Data
Coeff.ACoeff.BDisp.DataDisp.Resid.R2T-Stat.AT-Stat.Bp-Val.Ap-Val.BF-Stat.
−0.01370728.7824692.0454431.2323200.397529−4.8056315.1211100.9999855.561 × 10611.217129
Table 2. Summary table of linear regression parameters for the data obtained on the URAN-4 phased array antenna for two observation periods, 1987–1993 and 1998–2001, performed at frequencies 20 and 25 MHz. It can be seen that the linear dependences are very weak, especially in the data for time interval 1998–2001. The linear trend is least of all expressed at a frequency of 25 MHz in both observation intervals. The table uses the following designations: Coeff.A, Coeff.B—coefficients A and B of linear model, Disp.Data—dispersion of original data, Disp.Resid.—dispersion of residuals after subtracting linear trend, R2—coefficient of determination, T-Stat.A and T-Stat.B—values of T-statistics for coefficients A and B of linear model, p-val.A and p.val.B—critical (threshold) values for coefficients A and B of linear model, F-Stat is value of Fisher’s F statistic.
Linear Regression Parameters for 1987–1993, 20 MHz Data
Coeff.ACoeff.BDisp.DataDisp.Resid.R2T-Stat.AT-Stat.Bp-Val.Ap-Val.BF-Stat.
0.049631−97.15931.8904981.5939320.1568712.693751−2.650370.0051820.9942223.535117
Linear regression parameters for 1987–1993, 25 MHz data
Coeff.ACoeff.BDisp.DataDisp.Resid.R2T-Stat.AT-Stat.Bp-Val.Ap-Val.BF-Stat.
0.029646−57.44142.034311.924280.0540871.474055−1.435360.0743520.9203171.057829
Linear regression parameters for 1998–2001, 20 MHz data
Coeff.ACoeff.BDisp.DataDisp.Resid.R2T-Stat.AT-Stat.Bp-Val.Ap-Val.BF-Stat.
−0.12993261.34947.376166.971310.054886−1.384351.3924080.9122290.0865560.929179
Linear regression parameters for 1998–2001, 25 MHz data
Coeff.ACoeff.BDisp.DataDisp.Resid.R2T-Stat.AT-Stat.Bp-Val.Ap-Val.BF-Stat.
−0.0149331.385564.9760974.9709410.001036−0.179310.1885190.570570.4258490.015558
Table 3. Table of linear regression parameters for the Cas A observational data on the URAN-4 telescope, for the entire data series from 1987 to 2001, at a frequency of 20 MHz. It can be seen, despite the fact that the trend is inclined towards a decrease in the Cas A flux, the significance of linear trend is very low. The table uses the following designations: Coeff.A, Coeff.B—coefficients A and B of linear model, Disp.Data—dispersion of original data, Disp.Resid.—dispersion of residuals after subtracting linear trend, R2—coefficient of determination, T-Stat.A and T-Stat.B—values of T-statistics for coefficients A and B of linear model, p-val.A and p.val.B—critical (threshold) values for coefficients A and B of linear model, F-Stat is value of Fisher’s F statistic.
Linear Regression Parameters for 1987–2001, 20 MHz Data
Coeff.ACoeff.BDisp.DataDisp.Resid.R2T-Stat.AT-Stat.Bp-Val.Ap-Val.BF-Stat.
−0.0057813.085519.3822539.3114660.007545−0.750040.8511250.7721950.1987230.277476
Table 4. Technical information about the 16-m VIRAC radio telescope.
VIRAC, Latvia, 16-m Parabolic Radiotelescope Technical Data
Cooled receiving system for the frequency range C/M/XManufacturer: TTI, Spain
Frequency range: 4500–8800 MHz RHCP/LHCP
Registration band: 1000–1200 MHz
Available sub-bands:
C1: 4500–5500 MHz, LO = 4100 MHz
C2: 5400–6400 MHz, LO = 5000 MHz
C3: 6400–7600 MHz, LO = 6100 MHz
C4: 7600–8800 MHz, LO = 7300 MHz
SEFD (C1/C2/C3/C4 for all bands): 540–700 Jy
G/T: 56–60 dB/K
Gain: ~0.05 K/Jy, 59 dBi
System temperature: 30–50 K depending of elevation angle
HPBW @ 8400 MHz: 0.156 deg или 10 arcmin
Antenna positioning system parameters:Developer: MTM Mechatronics, Germany
Azimuth/Elevation Range: −328…+328 deg/+2.5…94 deg
Azimuth/Elevation maximum speed: 5/4 deg/s
Azimuth/Elevation maximum acceleration: 1.5/2 deg/s/s
Azimuth/Elevation tracking accuracy: 3.3/3.3 arcsec (RMS)
Azimuth/Elevation guidance accuracy: 23/54 arcsec (RMS)
Operating modes: Coordinate table; amendment table; TLE (for satellites)
Table 5. Standard deviations of flux density (left (LCP) and right (RCP) circular polarizations) for the plots of Cas A at 8.6 GHz those shown in Figure 8, for dates 12, 13, 17 and 18 June 2020.
Standard Deviations for the Cas A Data at 8.6 GHz
12 June 202013 June 202017 June 202018 June 2020
RCP7.88 JyRCP10.46 JyRCP7.21 JyRCP8.22 Jy
LCP8.03 JyLCP11.60 JyLCP7.22 JyLCP7.93 Jy
Table 6. Linear regression parameters for the radio spectrum of the Cas A (2000) with added points of flux measurements at frequencies 6.7, 8.6, 8.8 GHz, obtained at VIRAC in 2020 and 2021. The table uses the following designations: Coeff.A, Coeff.B—coefficients A and B of linear model, Disp.Data—dispersion of original data, Disp.Resid.—dispersion of residuals after subtracting linear trend, R2—coefficient of determination, T-Stat.A and T-Stat.B—values of T-statistics for coefficients A and B of linear model, p-val.A and p.val.B—critical (threshold) values for coefficients A and B of linear model, F-Stat is value of Fisher’s F statistic.
Linear Regression Parameters for Cas A Radio Spectrum (2000) + VIRAC Points
Coeff.ACoeff.BDisp.DataDisp.Resid.R2T-Stat.AT-Stat.Bp-Val.Ap-Val.BF-Stat.
−0.713553.3455484.7744940.0287290.993983−60.2841231.62910.0000011734.493
Table 7. Polynomial regression parameters for observational data (1998–2005) of the Cyg A radio galaxy, received on URAN-4 phased array antenna, at a frequency of 25 MHz. The table uses the following designations: Pc—coefficients of polynomial trend model, Disp.D—dispersion of original data, Lo. 95%—coefficients of lower 95% confidence level, Up. 95%—coefficients of upper 95% confidence level, Disp.R—dispersion of residuals after subtracting linear trend, R2—coefficient of determination, T-Stat—values of T-statistics for coefficients of polynomial trend model, p-val—critical (threshold) values for polynomial coefficients of trend model, F-Stat is value of Fisher’s F statistic.
Polynomial Regression Parameters for the Cyg A, 1999–2005, 25 MHz Data
PcLo. 95%Up. 95%T-Statp-ValAdditional Stat.Parameters
−2.1× 10⁻⁸−6.0 × 10−81.8 × 10−8−1.069510.856029Disp.D7.100595
0.000156−7.6 × 10−50.0003881.3164480.095824Disp.R3.681786
−0.37037−0.834840.09409−1.562920.939062R20.481482
285.8209−23.9934595.63521.8081750.037101F-Stat19.03576
Publisher’s Note: MDPI stays neutral with regard to jurisdictional claims in published maps and institutional affiliations.

