NuSTAR View of TeV Blazar Mrk 501


Aryabhatta Research Institute of Observational Sciences (ARIES), Manora Peak, Nainital 263001, India
Galaxies 2020, 8(3), 55; https://doi.org/10.3390/galaxies8030055
Submission received: 30 June 2020
/
Revised: 21 July 2020
/
Accepted: 24 July 2020
/
Published: 25 July 2020
(This article belongs to the Special Issue X-Ray Flux and Spectral Variability of Blazars)
Abstract
We report the results of flux and spectral variability studies of all seven Nuclear Spectroscopic Telescope Array (NuSTAR) observations of TeV ray emitting blazar Markarian (or Mrk) 501. We found strong evidence of intraday variability in 3–79 keV X-ray light curves (LCs) of Mrk 501 during four out of these seven observations. We examined spectral variability using a model-independent hardness-ratio analysis and found a general “harder-when-brighter” behaviour in two observations. We also investigated the nature of 3–79 keV X-ray spectra of TeV blazar Mrk 501 and found that five out of seven spectra are well described by the curved log-parabola models with photon indices (at 10 keV) 2.12–2.32 and a curvature 0.15–0.28. The two other spectra are somewhat better represented by simple power-law models with photon indices 2.70 and 2.75. We briefly discuss available physical models to explain our results.
1. Introduction
Active galactic nuclei (AGN) are highly energetic astrophysical objects that are powered by actively accreting supermassive black holes (SMBH; M M) at their centres, and produce unique observational features over the entire electromagnetic (EM) spectrum [1]. About 15% of AGN consist of two well-collimated jets of ultrarelativistic particles extending to kilo-parsec (kpc) or sometimes up to mega-parsec (Mpc) distances and are known as jetted-AGN [2]. The spectra of these jetted-AGN strongly depend on the viewing angles of their jets with respect to the observer’s line of sight and this difference forms the base for their classification. Blazars are the jetted-AGN aligned at very small (≤ 15–20) viewing angles [3,4,5]. Their spectra are fully dominated by non-thermal radiation from the relativistic jets. Blazars are usually subdivided into flat-spectrum radio quasars (FSRQs) and BL Lac objects (BLLs) e.g., [6,7]. The division between these two subclasses could be due to their different accretion regimes with FSRQs having higher accretion rates above 10 of the Eddington rate [8].
Blazars emit detectable radiations at all EM wavelengths and their broadband spectral energy distributions (SEDs) have characteristic double-humped structures. The first or low energy SED hump, which peaks in Infra-red (IR) to X-rays, is dominated by the synchrotron radiation from the jet. The second or high energy SED hump, peaking at rays (GeV to TeV energies), is produced either by the inverse-Compton (IC) radiation (leptonic model; [9]) or via radiation arising from hadronic processes (hadronic model; [10]). Based on the peak frequency of the first SED hump or the synchrotron peak frequency [11] subdivided blazars into LSP (or low synchrotron peaked blazars; 10 Hz), ISP (or intermediate synchrotron peaked blazars; 10 10 Hz), and HSP (or high synchrotron peaked blazars; 10 Hz). A slightly modified range of for these subclasses of blazars was proposed by [12] as: LSP having log 14.0, ISP with 14.0 < log 15.3, and HSP having log 15.3.
Markarian (or Mrk) 501 ( = 16 h 53 m 52 s; ) is one of the nearest (; [13]) bright X-rays emitting high-frequency peaked BL Lac object (HBL1). It was first detected at very high energy (VHE) ray (above 300 GeV) in 1995 by the Whipple telescope [14] that made it the second extragalactic object, after Mrk 421 [15], detected at TeV energies. Mrk 501 has been extensively observed in several multiwavelength campaigns to understand its exact nature which is yet not fully understood (e.g., [16,17]). In a recent X-ray variability study of Mrk 501 with Swift, the source showed the most extreme X-ray flare activity in March–October 2014 during its 11.5 yr long monitoring period [18]. During this epoch, several short-term X-ray flares were detected with their amplitude varied by factors of 1.9–4.7 on weekly timescales. They also found a moderate positive correlation between the X-ray and the TeV fluxes, while no significant correlation was detected between 0.3−300 GeV and optical fluxes.
To date, out of about 35612 blazars, TeV emissions have been detected only in 683 blazars. Most of the TeV blazars belong to the HBL (52) subclass. It has been reported that the X-ray emissions of the TeV ray emitting blazars are usually highly variable on intraday timescales (i.e., in less than a day time interval; (e.g., [19,20], and references therein)). High flux variability on such small timescales has been one of the most puzzling issues in the field of blazar astronomy as it requires very large energy outputs within small regions. These emitting regions often lie near to SMBH. Study of X-ray flux variability on very short (or intraday) timescales is helpful in probing the size of the emitting regions near SMBH as well as the underlying emission mechanisms (leptonic or hadronic; (e.g., [21])). The shape of X-ray spectra of TeV blazars has also been studied for quite some time as it provides information about the distribution of particles at these energies. The X-ray spectra of TeV blazars Mrk 421 and Mrk 501 were examined by [22,23,24] and they described them in terms of the curved log-parabola model. The X-ray spectral shape of 29 TeV blazars observed with Swift/XRT were investigated by [25] and they found that most of them are well described by the curved log-parabola model. In our earlier work [19], we performed the timing analysis of five TeV blazars (including Mrk 501) using Nuclear Spectroscopic Telescope Array (NuSTAR) data. The number of observations of Mrk 501 studied in earlier work was only four, all taken in 2013. In the last few years more (three) NuSTAR observations of the source were carried out. These three new observations were not studied earlier by any author. The motivation of this work is to examine all the NuSTAR light curves of the TeV blazar Mrk 501 for intraday flux and spectral variability, and to investigate the nature of its 3–79 keV X-ray spectra.
The outline of the manuscript is as follows. We briefly describe the NuSTAR observations and data processing in Section 2 as well as discuss the analysis techniques used for examining variability properties in Section 3. The results are given in Section 4. A summary of the work and discussion of our results are presented in Section 5.
2. NuSTAR Observations and Data Processing
NuSTAR is a space observatory consisting of two hard X-ray focusing telescopes and the two corresponding co-aligned focal plane modules, referred to as FPMA and FPMB [26]. We downloaded all NuSTAR observations of the TeV blazar Mrk 501 from the HEASARC Data archive4. The blazar Mrk 501 was observed with NuSTAR on seven occasions between 13 April 2013 and 19 April 2018 and the good exposure times (those corrected for the periods of South Atlantic Anomaly (SAA) passage and Earth occultation) ranged from 9.98 ks to 25.76 ks. In 2013, NuSTAR observed Mrk 501 four times as a part of an extensive simultaneous multiwavelength campaign [16]. It was observed two times in 2017 in NuSTAR guest observer program cycle 2, while a single observation was made in 2018 in the extragalactic legacy survey as a part of thw NuSTAR extended mission. The observation log of NuSTAR data for Mrk 501 is given in Table 1.
The NuSTAR data sets for the TeV blazar Mrk 501 were processed using the NuSTARDAS software within the HEASOFT5 software package version 6.26.1. We first generated the calibrated and cleaned level 2 event files using the standard nupipeline script and the updated CALDB files version 20200526. For each observation, the source light curve and spectrum were then extracted from a circular region of radius 50 centred at the source using the nuproducts script. To extract background data for each observation we used a circular region of the similar radius on the same detector module in which the source was located but free from source contamination.
Since the two NuSTAR detectors, FPMA and FPMB, are co-aligned and nearly identical, we summed their background-subtracted light curves and rebinned them using a bin size of 300 s to get the final light curves. We grouped each source spectra using grppha to ensure at least 20 counts per bin.
3. Analysis Techniques
3.1. Fractional Variance
To quantify the amplitude of variability in the blazar light curves (LCs), we employed the fractional variance which is generally used for examining AGN X-ray LCs (e.g., [27,28]). The fractional variance, , is explained in detail in our previous papers ([19,20], and references therein). For a light curve consisting of N data points, the value of is given by:
The error in is calculated as:
where and are the sample variance and the arithmetic mean of the LC, respectively, while is the mean square error.
3.2. Hardness Ratio
To examine spectral variations in the NuSTAR X-ray emission from the TeV blazar Mrk 501, we also extracted LCs in two energy bands: A soft energy band ranging from 3 to 10 keV and a hard energy band from 10 to 79 keV. We then calculated the hardness ratio (HR) as:
where S and H are the individual simultaneous fluxes (in the units of counts/sec) in soft and hard energy bands, respectively. The error in HR is computed as:
where , and are the errors in soft and hard energy bands, respectively. Since a hardness ratio simply compares the number of counts observed in two different energy bands, it is a model independent technique to study the spectral variability of the source. We examined variations of the HRs with the total flux to study spectral changes with brightness in the 3–79 keV energy range.
4. Results
4.1. X-ray Flux Variability
We plotted all the NuSTAR light curves of the TeV blazar Mrk 501 in Figure 1. Clear intraday variations were seen on a couple of nights of observations. We examined all the light curves of Mrk 501 for intraday flux variations using fractional variability amplitude F, discussed in Section 3.1. The results of our intraday variability (IDV) analyses are given in Table 2, where dashes “–” indicate that the sample variances < mean square errors, so no real value of can be computed for the LC. The source showed significant flux variations on four out of seven nights. The maximum flux variation was detected on MJD 56,420 (Obs. ID: 60002024004) with fractional variability amplitude of 15.53%, while the minimum flux variation was observed on MJD 56,485 (Obs. ID: 60002024006) with a F value of 3.90%. The values of F were 8.45%, and 5.17% on MJD 56,486 and MJD 57,870, respectively. No significant IDV variation was detected on MJD 56,395, MJD 57,897, and MJD 58,227. We also examined the soft (3–10 keV) energy band LCs and the hard (10–79 keV) energy band LCs for intraday variability. As can be seen from the Table 2, the amplitude of variability is larger in the higher (10–79 keV) energy band than the lower (3–10 keV) energy band during all the observations with significant IDV detection in 3–79 keV X-ray LCs.
4.2. X-ray Spectral Variability
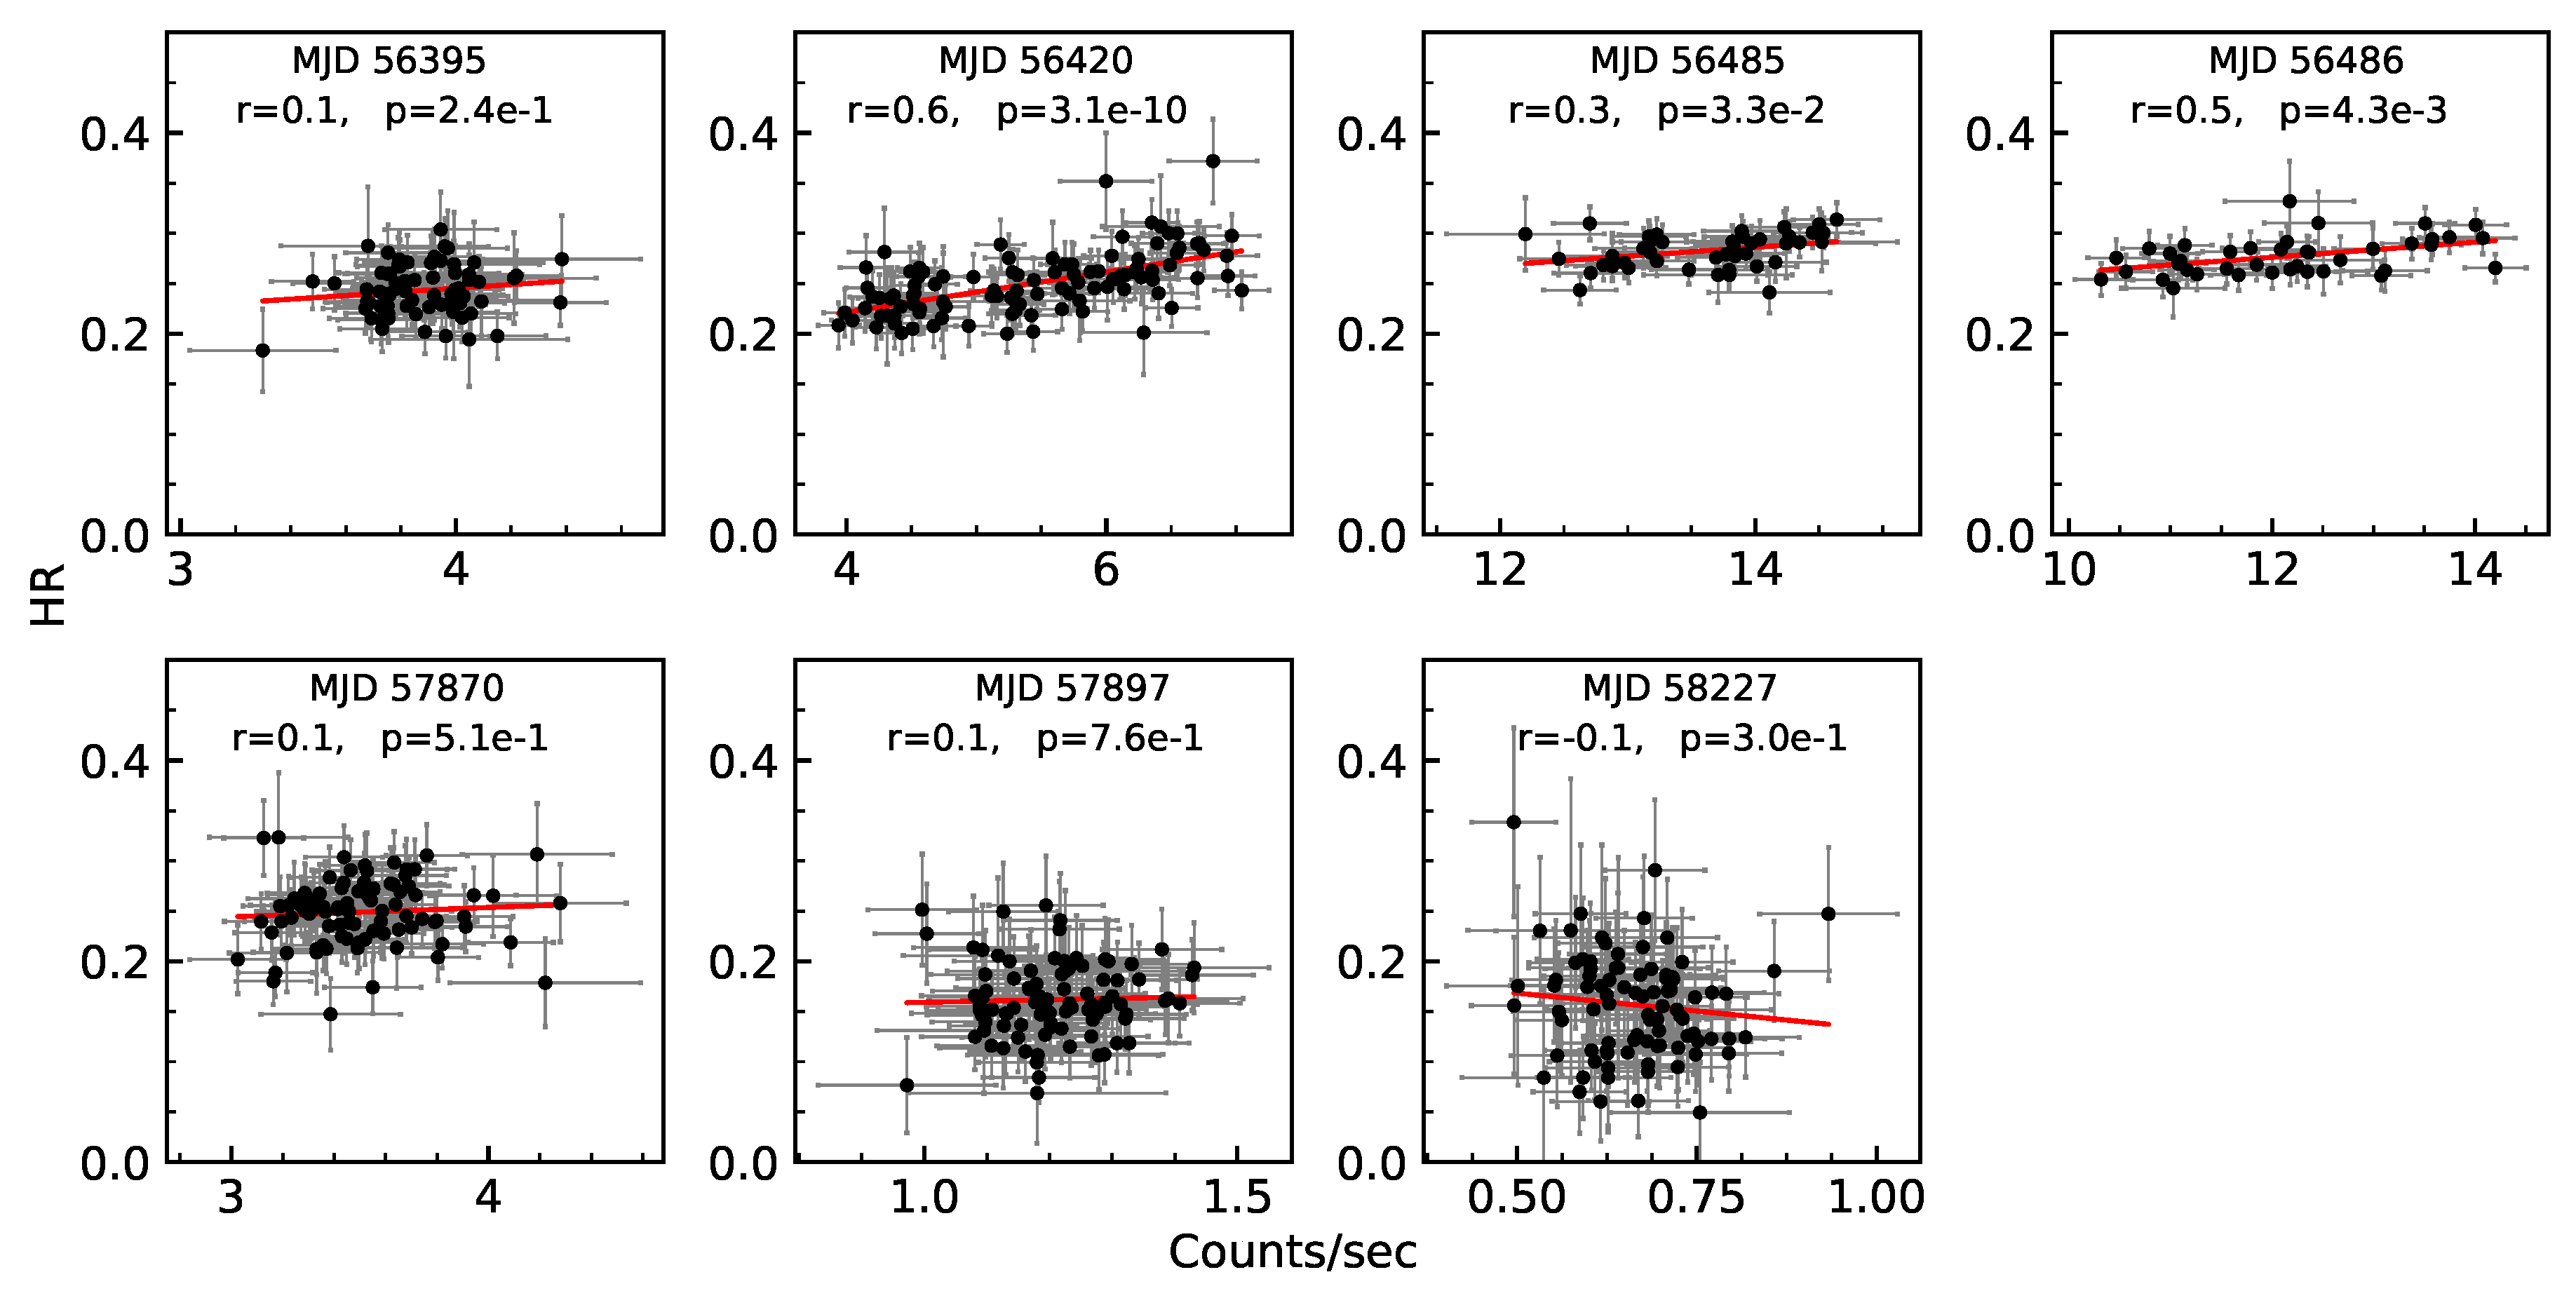
We investigated the spectral variability of 3–79 keV X-ray emission from the TeV blazar Mrk 501 using a model-independent hardness-ratio analysis. We plotted the HR against total (3–79 keV) flux in Figure 2. To search for any systematic variation in HR with flux, we fitted a first-order polynomial in each plot of Figure 2. The values of correlation coefficient (r) and the null hypothesis probability (p) are mentioned in each plot. Assuming Gaussian fluctuations and white noise variations, strong positive correlations (r ≥ 0.5 and p < 0.01) between HR and total count rates were found on MJD 56,420 (Obs. ID: 60002024004; r = 0.6, p = 3.1 × 10) and MJD 56,486 (Obs. ID: 60002024008; r = 0.5, p = 4.3 × 10) indicating that the spectra become harder with increasing flux during these observations. No statistically significant correlations were detected in the remaining five observations.
4.3. NuSTAR Spectra
For each observation, we simultaneously fitted the spectra from the two NuSTAR detectors, FPMA and FPMB, in the XSPEC6 version 12.10.1f using statistics. To account for cross-calibration uncertainties between these two detectors we have included a multiplicative constant factor in each spectral model whose value is kept fixed to 1 for FPMA and free to vary for FPMB. The values of the constant factor ranged from 0.97 to 1.05 which is within the expected values as suggested by [29].
The spectra were modelled with both a simple power-law (PL) and a log-parabolic (LP) model. The power-law model is defined as:
where and K are the photon-index and the normalization, respectively, while is the flux at energy E. The log-parabolic model is given by [22]:
where is the photon-index at fixed energy keV, is the spectral curvature, and K is the normalization.
We multiplied each spectral model by a phabs component with fixed hydrogen column density, taken from [30], to account for the Galactic absorption.
To choose the best-fitted spectral model between PL and LP we performed the F-test7 using values of and the dof8 for both models. The results of spectral fitting and the F-test are listed in Table 3. The LP model provides a better fit than the simple PL model if the value of F-statistic > 1 and the corresponding null hypothesis probability, p < 0.01. We found that for five out of seven NuSTAR observations of Mrk 501 the curved LP model provides a better fit over the PL model. For the last two observations, the NuSTAR spectra of Mrk 501 are well described by the PL model as can be seen from the high values () of null hypothesis probability. The model-fitted spectra and the data-to-model ratios for each observation are plotted in Figure 3.
5. Summary and Discussion
In this paper, we analysed seven archival NuSTAR observations of the TeV blazar Mrk 501 performed between 13 April 2013 and 19 April 2018. In particular, we studied hard (3–79 keV) X-ray flux and spectral variability properties of Mrk 501, and investigated the shape of its X-ray spectra in 3–79 keV energy range. We examined all NuSTAR light curves of Mrk 501 for intraday variability using fractional variability analysis. We found significant IDV variations in four out of seven X-ray LCs with the fractional variability amplitudes ranging from 3.90% to 15.53%. No significant variations were detected in the rest three observations. We noticed that during the last two observations (MJD 57,897, and MJD 58,227) the source was in somewhat lower states, while on MJD 56395 the intrinsic variations in the light curve are probably smaller than the measurement errors.
TeV blazars are known to exhibit large amplitude flux variations at all frequencies on different timescales (e.g., [19,20,21,31,32,33], and references therein). Flux variations in blazar LCs are generally understood to originate from the relativistic jets [34]. At high frequencies (X-rays to rays) large amplitude variations are often observed on very short timescales indicating compact emitting regions (e.g., [35,36]). Such rapid variations are often explained by the interaction of relativistic turbulent plasma with shock within the jets, which accelerates the particles to high energies [34]. The shortest hard X-ray (3–79 keV) variability with doubling time of ∼14 min was reported from the TeV blazar Mrk 421 by [21] during its 2013 April flare. They suggested that magnetic reconnections taking place in fast-moving emitting regions within the jets could be responsible for such a short timescale variability (“jets-in-a-jet” model; [37]). Long term flux variations in the X-ray light curve of Mrk 501 during the entire NuSTAR monitoring period can be explained by the shock-in-jet model which involves the acceleration of particles to high energies by an internal shock within the jet followed by subsequent cooling by emitting radiations [38]. Other possible explanations for the longer timescale variations include a change in the viewing angle, and hence in the Doppler factor of the emitting region within the jet (e.g., [39,40]), and/or a change in the magnetic field [41].
We examined the hard (3–79 keV) X-ray spectral variability of the TeV HBL Mrk 501 using HR analysis. We found that for observations on MJD 56,420 and MJD 56,486, the HR increases with increasing flux, that is, the NuSTAR spectra of Mrk 501 became harder with the increasing count rates. Such a “harder-when-brighter” trend has often been noticed in X-ray observations of the HBL-type blazars (e.g., [19,42,43], and references therein). For the other five observations, no strong correlation were seen between HR and count rates. Moreover, as can be seen from Figure 2, the data have uncertainties which were not taken into account during the correlation analysis and thus, the correlation between the HR and the flux may be somewhat lower than those reported here.
We also studied the shape of NuSTAR spectra of TeV blazar Mrk 501 using the simple power-law model and the log-parabola model. We found that five out of seven NuSTAR spectra are well described by the curved LP models with local photon indices lying in the range of 2.12–2.32 and the spectral curvature 0.15–0.28. For the last two observations (Obs. IDs: 60202049004 and 60466006002), when the X-ray fluxes are relatively low the simple PL model provides an equivalently good fit with photon indices 2.70 and 2.75, respectively. During the NuSTAR monitoring period of Mrk 501, the maximum 3–79 keV unabsorbed flux recorded was erg cm s on MJD 56,485, while the minimum flux observed was erg cm s on MJD 58,227.
The study of X-ray spectral shape of TeV blazars is helpful in understanding the particle acceleration mechanism and the distribution of emitting particles. The curved LP model was used for the first time to describe the spectral shape of synchrotron emission from the BL Lac type blazars by [44]. Later, [22,23,24] successfully described the X-ray spectra of TeV HBLs Mrk 421 and Mrk 501 using the LP model and suggested that the curved X-ray spectra of TeV blazars can be understood in terms of statistical energy-dependent particle acceleration. The observed curvature of X-ray spectra of TeV HBLs could be either convex or concave. The convex curvature of the X-ray spectra, as found in this work, is likely to be caused by a single-accelerated particle distribution (e.g., [22]), while the concave X-ray spectra observed in some studies (e.g., [45]), maybe a consequence of the spectral upturn at the interaction of the high-energy tail of the synchrotron emission and the low-energy part of the IC emission.
Funding
This research received no external funding.
Acknowledgments
This research has made use of data obtained with NuSTAR, the first focusing hard X-ray mission managed by the Jet Propulsion Laboratory (JPL), and funded by the National Aeronautics and Space Administration (NASA). This research has also made use of the NuSTAR Data Analysis Software (NuSTARDAS) jointly developed by the ASI Science Data Center (ASDC, Italy) and the California Institute of Technology (Caltech, USA).
Conflicts of Interest
The author declares no conflict of interest.
References
- Rees, M.J. Black Hole Models for Active Galactic Nuclei. Annu. Rev. Astron. Astrophys. 1984, 22, 471–506. [Google Scholar] [CrossRef]
- Padovani, P.; Alexander, D.M.; Assef, R.J.; De Marco, B.; Giommi, P.; Hickox, R.C.; Richards, G.T.; Smolčić, V.; Hatziminaoglou, E.; Mainieri, V.; et al. Active galactic nuclei: What’s in a name? Astron. Astrophys. Rev. 2017, 25, 2. [Google Scholar] [CrossRef]
- Urry, C.M.; Padovani, P. Unified Schemes for Radio-Loud Active Galactic Nuclei. Publ. Astron. Soc. Pac. 1995, 107, 803. [Google Scholar] [CrossRef]
- Liodakis, I.; Hovatta, T.; Huppenkothen, D.; Kiehlmann, S.; Max-Moerbeck, W.; Readhead, A.C.S. Constraining the Limiting Brightness Temperature and Doppler Factors for the Largest Sample of Radio-bright Blazars. Astrophys. J. 2018, 866, 137. [Google Scholar] [CrossRef]
- Xiao, H.; Fan, J.; Yang, J.; Liu, Y.; Yuan, Y.; Tao, J.; Costantin, D.; Zhang, Y.; Pei, Z.; Zhang, L.; et al. Comparison between Fermi detected and non-Fermi detected superluminal sources. Sci. China Phys. Mech. Astron. 2019, 62, 129811. [Google Scholar] [CrossRef]
- Stocke, J.T.; Morris, S.L.; Gioia, I.M.; Maccacaro, T.; Schild, R.; Wolter, A.; Fleming, T.A.; Henry, J.P. The Einstein Observatory Extended Medium-Sensitivity Survey. II - The optical identifications. Astrophys. J. Suppl. Ser. 1991, 76, 813–874. [Google Scholar] [CrossRef]
- Marcha, M.J.M.; Browne, I.W.A.; Impey, C.D.; Smith, P.S. Optical spectroscopy and polarization of a new sample of optically bright flat radio spectrum sources. Mon. Not. R. Astron. Soc. 1996, 281, 425–448. [Google Scholar] [CrossRef]
- Ghisellini, G.; Maraschi, L.; Tavecchio, F. The Fermi blazars’ divide. Mon. Not. R. Astron. Soc. 2009, 396, L105–L109. [Google Scholar] [CrossRef]
- Böttcher, M. Astrophysical Jets of Blazars and Microquasars. Astrophys. Space Sci. 2007, 307, 69–75. [Google Scholar] [CrossRef]
- Mücke, A.; Protheroe, R.J.; Engel, R.; Rachen, J.P.; Stanev, T. BL Lac objects in the synchrotron proton blazar model. Astropart. Phys. 2003, 18, 593–613. [Google Scholar] [CrossRef]
- Abdo, A.A.; Ackermann, M.; Agudo, I.; Ajello, M.; Aller, H.D.; Aller, M.F.; Angelakis, E.; Arkharov, A.A.; Axelsson, M.; Bach, U.; et al. The Spectral Energy Distribution of Fermi Bright Blazars. Astrophys. J. 2010, 716, 30–70. [Google Scholar] [CrossRef]
- Fan, J.H.; Yang, J.H.; Liu, Y.; Luo, G.Y.; Lin, C.; Yuan, Y.H.; Xiao, H.B.; Zhou, A.Y.; Hua, T.X.; Pei, Z.Y. The Spectral Energy Distributions of Fermi Blazars. Astrophys. J. Suppl. Ser. 2016, 226, 20. [Google Scholar] [CrossRef]
- Ulrich, M.H.; Kinman, T.D.; Lynds, C.R.; Rieke, G.H.; Ekers, R.D. Nonthermal continuum radiation in three elliptical galaxies. Astrophys. J. 1975, 198, 261–266. [Google Scholar] [CrossRef]
- Quinn, J.; Akerlof, C.W.; Biller, S.; Buckley, J.; Carter-Lewis, D.A.; Cawley, M.F.; Catanese, M.; Connaughton, V.; Fegan, D.J.; Finley, J.P.; et al. Detection of Gamma Rays with E > 300 GeV from Markarian 501. Astrophys. J. 1996, 456, L83. [Google Scholar] [CrossRef]
- Punch, M.; Akerlof, C.W.; Cawley, M.F.; Chantell, M.; Fegan, D.J.; Fennell, S.; Gaidos, J.A.; Hagan, J.; Hillas, A.M.; Jiang, Y.; et al. Detection of TeV photons from the active galaxy Markarian 421. Nature 1992, 358, 477. [Google Scholar] [CrossRef]
- Furniss, A.; Noda, K.; Boggs, S.; Chiang, J.; Christensen, F.; Craig, W.; Giommi, P.; Hailey, C.; Harisson, F.; Madejski, G.; et al. First NuSTAR Observations of Mrk 501 within a Radio to TeV Multi-Instrument Campaign. Astrophys. J. 2015, 812, 65. [Google Scholar] [CrossRef]
- Böttcher, M.; Baring, M.G. Multi-wavelength Variability Signatures of Relativistic Shocks in Blazar Jets. Astrophys. J. 2019, 887, 133. [Google Scholar] [CrossRef]
- Kapanadze, B.; Dorner, D.; Romano, P.; Vercellone, S.; Mannheim, K.; Lindfors, E.; Nilsson, K.; Reinthal, R.; Takalo, L.; Kapanadze, S.; et al. The prolonged X-ray flaring activity of Mrk 501 in 2014. Mon. Not. R. Astron. Soc. 2017, 469, 1655–1672. [Google Scholar] [CrossRef]
- Pandey, A.; Gupta, A.C.; Wiita, P.J. X-ray Intraday Variability of Five TeV Blazars with NuSTAR. Astrophys. J. 2017, 841, 123. [Google Scholar] [CrossRef]
- Pandey, A.; Gupta, A.C.; Wiita, P.J. X-ray Flux and Spectral Variability of Six TeV Blazars with NuSTAR. Astrophys. J. 2018, 859, 49. [Google Scholar] [CrossRef]
- Paliya, V.S.; Böttcher, M.; Diltz, C.; Stalin, C.S.; Sahayanathan, S.; Ravikumar, C.D. The Violent Hard X-ray Variability of Mrk 421 Observed by NuSTAR in 2013 April. Astrophys. J. 2015, 811, 143. [Google Scholar] [CrossRef]
- Massaro, E.; Perri, M.; Giommi, P.; Nesci, R. Log-parabolic spectra and particle acceleration in the BL Lac object Mkn 421: Spectral analysis of the complete BeppoSAX wide band X-ray data set. Astron. Astrophys. 2004, 413, 489–503. [Google Scholar] [CrossRef]
- Massaro, E.; Perri, M.; Giommi, P.; Nesci, R.; Verrecchia, F. Log-parabolic spectra and particle acceleration in blazars. II. The BeppoSAX wide band X-ray spectra of Mkn 501. Astron. Astrophys. 2004, 422, 103–111. [Google Scholar] [CrossRef]
- Massaro, E.; Tramacere, A.; Perri, M.; Giommi, P.; Tosti, G. Log-parabolic spectra and particle acceleration in blazars. III. SSC emission in the TeV band from Mkn501. Astron. Astrophys. 2006, 448, 861–871. [Google Scholar] [CrossRef]
- Wierzcholska, A.; Wagner, S.J. X-ray spectral studies of TeV γ-ray emitting blazars. Mon. Not. R. Astron. Soc. 2016, 458, 56–83. [Google Scholar] [CrossRef]
- Harrison, F.A.; Craig, W.W.; Christensen, F.E.; Hailey, C.J.; Zhang, W.W.; Boggs, S.E.; Stern, D.; Cook, W.R.; Forster, K.; Giommi, P.; et al. The Nuclear Spectroscopic Telescope Array (NuSTAR) High-energy X-ray Mission. Astrophys. J. 2013, 770, 103. [Google Scholar] [CrossRef]
- Vaughan, S.; Edelson, R.; Warwick, R.S.; Uttley, P. On characterizing the variability properties of X-ray light curves from active galaxies. Mon. Not. R. Astron. Soc. 2003, 345, 1271–1284. [Google Scholar] [CrossRef]
- Wierzcholska, A.; Siejkowski, H. First hard X-ray observations of the blazar S5 0716+714 with NuSTAR during a multiwavelength campaign. Mon. Not. R. Astron. Soc. 2016, 458, 2350–2359. [Google Scholar] [CrossRef]
- Madsen, K.K.; Harrison, F.A.; Markwardt, C.B.; An, H.; Grefenstette, B.W.; Bachetti, M.; Miyasaka, H.; Kitaguchi, T.; Bhalerao, V.; Boggs, S.; et al. Calibration of the NuSTAR High-energy Focusing X-ray Telescope. Astrophys. J. Suppl. Ser. 2015, 220, 8. [Google Scholar] [CrossRef]
- Kalberla, P.M.W.; Burton, W.B.; Hartmann, D.; Arnal, E.M.; Bajaja, E.; Morras, R.; Pöppel, W.G.L. The Leiden/Argentine/Bonn (LAB) Survey of Galactic HI. Final data release of the combined LDS and IAR surveys with improved stray-radiation corrections. Astron. Astrophys. 2005, 440, 775–782. [Google Scholar] [CrossRef]
- Ghisellini, G.; Tavecchio, F. Rapid variability in TeV blazars: The case of PKS2155-304. Mon. Not. R. Astron. Soc. 2008, 386, L28–L32. [Google Scholar] [CrossRef]
- Pandey, A.; Gupta, A.C.; Wiita, P.J.; Tiwari, S.N. Optical Flux and Spectral Variability of the TeV Blazar PG 1553+113. Astrophys. J. 2019, 871, 192. [Google Scholar] [CrossRef]
- Pandey, A.; Gupta, A.C.; Kurtanidze, S.O.; Wiita, P.J.; Damljanovic, G.; Bachev, R.; Zhang, J.; Kurtanidze, O.M.; Darriba, A.; Chigladze, R.A.; et al. Optical Variability of the TeV Blazar 1ES 0806+524 on Diverse Timescales. Astrophys. J. 2020, 890, 72. [Google Scholar] [CrossRef]
- Marscher, A.P. Turbulent, Extreme Multi-zone Model for Simulating Flux and Polarization Variability in Blazars. Astrophys. J. 2014, 780, 87. [Google Scholar] [CrossRef]
- Aharonian, F.; Akhperjanian, A.G.; Bazer-Bachi, A.R.; Behera, B.; Beilicke, M.; Benbow, W. An Exceptional Very High Energy Gamma-Ray Flare of PKS 2155-304. Astrophys. J. 2007, 664, L71–L74. [Google Scholar] [CrossRef]
- Albert, J.; Aliu, E.; Anderhub, H.; Antoranz, P.; Armada, A.; Baixeras, C.; Barrio, J.A.; Bartko, H.; Bastieri, D.; Becker, J.K.; et al. Variable Very High Energy γ-Ray Emission from Markarian 501. Astrophys. J. 2007, 669, 862–883. [Google Scholar] [CrossRef]
- Giannios, D.; Uzdensky, D.A.; Begelman, M.C. Fast TeV variability in blazars: Jets in a jet. Mon. Not. R. Astron. Soc. 2009, 395, L29–L33. [Google Scholar] [CrossRef]
- Marscher, A.P.; Gear, W.K. Models for high-frequency radio outbursts in extragalactic sources, with application to the early 1983 millimeter-to-infrared flare of 3C 273. Astrophys. J. 1985, 298, 114–127. [Google Scholar] [CrossRef]
- Camenzind, M.; Krockenberger, M. The lighthouse effect of relativistic jets in blazars - A geometric origin of intraday variability. Astron. Astrophys. 1992, 255, 59–62. [Google Scholar]
- Villata, M.; Raiteri, C.M. Helical jets in blazars. I. The case of MKN 501. Astron. Astrophys. 1999, 347, 30–36. [Google Scholar]
- Böttcher, M.; Hivick, B.; Dashti, J.; Fultz, K.; Gupta, S.; Gusbar, C.; Joshi, M.; Lamerato, A.; Peery, T.; Principe, D.; et al. Optical Spectral Variability of the Very High Energy Gamma-ray Blazar 1ES 1011+496. Astrophys. J. 2010, 725, 2344–2348. [Google Scholar] [CrossRef][Green Version]
- Zhang, Y.H.; Treves, A.; Celotti, A.; Chiappetti, L.; Fossati, G.; Ghisellini, G.; Maraschi, L.; Pian, E.; Tagliaferri, G.; Tavecchio, F. Four Years of Monitoring Blazar PKS 2155-304 with BeppoSAX: Probing the Dynamics of the Jet. Astrophys. J. 2002, 572, 762–785. [Google Scholar] [CrossRef]
- Aggrawal, V.; Pandey, A.; Gupta, A.C.; Zhang, Z.; Wiita, P.J.; Yadav, K.K.; Tiwari, S.N. X-ray intraday variability of the TeV blazar Mrk 421 with Chandra. Mon. Not. R. Astron. Soc. 2018, 480, 4873–4883. [Google Scholar] [CrossRef]
- Landau, R.; Golisch, B.; Jones, T.J.; Jones, T.W.; Pedelty, J.; Rudnick, L.; Sitko, M.L.; Kenney, J.; Roellig, T.; Salonen, E.; et al. Active extragalactic sources—Nearly simultaneous observations from 20 centimeters to 1400 A. Astrophys. J. 1986, 308, 78–92. [Google Scholar] [CrossRef]
- Zhang, Y.H. XMM-Newton Observations of the TeV BL Lacertae Object PKS 2155-304 in 2006: Signature of Inverse Compton X-ray Emission? Astrophys. J. 2008, 682, 789–797. [Google Scholar] [CrossRef]
| 1 | HBL belongs to HSP subclass. |
| 2 | |
| 3 | |
| 4 | |
| 5 | |
| 6 | |
| 7 | F-test is available in the XSPEC. |
| 8 | Degree of freedom. |
Figure 1.
NuSTAR light curves of the TeV blazar Mrk 501. The MJD of observation is given in each plot.
Figure 1.
NuSTAR light curves of the TeV blazar Mrk 501. The MJD of observation is given in each plot.

Figure 2.
The variation of hardness ratio (HR) with respect to 3–79 keV flux (in the units of count rates). The MJD of observation, correlation coefficient (r), and the null hypothesis probability (p) are given in each plot.
Figure 2.
The variation of hardness ratio (HR) with respect to 3–79 keV flux (in the units of count rates). The MJD of observation, correlation coefficient (r), and the null hypothesis probability (p) are given in each plot.

Figure 3.
(a,b) NuSTAR spectra of TeV HBL Mrk 501 with the best fitting model in the upper panel and the ratio (data/model) in the bottom panel of each plot. The observation ID, MJD of observation, and the best fitting model are given in each plot.
Figure 3.
(a,b) NuSTAR spectra of TeV HBL Mrk 501 with the best fitting model in the upper panel and the ratio (data/model) in the bottom panel of each plot. The observation ID, MJD of observation, and the best fitting model are given in each plot.


Table 1.
Observation log of Nuclear Spectroscopic Telescope Array (NuSTAR) data for TeV HBL Markarian (or Mrk) 501.
Table 1.
Observation log of Nuclear Spectroscopic Telescope Array (NuSTAR) data for TeV HBL Markarian (or Mrk) 501.
| Obs. ID | Obs. Date | Start Time (UT) | MJD (1) Start | Exposure | Total Elapsed |
|---|---|---|---|---|---|
| yyyy-mm-dd | hh-mm-ss | Time (ks) | Time (ks) | ||
| 60002024002 | 2013-04-13 | 02:31:07 | 56,395.11465 | 18.08 | 35.76 |
| 60002024004 | 2013-05-08 | 20:01:07 | 56,420.84450 | 25.76 | 55.20 |
| 60002024006 | 2013-07-12 | 21:31:07 | 56,485.90848 | 10.21 | 20.90 |
| 60002024008 | 2013-07-13 | 20:16:07 | 56,486.85136 | 9.98 | 20.71 |
| 60202049002 | 2017-04-27 | 22:26:09 | 57,870.94373 | 22.05 | 48.73 |
| 60202049004 | 2017-05-24 | 22:11:09 | 57,897.93135 | 23.67 | 48.30 |
| 60466006002 | 2018-04-19 | 15:06:09 | 58,227.63108 | 23.11 | 44.01 |
MJD (Modified Julian Date) = JD (Julian Date)-2400000.5.
Table 2.
Hard X-ray variability properties of Mrk 501.
| Obs. ID | MJD | |||
|---|---|---|---|---|
| Soft (3–10 keV) | Hard (10–79 keV) | Total (3–79 keV) | ||
| 60002024002 | 56,395 | − | − | − |
| 60002024004 | 56,420 | |||
| 60002024006 | 56,485 | |||
| 60002024008 | 56,486 | |||
| 60202049002 | 57,870 | |||
| 60202049004 | 57,897 | − | − | − |
| 60466006002 | 58,227 | − | ||
Table 3.
Model fits to the NuSTAR spectra of Mrk 501.
| Obs. ID | Power Law | Log-Parabola ( keV) | Flux | F-Test | p-Value | |||
|---|---|---|---|---|---|---|---|---|
| () | () | |||||||
| 60002024002 | 683.48/651 (1.04) | 649.73/650 (0.99) | 9.75 × 10 | |||||
| 60002024004 | 937.49/834 (1.12) | 899.86/833 (1.08) | 5.22 × 10 | |||||
| 60002024006 | 1002.01/865 (1.15) | 917.77/864 (1.06) | 3.09 × 10 | |||||
| 60002024008 | 903.40/804 (1.12) | 767.64/803 (0.95) | 2.90 × 10 | |||||
| 60202049002 | 738.43/670 (1.10) | 717.37/669 (1.07) | 1.092 × 10 | |||||
| 60202049004 | 390.07/406 (0.96) | 384.27/405 (0.94) | ||||||
| 60466006002 | 268.94/302 (0.89) | 265.76/301 (0.88) | ||||||
3–79 keV unabsorbed flux (in units of erg cm s) for the best fitted model.
© 2020 by the author. Licensee MDPI, Basel, Switzerland. This article is an open access article distributed under the terms and conditions of the Creative Commons Attribution (CC BY) license (http://creativecommons.org/licenses/by/4.0/).
Share and Cite
MDPI and ACS Style
Pandey, A. NuSTAR View of TeV Blazar Mrk 501. Galaxies 2020, 8, 55. https://doi.org/10.3390/galaxies8030055
AMA Style
Pandey A. NuSTAR View of TeV Blazar Mrk 501. Galaxies. 2020; 8(3):55. https://doi.org/10.3390/galaxies8030055
Chicago/Turabian StylePandey, Ashwani. 2020. "NuSTAR View of TeV Blazar Mrk 501" Galaxies 8, no. 3: 55. https://doi.org/10.3390/galaxies8030055
APA StylePandey, A. (2020). NuSTAR View of TeV Blazar Mrk 501. Galaxies, 8(3), 55. https://doi.org/10.3390/galaxies8030055
Note that from the first issue of 2016, this journal uses article numbers instead of page numbers. See further details here.