Review

Rotation Curve of the Milky Way and the Dark Matter Density

Institute of Astronomy, Graduate School of Sciences, The University of Tokyo, Mitaka, Tokyo 181-0015, Japan
Galaxies 2020, 8(2), 37; https://doi.org/10.3390/galaxies8020037
Submission received: 12 February 2020 / Revised: 14 April 2020 / Accepted: 20 April 2020 / Published: 29 April 2020

Abstract

:
We review the current status of the study of rotation curve (RC) of the Milky Way, and present a unified RC from the Galactic Center to the galacto-centric distance of about 100 kpc. The RC is used to directly calculate the distribution of the surface mass density (SMD). We then propose a method to derive the distribution of dark matter (DM) density in the in the Milky Way using the SMD distribution. The best-fit dark halo profile yielded a local DM density of ρ = 0.36 ± 0.02 GeV cm 3 . We also review the estimations of the local DM density in the last decade, and show that the value is converging to a value at ρ = 0.39 ± 0.09 GeV cm 3 .

1. Introduction

The rotation curve (RC) of the Milky Way has been obtained by observations of galactic objects in the non-MOND (MOdified Newtonian Dynamics) framework. The existence of the dark halo (DH) has been confirmed by the analysis of the observed RCs, assuming that Newtonian dynamics applies evenly to the result of the observations. In this article, current works of RC observations are briefly reviewed, and a new estimation of the local dark matter (DM) density is presented in the framework of Newtonian dynamics.
An RC is defined as the mean circular velocity V rot around the nucleus plotted as a function of the galacto-centric radius R. Non-circular streaming motion due to the tri-axial mass distribution in a bar is crucial for kinematics in the innermost region, though it does not affect the mass determination much in the disk and halo. Spiral arms are another cause for local streaming, which affect the mass determination by several percent, while they do not influence the mass determination of the dark halo much.
There are several reviews on RCs and mass determination of galaxies [1,2,3]. In this review, we revisit recent RC studies and determination of the local DM density in our Milky Way. In Section 2, we briefly review the current status of the RC determinations along with the methods. In Section 3, we propose a new method to use the surface mass density (SMD) directly calculated from a unified RC to estimate the local DM density, and apply it to the newest RC of the Milky Way up to radius of ∼100 kpc. We adopt the galactic constants: ( R 0 , V 0 ) = (8.0 kpc, 238 km s 1 ) [4,5], where R 0 is the distance of the Sun from the galactic center (GC) and V 0 is the circular velocity of the local standard of rest (LSR) at the Sun [6].

2. Rotation Curve of the Milky Way

2.1. Progress in the Last Decades

The galactic RC is dependent on the galactic constants. Accordingly, the uncertainty and error in the RC include uncertainties of the constants. Currently recommended, determined, or measured values are summarized in Table 1, where they appear to be converging to around ∼8.0–8.3 and ∼240 km s 1 . In this paper, we adopt R 0 = 8.0 kpc and V 0 = 238 km s 1 from the recent measurements with VERA (VLBI Experiments for Radio Astrometry) [4,5].
The RC of the galaxy has been obtained by various methods as described in the next subsection, and many authors presented their results based on different galactic constants (Table 2).
In the 1970–1980s, the inner RC was extensively measured using the terminal-velocities of HI (neutral hydrogen) and CO (carbon monoxide) gases [13,15,37]. In the late 1980s to the 2000s, outer rotation velocities were measured by combining optical distances of OB [14,38]. The HI thickness method was also useful to measure rotation of the entire disk [39,40]. The innermost mass distributions inside the GC have been obtained extensively since the 1990s using the motion of infrared stellar objects [9,10,17,41].
Trigonometric determinations of both the 3D positions and velocities have provided the strongest tool to date for measurement of the galactic rotation [4,5,42,43,44].
A number of optical parallax measurements of stars such with GAIA have been obtained for RC determination [20,30].
The total mass of the galaxy, including the extended dark halo, has been measured by analyzing the outermost RC and motions of satellite galaxies orbiting the galaxy, and the mass up to ∼100–200 kpc has been estimated to be ∼ 3 × 10 11 M [36,45].

2.2. Methods to Determine the Galactic RC

The particular location of the Sun inside the Milky Way makes it difficult to measure the rotation velocity of the galactic objects. Sophisticated methods have been developed to solve this problem, as briefly described below.

2.2.1. Tangent-Velocity Method

Inside the solar circle ( 90 ° l 90 ° ), the galactic gas disk has tangential points, at which the rotation velocity is parallel to the line of sight and attains the maximum radial velocity v r max (terminal or tangent-point velocity). The rotation velocity V ( R ) at galacto-centric distance R = R 0 sin l is calculated simply correcting for the solar motion.

2.2.2. Radial-Velocity + Distance Method

If the distance r of the object is measured by spectroscopic and/or trigonometric observations, the rotation velocity is obtained by geometric conversion of the radial velocity, distance, and the longitude. The distance has to be measured independently, often using spectroscopic distances of OB stars, and the distances are assumed to be the same as those of associated molecular clouds and HII (ionized hydrogen) regions, whose radial velocities are observed by radio lines. Since the photometric distances have often large errors, obtained RC plots show large scatter.

2.2.3. Trigonometric Method

If the proper motion and radial velocity along with the distance are measured at the same time, or from different observations, the 3D velocity vector, and therefore the rotation velocity, of any source is uniquely determined without being biased by assumption of circular motion as well as the galactic constants. VLBI (very long baseline interferometer) measurements of maser sources [4,5,42,44] and optical/IR trigonometry of stars [20,46] have given the most accurate RC.

2.2.4. Disk-Thickness Method

The errors in the above methods are mainly caused by the uncertainty of the distance measurements. This disadvantage is eased by the HI-disk thickness method [39,40]. The angular thickness of the HI disk along an annulus ring is related to can be used to determine the rotation velocity by combining with radial velocity distribution along the longitude.

2.2.5. Pseudo-RC from Non-Disk Objects

Beyond or outside the galactic disk, globular clusters and satellite galaxies are used to estimate the pseudo-circular velocity from their radial velocities based on the Virial theorem, assuming that their motions are at random, or the rotation velocity is calculated by V rot 2 v g , where v g is the galacto-centric radial velocity. On the other hand, Huang et al. (2016) [29] have recently employed more sophisticated, probably more reliable, method to solve the Jeans equations for the non-disk stars and clusters.

2.3. Unified RC

A RC covering a wide region of the galaxy has been obtained by compiling the existing data by re-scaling the distances and velocities to the common galactic constants ( R 0 , V 0 ) = (8.0 kpc, 200 km s 1 ) [34], and later to (8.0 kpc, 238 km s 1 ) [1,35]. In these works, the central RC inside the GC has been obtained from analyses of the kinematics of the molecular gas and infrared stellar motions as well as the supposed Keplerian motion representing the central massive black hole. Outer RC beyond R∼30 kpc has been determined from the radial motions of satellite galaxies and globular clusters.
The RC determination has been improved recently by compiling a large amount of data from a variety of spectroscopic as well as trigonometric measurements from radio to optical wavelengths. An extensive compilation of the data of rotation velocities of the galactic disk has been published recently, and is available as an internet data base [25,26,27,28,47,48].
Figure 1a shows the presently obtained unified RC using the curves from [1,36] and RC by Huang et al. (2016) between R = 4.6 and ∼100 kpc. Although Huang et al. [29] employed the galactic constants of (8.34 pc, 240 km s 1 ), we did not apply rescaling to (8.0, 238), because the galacto-centric distances of off-plane objects are less dependent on the solar position compared to the disk objects as used for our RC at < 20 kpc where the rotation velocity is rather flat, and also because their V 0 = 240 km s 1 is close to our 238 km s 1 .
The unified RC was obtained by taking Gaussian running averages of rotation velocities from the used RCs in each of newly settled radius bins, where the statistical weight of each input point was given by the inverse of the squared error.
In Figure 1b-d we compare the unified RC with the recent measurements by [27,28,30] re-scaled to the galactic constants of (8.0 kpc, 238 km s 1 ) following the method described in [34]. Although individual data points are largely scattered, their averages well coincide with the unified RC. In the figures we also compare the data with the RC by [29] up to ∼100 kpc without rescaling, which also coincides with the other data within the scatter.
We here comment on the property of the unified RC built by averaging the published data. It must be remembered that the averaging procedure does not satisfy the condition of statistics in the strict meaning, because the data are compiled from different authors using a variety of instruments and analysis methods, which makes it difficult to evaluate common statistical weights for the used data points. So, remembering such a property, in view that the unified RC well approximates the original curves as well as for its convenience for the determination of the mass distribution by the least-squares and/or χ 2 fitting, we shall employ it in our present analysis.

2.4. Mass Components

The rotation velocity is related to the gravitational potential, hence to the mass distribution, as
V ( R ) = Σ V i 2 = R Σ Φ i R ,
where Φ i is the gravitational potential of the i-th component and V i is the corresponding circular velocity. The rotation velocity is often represented by superposition of the central black hole (BH), bulge, disk, and the dark halo as
V ( R ) = V BH ( R ) 2 + V b ( R ) 2 + V d ( R ) 2 + V h ( R ) 2 .
Here, the subscript BH represents black hole, b stands for bulge, d for disk, and h for the dark halo. The contribution from the black hole can be neglected in sufficiently high accuracy, when the dark halo is concerned. The mass components are usually assumed to have the following functional forms.

2.4.1. Massive Black Hole

The GC of the Milky Way is known to nest a massive black hole of mass of M BH 4 × 10 6 M [9,10,17]. The RC is assumed to be expressed by a curve following the Newtonian potential of a point mass at the nucleus.

2.4.2. De Vaucouleurs Bulge

The commonly used SMD profile to represent the central bulge, which is assumed to be proportional to the empirical optical profile of the surface brightness, is the de Vaucouleurs law [49],
Σ b ( R ) = Σ be exp 7.6695 R R b 1 / 4 1 ,
where Σ be is the value at radius R b enclosing a half of the integrated surface mass [1]. Note that the de Vaucouleurs surface profile, also the exponential disk, has a finite value at the center. The volume mass density ρ ( r ) at radius r for a spherical bulge is calculated using the SMD by
ρ ( r ) = 1 π r d Σ b ( x ) d x 1 x 2 r 2 d x ,
and the mass inside R is
M ( R ) = 4 π 0 R r 2 ρ ( r ) d r .
The circular velocity is thus obtained by
V b ( R ) = G M ( R ) R .
More general form e ( R / r e ) n called the the Sérsic law is discussed in relation to its dynamical relation to the galactic structure based on the more general profile [50,51].

2.4.3. Exponential Disk

The galactic disk is generally represented by an exponential disk [52],where the SMD is expressed as
Σ d ( R ) = Σ d exp ( R / R d ) .
Here, Σ d is the central value, R d is the scale radius. The total mass of the exponential disk is given by M disk = 2 π Σ d c R d 2 . The RC for a thin exponential disk is expressed by [53]
V d ( R ) = 4 π G Σ 0 R d y 2 [ I 0 ( y ) K 0 ( y ) I 1 ( y ) K 1 ( y ) ] ,
where y = R / ( 2 R d ) , and I i and K i are the modified Bessel functions.
The dark halo is described in the next section.

3. Dark Halo

The existence of dark halos in spiral galaxies has been firmly evidenced from the well established difference between the galaxy mass predicted by the luminosity and the mass predicted by the rotation velocities [1,2,3].
In the Milky Way, extensive analyses of RC and motions of non-disk objects such as globular clusters and dwarf galaxies in the Local Group have shown flat rotation up to ∼30 kpc, beyond which the RC declines smoothly up to ∼300 kpc [35,36]. Further analyses of non-disk tracer objects have also shown that the outer RC declines in a similar manner [19,29,54]. The fact that the rotation velocity beyond R∼30 kpc declines monotonically indicates that the isothermal model can be ruled out in representing the Milky Way’s halo.

3.1. Dark Halo Models

There have been various proposed DH models, which may be categorized into two types: The cored halo models [55,56,57] are a modification of the isothermal model with a steeper decrease of density at large radii. The central cusp models [58,59,60,61] are based on extensive N-body numerical simulations of the structural evolution in the cold dark matter scenario in the expanding universe, which predict an infinitely increasing central peak. In either type, all the DH models predict decreasing DM density beyond h as ρ R 3 , or declining rotation velocity as V rot ln R / R .
The cored halo models exhibit a central plateau of finite density with scale radius, or the core radius, h, and are often represented by the following functions, where x = R / h .
Isothermal halo:
ρ Iso ( x ) = ρ Iso 0 1 + x 2 ,
Beta model with β = 1 [58] :
ρ β ( x ) = ρ β 0 ( 1 + x 2 ) 3 / 2 .
Burkert model [55,56] :
ρ Bur ( x ) = ρ Bur 0 ( 1 + x ) ( 1 + x 2 ) ,
Brownstein model [57] :
ρ Bro ( x ) = ρ Bro 0 1 + x 3 .
On the other hand, the central cusp models are often represented by the following functions.
NFW model [59,62] :
ρ NFW ( x ) = ρ NFW 0 x ( 1 + x ) 2 ,
Moore model [60,61] with α = 1.5 :
ρ Moo ( x ) = ρ Moo 0 x α ( 1 + x 3 α ) = ρ Moo 0 x 1.5 ( 1 + x 1.5 ) .
Figure 2 shows schematic density profiles for various DH models with h = 10 kpc combined with the de Vaucouleurs bulge and exponential disk, where the halo density is normalized at R = 20 kpc.

3.2. Cusp vs Cored Halo

The density profiles for the NFW (Navarro, Frenk and White), Moore, Burkert, β , and Brownstein models are almost identical beyond the core radius h, where they tend to R 3 . Differences among the models appear within the Solar circle. The cusp models (NFW and Moore models) predict steep increase of density toward the center with a singularity. The cored halo models predict a mild and low density plateau in the center with the peak densities not much differing from each other within a factor of two. However, the Burkert model has a singularity with the density gradient being not continuous across the nucleus.
Most of the DH models predict lower density in the innermost galaxy by two to several orders of magnitudes than the bulge’s density. This implies that the DH does not much influence the kinematics in the inner galaxy. Namely, it is practically impossible to detect the DM cusp by analyzing the RC. Only the Moore model predicts cusp density exceeding the bulge’s density in the very center at R < 0.1 pc, whereas the applicability of the model to such small sized region is not obvious [61].

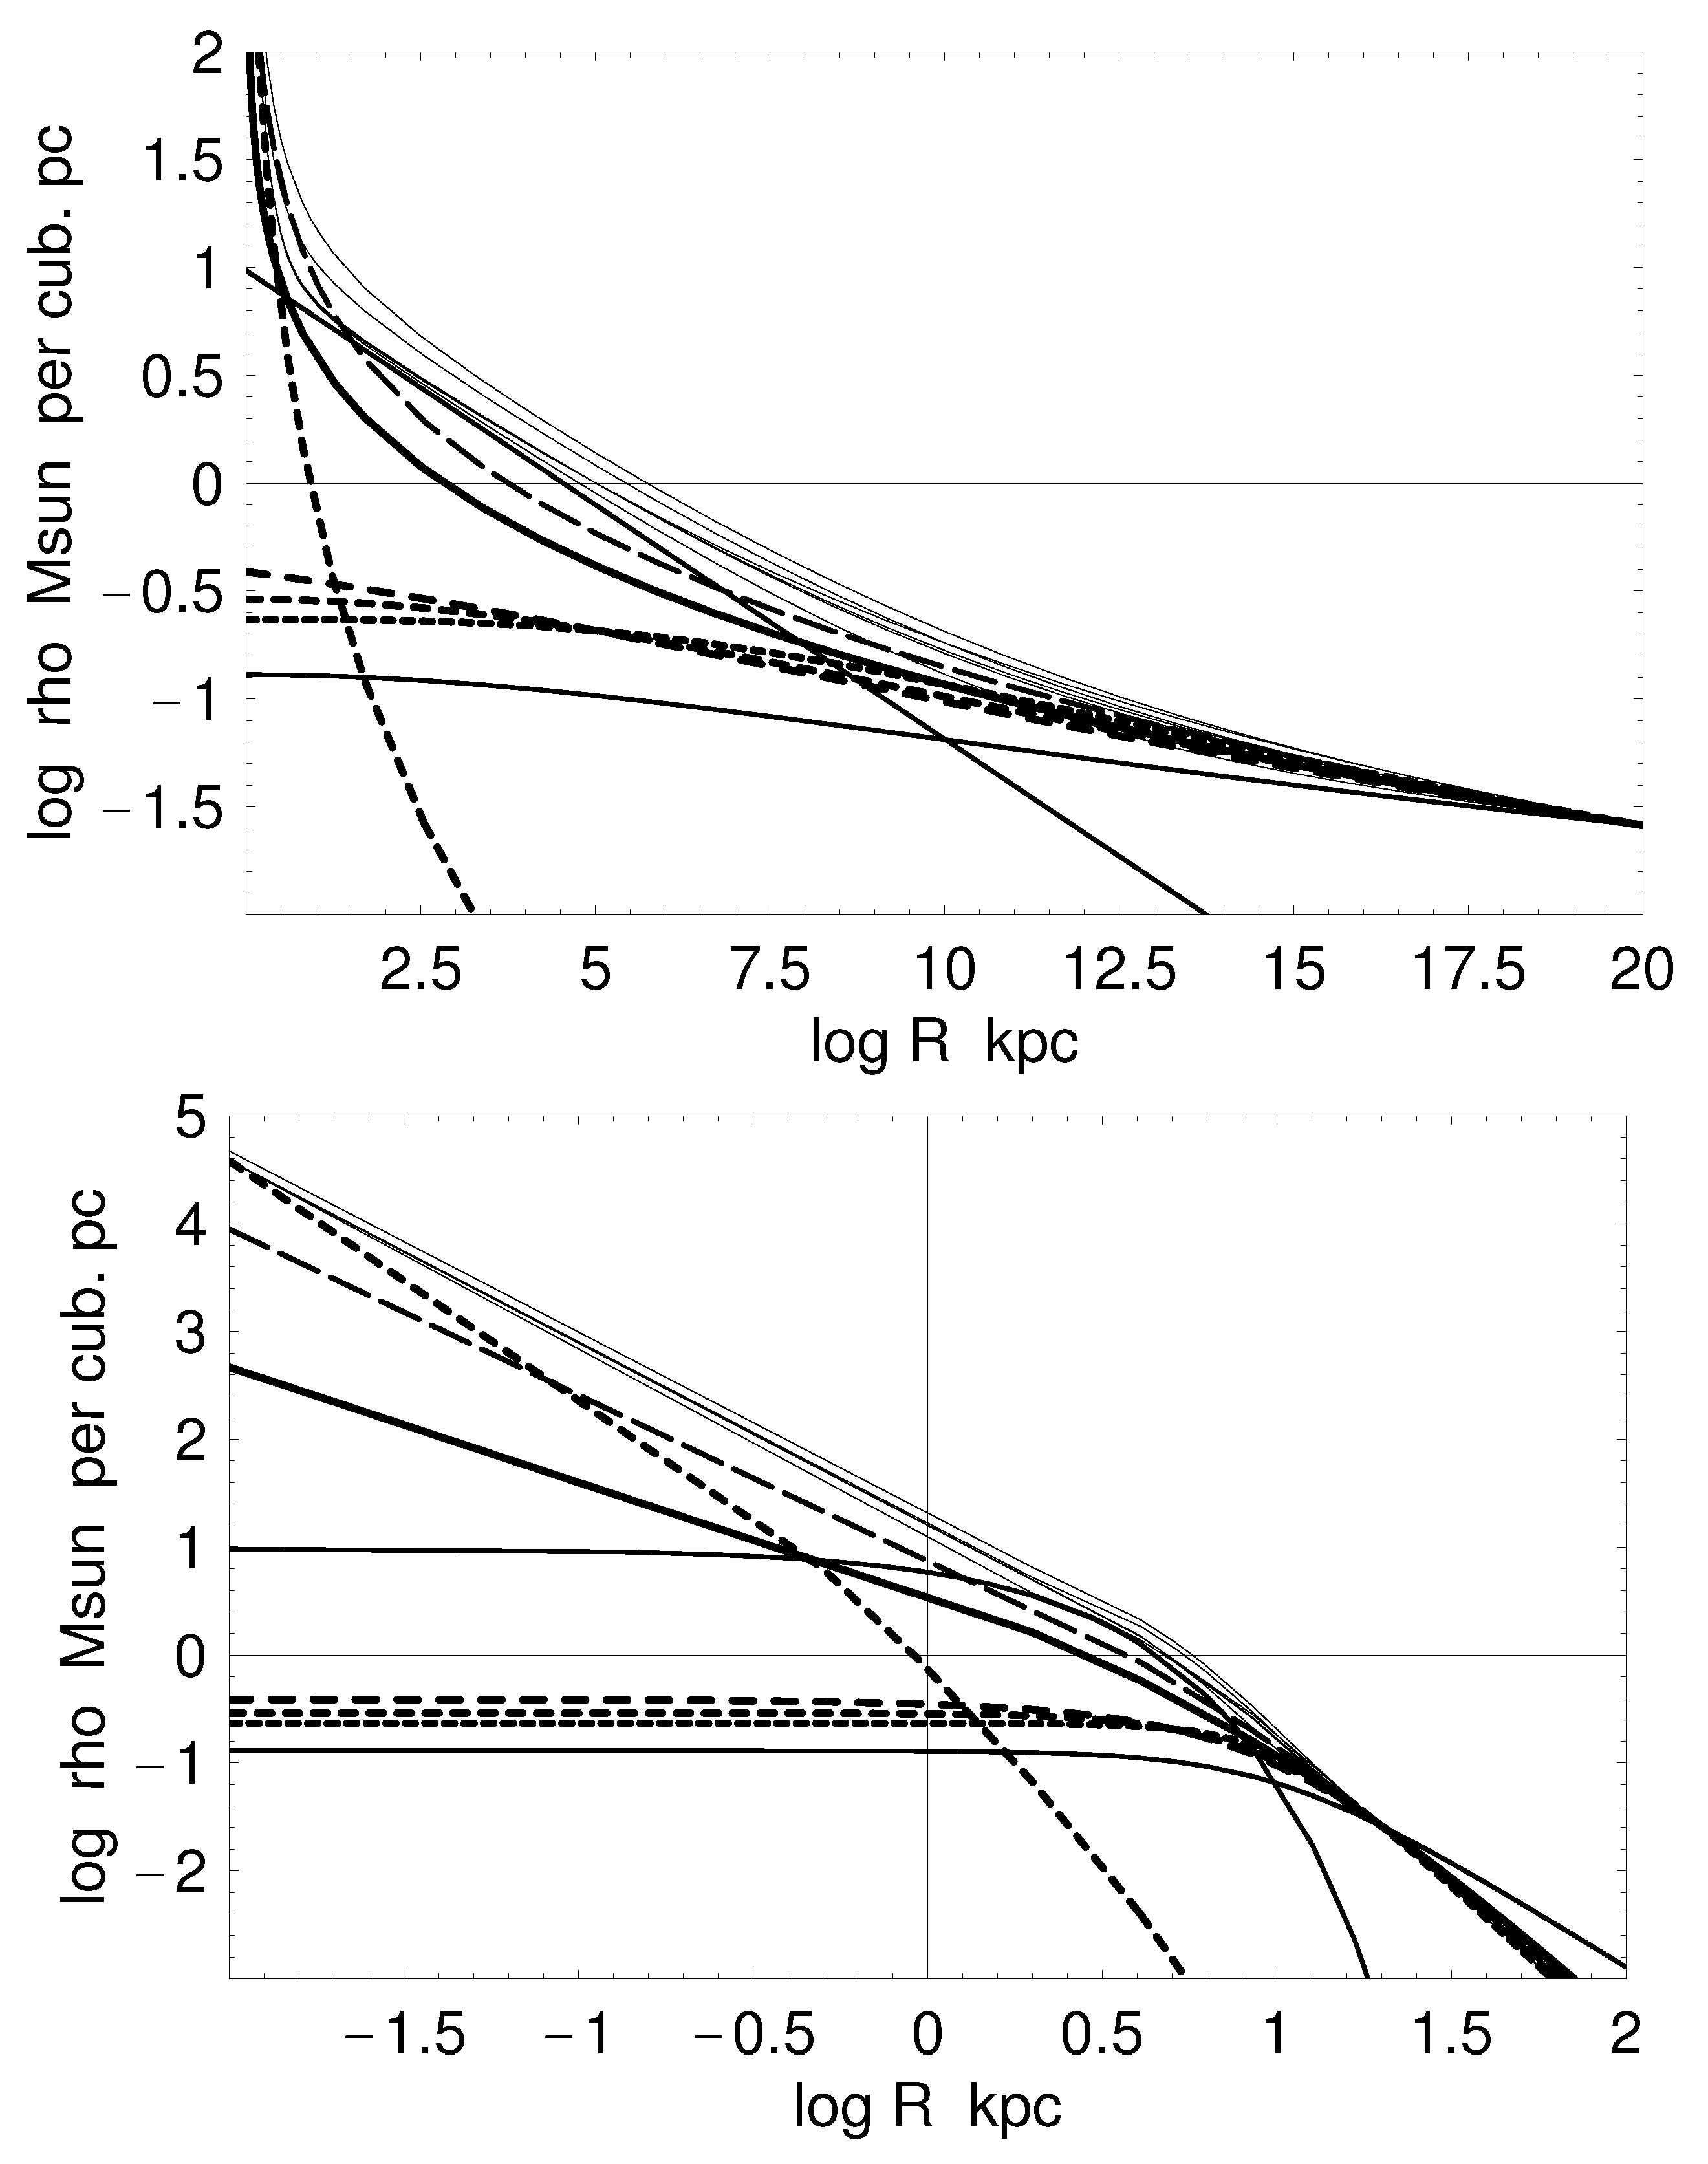
3.3. Central DM Density

If we assume that the functional form of the NFW model is valid in the very central region, the SMD at R∼100 pc could be estimated to be about Σ 2.2 × 10 3 M pc 2 . This yields an approximate volume density on the order of ρ Σ / R 11 M pc 3 ∼840 GeV cm 3 for a detector of ∼ 1.4 ° resolution.
Such estimations could be a key to the indirect detection experiments of DM in the GC [63,64] and the literature therein). However, it is stressed that the DM density in the GC is two to several orders of magnitudes smaller than the bulge’s density on the order of 10 4 10 5 GeV cm 3 , making the kinematical detection of DM difficult.
Interestingly, the column density of DM, hence brightness (flux/steradian) of self-annihilation emission ( γ -ray) stays almost constant against the radius and is therefore constant regardless the resolution of the detector. On the other hand, the emission measure ∼ ρ 2 R varies as R 1 , hence, the brightness of collision-origin emission ( γ or microwave haze) increases toward the center (e.g., [65]), so that the detection rate will increase with the detector’s resolution.
Another concern about the DM cusp is the kinetic energy of individual particles. In order for the cusp to be stationary, the particles must be bound to the gravitational potential, so that the particle’s speed must be lower than the escaping velocity v 2 V rot ∼300 km s 1 . This will give a constraint on the cross section σ A of the DM annihilation, if the collision rate σ A v is fixed by the detection of DM-origin emissions.
The cored halo models (isothermal, Burkert, Brownstein, and the β models) predict a mild and finite-density plateau with scale radius of h (∼10 kpc). Their central densities are also several orders of magnitude less than the bulge’s density, hence do not contribute to the kinematics of the gas and stars in the GC.
Finally, it is emphasized that the discussion of a central DM cusp has been obtained based on the theoretical predictions, but neither on any observed phenomenon nor on measured quantity from the RC or kinematics of GC objects. This makes a strong contrast to the observed fact of the dark halo in the outer galaxy, firmly evidenced by the analyses of the RC.

4. DM Density from Direct SMD

4.1. SMD from RC

In the decomposition method of the RC, the resulting mass distribution depend on the assumed functional forms of the model profiles. In order to avoid this inconvenience, the RC can be used to directly calculate the surface mass distribution without employing any functional form. Only an assumption has to be made, either if the galaxy’s shape is a sphere or a flat disk.
On the assumption of spherical distribution, the mass inside radius R is given by
M ( R ) = R V ( R ) 2 G .
Then the surface-mass density (SMD) Σ S ( R ) at R is calculated by
Σ S ( R ) = 2 0 ρ ( r ) d z ,
where
ρ ( r ) = 1 4 π r 2 d M ( r ) d r .
If the galaxy is assumed to be a flat thin disk, the SMD Σ d ( R ) is calculated by solving Poisson’s equation ([52,53]) by
Σ d ( R ) = 1 π 2 G 1 R 0 R d V 2 d r x K x R d x + R d V 2 d r x K R x d x x .
Here, K is the complete elliptic integral, which becomes very large when x R .
The SMD distributions in the galaxy for the sphere and flat-disk cases have been calculated for the recent RCs [1]. In this paper we apply the same method to the here obtained unified RC (Figure 1). Since we aim at studying the dark halo, which is postulated to be rather spherical than a flat disk, we assume spherical mass distribution. The calculated SMD distribution is shown in Figure 3.
The SMD is strongly concentrated toward the center, reaching a value as high as ∼ 10 5 M pc 2 within R∼10 pc, representing the core of the central bulge with the extent of several hundred pc. It is followed by a straightly declining profile from R∼2 to 8 kpc in the semi-logarithmic plot, representing the exponential nature of the galactic disk. In the outer galaxy beyond ∼8 kpc, the SMD profile tends to be displaced from the straight disk profile, and is followed by an extended outskirt with a slowly declining profile, representing a massive halo extending to the end of the RC measurement at ∼100 kpc.

4.2. Fitting by Bulge, Disk, and Dark Halo

In order to separate the dark halo from the disk and bulge components, the well established RC decomposition method has been extensively applied to the RCs [1,3]. Besides this traditional method, we here propose to use the SMD distribution. For this, we assume three mass components of de Vaucouleurs bulge, exponential disk, and dark halo. In order to represent the, we employ the NFW profile as a ’tool’ for its popularity and for the dynamics background based on the extensive numerical simulations.
We employ the least χ 2 fitting method, where χ 2 is defined by
χ 2 = Σ i [ ( S M D i direct S M D i calc ) / σ i ] 2 ,
with i denoting the value at the i-th data point, and σ i is the standard deviation around each data point in the running averaging procedure of the SMD distribution.
Fitting parameters are the scale radius a d and central SMD Σ d 0 for the disk, and the scale (core) radius h and representative DM density ρ model 0 for the halo. The bulge SMD is fixed to an assumed de Vaucouleurs profile, which is negligible in the present fitting range at R 1 kpc.
The fitting was obtained between R = 1 and 100 kpc. The fitting result for the NFW halo model is shown in Figure 3. The solid line is the χ 2 fit to SMD, and red, blue, and dashed lines represent the halo, disk, and bulge components, respectively. Note that the semi-logarithmic plot makes it visually easier to recognize the dark halo significantly displaced from the exponential disk, which appears as a straight line.
The present method to fit the SMD distribution is essentially the same as that to fit the RC in the sense that both the methods search for a set of four parameters ( a d , Σ d , h, and ρ model 0 ) that minimize χ 2 either of SMD or of RC. However, an advantage in using SMD is to make it visually easier to discriminate the disk from the halo in the semi-logarithmic plots (Figure 3), where the disk appears as a straight line.

4.3. Local DM Density

We thus obtained the NFW DM halo parameters to be h = 10.94 ± 1.05 kpc, ρ NFW 0 = 0.787 ± 0.037 GeV cm 3 , which yields the local DM density ρ = 0.359 ± 0.017 GeV cm 3 . The best-fit parameters for the disk are determined to be a d = 4.38 ± 0.35 kpc and Σ 0 = ( 1.28 ± 0.09 ) × 10 3 M pc 2 . Table 3 lists the fitted result along with the minimized χ 2 value.
We also obtained χ 2 fitting using the Burkert, Brownstein, and β profiles, and listed the local DM density and minimized χ 2 in Table 3. In these three models, the χ 2 ∼17–18 were found to be systematically greater than that for the NFW model ( χ 2 = 11.9 ). The reason for the difference is due to the systematic difference in the functional behavior between NFW and the other three models: NFW has a cusp steeply increasing toward the center with sharpening scale radius, which results in the possibility of finer fitting to the slightly curved SMD profile at R < 10 kpc in the semi-log plot. On the contrary, the other three models predict almost negligible SMD there, so that halo parameters contribute less intensively to the fitting in the innermost region, or the fitting must be done only by the disk’s two parameters there, resulting in worse fitting.
The local DM density is a key quantity in laboratory experiments by the direct detection of DM, and has been estimated by a number of authors with a variety of methods. In Table 4 we list the local DM densities from the literature along with the present value for NFW profile. They are also plotted in Figure 4 against publication years. The ρ values seem to be nearly constant in the decade. Averaging all the listed values with an equal weighting yields ρ = 0.39 ± 0.09 GeV cm 3 , which may be taken as a ‘canonical’ value.

4.4. Dependence on the Galactic Constants

We have re-scaled the adopted RC to ( R 0 , V 0 ) = ( 8.0 , 238 ) (kpc, km s 1 ), which may vary within several %. The resulting local DM density will vary accordingly, depending on the constants. The local mass density of the spherical component is dependent on the constants as ρ 0 R 0 V 0 2 / R 0 3 V 0 2 R 0 2 . For small corrections δ V 0 and δ R 0 , the DM density will change as δ ρ 0 / ρ 0 2 ( δ V 0 / V 0 δ R 0 / R 0 ) . For example, for δ V 0 ∼±10 km s 1 , the estimated local density varies by δ ρ 0 / ρ 0 ∼±0.08, or for δ R 0 ± 0.1 kpc, δ ρ 0 / ρ 0 ∼∓0.025.

5. Summary

We reviewed the current status of determination of the RC of the Milky Way, and presented a unified RC from the GC to outer halo at R∼100 kpc. The RC was used to directly calculate the SMD without assuming any functional form. The disk appears as a straight line on the semi-logarithmic plot of SMD against R, and is visually well discriminated from the DH having an extended outskirt.
The SMD distribution was fitted by a bulge, disk, and NFW dark halo using the χ 2 method. The best-fit DH profile yielded the local DM density of 0.359 ± 0.017 GeV cm 3 . We also reviewed the current estimations from the literature in the last decade, which appear to be converging to a mean value of ρ = 0.39 ± 0.09 GeV cm 3 .

Funding

This research received no external funding.

Acknowledgments

The data analysis was performed at the Center of Astronomical Data Analysis of the National Astronomical Observatory of Japan. The author is grateful to A. Hofmeister for inviting him to this special issue.

Conflicts of Interest

The author declares no conflict of interest.

Appendix A. Tables Concerning the RC and SMD of the Milky Way

Table A1 and Table A2 list the running-averaged RC of the Milky Way using the data from [1,29,36], which is used to calculate the SMD in Figure 3. Table A3 and Table A4 lists the directly calculated SMD from the RC.
Table A1. Rotation curve of the Milky Way used in Figure 1.
Radius V rot Standard Dev.
(kpc)(km s 1 )(km s 1 )
0.100144.93.7
0.110147.44.2
0.121150.44.8
0.133153.86.1
0.146158.910.3
0.161167.416.1
0.177180.122.4
0.195196.627.1
0.214213.626.9
0.236227.822.7
0.259237.917.0
0.285244.411.8
0.314248.27.6
0.345250.24.7
0.380251.02.9
0.418250.72.1
0.459249.72.3
0.505248.02.9
0.556245.93.7
0.612243.24.6
0.673239.85.7
0.740235.86.4
0.814231.76.5
0.895227.86.0
0.985224.55.2
1.083221.74.5
1.192219.14.0
1.311216.83.7
1.442214.73.4
1.586212.73.1
1.745210.92.8
1.919209.52.3
2.111208.51.8
2.323208.21.6
Table A2. Continued from Table A1.
Radius V rot Standard Dev.
(kpc)(km s 1 )(km s 1 )
2.555208.92.2
2.810210.73.6
3.091213.44.8
3.400217.25.9
3.740222.06.6
4.114226.65.7
4.526229.54.4
4.979231.64.3
5.476234.15.3
6.024237.25.7
6.626239.55.0
7.289240.14.1
8.018239.04.4
8.820236.75.4
9.702234.56.0
10.672234.27.1
11.739237.19.8
12.913242.812.4
14.204248.513.3
15.625249.714.8
17.187246.217.4
18.906243.318.3
20.797243.917.5
22.876245.615.6
25.164243.715.2
27.680237.316.1
30.448229.615.5
33.493222.514.1
36.842215.014.0
40.527207.113.8
44.579200.312.7
49.037194.711.9
53.941189.811.3
59.335186.210.4
65.268184.79.6
71.795183.99.3
78.975181.411.0
86.872175.514.6
95.560167.716.3
Table A3. Directly calculated SMD by spherical assumption of the mass distribution.
Radius SMD Standard Dev.
(kpc) M pc 2 M pc 2
0.10029,933.0861.3
0.11029,054.0654.8
0.12128,384.0666.0
0.13328,160.0570.8
0.14628,319.0637.2
0.16128,203.01406.6
0.17727,368.02481.1
0.19525,014.03514.2
0.21421,548.04357.7
0.23617,908.04806.8
0.25914,804.04733.1
0.28512,369.04231.5
0.31410,489.03549.3
0.3458978.92929.7
0.3807736.52384.1
0.4186700.81959.1
0.4595830.81636.9
0.5055090.61374.2
0.5564452.01158.1
0.6123899.9973.5
0.6733464.9803.4
0.7403145.2644.7
0.8142904.3510.8
0.8952701.7415.1
0.9852510.1354.4
1.0832320.9319.0
1.1922144.8291.9
1.3111985.0266.7
1.4421843.6240.7
1.5861718.4214.5
1.7451611.4188.2
1.9191519.3164.5
2.1111440.6144.4
2.3231368.3130.9
Table A4. Continued from Table A3.
Radius SMD Standard Dev.
(kpc) M pc 2 M pc 2
2.5551296.4125.1
2.8101220.5126.3
3.0911139.8134.1
3.4001055.2146.1
3.740944.3157.4
4.114824.6161.5
4.526734.9150.5
4.979668.3133.7
5.476600.8123.8
6.024523.5119.3
6.626446.8113.6
7.289383.7101.6
8.018339.183.4
8.820314.162.2
9.702303.443.9
10.672293.239.0
11.739272.048.2
12.913229.558.5
14.204170.565.2
15.625127.562.4
17.187114.746.4
18.906110.035.2
20.79791.833.5
22.87661.234.5
25.16437.233.2
27.68028.025.4
30.44824.717.1
33.49320.311.6
36.84217.37.8
40.52717.14.7
44.57916.73.0
49.03715.22.3
53.94114.42.3
59.33513.43.3
65.26810.64.3
71.7956.24.9

References

  1. Sofue, Y. Rotation and mass in the Milky Way and spiral galaxies. Publ. Astron. Soc. Jpn. 2017, 69, R1. [Google Scholar] [CrossRef] [Green Version]
  2. Sofue, Y.; Rubin, V. Rotation Curves of Spiral Galaxies. Annu. Rev. Astron. Astrophys. 2001, 39, 137. [Google Scholar] [CrossRef] [Green Version]
  3. Salucci, P. The distribution of dark matter in galaxies. Astron. Astrophys. Rev. 2019, 27, 2. [Google Scholar] [CrossRef] [Green Version]
  4. Honma, M.; Nagayama, T.; Ando, K.; Bushimata, T.; Choi, Y.K.; Handa, T.; Hirota, T.; Imai, H.; Jike, T.; Kim, M.K.; et al. Fundamental Parameters of the Milky Way Galaxy Based on VLBI astrometry. Publ. Astron. Soc. Jpn. 2012, 64, 136. [Google Scholar] [CrossRef] [Green Version]
  5. Honma, M.; Nagayama, T.; Sakai, N. Determining dynamical parameters of the Milky Way Galaxy based on high-accuracy radio astrometry. Publ. Astron. Soc. Jpn. 2015, 67, 70. [Google Scholar] [CrossRef]
  6. Fich, M.; Tremaine, S. The mass of the Galaxy. Annu. Rev. Astron. Astrophys. 1991, 29, 409. [Google Scholar] [CrossRef]
  7. Reid, M.J. The distance to the center of the Galaxy. Annu. Rev. Astron. Astrophys. 1993, 31, 345. [Google Scholar] [CrossRef]
  8. Olling, R.P.; Dehnen, W. The Oort Constants Measured from Proper Motions. Astrophys. J. 2003, 599, 275. [Google Scholar] [CrossRef] [Green Version]
  9. Ghez, A.M.; Salim, S.; Weinberg, N.N.; Lu, J.R.; Do, T.; Dunn, J.K.; Matthews, K.; Morris, M.R.; Yelda, S.; Becklin, E.E.; et al. Measuring Distance and Properties of the Milky Way’s Central Supermassive Black Hole with Stellar Orbits. Astrophys. J. 2008, 689, 1044. [Google Scholar] [CrossRef] [Green Version]
  10. Gillessen, S.; Eisenhauer, F.; Trippe, S.; Alexander, T.; Genzel, R.; Martins, F.; Ott, T. Monitoring Stellar Orbits Around the Massive Black Hole in the Galactic Center. Astrophys. J. 2009, 692, 1075. [Google Scholar] [CrossRef] [Green Version]
  11. Reid, M.J.; Menten, K.M.; Zheng, X.W.; Brunthaler, A.; Moscadelli, L.; Xu, Y.; Zhang, B.; Sato, M.; Honma, M.; Hirota, T.; et al. Trigonometric Parallaxes of Massive Star-Forming Regions. VI. Galactic Structure, Fundamental Parameters, and Noncircular Motions. Astrophys. J. 2009, 700, 137. [Google Scholar] [CrossRef]
  12. Matsunaga, N.; Kawadu, T.; Nishiyama, S.; Nagayama, T.; Hatano, H.; Tamura, M.; Glass, I.S.; Nagata, T. A near-infrared survey of Miras and the distance to the Galactic Centre. Mon. Not. R. Astron. Soc. 2009, 399, 1709. [Google Scholar] [CrossRef] [Green Version]
  13. Burton, W.B.; Gordon, M.A. Carbon monoxide in the Galaxy. III. The overall nature of its distribution in the equatorial plane. Astron. Astrophys. 1978, 63, 7. [Google Scholar]
  14. Blitz, L.; Lada, C.J. H2O masers near OB associations. Astrophys. J. 1979, 227, 152–158. [Google Scholar] [CrossRef]
  15. Clemens, D.P. Massachusetts-Stony Brook Galactic plane CO survey: The galactic disk rotation curve. Astrophys. J. 1985, 295, 422. [Google Scholar] [CrossRef]
  16. Dehnen, W.; Binney, J. Mass models of the Milky Way. Mon. Not. R. Astron. Soc. 1998, 294, 429. [Google Scholar] [CrossRef] [Green Version]
  17. Genzel, R.; Eisenhauer, F.; Gillessen, S. The Galactic Center massive black hole and nuclear star cluster. Rev. Mod. Phys. 2010, 82, 3121. [Google Scholar] [CrossRef]
  18. Battinelli, P.; Demers, S.; Rossi, C.; Gigoyan, K.S. Extension of the C Star Rotation Curve of the Milky Way to 24 kpc. Astrophysics 2013, 56, 68. [Google Scholar] [CrossRef] [Green Version]
  19. Bhattacharjee, P.; Chaudhury, S.; Kundu, S. Rotation Curve of the Milky Way out to ~200 kpc. Astrophys. J. 2014, 785, 63. [Google Scholar] [CrossRef]
  20. López-Corredoira, M. Milky Way rotation curve from proper motions of red clump giants. Astron. Astrophys. 2014, 563, A128. [Google Scholar] [CrossRef]
  21. Bovy, J.; Prieto, C.A.; Beers, T.; Bizyaev, D.; Da Costa, L.N.; Cunha, K.; Ebelke, G.; Eisenstein, D.J.; Frinchaboy, P.M.; Pérez, A.E.G.; et al. The Milky Way’s Circular-velocity Curve between 4 and 14 kpc from APOGEE data. Astrophys. J. 2012, 759, 131. [Google Scholar] [CrossRef] [Green Version]
  22. Bobylev, V.V.; Bajkova, A.T. Galactic rotation curve and spiral density wave parameters from 73 masers. Astron. Lett. 2013, 39, 809. [Google Scholar] [CrossRef] [Green Version]
  23. Bobylev, V.V.; Bajkova, A.T. Determination of the galactic rotation curve from OB stars. Astron. Lett. 2015, 41, 473. [Google Scholar] [CrossRef] [Green Version]
  24. Reid, M.J.; Menten, K.M.; Brunthaler, A.; Zheng, X.W.; Dame, T.M.; Xu, Y.; Wu, Y.; Zhang, B.; Sanna, A.; Sato, M.; et al. Trigonometric Parallaxes of High Mass Star Forming Regions: The Structure and Kinematics of the Milky Way. Astrophys. J. 2014, 783, 130. [Google Scholar] [CrossRef] [Green Version]
  25. Iocco, F.; Pato, M.; Bertone, G. Evidence for dark matter in the inner Milky Way. Nat. Phys. 2015, 11, 245. [Google Scholar] [CrossRef] [Green Version]
  26. Iocco, F.; Pato, M. On the dark matter distribution in the Milky Way. J. Phys. Conf. Ser. 2016, 718, 042031. [Google Scholar] [CrossRef]
  27. Pato, M.; Iocco, F. Galkin: Milky Way Rotation Curve Data Handler; ascl:1711.011; Astrophysics Source Code Library: Houghton, MI, USA, 2017. [Google Scholar]
  28. Pato, M.; Iocco, F. Galkin: A new compilation of Milky Way rotation curve data. SoftwareX 2017, 6, 54. [Google Scholar] [CrossRef]
  29. Huang, Y.; Liu, X.; Yuan, H.-B.; Xiang, M.; Zhang, H.-W.; Chen, B.; Ren, J.; Wang, C.; Zhang, Y.; Hou, Y.-H.; et al. The Milky Way’s rotation curve out to 100 kpc and its constraint on the Galactic mass distribution. Mon. Not. R. Astron. Soc. 2016, 463, 2623. [Google Scholar] [CrossRef] [Green Version]
  30. Krełowski, J.; Galazutdinov, G.; Strobel, A. The Milky Way Rotation Curve Revisited. Publ. Astron. Soc. Pac. 2018, 130, 114302. [Google Scholar] [CrossRef]
  31. Lin, H.-N.; Li, X. The dark matter profiles in the Milky Way. Mon. Not. R. Astron. Soc. 2019, 487, 5679. [Google Scholar] [CrossRef] [Green Version]
  32. Eilers, A.-C.; Hogg, D.W.; Rix, H.-W.; Ness, M.K. The Circular Velocity Curve of the Milky Way from 5 to 25 kpc. Astrophys. J. 2019, 871, 120. [Google Scholar] [CrossRef] [Green Version]
  33. Mróz, P.; Udalski, A.; Skowron, D.M.; Skowron, J.; Soszyński, I.; Pietrukowicz, P.; Szymański, M.K.; Poleski, R.; Kozłowski, S.; Ulaczyk, K. Rotation Curve of the Milky Way from Classical Cepheids. Astrophys. J. 2012, 870, L10. [Google Scholar] [CrossRef] [Green Version]
  34. Sofue, Y.; Honma, M.; Omodaka, T. Unified Rotation Curve of the Galaxy—Decomposition into de Vaucouleurs Bulge, Disk, Dark Halo, and the 9-kpc Rotation Dip—. Publ. Astron. Soc. Jpn. 2009, 61, 227. [Google Scholar] [CrossRef]
  35. Sofue, Y. Rotation Curve and Mass Distribution in the Galactic Center - From Black Hole to Entire Galaxy. Publ. Astron. Soc. Jpn. 2013, 65, 118. [Google Scholar] [CrossRef]
  36. Sofue, Y. Dark halos of M 31 and the Milky Way. Publ. Astron. Soc. Jpn. 2015, 67, 75. [Google Scholar] [CrossRef] [Green Version]
  37. Fich, M.; Blitz, L.; Stark, A.A. The Rotation Curve of the Milky Way to 2R 0. Astrophys. J. 1989, 342, 272. [Google Scholar] [CrossRef]
  38. Demers, S.; Battinelli, P. C stars as kinematic probes of the Milky Way disk from 9 to 15 kpc. Astron. Astrophys. 2007, 473, 143. [Google Scholar] [CrossRef]
  39. Merrifield, M.R. The Rotation Curve of the Milky Way to 2.5 R/o From the Thickness of the HI Layer. Astron. J. 1992, 103, 1552. [Google Scholar] [CrossRef]
  40. Honma, M.; Sofue, Y. Rotation Curve of the Galaxy. Publ. Astron. Soc. Jpn. 1997, 49, 453. [Google Scholar] [CrossRef] [Green Version]
  41. Lindqvist, M.; Habing, H.J.; Winnberg, A. OH/IR stars close to the galactic centre. II. Their spatial and kinematics properties and the mass distribution within 5-100 PC from the galactic centre. Astron. Astrophys. 1992, 259, 118. [Google Scholar]
  42. Honma, M.; Bushimata, T.; Choi, Y.K.; Hirota, T.; Imai, H.; Iwadate, K.; Jike, T.; Kameya, O.; Kamohara, R.; Kan-Ya, Y.; et al. Astrometry of Galactic Star-Forming Region Sharpless 269 with VERA: Parallax Measurements and Constraint on Outer Rotation Curve. Publ. Astron. Soc. Jpn. 2007, 59, 889. [Google Scholar] [CrossRef] [Green Version]
  43. Sakai, N.; Nakanishi, H.; Matsuo, M.; Koide, N.; Tezuka, D.; Kurayama, T.; Shibata, K.M.; Ueno, Y.; Honma, M. Outer rotation curve of the Galaxy with VERA. III. Astrometry of IRAS 07427-2400 and test of the density-wave theory. Publ. Astron. Soc. Jpn. 2015, 67, 69. [Google Scholar] [CrossRef] [Green Version]
  44. Nakanishi, H.; Sakai, N.; Kurayama, T.; Matsuo, M.; Imai, H.; Burns, R.A.; Ozawa, T.; Honma, M.; Shibata, K.M.; Kawaguchi, N. Outer rotation curve of the Galaxy with VERA. II. Annual parallax and proper motion of the star-forming region IRAS 21379+5106. Publ. Astron. Soc. Jpn. 2015, 67, 68. [Google Scholar] [CrossRef] [Green Version]
  45. Callingham, T.M.; Cautun, M.; Deason, A.J.; Frenk, C.S.; Wang, W.; A Gómez, F.; Grand, R.J.J.; Marinacci, F.; Pakmor, R. The mass of the Milky Way from satellite dynamics. Mon. Not. R. Astron. Soc. 2019, 484, 5453. [Google Scholar] [CrossRef]
  46. Roeser, S.; Demleitner, M.; Schilbach, E. The PPMXL Catalog of Positions and Proper Motions on the ICRS. Combining USNO-B1.0 and the Two Micron All Sky Survey (2MASS). Astron. J. 2010, 139, 2440. [Google Scholar] [CrossRef] [Green Version]
  47. Pato, M.; Iocco, F.; Bertone, G. Dynamical constraints on the dark matter distribution in the Milky Way. J. Cosmol. Astropart. Phys. 2015, 2015, 001. [Google Scholar] [CrossRef] [Green Version]
  48. Pato, M.; Iocco, F. The Dark Matter Profile of the Milky Way: A Non-parametric Reconstruction. Astrophys. J. 2015, 803, L3. [Google Scholar] [CrossRef] [Green Version]
  49. de Vaucouleurs, G. Photoelectric photometry of the Andromeda Nebula in the UBV system. Astrophys. J. 1958, 128, 465. [Google Scholar] [CrossRef]
  50. Ciotti, L. Stellar systems following the R1/m luminosity law. Astron. Astrophys. 1991, 249, 99. [Google Scholar]
  51. Trujillo, I.; Asensio Ramos, A.; Rubino-Martín, J.A.; Graham, A.W.; Aguerri, J.A.; Cepa, J.; Gutiérrez, C.M. Triaxial stellar systems following the r1/n luminosity law: An analytical mass-density expression, gravitational torques and the bulge/disc interplay. Mon. Not. R. Astron. Soc. 2002, 333, 510. [Google Scholar] [CrossRef] [Green Version]
  52. Freeman, K.C. On the Disks of Spiral and S0 Galaxies. Astrophys. J. 1970, 160, 811. [Google Scholar] [CrossRef]
  53. Binney, J.; Tremaine, S. Galactic Dynamics; Princeton University Press: Princeton, NJ, USA, 1987. [Google Scholar]
  54. Li, Z.-Z.; Jing, Y.P.; Qian, Y.-Z.; Yuan, Z.; Zhao, D.-H. Determination of Dark Matter Halo Mass from Dynamics of Satellite Galaxies. Astrophys. J. 2017, 850, 116. [Google Scholar] [CrossRef] [Green Version]
  55. Burkert, A. The Structure of Dark Matter Halos in Dwarf Galaxies. Astrophys. J. 1995, 447, L25. [Google Scholar] [CrossRef] [Green Version]
  56. Salucci, P.; Burkert, A. Dark Matter Scaling Relations. Astrophys. J. 2000, 537, L9. [Google Scholar] [CrossRef] [Green Version]
  57. Brownstein, J.R.; Moffat, J.W. Galaxy Rotation Curves without Nonbaryonic Dark Matter. Astrophys. J. 2006, 636, 721. [Google Scholar] [CrossRef] [Green Version]
  58. Navarro, J.F.; Frenk, C.S.; White, S.D.M. Simulations of X-ray clusters. Mon. Not. R. Astron. Soc. 1995, 275, 720. [Google Scholar] [CrossRef] [Green Version]
  59. Navarro, J.F.; Frenk, C.S.; White, S.D.M. A Universal Density Profile from Hierarchical Clustering. Astrophys. J. 1997, 490, 493. [Google Scholar] [CrossRef]
  60. Moore, B.; Quinn, T.; Governato, F.; Stadel, J.; Lake, G. Cold collapse and the core catastrophe. Mon. Not. R. Astron. Soc. 1999, 310, 1147. [Google Scholar] [CrossRef] [Green Version]
  61. Fukushige, T.; Kawai, A.; Makino, J. Structure of Dark Matter Halos from Hierarchical Clustering. III. Shallowing of the Inner Cusp. Astrophys. J. 2004, 606, 625. [Google Scholar] [CrossRef]
  62. Navarro, J.F.; Frenk, C.S.; White, S.D.M. The Structure of Cold Dark Matter Halos. Astrophys. J. 1996, 462, 563. [Google Scholar] [CrossRef] [Green Version]
  63. Silk, J.; Bloemen, H. A Gamma-Ray Constraint on the Nature of Dark Matter. Astrophys. J. 1987, 313, L47. [Google Scholar] [CrossRef]
  64. Escudero, M.; Hooper, D.; Witte, S.J. Updated collider and direct detection constraints on Dark Matter models for the Galactic Center gamma-ray excess. J. Cosmol. Astropart. Phys. 2017, 2017, 38. [Google Scholar] [CrossRef] [Green Version]
  65. Finkbeiner, D.P. WMAP Microwave Emission Interpreted as Dark Matter Annihilation in the Inner Galaxy. arXiv 2004, arXiv:0409027. [Google Scholar]
  66. Weber, M.; de Boer, W. Determination of the local dark matter density in our Galaxy. Astron. Astrophys. 2010, 509, A25. [Google Scholar] [CrossRef]
  67. Catena, R.; Ullio, P. A novel determination of the local dark matter density. J. Cosmol. Astropart. Phys. 2010, 2010, 004. [Google Scholar] [CrossRef] [Green Version]
  68. Bovy, J.; Tremaine, S. On the Local Dark Matter Density. Astrophys. J. 2012, 756, 89. [Google Scholar] [CrossRef]
  69. Piffl, T.; Binney, J.; McMillan, P.; Steinmetz, M.; Helmi, A.; Wyse, R.F.G.; Bienaymé, O.; Bland-Hawthorn, J.; Freeman, K.; Gibson, B.K.; et al. Constraining the Galaxy’s dark halo with RAVE stars. Mon. Not. R. Astron. Soc. 2014, 445, 3133. [Google Scholar] [CrossRef] [Green Version]
  70. McMillan, P.J. The mass distribution and gravitational potential of the Milky Way. Mon. Not. R. Astron. Soc. 2017, 465, 76. [Google Scholar] [CrossRef]
  71. Salucci, P.; Nesti, F.; Gentile, G.; Frigerio Martins, C. The dark matter density at the Sun’s location. Astron. Astrophys. 2010, 523, A83. [Google Scholar] [CrossRef]
  72. de Salas, P.F.; Malhan, K.; Freese, K.; Hattori, K.; Valluri, M. On the estimation of the local dark matter density using the rotation curve of the Milky Way. J. Cosmol. Astropart. Phys. 2019, 2019, 37. [Google Scholar] [CrossRef] [Green Version]
  73. Cautun, M.; Benitez-Llambay, A.; Deason, A.J.; Frenk, C.S.; Fattahi, A.; Gomez, F.A.; Grand, R.J.; Oman, K.A.; Navarro, J.F.; Simpson, C.M. The Milky Way total mass profile as inferred from Gaia DR2. arXiv 2020, arXiv:1911.04557. [Google Scholar] [CrossRef]
  74. Karukes, E.V.; Benito, M.; Iocco, F.; Trotta, R.; Geringer-Sameth, A. Bayesian reconstruction of the Milky Way dark matter distribution. J. Cosmol. Astropart. Phys. 2019, 2019, 46. [Google Scholar] [CrossRef] [Green Version]
Figure 1. (a) Unified RC of the Milky Way used in this paper for the mass distribution obtained by averaging the RCs from references [1,29,36]. The bars are standard deviations within each Gaussian-averaging bin. The plotted values are listed in the tables in Appendix A. (b) Logarithmic RC of the Milky Way (circles), compared with those from the recent literature: Green circles with error bars are from the compilation by [27,28], and blue triangles are their running averages. Red triangles stand for data from [30] based on GAIA data. These two data are re-scaled to ( R 0 , V 0 ) = (8.0 kpc, 238 km s 1 ). Pink rectangles are the RC by [29] without re-scaling. (c) Same, but in linear scale. (d) Same, but close up in the solar vicinity.
Galaxies 08 00037 g001
Figure 2. (Top) Schematic density profiles of NFW (Navarro, Frenk, White) (thick solid), Moore (upper long dash), Burkert (long dash), Brownstein (dot), β (dash), and isothermal (thin solid) models with h = 10 kpc normalized at 20 kpc, compared with the disk (straight line) and bulge (inner thick dash). Uppermost thin lines are the sum of bulge, disk and halo. (Bottom) Same, but in log–log plot. The NFW cusp and cored halos do not much contribute to the mass density in the GC, whereas the Moore cusp somehow resembles the bulge profile.
Galaxies 08 00037 g002
Figure 3. (Top) Direct surface-mass density (SMD) calculated for the unified RC in Figure 1 in spherical symmetry assumption (dots with error bars) in semi-logarithmic representation. The solid line is the χ 2 fit, and red, blue, and dashed lines represent the NFW halo, disk, and bulge, respectively. (Bottom) Same, but in log–log plots. The semi-logarithmic plot makes it easier to discriminate the dark halo from exponential disk, which appears as a straight line. The plotted values are listed in the tables in Appendix A.
Galaxies 08 00037 g003
Figure 4. Local dark matter (DM) density from the literature (Table 4) plotted against publication year. The dashed line indicates a simple mean of the plots at ρ = 0.39 ± 0.09 GeV cm 3 .
Galaxies 08 00037 g004
Table 1. Galactic constants ( R 0 , V 0 ).
Authors (Year) R 0 (kpc) V 0 (km s 1 )
IAU recommended (1982)8.2220
Review before 1993 (Reid 1993) [7] 8.0 ± 0.5
Olling and Dehnen 2003 [8] 7.1 ± 0.4 184 ± 8
VLBI Sgr A * (Ghez et al., 2008) [9] 8.4 ± 0.4
ibid (Gillessen et al., 2009) [10] 8.33 ± 0.35
Maser astrometry (Reid et al., 2009) [11] 8.4 ± 0.6 254 ± 16
Cepheids (Matsunaga et al., 2009) [12] 8.24 ± 0.42
VERA (Honma et al., 2012, 2015) [4,5] 8.05 ± 0.45 238 ± 14
Adopted in this paper8.0238
Table 2. Rotation curves (RCs) of the Milky Way galaxy.
Authors (Year)Radii (kpc)Method
Burton and Gordon (1978) [13]0–8HI tangent
Blitz et al. (1979) [14]8–18OB-CO assoc.
Clemens (1985) [15]0–18CO/compil.
Dehnen and Binney (1998) [16]8–20compil. + model
Genzel et al. (1994–), Ghez et al. (1998–) [9,17]0–0.0001GC IR spectr.
Battinelli, et al. (2013) [18]9–24C stars
Bhattacharjee et al. (2014) [19]0–200Non-disk objects
Lopez-Corredoira (2014) [20]5–16Red-clump giants, parallax
Boby et al. (2012) [21]4-14NIR spectroscopy
Bobylev (2013); — & Bajkova (2015) [22,23]5–12Masers/OB stars
Honma et al. (2012, 2015) [4,5]3–20Masers, VLBI
Reid et al. (2014) [24]4-16Masers SF regions, VLBI
Iocco et al. (2015, 2016); Pato & Iocco (2017a,b) [25,26,27,28]1–25 kpcCO/HI/opt/maser/compil.
Huang et al. (2016) [29]4.5–100HI/opt/red giants
Krełowski et al. (2018) [30]8–12GAIA
Lin and Li (2019) [31]4–100compil.
Eilers et al. (2019) [32]5–25Wise, 2Mass, GAIA
Mróz et al. (2019) [33]4–20Classical cepheids
Sofue et al. (2009); Sofue (2013, 2015, this work) [34,35,36]0.01–1000CO/HI/maser/opt/compil.
Table 3. Best-fit parameters of the direct SMD by NFW halo and exponential disk.
ComponentParameterFitted Value χ 2
Expo. disk a d 4.38 ± 0.35 kpc
Σ 0 ( 1.28 ± 0.09 ) × 10 3 M pc 2
NFW dark haloh 10.94 ± 1.05 kpc
ρ NFW 0 0.787 ± 0.037 GeV cm 3
ρ 0.359 ± 0.017 GeV cm 3 11.9
Burkert ρ 0.30 ± 0.02 GeV cm 3 17.3
Brownstein ρ 0.40 ± 0.02 GeV cm 3 17.9
β model ρ 0.31 ± 0.02 GeV cm 3 17.3
Rough fitting, not conclusive.
Table 4. Current determinations of the local DM density and the literature.
Reference ρ ( GeV cm 3 ) R 0 (kpc) V 0 (km s−1)
Weber and de Boer (2010) [66]0.2–0.4
Catena and Ulio (2010) [67] 0.389 ± 0.025
Bovy and Tremaine (2012) [68] 0.3 ± 0.1
Piffl et al. (2014) [69]0.58
Pato et al. (2015), Pato & Iocco (2015) [47,48] 0.42 ± 0.25 230
Huang et al. (2016) [29] 0.32 ± 0.02 8.34240
McMillan (2017) [70] 0.38 ± 0.04 8.21233.1
Lin and Li (2019) [31] 0.51 ± 0.09 8.1240
Salucci et al. (2010, 2019) [3,71] 0.43 ± 0.06 8.29239
Eilers et al. (2019) [32] 0.3 ± 0.03 8.1229
de Salas et al. (2019) [72]0.3–0.4
Cautun et al. (2019) [73] 0.34 ± 0.02 8229
Karukes et al. (2019) [74] 0.43 ± 0.02 8.34240
Sofue (2013) [35] 0.40 ± 0.04 8.0238
—(2020 this paper) 0.36 ± 0.02 8.0238
Average 0.387 ± 0.080
GeV cm 3 = 38.2 M pc 3 . Simple average of the listed values with equal weighting.

