Dark Matter Dogma: A Study of 214 Galaxies


Abstract
1. Introduction
2. Methods
2.1. General Approach
2.2. Incumbent Component Models
2.3. Disk Mass Density Model
2.4. Mass–Luminosity Analysis
2.5. Further Analysis
2.6. Conclusions Regarding Dark Matter
2.7. Summary of the Analytical Framework
3. Data Sample
4. Results
4.1. Statistical Summary
4.2. Representative Galaxies
5. Discussion
5.1. Limits of Detection of Red Dwarf Populations
5.2. Low-Luminosity Baryonic Mass
5.3. Uncertainty of Inclinations and Distances
5.4. Uncertainty of RCs
5.5. Uncertainty of Surface Brightness Data
5.6. Uncertainty of MLR Slope for Smallest Red Dwarfs
5.7. Light Extinction
5.8. Plateau in Surface Brightness Profiles beyond R27
5.9. Evidence for Radially Declining Star Mass
5.10. Evidence of Extended Stellar Disks Around Galaxies
5.11. Strong Correlations between Dynamics and Light
5.12. Lack of Evidence for Dark Matter in the Solar Neighborhood
6. Conclusions
- ▪
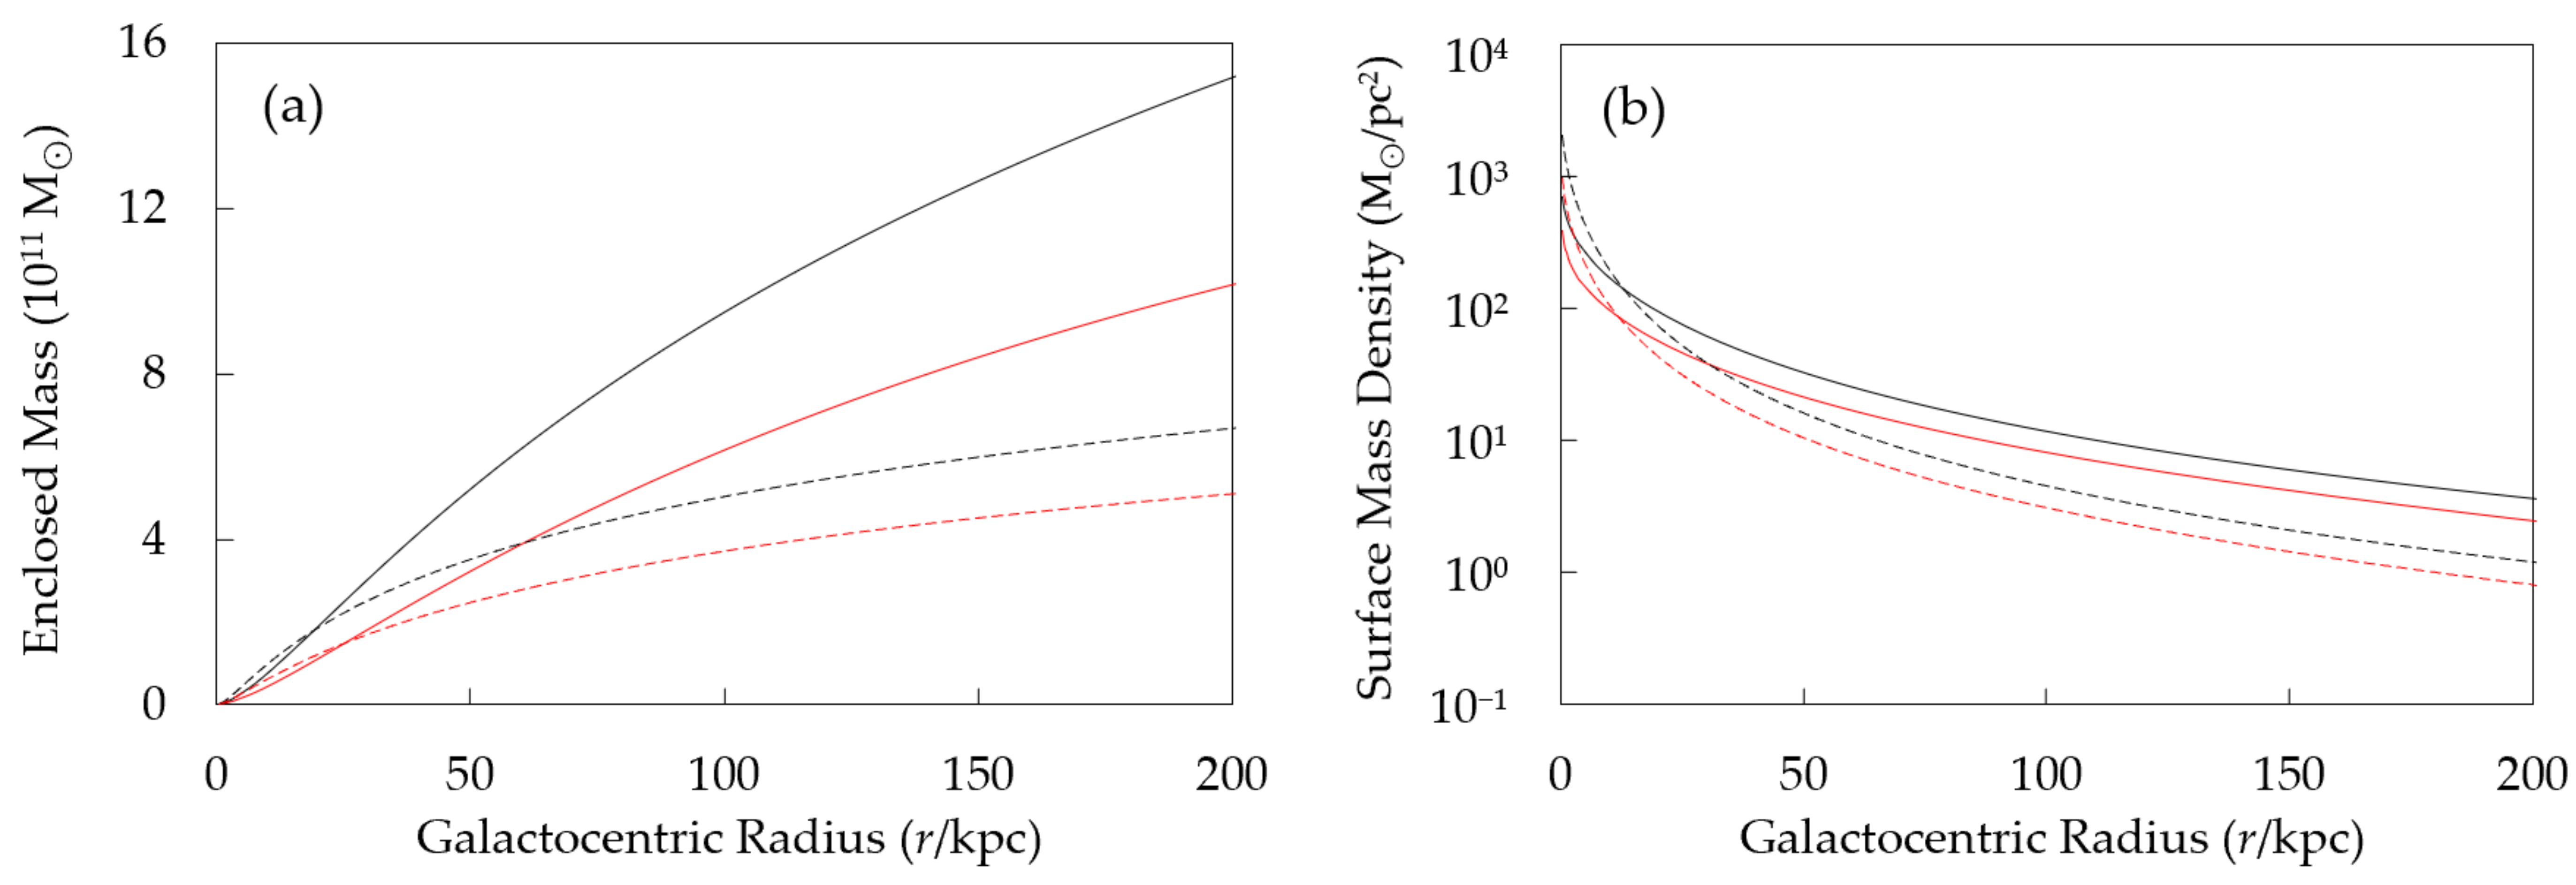
- We have demonstrated that all types of galactic rotation curves can be precisely tracked by a non-parametric disk model which requires lower surface mass density than estimated with parametric models with a dark matter halo.
- ▪
- We have showed that in 132 galaxies, all radially corresponding density/brightness datapoint pairs within observational radii can be addressed solely by the assumption of radially declining average star mass9.
- ▪
- We have discussed how the average excess density of 14 M⊙/pc2 in the remaining 82 galaxies can be explained without appealing to non-baryonic dark matter, but instead with a combination of factors such as visibility cutoffs for dim stellar populations, the quality of various estimates, incompleteness of light data, and the low-luminosity baryonic content.
- ▪
- We have presented an empirically testable hypothesis that radially rising mass/luminosity profiles might be a natural outcome of radially declining average star mass in galaxies.
- ▪
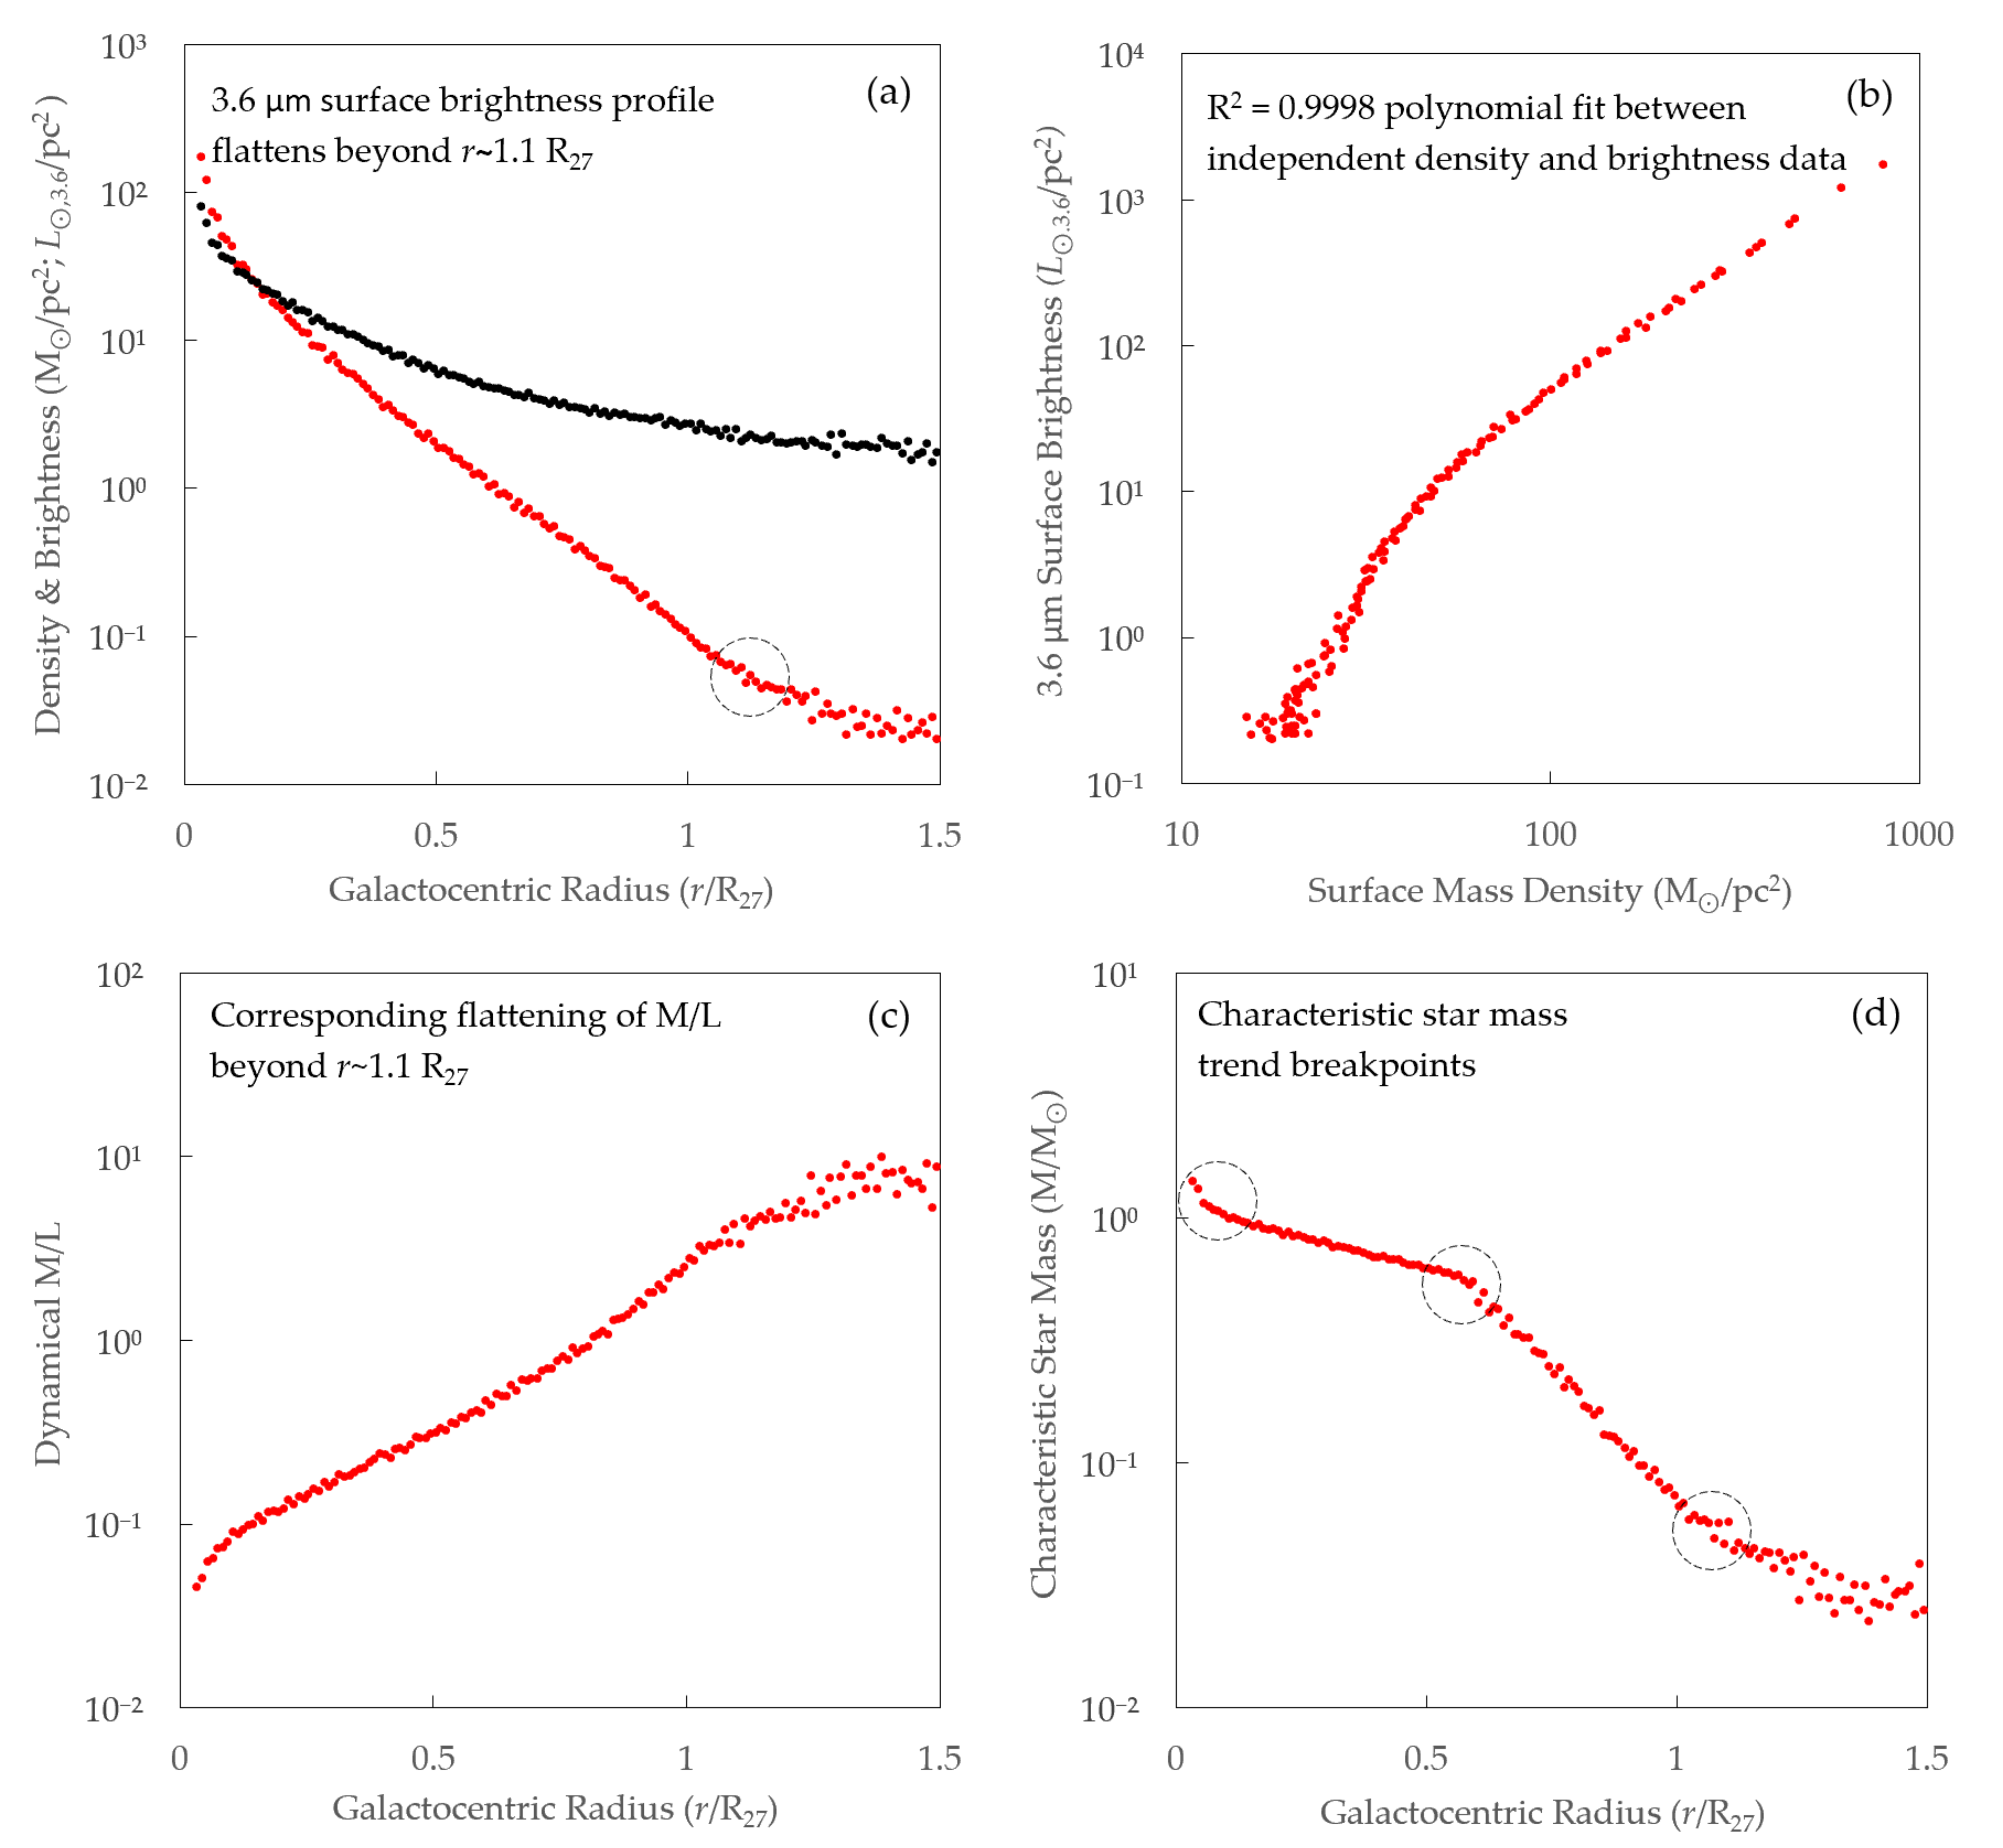
- We have reported a finding of 3.6 μm galactic surface brightness profiles flattening beyond the r~1.1 R27 inflection point.
- ▪
- Lastly, we have demonstrated the extremely tight correlation between sample-average radial profiles of dynamical mass density and surface brightness, with polynomial fit R2 ≈ 1.
Author Contributions
Funding
Acknowledgments
Conflicts of Interest
Appendix A. Disk Mass Density Model (DM2)


| DM2 Notation | Definition |
|---|---|
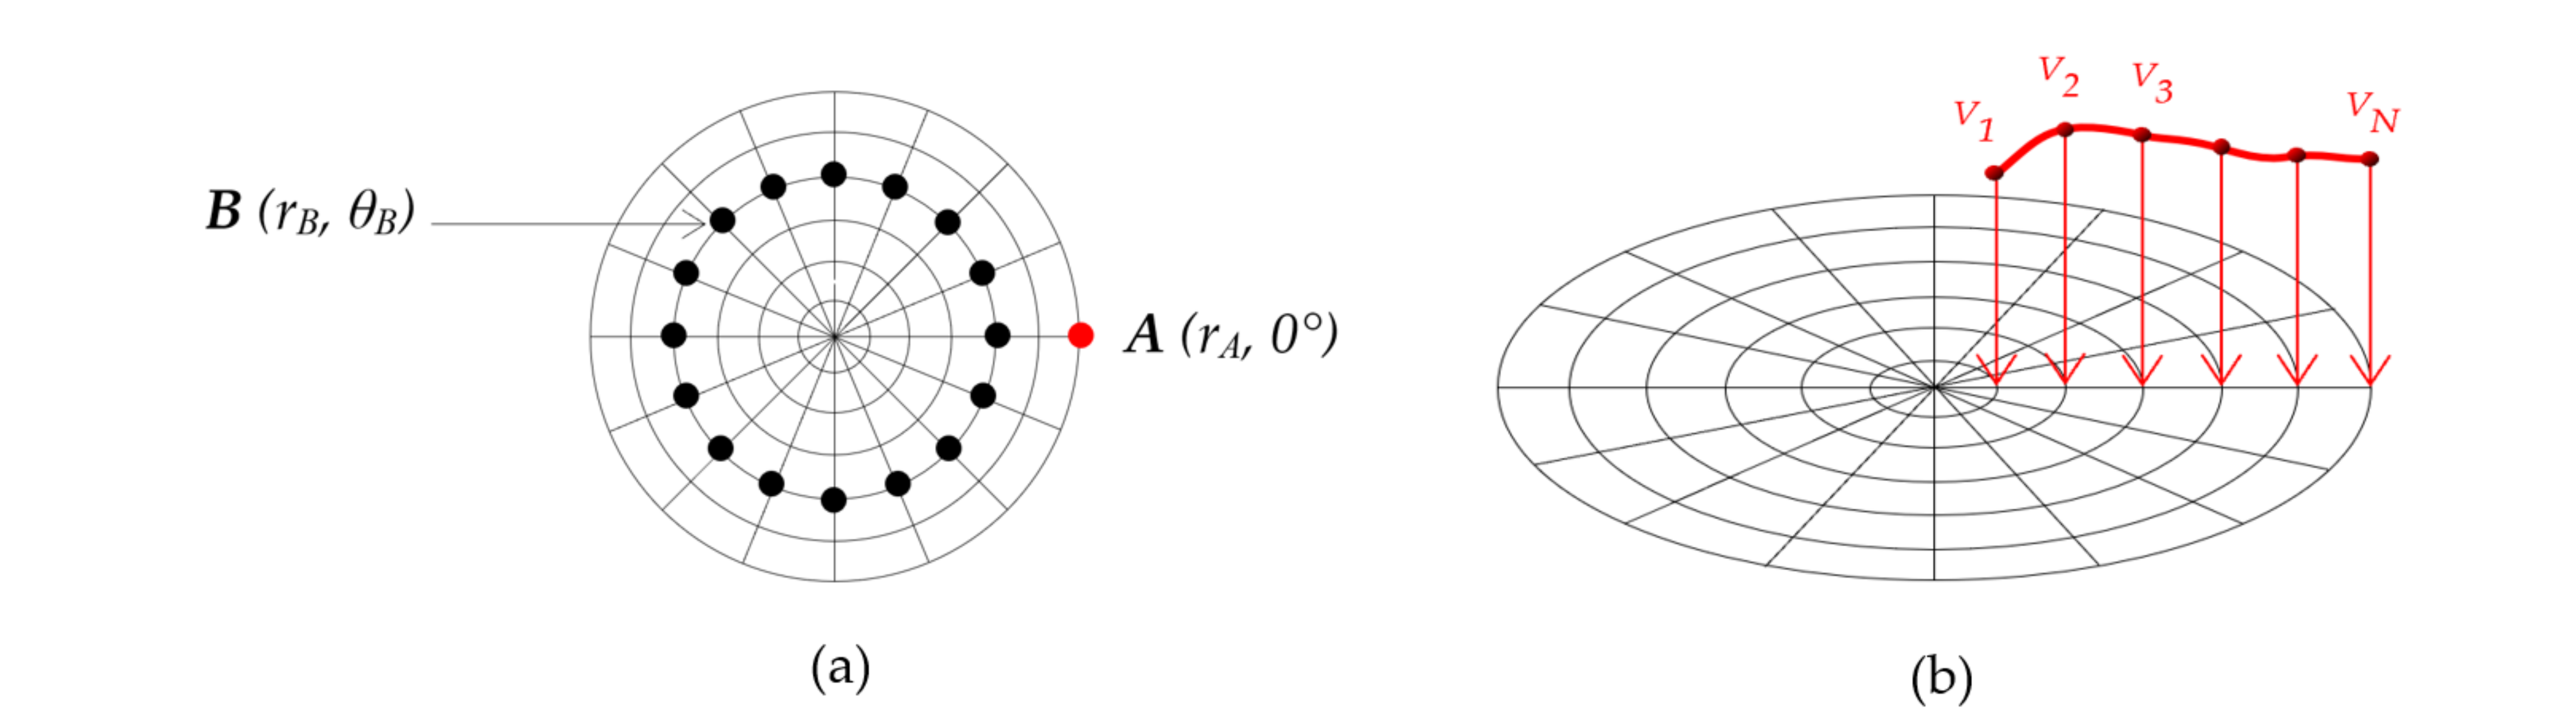
| A (rA, 0°) | A location centered at the intersection of orbit rA and zeroth azimuth |
| B (rB, θB) | Any other location, centered at the intersection of orbit rB and azimuth θB |
| N | Number of modeled orbits in the disk plane (N + 1, including the center) |
| P | Number of modeled locations in each orbit |
| VA | Rotational speed at location A |
| mB | Mass at location B |
Appendix B. Stellar MLR Coefficients for 3.6 μm Passband
| Study | Mann et al., 2015 | Eker et al., 2015 | Malkov 2007 | Vitrichenko et al., 2007 |
|---|---|---|---|---|
| Stellar domain | M dwarfs | Intermediate mass stars | Massive stars | |
| Stellar mass range | 0.084 … 0.744 | 0.214 … 30.884 | 0.214 … 32.7 | 10 … 51 |
| Sample size | 183 | 203 | 271 | 67 |
| Constant | Value | Units |
|---|---|---|
| Planck constant, | 6.62607 × 10⁻²⁷ | erg s |
| Boltzmann constant, | 1.38065 × 10⁻¹⁶ | erg/K |
| Speed of light, | 2.99793 × 10¹⁰ | cm/s |
| Stefan-Boltzmann’s constant, | 5.67037 × 10⁻⁵ | erg/s1 cm2 K4 |
| Spitzer IRAC1 filter passband (response > 1%) | 3.13129–3.96136 | Μm |
| Solar temperature, T⊙ | 5772 | K |
| Solar radius, R⊙ | 6.95658 × 10¹⁰ | Cm |
| Solar mass, M⊙ | 1.98855 × 1033 | G |
| Distance to the Sun, D⊙ | 4.84813 × 10⁻⁶ | Pc |
| Solar luminosity—3.6 μm passband, L⊙3.6 | 3.42851 × 1031 | erg/s |
| Solar radiant flux density—3.6 μm passband, F⊙3.6 | 5.63772 × 10⁸ | erg/s cm2 |
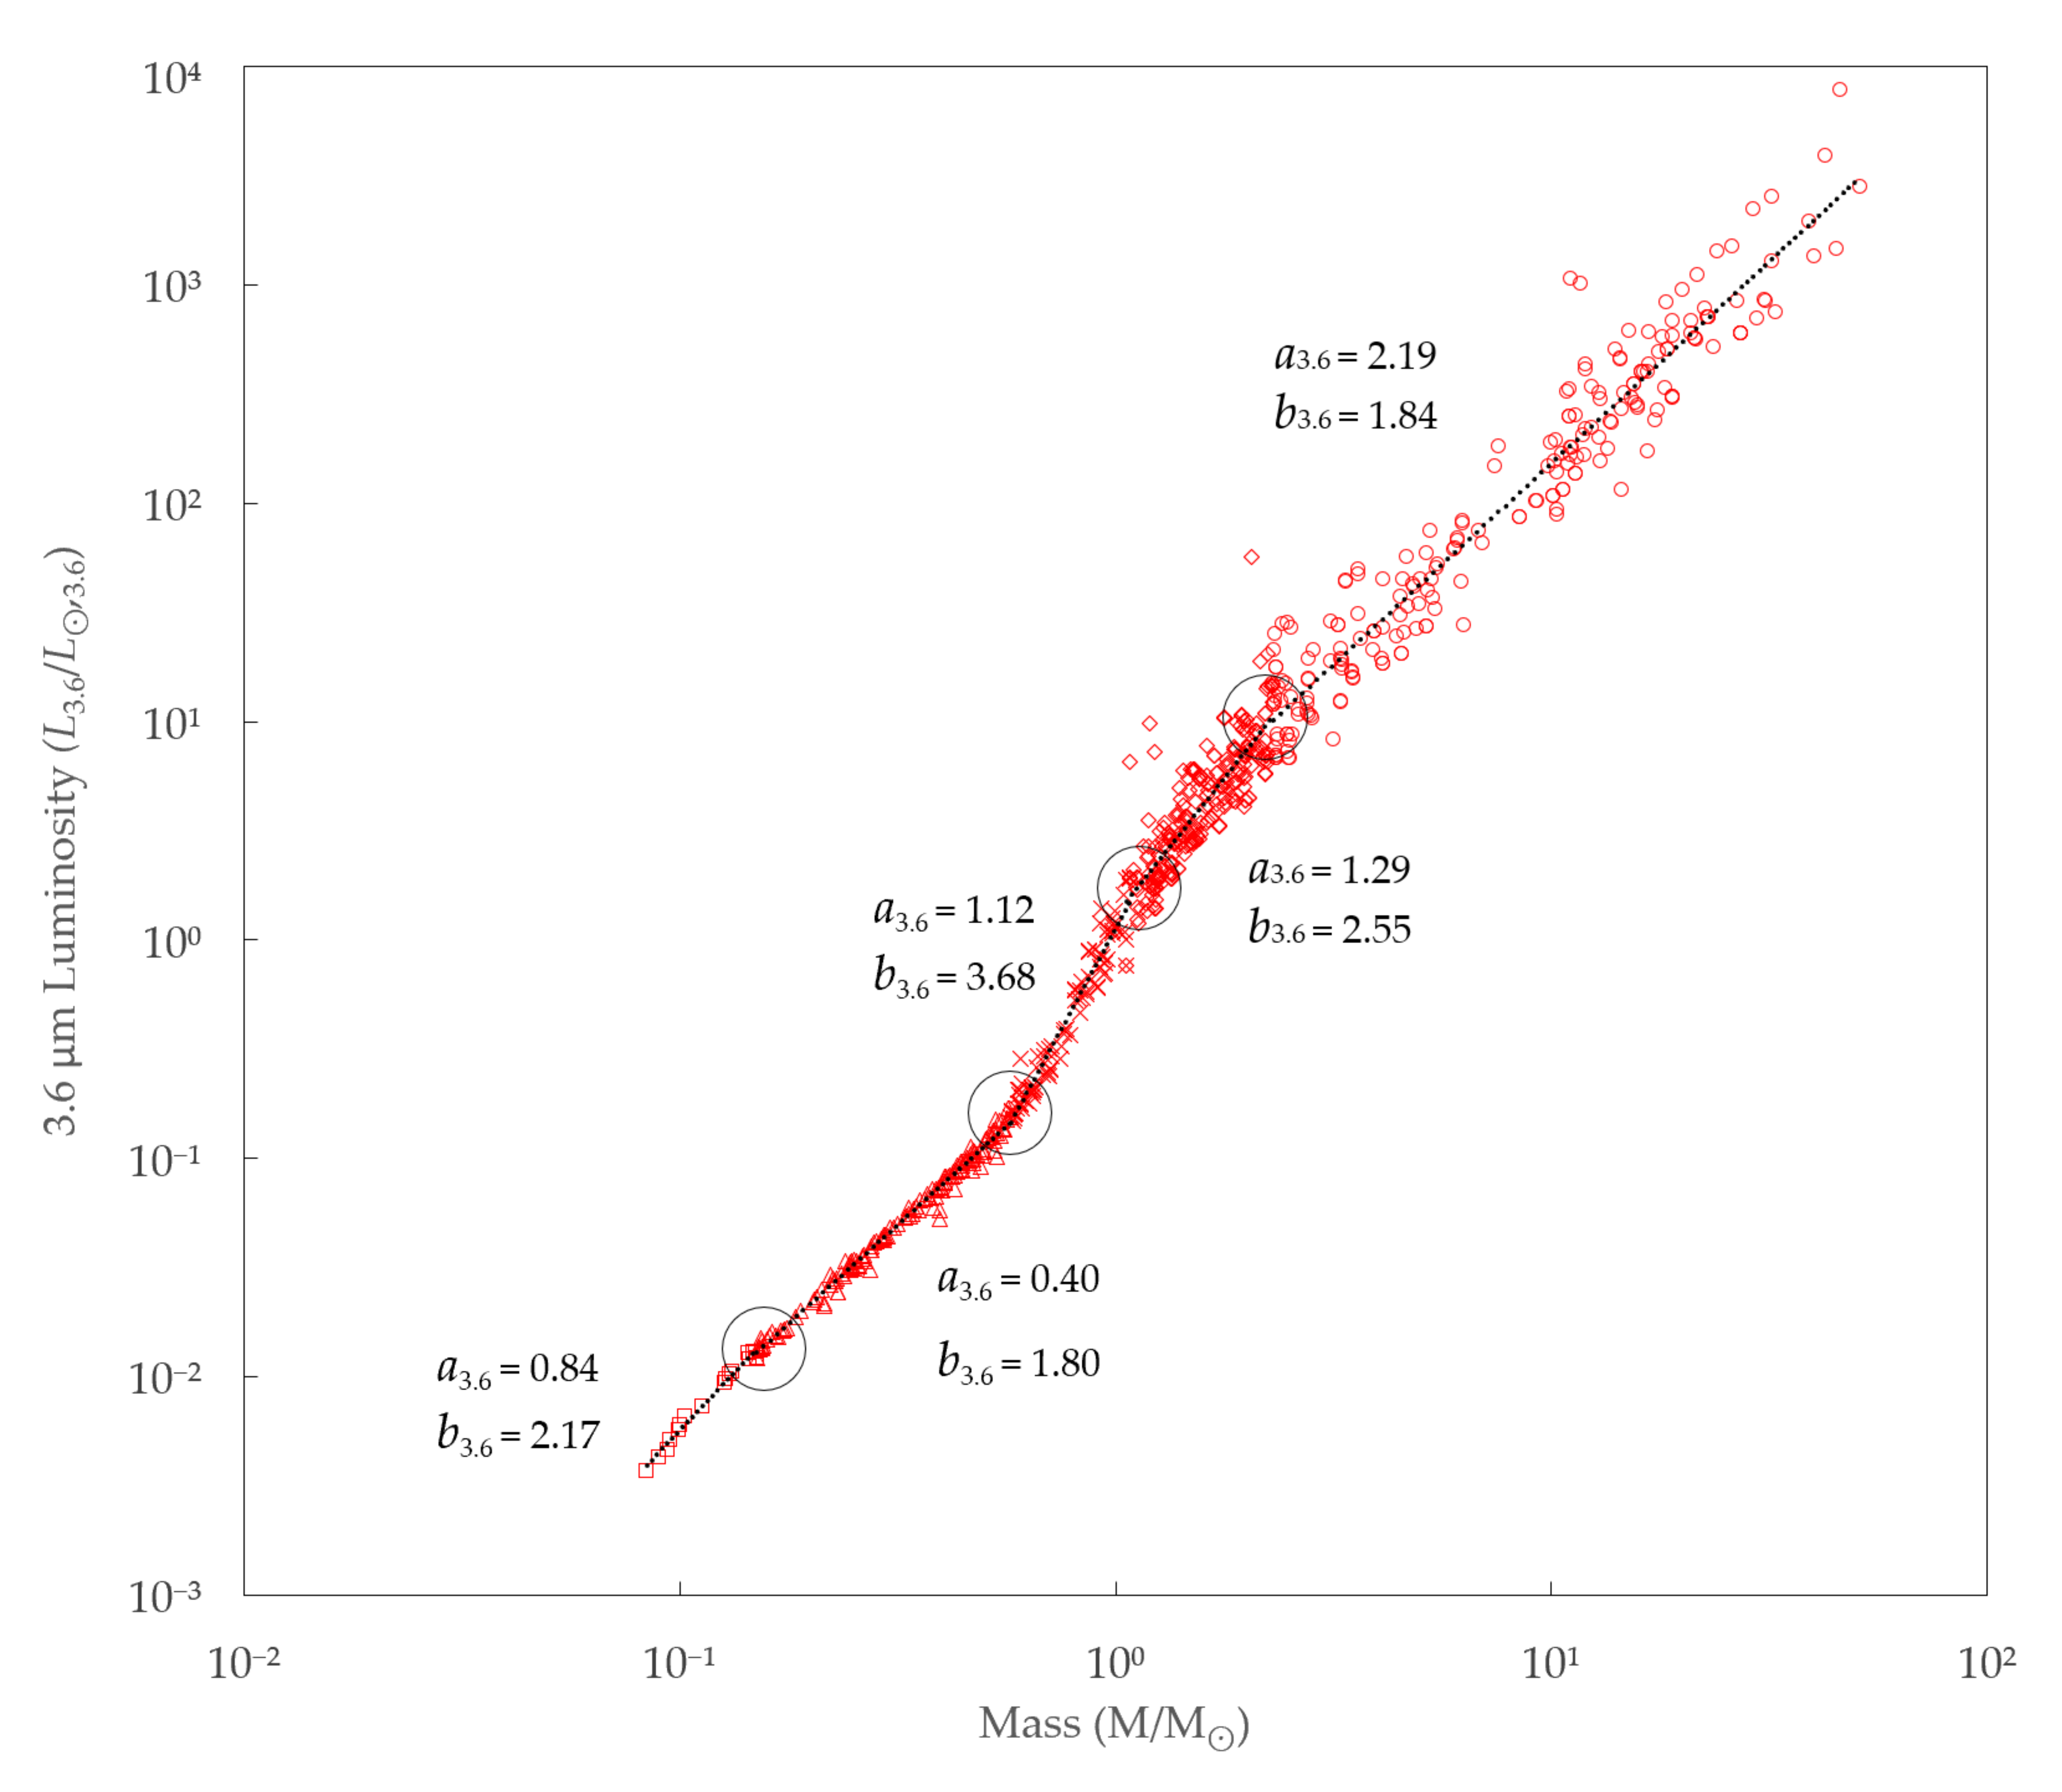
| Star Mass Range | a3.6 | b3.6 | R2 | Datapoints |
|---|---|---|---|---|
| 0.08 M⊙ … 0.15 M⊙ | 0.84 | 2.17 | 0.99 | 17 |
| 0.15 M⊙ … 0.57 M⊙ | 0.40 | 1.80 | 0.99 | 153 |
| 0.57 M⊙ … 1.08 M⊙ | 1.12 | 3.68 | 0.95 | 98 |
| 1.08 M⊙ … 2.30 M⊙ | 1.29 | 2.55 | 0.77 | 244 |
| 2.30 M⊙ … 51 M⊙ | 2.19 | 1.84 | 0.93 | 218 |

Appendix C. Surface Brightness Data Processing

Appendix D. Compilation of Composite RCs

Appendix E. Summary Metadata for 214 Galaxies
| Galaxy ID (A to Z) | Hubble Type | Adopted Inclination | Adopted Distance | RC Max Velocity | S4G Total Luminosity | SPARC Total Luminosity | R27 Estimate | Light Source | RC Source(s) |
| Degrees | Mpc | km/s | 109 L⊙,3.6 | 109 L⊙,3.6 | kpc | 1 = S4G 2 = SPARC | Compilation by * SPARC, ** Sofue | ||
| CamB | 10 | 65 | 3.35 | 20.10 | n/a | 0.07 | 1.63 | 2 | 8 * |
| D512-2 | 10 | 56 | 15.20 | 37.20 | n/a | 0.25 | 5.60 | 2 | 64 * |
| D564-8 | 10 | 63 | 8.78 | 25.00 | n/a | 0.03 | 1.45 | 2 | 64 * |
| D631-7 | 10 | 59 | 6.94 | 58.50 | n/a | 0.19 | 2.49 | 2 | 64 *, 26 * |
| DDO064 | 10 | 60 | 6.97 | 46.90 | 0.11 | 0.15 | 4.10 | 1 | 23 *, 62 * |
| DDO154 | 10 | 60.2 | 4.00 | 48.72 | 0.03 | 0.05 | 1.71 | 1 | 5 *, 13 *, 22 |
| DDO161 | 10 | 70 | 7.35 | 67.50 | 0.44 | 0.53 | 6.63 | 1 | 20 * |
| DDO168 | 10 | 63 | 4.32 | 55.00 | 0.16 | 0.18 | 3.93 | 1 | 57 *, 12 * |
| DDO170 | 10 | 66 | 18.94 | 62.20 | n/a | 0.49 | 9.00 | 2 | 5 *, 41 * |
| ESO079-G014 | 4 | 79 | 30.14 | 178.00 | 48.86 | 45.34 | 23.96 | 1 | 33 * |
| ESO116-G012 | 7 | 74 | 16.82 | 112.00 | 7.67 | 4.39 | 14.52 | 1 | 33 * |
| ESO444-G084 | 10 | 32 | 5.21 | 63.10 | n/a | 0.08 | 1.77 | 2 | 20 * |
| ESO563-G021 | 4 | 83 | 69.58 | 321.00 | n/a | 311.81 | 51.28 | 2 | 61 * |
| F561-1 | 9 | 24 | 66.40 | 50.40 | n/a | 3.58 | 11.59 | 2 | 24 *, 25 * |
| F563-1 | 9 | 25 | 48.90 | 112.50 | n/a | 1.94 | 11.38 | 2 | 40 *, 25 * |
| F563-V1 | 10 | 60 | 54.00 | 29.50 | n/a | 0.94 | 12.04 | 2 | 24 *, 25 * |
| F563-V2 | 10 | 29 | 59.70 | 118.00 | n/a | 2.99 | 11.58 | 2 | 26 *, 25 * |
| F565-V2 | 10 | 60 | 51.80 | 83.10 | n/a | 0.54 | 7.03 | 2 | 24 *, 25 * |
| F567-2 | 9 | 20 | 79.00 | 52.20 | n/a | 1.76 | 10.72 | 2 | 24 *, 25 * |
| F568-1 | 5 | 26 | 90.70 | 142.00 | n/a | 5.60 | 16.71 | 2 | 26 *, 25 * |
| F568-3 | 7 | 40 | 82.40 | 120.00 | n/a | 7.67 | 21.57 | 2 | 40 *, 25 * |
| F568-V1 | 7 | 40 | 80.60 | 118.00 | n/a | 3.90 | 11.72 | 2 | 26 *, 25 * |
| F571-8 | 5 | 85 | 53.30 | 144.00 | n/a | 10.67 | 12.92 | 2 | 26 *, 25 * |
| F571-V1 | 7 | 30 | 80.10 | 84.30 | n/a | 1.77 | 10.10 | 2 | 24 *, 25 * |
| F574-1 | 7 | 65 | 96.80 | 99.70 | n/a | 5.67 | 16.89 | 2 | 26 *, 25 * |
| F574-2 | 9 | 30 | 89.10 | 40.00 | n/a | 2.42 | 12.96 | 2 | 24 *, 25 * |
| F579-V1 | 5 | 26 | 89.50 | 114.00 | n/a | 11.34 | 16.49 | 2 | 26 *, 25 * |
| F583-1 | 9 | 63 | 35.40 | 86.90 | n/a | 1.00 | 8.24 | 2 | 40 *, 25 * |
| F583-4 | 5 | 55 | 53.30 | 69.90 | n/a | 1.74 | 7.75 | 2 | 40 *, 25 * |
| IC2574 | 9 | 75 | 3.91 | 65.21 | 1.68 | 0.99 | 10.62 | 1 | 57 *, 45 *, 22 |
| IC4202 | 4 | 90 | 108.32 | 250.00 | n/a | 170.92 | 55.67 | 2 | 61 * |
| KK98-251 | 10 | 59 | 6.80 | 34.60 | n/a | 0.08 | 4.21 | 2 | 7 * |
| NGC0024 | 5 | 64 | 7.38 | 110.00 | 3.54 | 4.86 | 8.16 | 1 | 27 *, 18 * |
| NGC0100 | 6 | 89 | 15.37 | 91.20 | 3.82 | 3.12 | 12.37 | 1 | 23 *, 51 * |
| NGC0157 | 4 | 45 | 21.47 | 196.90 | 111.52 | n/a | 19.15 | 1 | 54 ** |
| NGC0247 | 7 | 74 | 3.66 | 108.00 | 7.69 | 6.57 | 16.86 | 1 | 57 *, 14 * |
| NGC0253 | 5 | 79.8 | 3.17 | 212.72 | 85.08 | n/a | 33.83 | 1 | 38 |
| NGC0289 | 4 | 46 | 20.96 | 194.00 | 70.03 | 62.58 | 24.19 | 1 | 70 * |
| NGC0300 | 7 | 42 | 1.96 | 96.12 | 4.28 | 2.78 | 7.49 | 1 | 57 *, 15 *, 39 ** |
| NGC0660 | 1 | 70 | 13.93 | 188.24 | 74.04 | n/a | 20.66 | 1 | 60 |
| NGC0801 | 5 | 80 | 70.33 | 238.00 | n/a | 348.70 | 49.10 | 2 | 57 *, 12 * |
| NGC1003 | 6 | 67 | 11.40 | 115.00 | n/a | 6.35 | 10.50 | 2 | 57 *, 12 *, 60 |
| NGC1090 | 4 | 64 | 34.23 | 176.00 | 62.52 | 73.94 | 30.87 | 1 | 33 * |
| NGC1097 | 3 | 40 | 17.00 | 358.58 | 245.23 | n/a | 35.43 | 1 | 60 |
| NGC1365 | 3 | 46 | 17.53 | 274.77 | 261.47 | n/a | 46.91 | 1 | 59 |
| NGC1705 | 11 | 80 | 5.60 | 73.20 | 0.48 | 0.59 | 2.33 | 1 | 43 * |
| NGC1808 | 1 | 58 | 11.04 | 207.00 | 80.08 | n/a | 17.98 | 1 | 59 |
| NGC2366 | 10 | 68 | 3.27 | 53.70 | n/a | 0.23 | 2.73 | 2 | 43 * |
| NGC2403 | 6 | 63 | 3.20 | 137.19 | n/a | 10.03 | 9.37 | 2 | 21 *, 30 *, 22, 59 |
| NGC2683 | 3 | 80 | 9.52 | 212.00 | 65.34 | 68.53 | 18.56 | 1 | 57 *, 12 * |
| NGC2841 | 3 | 73.7 | 14.10 | 325.22 | 167.02 | 131.07 | 26.66 | 1 | 27 *, 5 *, 22, 59 |
| NGC2903 | 4 | 65.2 | 8.74 | 215.75 | 85.55 | 78.84 | 18.82 | 1 | 5 *, 4 *, 22, 59 |
| NGC2915 | 11 | 56 | 4.13 | 86.50 | n/a | 0.57 | 2.93 | 2 | 28 * |
| NGC2955 | 3 | 56 | 97.53 | 276.00 | n/a | 298.94 | 62.42 | 2 | 61 * |
| NGC2976 | 5 | 61 | 3.58 | 88.99 | 3.58 | 2.42 | 4.72 | 1 | 58 *, 22 |
| NGC2998 | 5 | 58 | 64.25 | 214.00 | n/a | 165.97 | 35.51 | 2 | 57 *, 12 * |
| NGC3031 | 2 | 59 | 3.60 | 251.23 | 96.26 | n/a | 17.63 | 1 | 60, 22, 59 |
| NGC3041 | 5 | 35.9 | 23.14 | 130.12 | 39.01 | n/a | 17.50 | 1 | 44 ** |
| NGC3109 | 9 | 70 | 1.32 | 67.30 | n/a | 0.19 | 6.40 | 2 | 5 *, 36 * |
| NGC3198 | 5 | 71.5 | 13.80 | 161.81 | 35.51 | 38.04 | 21.14 | 1 | 21 *, 5 *, 4 *, 22, 59 |
| NGC3521 | 4 | 72.7 | 10.70 | 229.95 | 153.77 | 80.52 | 24.69 | 1 | 21 *, 57 *, 22, 59 |
| NGC3628 | 3 | 87 | 9.93 | 227.24 | 97.09 | n/a | 29.82 | 1 | 59 |
| NGC3672 | 5 | 67 | 26.63 | 218.99 | 97.67 | n/a | 19.62 | 1 | 60 |
| NGC3726 | 5 | 53 | 16.06 | 169.00 | 51.95 | 63.67 | 19.00 | 1 | 69 *, 56 * |
| NGC3741 | 10 | 70 | 3.23 | 51.60 | n/a | 0.02 | 0.91 | 2 | 34 *, 6 * |
| NGC3769 | 3 | 70 | 16.34 | 126.00 | 14.20 | 15.36 | 11.09 | 1 | 69 *, 56 * |
| NGC3893 | 5 | 49 | 18.04 | 194.00 | 60.80 | 51.76 | 13.82 | 1 | 69 *, 56 * |
| NGC3917 | 6 | 79 | 17.59 | 138.00 | 18.46 | 21.45 | 16.89 | 1 | 69 *, 56 * |
| NGC3949 | 4 | 55 | 17.51 | 169.00 | 32.62 | 27.51 | 10.19 | 1 | 69 *, 56 * |
| NGC3953 | 4 | 62 | 17.18 | 224.00 | 111.05 | 111.46 | 19.99 | 1 | 69 *, 56 * |
| NGC3972 | 4 | 77 | 18.55 | 134.00 | 13.56 | 12.96 | 14.39 | 1 | 69 *, 56 * |
| NGC3976 | 3 | 60 | 35.82 | 210.76 | 112.00 | n/a | 32.30 | 1 | 44 ** |
| NGC3992 | 4 | 56 | 23.07 | 272.00 | 199.35 | 171.03 | 35.35 | 1 | 69 *, 56 * |
| NGC4010 | 7 | 89 | 18.02 | 129.00 | 15.19 | 15.52 | 16.25 | 1 | 69 *, 56 * |
| NGC4013 | 3 | 89 | 17.94 | 198.00 | 78.06 | 44.36 | 21.22 | 1 | 69 *, 56 * |
| NGC4051 | 4 | 49 | 14.99 | 161.00 | 59.16 | 62.07 | 16.86 | 1 | 69 *, 56 * |
| NGC4068 | 10 | 44 | 4.45 | 41.90 | 0.19 | 0.22 | 2.35 | 1 | 43 * |
| NGC4085 | 5 | 82 | 18.29 | 136.00 | 20.81 | 20.24 | 8.51 | 1 | 69 *, 56 * |
| NGC4088 | 4 | 69 | 15.82 | 182.00 | 75.20 | 102.76 | 18.56 | 1 | 69 *, 56 * |
| NGC4100 | 4 | 73 | 19.59 | 195.00 | 63.30 | 52.13 | 19.76 | 1 | 69 *, 56 * |
| NGC4138 | 0 | 53 | 17.31 | 195.00 | 37.36 | 27.15 | 12.25 | 1 | 69 *, 56 * |
| NGC4157 | 3 | 82 | 17.50 | 201.00 | 94.30 | 100.43 | 23.76 | 1 | 69 *, 56 * |
| NGC4183 | 6 | 82 | 17.43 | 115.00 | 8.69 | 10.71 | 16.06 | 1 | 69 *, 56 * |
| NGC4192 | 2 | 74 | 14.80 | 236.98 | 91.18 | n/a | 26.68 | 1 | 59 |
| NGC4217 | 3 | 86 | 18.62 | 191.00 | 88.63 | 83.35 | 29.06 | 1 | 69 *, 56 * |
| NGC4244 | 6 | 84.5 | 4.10 | 99.06 | 3.54 | n/a | 12.99 | 1 | 49 ** |
| NGC4258 | 4 | 67 | 7.62 | 232.71 | 91.71 | n/a | 39.79 | 1 | 59 |
| NGC4303 | 4 | 25 | 16.50 | 152.31 | 137.66 | n/a | 22.08 | 1 | 59 |
| NGC4321 | 4 | 27 | 17.09 | 270.88 | 183.52 | n/a | 30.83 | 1 | 59 |
| NGC4395 | 9 | 46 | 4.51 | 83.80 | 1.60 | 2.35 | 7.66 | 1 | 63 *, 62 *, 44 ** |
| NGC4536 | 4 | 67 | 17.07 | 184.99 | 81.96 | n/a | 25.99 | 1 | 59 |
| NGC4559 | 6 | 67 | 9.32 | 124.00 | 19.48 | 19.09 | 17.53 | 1 | 1 * |
| NGC4565 | 3 | 86 | 12.65 | 260.35 | 161.22 | n/a | 37.54 | 1 | 59 |
| NGC4631 | 7 | 84 | 6.57 | 183.59 | 36.67 | n/a | 27.86 | 1 | 59 |
| NGC4736 | 2 | 41.4 | 4.70 | 198.29 | 51.46 | n/a | 16.09 | 1 | 60, 22, 59 |
| NGC4826 | 2 | 65.2 | 6.28 | 190.10 | 66.18 | n/a | 12.78 | 1 | 22 ** |
| NGC5005 | 4 | 68 | 18.91 | 265.00 | 212.56 | 163.55 | 22.55 | 1 | 52 * |
| NGC5033 | 5 | 66 | 15.70 | 225.00 | 107.85 | 112.15 | 30.75 | 1 | 57 *, 4 *, 60, 59 |
| NGC5055 | 4 | 56.2 | 9.90 | 210.75 | 155.71 | 147.54 | 31.39 | 1 | 2 *, 10 *, 60, 22, 59 |
| NGC0891 | 3 | 90 | 9.91 | 234.00 | n/a | 127.04 | 20.71 | 2 | 31 * |
| NGC5236 | 5 | 24 | 6.78 | 239.46 | 197.90 | n/a | 21.49 | 1 | 60 |
| NGC5371 | 4 | 53 | 35.04 | 242.00 | 241.30 | 324.43 | 26.16 | 1 | 57 *, 4 * |
| NGC5585 | 7 | 51 | 7.86 | 92.30 | 3.41 | 2.95 | 7.93 | 1 | 9 *, 57 *, 19 * |
| NGC5678 | 3 | 46.4 | 32.21 | 183.11 | 134.63 | n/a | 23.11 | 1 | 44 ** |
| NGC5907 | 5 | 88 | 16.37 | 248.97 | 143.49 | 156.90 | 40.48 | 1 | 57 *, 55 *, 60, 59 |
| NGC5985 | 3 | 60 | 43.53 | 305.00 | 240.41 | 189.55 | 38.83 | 1 | 10 *, 12 * |
| NGC6015 | 6 | 60 | 16.86 | 166.00 | 31.01 | 32.16 | 18.47 | 1 | 67 * |
| NGC6195 | 3 | 62 | 137.08 | 258.00 | n/a | 346.31 | 70.45 | 2 | 61 * |
| NGC6503 | 6 | 74 | 6.07 | 121.00 | 11.12 | 12.46 | 9.35 | 1 | 5 *, 4 * |
| NGC6674 | 3 | 54 | 51.20 | 291.00 | n/a | 209.11 | 39.72 | 2 | 57 *, 12 *, 60 |
| NGC6946 | 6 | 38 | 5.62 | 181.92 | n/a | 64.56 | 16.89 | 2 | 11 *, 60 *, 22, 59 |
| NGC7331 | 3 | 75 | 14.25 | 258.03 | n/a | 200.29 | 31.13 | 2 | 5 *, 4 *, 60, 22, 59 |
| NGC7793 | 7 | 49.6 | 3.85 | 114.66 | 7.62 | 6.99 | 7.42 | 1 | 27 *, 57 *, 15 *, 22 |
| NGC7814 | 2 | 90 | 15.39 | 250.00 | 81.52 | 66.86 | 28.05 | 1 | 31 * |
| PGC51017 | 11 | 66 | 13.49 | 20.50 | n/a | 0.16 | 2.22 | 2 | 43 * |
| UGC00128 | 8 | 57 | 66.37 | 134.00 | n/a | 12.08 | 23.81 | 2 | 68 *, 65 * |
| UGC00191 | 9 | 45 | 16.74 | 83.85 | 1.46 | 2.12 | 6.33 | 1 | 40 *, 66 * |
| UGC00634 | 9 | 37 | 29.19 | 108.00 | 2.20 | 1.96 | 10.75 | 1 | 66 * |
| UGC00731 | 10 | 57 | 11.80 | 73.90 | n/a | 0.32 | 7.55 | 2 | 63 *, 62 * |
| UGC00763 | 9 | 42 | 13.95 | 105.11 | 9.46 | n/a | 9.47 | 1 | 29 |
| UGC00891 | 9 | 60 | 9.78 | 63.75 | 0.26 | 0.33 | 3.98 | 1 | 66 * |
| UGC01230 | 9 | 22 | 55.33 | 113.00 | n/a | 8.26 | 16.63 | 2 | 23 *, 65 * |
| UGC01281 | 8 | 90 | 5.27 | 56.90 | n/a | 0.31 | 7.15 | 2 | 23 *, 62 *, 63 ** |
| UGC02023 | 10 | 19 | 10.10 | 58.80 | n/a | 0.91 | 6.66 | 2 | 63 *, 62 *, 63 ** |
| UGC02259 | 8 | 41 | 10.27 | 90.00 | n/a | 1.62 | 7.87 | 2 | 5 *, 16 * |
| UGC02455 | 10 | 51 | 7.34 | 61.00 | n/a | 3.18 | 7.35 | 2 | 63 *, 62 *, 63 ** |
| UGC02487 | 0 | 36 | 71.36 | 383.00 | n/a | 331.77 | 51.89 | 2 | 48 *, 47 * |
| UGC02885 | 5 | 64 | 83.11 | 305.00 | n/a | 394.69 | 63.66 | 2 | 57 *, 53 * |
| UGC02916 | 2 | 50 | 65.40 | 217.71 | n/a | 123.32 | 31.07 | 2 | 48 *, 47 *, 48 ** |
| UGC02953 | 2 | 50 | 16.50 | 319.00 | n/a | 259.77 | 26.72 | 2 | 48 *, 47 *, 48 ** |
| UGC03205 | 2 | 67 | 49.84 | 237.00 | n/a | 116.35 | 23.20 | 2 | 48 *, 47 *, 48 ** |
| UGC03546 | 1 | 55 | 28.70 | 257.89 | n/a | 80.74 | 19.48 | 2 | 48 *, 47 *, 48 ** |
| UGC03580 | 1 | 63 | 20.70 | 129.77 | n/a | 13.41 | 12.04 | 2 | 48 *, 47 *, 48 ** |
| UGC04273 | 3 | 61 | 34.07 | 209.69 | 51.36 | n/a | 18.83 | 1 | 29 |
| UGC04278 | 7 | 90 | 11.77 | 92.80 | 1.71 | 1.29 | 10.15 | 1 | 23 *, 62 * |
| UGC04284 | 5 | 59 | 11.04 | 122.26 | 4.15 | n/a | 8.88 | 1 | 29 |
| UGC04305 | 10 | 40 | 3.40 | 36.60 | 0.45 | 0.76 | 4.91 | 1 | 63 *, 62 *, 63 ** |
| UGC04325 | 9 | 41 | 10.31 | 92.70 | 1.98 | 1.96 | 6.50 | 1 | 63 *, 62 * |
| UGC04483 | 10 | 58 | 3.43 | 24.30 | 0.02 | 0.01 | 0.93 | 1 | 43 *, 42 * |
| UGC04499 | 8 | 50 | 11.98 | 74.30 | 1.00 | 1.42 | 5.69 | 1 | 63 *, 62 * |
| UGC04543 | 7 | 40 | 30.29 | 67.92 | 3.77 | n/a | 14.10 | 1 | 29 |
| UGC04605 | 2 | 74 | 25.45 | 227.22 | 58.60 | n/a | 18.75 | 1 | 48 ** |
| UGC04936 | 5 | 35 | 27.22 | 257.85 | 36.90 | n/a | 24.81 | 1 | 29 |
| UGC05005 | 10 | 41 | 55.33 | 100.00 | n/a | 4.53 | 11.27 | 2 | 23 *, 65 * |
| UGC05253 | 2 | 37 | 21.50 | 248.00 | 127.83 | 171.32 | 31.48 | 1 | 48 *, 47 *, 48 ** |
| UGC05316 | 5 | 68 | 18.24 | 143.03 | 7.93 | n/a | 17.16 | 1 | 29 |
| UGC05414 | 10 | 55 | 11.19 | 61.40 | 1.43 | 0.88 | 7.38 | 1 | 63 *, 62 * |
| UGC05716 | 9 | 54 | 20.71 | 74.70 | n/a | 0.54 | 4.42 | 2 | 66 * |
| UGC05721 | 7 | 61 | 6.18 | 80.87 | 0.49 | 0.55 | 2.64 | 1 | 23 *, 62 *, 63 ** |
| UGC05750 | 8 | 64 | 60.21 | 78.90 | n/a | 3.37 | 15.76 | 2 | 26 *, 65 * |
| UGC05764 | 10 | 60 | 8.42 | 55.80 | 0.06 | 0.08 | 2.69 | 1 | 66 * |
| UGC05789 | 5 | 61 | 14.33 | 123.77 | 9.68 | n/a | 14.32 | 1 | 29 |
| UGC05829 | 10 | 34 | 8.64 | 68.60 | 0.55 | 0.51 | 5.45 | 1 | 63 *, 62 *, 63 ** |
| UGC05918 | 10 | 46 | 7.66 | 44.50 | 0.07 | 0.22 | 6.06 | 1 | 63 *, 62 *, 63 ** |
| UGC05931 | 5 | 56 | 24.29 | 143.28 | 20.83 | n/a | 11.40 | 1 | 29 |
| UGC05982 | 5 | 56 | 25.68 | 193.98 | 49.56 | n/a | 15.44 | 1 | 29 |
| UGC05986 | 9 | 90 | 8.70 | 116.05 | 4.80 | 4.61 | 15.27 | 1 | 63 *, 62 *, 63 ** |
| UGC05999 | 10 | 22 | 48.79 | 100.00 | n/a | 2.95 | 10.88 | 2 | 24 *, 65 * |
| UGC06399 | 9 | 75 | 18.41 | 87.60 | 2.03 | 2.19 | 9.82 | 1 | 69 *, 56 * |
| UGC06446 | 7 | 51 | 12.00 | 83.20 | 0.91 | 0.95 | 4.92 | 1 | 69 *, 56 *, 63 ** |
| UGC06614 | 1 | 36 | 91.38 | 205.00 | n/a | 102.19 | 29.78 | 2 | 26 *, 65 * |
| UGC06628 | 9 | 20 | 15.30 | 42.45 | 2.85 | 2.95 | 8.16 | 1 | 63 *, 62 *, 63 ** |
| UGC06786 | 0 | 64 | 28.97 | 231.47 | 63.33 | 78.05 | 20.23 | 1 | 48 *, 47 *, 48 ** |
| UGC06787 | 2 | 66 | 21.30 | 276.00 | 82.59 | 98.19 | 22.10 | 1 | 48 *, 47 *, 48 ** |
| UGC06818 | 9 | 75 | 18.13 | 74.40 | 1.39 | 1.49 | 7.38 | 1 | 69 *, 56 * |
| UGC06903 | 6 | 32.4 | 30.01 | 159.06 | 15.17 | n/a | 12.80 | 1 | 46 ** |
| UGC06917 | 9 | 56 | 18.51 | 111.00 | 5.43 | 5.90 | 12.02 | 1 | 69 *, 56 * |
| UGC06918 | 3 | 30 | 21.75 | 158.40 | 36.13 | n/a | 8.86 | 1 | 46 ** |
| UGC06923 | 10 | 65 | 17.90 | 81.10 | n/a | 2.38 | 7.70 | 2 | 69 *, 56 * |
| UGC06930 | 7 | 32 | 17.13 | 109.00 | 8.00 | 8.28 | 10.63 | 1 | 69 *, 56 * |
| UGC06973 | 2 | 71 | 21.20 | 180.00 | 72.57 | 37.80 | 12.13 | 1 | 69 *, 56 * |
| UGC06983 | 6 | 49 | 19.53 | 113.00 | 5.02 | 4.57 | 11.55 | 1 | 69 *, 56 * |
| UGC07089 | 8 | 80 | 14.63 | 79.10 | 2.18 | 3.36 | 10.22 | 1 | 69 *, 56 * |
| UGC07125 | 9 | 90 | 19.50 | 65.46 | 2.27 | 2.68 | 12.48 | 1 | 63 *, 62 *, 63 ** |
| UGC07151 | 6 | 90 | 6.63 | 76.20 | 2.03 | 2.10 | 9.90 | 1 | 63 *, 62 *, 63 ** |
| UGC07232 | 10 | 59 | 2.89 | 44.00 | 0.09 | 0.09 | 1.23 | 1 | 63 *, 62 * |
| UGC07261 | 8 | 30 | 9.10 | 76.10 | 1.57 | 1.64 | 6.09 | 1 | 63 *, 62 *, 63 ** |
| UGC07278 | 10 | 15 | 3.30 | 80.60 | 2.30 | 1.16 | 4.54 | 1 | 43 *, 63 * |
| UGC07323 | 8 | 47 | 8.00 | 85.60 | 3.48 | 3.68 | 7.29 | 1 | 63 *, 62 *, 63 ** |
| UGC07399 | 8 | 55 | 8.43 | 104.81 | 1.02 | 1.08 | 3.84 | 1 | 63 *, 62 *, 63 ** |
| UGC07559 | 10 | 61 | 4.25 | 32.77 | 0.07 | 0.11 | 2.14 | 1 | 63 *, 62 *, 63 ** |
| UGC07577 | 10 | 63 | 2.92 | 17.80 | 0.13 | 0.04 | 2.92 | 1 | 63 *, 62 *, 63 ** |
| UGC07603 | 7 | 78 | 6.80 | 64.00 | 0.65 | 0.37 | 5.00 | 1 | 63 *, 62 *, 63 ** |
| UGC07608 | 10 | 25 | 8.26 | 69.30 | 0.20 | 0.23 | 3.86 | 1 | 63 *, 62 *, 63 ** |
| UGC07690 | 10 | 41 | 8.11 | 60.70 | 0.65 | 0.77 | 3.22 | 1 | 63 *, 62 *, 63 ** |
| UGC07866 | 10 | 44 | 5.03 | 33.10 | 0.11 | 0.11 | 2.63 | 1 | 63 *, 62 * |
| UGC08286 | 6 | 90 | 6.50 | 84.30 | 1.10 | 1.24 | 7.00 | 1 | 63 *, 62 *, 63 ** |
| UGC08490 | 9 | 50 | 4.90 | 80.18 | 1.00 | 0.98 | 4.09 | 1 | 63 *, 62 *, 63 ** |
| UGC08550 | 7 | 90 | 6.70 | 57.50 | 0.34 | 0.28 | 4.03 | 1 | 63 *, 62 *, 63 ** |
| UGC08699 | 2 | 73 | 39.30 | 202.86 | 46.19 | 50.98 | 16.77 | 1 | 48 *, 47 *, 48 ** |
| UGC08837 | 10 | 80 | 6.17 | 48.00 | 0.30 | 0.47 | 5.45 | 1 | 63 *, 62 *, 63 ** |
| UGC09037 | 6 | 65 | 82.15 | 160.00 | n/a | 56.24 | 39.03 | 2 | 35 * |
| UGC09133 | 2 | 53 | 57.10 | 289.00 | n/a | 281.14 | 40.42 | 2 | 48 *, 47 *, 48 ** |
| UGC09649 | 3 | 65 | 9.47 | 94.81 | 2.61 | n/a | 6.61 | 1 | 29 |
| UGC09753 | 4 | 69 | 14.82 | 137.64 | 18.78 | n/a | 12.50 | 1 | 29 |
| UGC09837 | 5 | 31.3 | 42.41 | 157.70 | 15.66 | n/a | 14.80 | 1 | 46 ** |
| UGC09858 | 4 | 79 | 38.88 | 160.87 | 43.02 | n/a | 31.29 | 1 | 29 |
| UGC09992 | 10 | 30 | 10.57 | 34.30 | 0.24 | 0.32 | 4.10 | 1 | 63 *, 62 * |
| UGC10310 | 9 | 34 | 15.20 | 72.95 | 1.15 | 1.66 | 6.78 | 1 | 63 *, 62 *, 63 ** |
| UGC10359 | 6 | 32 | 17.47 | 138.20 | 12.11 | n/a | 11.35 | 1 | 29 |
| UGC10445 | 6 | 45 | 21.25 | 78.64 | 4.41 | n/a | 9.07 | 1 | 29 |
| UGC10470 | 4 | 43 | 24.17 | 165.51 | 58.12 | n/a | 13.83 | 1 | 29 |
| UGC10546 | 6 | 54 | 22.63 | 107.80 | 7.17 | n/a | 10.97 | 1 | 29 |
| UGC10897 | 5 | 30 | 22.53 | 119.73 | 24.66 | n/a | 10.27 | 1 | 29 |
| UGC11455 | 6 | 90 | 81.46 | 291.00 | n/a | 373.93 | 40.28 | 2 | 61 * |
| UGC11557 | 8 | 30 | 23.70 | 84.50 | n/a | 12.21 | 10.34 | 2 | 62 *, 26 *, 63 **, 32 ** |
| UGC11820 | 9 | 45 | 17.67 | 84.45 | n/a | 1.51 | 6.17 | 2 | 40 *, 66 * |
| UGC12343 | 5 | 42 | 31.41 | 225.26 | 186.25 | n/a | 26.19 | 1 | 29 |
| UGC12506 | 6 | 86 | 99.47 | 255.00 | n/a | 136.10 | 67.69 | 2 | 35 * |
| UGC12632 | 9 | 46 | 9.44 | 74.86 | n/a | 1.26 | 8.42 | 2 | 63 *, 62 *, 32 **, 63 ** |
| UGC12732 | 9 | 39 | 13.20 | 98.00 | 1.29 | 1.64 | 7.55 | 1 | 63 *, 62 * |
| UGC12754 | 5 | 49 | 12.10 | 125.80 | 9.48 | n/a | 8.57 | 1 | 29 |
| UGCA442 | 9 | 64 | 4.76 | 57.80 | 0.14 | 0.14 | 3.55 | 1 | 20 * |
| UGCA444 | 10 | 78 | 1.00 | 38.30 | 0.11 | 0.01 | 3.39 | 1 | 37 * |
Appendix F. Rotation Curves Data Sources
| Code | External Reference (A to Z) | ||
| 1 | Barbieri, C.V. et al., 2005, A&A 439, 947 | 36 | Jobin, M. & Carignan, C. 1990, AJ, 100, 648 |
| 2 | Battaglia, G. et al., 2006 A&A 447 49 | 37 | Kepley, A.A. et al., 2007, AJ, 133, 2242 |
| 3 | Battaglia, G. et al., 2006, A&A, 447, 49 | 38 | k-Larrondo, J. et al., 2011 MNRAS, 411, 71 |
| 4 | Begeman, K.G. 1987, PhD thesis, Univers. of Groningen | 39 | k-Larrondo, J. et al., 2011 MNRAS, 416, 509 |
| 5 | Begeman, K.G. et al., 1991, MNRAS, 249, 523 | 40 | Kuzio de Naray, R. et al., 2008, ApJ, 676, 920 |
| 6 | Begum, A. et al., 2005, A&A 433, L1 | 41 | Lake, G. et al., 1990, AJ, 99, 547 |
| 7 | Begum, A. & Chengalur, J.N. 2004, A&A, 424, 509 | 42 | Lelli, F. et al., 2012, A&A, 544, A145 |
| 8 | Begum, A. et al., 2003, New A, 8, 267 | 43 | Lelli, F. et al., 2014, A&A, 566, A71 |
| 9 | Blais-Ouellette, S. et al., 1999, AJ, 118, 2123 | 44 | Marquez I. et al., 2002 A&A, 393, 389 |
| 10 | Blais-Ouellette, S. et al., 2004, A&A, 420, 147 | 45 | Martimbeau, N. & Carignan, C. 1994, AJ, 107, 543 |
| 11 | Boomsma, R. et al., 2008, A&A, 490, 555 | 46 | Martinsson et al., 2013 A&A 557 |
| 12 | Broeils, A.H. 1992, PhD thesis, University of Groningen | 47 | Noordermeer, E. et al., 2005, A&A, 442, 137 |
| 13 | Carignan, C. & Beaulieu, S. 1989, AJ, 347, 192 | 48 | Noordermeer, E. et al., 2007, MNRAS, 376, 1513 |
| 14 | Carignan, C. & Puche, D. 1990a, AJ, 100, 394 | 49 | Olling, R.P. 1996 AJ, 122, 457 |
| 15 | Carignan, C. & Puche, D. 1990b, AJ, 100, 641 | 50 | Puche, D. et al., 1991, AJ, 101, 447 |
| 16 | Carignan, C. et al., 1988, AJ, 95, 37 | 51 | Rhee, M. & vanAlbada, T.S. 1996, A&AS, 115, 407 |
| 17 | Casertano, S. & van Gorkom, J.H. 1991, ApJ, 101, 1231 | 52 | Richards, E.E. et al., 2015, MNRAS, 449, 3981 |
| 18 | Chemin, L. et al., 2006, AJ, 132, 2527 | 53 | Roelfsema, P.R. & Allen, R.J. 1985, A&A, 146, 213 |
| 19 | Cote, S. et al., 1991, AJ, 102, 904 | 54 | Ryder S.D. et al., 1998 MNRAS 293, 411 |
| 20 | Cote, S. et al., 2000, AJ, 120, 3027 | 55 | Sancisi & vanAlbada. 1987, in IAU Symp. 117, 67 |
| 21 | Daigle, O. et al., 2006, MNRAS, 367, 469 | 56 | Sanders. & Verheijen. 1998, ApJ, 503, 97 |
| 22 | de Blok W.J.G. et al., 2008 AJ 136 2648 | 57 | Sanders, R.H. 1996, ApJ, 437, 117 |
| 23 | de Blok, W.J.G. & Bosma, A. 2002, A&A, 385, 816 | 58 | Simon, J.D. et al., 2003, 596, 957 |
| 24 | de Blok, W.J.G. & McGaugh, S.S. 1997, MNRAS, 290, 533 | 59 | Sofue, Y. 2015 PASJ, 68, 2 |
| 25 | de Blok, W.J.G. et al., 1996, MNRAS, 283, 18 | 60 | Sofue, Y. et al., 1999 AJ, 523, 136 |
| 26 | de Blok, W.J.G. et al., 2001, AJ, 122, 2396 | 61 | Spekkens, K. & Giovanelli, R. 2006, AJ, 132, 1426 |
| 27 | Dicaire, I. et al., 2008, MNRAS, 385, 553 | 62 | Swaters, R.A. 2002, A&A, 390, 829 |
| 28 | Elson, E.C. et al., 2010, MNRAS, 404, 2061 | 63 | Swaters, R.A. 2009, A&A, 493, 871 |
| 29 | Epinat B. et al., 2008 MNRAS, 388, 500 | 64 | Trachternarch, C. et al., 2009, A&A, 505, 577 |
| 30 | Fraternali F. et al., 2002 AJ 123 3124 | 65 | van der Hulst, J.M. et al., 1993, AJ, 106, 548 |
| 31 | Fraternali, F. et al., 2011, A&A, 531, A64 | 66 | van Zee, L. 1997, AJ, 113, 1618 |
| 32 | Garrido et al., 2005 MNRAS, 362, 127 | 67 | Verdes-Montenegro, L. et al., 1997, A&A, 321, 754 |
| 33 | Gentile, G. et al., 2004, MNRAS, 351, 903 | 68 | Verheijen & de Blok, 1999, Ap&SS, 269, 673 |
| 34 | Gentile, G. et al., 2007, MNRAS, 375, 199 | 69 | Verheijen & Sancisi, 2001, A&A, 370, 765 |
| 35 | Hallenbeck, G. et al., 2014, AJ, 148, 69 | 70 | Walsh, W. et al., 1997, AJ, 113, 1591. |
References
- De Blok, W.J.G. The core-cusp problem. Adv. Astron. 2010. Available online: https://www.hindawi.com/journals/aa/2010/789293/ (accessed on 24 April 2020). [CrossRef]
- Ogiya, G.; Mori, M. The core-cusp problem in cold dark matter halos and supernova feedback: Effects of oscillation. Astrophys. J. 2014, 793, 46. [Google Scholar] [CrossRef]
- Genina, A.; Benítez-Llambay, A.; Frenk, C.S.; Cole, S.; Fattahi, A.; Navarro, J.F.; Oman, K.A.; Sawala, T.; Theuns, T. The core–cusp problem: A matter of perspective. Mon. Not. R. Astron. Soc. 2018, 474, 1398–1411. [Google Scholar] [CrossRef]
- Undagoitia, T.M.; Rauch, L. Dark matter direct-detection experiments. J. Phys. G Nucl. Part Phys. 2015, 43, 013001. [Google Scholar] [CrossRef]
- Smith, P.F.; Smith, N.J.T.; Lewin, J.D.; Homer, G.J.; Alner, G.J.; Arnison, G.T.J.; Quenby, J.J.; Sumner, T.J.; Bewick, A.; Ali, T.; et al. Dark matter experiments at the UK Boulby Mine UK Dark Matter Collaboration. Phys. Rep. 1998, 307, 275–282. [Google Scholar] [CrossRef]
- Lewin, J.D.; Smith, P.F. Review of Mathematics, Numerical Factors, and Corrections for Dark Matter Experiments Based on Elastic Nuclear Recoil. Astropart. Phys. 1996, 6, 87–112. [Google Scholar] [CrossRef]
- Billard, J.; Figueroa-Feliciano, E.; Strigari, L. Implication of neutrino backgrounds on the reach of next generation dark matter direct detection experiments. Phys. Rev. D 2014, 89, 023524. [Google Scholar] [CrossRef]
- Chang, J.; Ambrosi, G.; An, Q.; Asfandiyarov, R.; Azzarello, P.; Bernardini, P.; Bertucci, B.; Cai, M.S.; Caragiulo, M.; Chen, D.Y.; et al. The DArk matter particle explorer mission. Astropart. Phys. 2017, 95, 6–24. [Google Scholar] [CrossRef]
- Bertone, G.; Hooper, D.; Silk, J. Particle dark matter: Evidence, candidates and constraints. Phys. Rep. 2005, 405, 279–390. [Google Scholar] [CrossRef]
- Berezinsky, V.; Valle, J.W. The KeV majoron as a dark matter particle. Phys. Lett. B 1993, 318, 360–366. [Google Scholar] [CrossRef]
- Sofue, Y.; Rubin, V. Rotation curves of spiral galaxies. Annu. Rev. Astron. Astrophys. 2001, 39, 137–174. [Google Scholar] [CrossRef]
- Rubin, V.C.; Ford, W.K., Jr.; Thonnard, N. Rotational properties of 21 SC galaxies with a large range of luminosities and radii, from NGC 4605/R= 4kpc/to UGC 2885/R= 122 kpc. Astrophys. J. 1980, 238, 471–487. [Google Scholar] [CrossRef]
- Rubin, V.C. The rotation of spiral galaxies. Science 1983, 220, 1339–1344. [Google Scholar] [CrossRef] [PubMed]
- Rubin, V.C.; Ford, W.K., Jr.; Thonnard, N. Extended rotation curves of high-luminosity spiral galaxies. IV-Systematic dynamical properties, SA through, S.C. Astrophys. J. 1978, 225, L107–L111. [Google Scholar] [CrossRef]
- Adams, F.C.; Walker, T.P. Brown dwarfs as dark galactic halos. Astrophys. J. 1990, 359, 57–62. [Google Scholar] [CrossRef]
- Ivanov, P.; Naselsky, P.; Novikov, I. Inflation and primordial black holes as dark matter. Phys. Rev. D 1994, 50, 7173. [Google Scholar] [CrossRef] [PubMed]
- Carr, B.; Kühnel, F.; Sandstad, M. Primordial black holes as dark matter. Phys. Rev. D 2016, 94, 083504. [Google Scholar] [CrossRef]
- Pfenniger, D.; Combes, F. Is dark matter in spiral galaxies cold gas? I.I. Fractal models and star non-formation. Astron. Astrophys. 1994, 285, 94–118. [Google Scholar]
- Heithausen, A. Molecular hydrogen as baryonic dark matter. Astrophys. J. Lett. 2004, 606, L13. [Google Scholar] [CrossRef][Green Version]
- Milgrom, M. A modification of the Newtonian dynamics as a possible alternative to the hidden mass hypothesis. Astrophys. J. 1983, 270, 365–370. [Google Scholar] [CrossRef]
- Sanders, R.H.; McGaugh, S.S. Modified Newtonian dynamics as an alternative to dark matter. Annu. Rev. Astron. Astrophys. 2002, 40, 263–317. [Google Scholar] [CrossRef]
- Kroupa, P. The dark matter crisis: Problems with the current standard model of cosmology and steps towards an improved model. In Proceedings of the Probes of Dark Matter on Galaxy Scales, AAS Topical Conference Series Vol. 1, Monterey, CA, USA, 14–19 July 2013. [Google Scholar]
- Van Dokkum, P.; Danieli, S.; Cohen, Y.; Merritt, A.; Romanowsky, A.J.; Abraham, R.; Brodie, J.; Charlie, C.; Lokhorst, D.; Mowla, L.; et al. A galaxy lacking dark matter. Nature 2018, 555, 629–632. [Google Scholar] [CrossRef] [PubMed]
- Feng, J.Q.; Gallo, C.F. Mass distribution in rotating thin-disk galaxies according to Newtonian dynamics. Galaxies 2014, 2, 199–222. [Google Scholar] [CrossRef]
- Rubin, V.C. Dark matter in the universe. Proc. Am. Philos. Soc. 1988, 132, 434–443. [Google Scholar]
- Rubin, V.C. Galaxy dynamics and the mass density of the universe. Proc. Natl. Acad. Sci. USA 1993, 90, 4814–4821. [Google Scholar] [CrossRef] [PubMed]
- Komatsu, E.; Smith, K.; Dunkley, J.; Bennett, C.L.; Gold, B.; Hinshaw, G.; Jarosik, N.; Larson, D.; Nolta, M.R.; Page, L.; et al. Seven-year wilkinson microwave anisotropy probe (WMAP*) observations: Cosmological interpretation. Astrophys. J. Suppl. Ser. 2011, 192, 18. [Google Scholar] [CrossRef]
- Hinshaw, G.; Larson, D.; Komatsu, E.; Spergel, D.N.; Bennett, C.L.; Dunkley, J.; Nolta, M.R.; Halpern, M.; Hill, R.S.; Odegard, N.; et al. Nine-year Wilkinson Microwave Anisotropy Probe (WMAP) observations: Cosmological parameter results. Astrophys. J. Suppl. Ser. 2013, 208, 19. [Google Scholar] [CrossRef]
- Pavlovich, K.; Pavlovich, A.; Sipols, A. Newtonian explanation of galaxy rotation curves based on distribution of baryonic matter. arXiv 2014, arXiv:14062401. Available online: https://arxiv.org/abs/1406.2401 (accessed on 24 April 2020).
- Jałocha, J.; Bratek, L.; Kutschera, M.; Skindzier, P. Global disc models for galaxies NGC 1365, 6946, 7793 and UGC 6446. Mon. Not. R. Astron. Soc. 2010, 406, 2805–2816. [Google Scholar] [CrossRef]
- Chemin, L.; Carignan, C.; Foster, T. HI kinematics and dynamics of Messier 31. Astrophys. J. 2009, 705, 1395. [Google Scholar] [CrossRef]
- Geehan, J.J.; Fardal, M.A.; Babul, A.; Guhathakurta, P. Investigating the Andromeda stream—I. Simple analytic bulge—disc—halo model for M31. Mon. Not. R. Astron. Soc. 2006, 366, 996–1011. [Google Scholar] [CrossRef]
- Golse, G.; Kneib, J.-P. Pseudo elliptical lensing mass model: Application to the NFW mass distribution. Astron. Astrophys. 2002, 390, 821–827. [Google Scholar] [CrossRef]
- Sofue, Y. Dark Halos of M31 and the Milky Way. Publ. Astron. Soc. Jpn. 2015, 67, 75. [Google Scholar] [CrossRef]
- Lelli, F.; McGaugh, S.S.; Schombert, J.M. SPARC: Mass models for 175 disk galaxies with Spitzer photometry and accurate rotation curves. Astron. J. 2016, 152, 157. [Google Scholar] [CrossRef]
- Walter, F.; Brinks, E.; De Blok, W.; Bigiel, F.; Kennicutt, R.C., Jr.; Thornley, M.D.; Leroy, A.K. THINGS: The HI nearby galaxy survey. Astron. J. 2008, 136, 2563. [Google Scholar] [CrossRef]
- Querejeta, M.; Meidt, S.E.; Schinnerer, E.; Cisternas, M.; Muñoz-Mateos, J.C.; Sheth, K.; Knapen, J.; Van de Ven, G.; Norris, M.; Peletier, R.; et al. The Spitzer Survey of Stellar Structure in Galaxies (S4G): Precise stellar mass distributions from automated dust correction at 3.6 μm. Astrophys. J. Suppl. Ser. 2015, 219, 5. [Google Scholar] [CrossRef]
- Salo, H.; Laurikainen, E.; Laine, J.; Comerón, S.; Gadotti, D.; Buta, R.; Sheth, K.; Zaritsky, D.; Ho, L.; Knapen, J.; et al. The Spitzer Survey of Stellar Structure in Galaxies (S4G): Multi-component decomposition strategies and data release. Astrophys. J. Suppl. Ser. 2015, 219, 4. [Google Scholar] [CrossRef]
- Muñoz-Mateos, J.C.; Sheth, K.; Regan, M.; Kim, T.; Laine, J.; Erroz- Ferrer, S.; Gil de Paz, A.; Comeron, S.; Hinz, J.; Laurikainen, E.; et al. The Spitzer Survey of stellar structure in galaxies (S4G): Stellar masses, sizes, and radial profiles for 2352 nearby galaxies. Astrophys. J. Suppl. Ser. 2015, 219, 3. [Google Scholar] [CrossRef]
- Buta, R.J.; Sheth, K.; Athanassoula, E.; Bosma, A.; Knapen, J.H.; Laurikainen, E.; Salo, H.; Elmegreen, D.; Ho, L.C.; Zaritsky, D.; et al. A classical morphological analysis of galaxies in the Spitzer survey of stellar structure in galaxies (S4G). Astrophys. J. Suppl. Ser. 2015, 217, 32. [Google Scholar] [CrossRef]
- Walter, F.; Brinks, E.; de Blok, W.; Thornley, M.D.; Kennicutt, R. First Results from THINGS: The HI Nearby Galaxy Survey. Extra-planar GAS ASP Conference Series. 2005, Volume 331. Available online: https://arxiv.org/abs/astro-ph/0407103 (accessed on 24 April 2020).
- Epinat, B.; Amram, P.; Marcelin, M. GHASP: An Hα kinematic survey of 203 spiral and irregular galaxies–VII. Revisiting the analysis of Hα data cubes for 97 galaxies. Mon. Not. R. Astron. Soc. 2008, 390, 466–504. [Google Scholar] [CrossRef]
- Epinat, B.; Amram, P.; Marcelin, M.; Balkowski, C.; Daigle, O.; Hernandez, O.; Chemin, L.; Carignan, C.; Gach, J.L.; Balard, P. GHASP: An Hα kinematic survey of spiral and irregular galaxies–VI. New Hα data cubes for 108 galaxies. Mon. Not. R. Astron. Soc. 2008, 388, 500–550. [Google Scholar] [CrossRef]
- Sofue, Y. The most completely sampled rotation curves for galaxies. Astrophys. J. 1996, 458, 120–131. [Google Scholar] [CrossRef]
- Sofue, Y.; Tutui, Y.; Honma, M.; Tomita, A.; Takamiya, T.; Koda, J.; Takeda, Y. Central rotation curves of spiral galaxies. Astrophys. J. 1999, 523, 136. [Google Scholar] [CrossRef]
- Swaters, R.; Sancisi, R.; Van Albada, T.; Van Der Hulst, J. The rotation curves shapes of late-type dwarf galaxies. Astron. Astrophys. 2009, 493, 871–892. [Google Scholar] [CrossRef]
- Lehner, N.; Howk, J.C.; Wakker, B.P. Evidence for a massive, extended circumgalactic medium around the andromeda Galaxy. Astrophys. J. 2015, 804, 79. [Google Scholar] [CrossRef]
- Sparke, L.S.; Gallagher, J.S., III. Galaxies in the Universe: An Introduction; Cambridge University Press: Cambridge, UK, 2007. [Google Scholar]
- Limoges, M.-M.; Lépine, S.; Bergeron, P. Toward a Spectroscopic Census of White Dwarfs within 40 pc of the Sun. Astron. J. 2013, 145, 136. [Google Scholar] [CrossRef]
- Limoges, M.-M.; Bergeron, P.; Lépine, S. Physical properties of the current census of northern white dwarfs within 40 pc of the sun. Astrophys. J. Suppl. Ser. 2015, 219, 19. [Google Scholar] [CrossRef]
- Bigiel, F.; Blitz, L. A universal neutral gas profile for nearby disk galaxies. Astrophys. J. 2012, 756, 183. [Google Scholar] [CrossRef]
- Izotov, Y.I.; Thuan, T.X.; Lipovetsky, V.A. The primordial helium abundance: Systematic effects and a new determination. Astrophys. J. Suppl. Ser. 1997, 108, 1. [Google Scholar] [CrossRef]
- Vogelsberger, M.; McKinnon, R.; O’Neil, S.; Marinacci, F.; Torrey, P.; Kannan, R. Dust in and around galaxies: Dust in cluster environments and its impact on gas cooling. Mon. Not. R. Astron. Soc. 2019, 487, 4870–4883. [Google Scholar] [CrossRef]
- Robert, J.; Gagné, J.; Artigau, É.; Lafrenière, D.; Nadeau, D.; Doyon, R.; Malo, L.; Albert, L.; Simard, C.; Bardalez Gagliuffi, D.C.; et al. A Brown Dwarf Census from the SIMP Survey. Astrophys. J. 2016, 830, 144. [Google Scholar] [CrossRef]
- Holberg, J.B.; Oswalt, T.D.; Sion, E.M.; McCook, G.P. The 25 parsec local white dwarf population. Mon. Not. R. Astron. Soc. 2016, 462, 2295–2318. [Google Scholar] [CrossRef]
- Kawka, A.; Vennes, S.; Thorstensen, J.R. Observations of white dwarfs in the solar neighborhood. Astron. J. 2004, 127, 1702. [Google Scholar] [CrossRef]
- Holberg, J.B.; Oswalt, T.D.; Sión, E.M. A determination of the local density of white dwarf stars. Astrophys. J. 2002, 571, 512. [Google Scholar] [CrossRef][Green Version]
- Sartore, N.; Ripamonti, E.; Treves, A.; Turolla, R. Galactic neutron stars-I. Space and velocity distributions in the disk and in the halo. Astron. Astrophys. 2010, 510, A23. [Google Scholar] [CrossRef]
- Elbert, O.D.; Bullock, J.S.; Kaplinghat, M. Counting black holes: The cosmic stellar remnant population and implications for LIGO. Mon. Not. R. Astron. Soc. 2018, 473, 1186–1194. [Google Scholar] [CrossRef]
- Maíz Apellániz, J.; Sota, A.; Arias, J.I.; Barbá, R.H.; Walborn, N.R.; Simón-Díaz, S.; Negueruela, I.; Marco, A.; Leão, J.R.S.; Herrero, A.; et al. The galactic O-star Spectroscopic Survey (GOSSS), III: 142 additional O-type systems. Astrophysical J. Suppl. Series 2016, 224, 1. [Google Scholar]
- Arias, J.I.; Walborn, N.R.; Díaz, S.S.; Barbá, R.H.; Maíz Apellániz, J.; Sabín-Sanjulián, C.; Gamen, R.C.; Morrell, N.I.; Sota, A.; Marco, A.; et al. Spectral classification and properties of the O Vz stars in the Galactic O-Star Spectroscopic Survey (GOSSS). Astron. J. 2016, 152, 31. [Google Scholar] [CrossRef]
- Bartko, H.; Martins, F.; Trippe, S.; Fritz, T.K.; Genzel, R.; Ott, T.; Eisenhauer, F.; Gillessen, S.; Paumard, T.; Alexander, T.; et al. An extremely top-heavy IMF in the galactic center stellar disks. Astrophys. J. 2009, 708, 1. [Google Scholar]
- Maness, H.; Martins, F.; Trippe, S.; Genzel, R.; Graham, J.R.; Sheehy, C.; Salaris, M.; Gillessen, S.; Alexander, T.; Paumard, T.; et al. Evidence for a long-standing top-heavy initial mass function in the central parsec of the galaxy. Astrophys. J. 2007, 669, 1024. [Google Scholar] [CrossRef]
- Marks, M.; Kroupa, P.; Dabringhausen, J.; Pawlowski, M.S. Evidence for top-heavy stellar initial mass functions with increasing density and decreasing metallicity. Mon. Not. R. Astron. Soc. 2012, 422, 2246–2254. [Google Scholar] [CrossRef]
- Kainulainen, J.; Federrath, C.; Henning, T. Unfolding the Laws of Star Formation: The Density Distribution of Molecular Clouds. Science 2014, 344, 183–185. [Google Scholar] [CrossRef] [PubMed]
- Kainulainen, J.; Beuther, H.; Henning, T.; Plume, R. Probing the evolution of molecular cloud structure-From quiescence to birth. Astron. Astrophys. 2009, 508, L35–L38. [Google Scholar] [CrossRef]
- Kainulainen, J.; Federrath, C.; Henning, T. Connection between dense gas mass fraction, turbulence driving, and star formation efficiency of molecular clouds. Astron. Astrophys. 2013, 553, L8. [Google Scholar] [CrossRef]
- Bland-Hawthorn, J.; Vlajić, M.; Freeman, K.C.; Draine, B.T. NGC 300: An extremely faint, outer stellar disk observed to 10 scale lengths. Astrophys. J. 2005, 629, 239. [Google Scholar] [CrossRef]
- Ferguson, A.M.; Irwin, M.J.; Ibata, R.A.; Lewis, G.F.; Tanvir, N.R. Evidence for stellar substructure in the halo and outer disk of M31. Astron. J. 2002, 124, 1452. [Google Scholar] [CrossRef]
- McConnachie, A.W.; Chapman, S.C.; Ibata, R.A.; Ferguson, A.M.N.; Irwin, M.J.; Lewis, G.F.; Tanvir, N.R.; Martin, N. The stellar halo and outer disk of M33. Astrophys. J. Lett. 2006, 647, L25. [Google Scholar] [CrossRef]
- Martinez-Delgado, D.; Pohlen, M.; Gabany, R.J.; Majewski, S.R.; Penarrubia, J.; Palma, C. Discovery of a giant stellar tidal stream around the disk galaxy NGC 4013. Astrophys. J. 2009, 692, 955. [Google Scholar] [CrossRef]
- Ahmed, Z.; Akerib, D.; Armengaud, E.; Arrenberg, S.; Augier, C.; Bailey, C.N.; Balakishiyeva, D.; Baudis, L.; Bauer, D.A.; Benoit, A.; et al. Combined limits on WIMPs from the CDMS and EDELWEISS experiments. Phys. Rev. D 2011, 84, 011102. [Google Scholar] [CrossRef]
- Ghorbani, K.; Ghorbani, H. Scalar split WIMPs in future direct detection experiments. Phys. Rev. D 2016, 93, 055012. [Google Scholar] [CrossRef]
- Bidin, C.M.; Carraro, G.; Méndez, R.; Smith, R. Kinematical and chemical vertical structure of the galactic thick disk., I.I. A lack of dark matter in the solar neighborhood. Astrophys. J. 2012, 751, 30. [Google Scholar] [CrossRef]
- Eker, Z.; Soydugan, F.; Soydugan, E.; Bilir, S.; Gökçe, E.Y.; Steer, I.; Tüysüz, M.; Şenyüz, T.; Demircan, O. Main-sequence effective temperatures from a revised mass–luminosity relation based on accurate properties. Astron. J. 2015, 149, 131. [Google Scholar] [CrossRef]
- Malkov, O.Y. Mass–luminosity relation of intermediate-mass stars. Mon. Not. R. Astron. Soc. 2007, 382, 1073–1086. [Google Scholar] [CrossRef]
- Mann, A.W.; Feiden, G.A.; Gaidos, E.; Boyajian, T.; von Braun, K. How to constrain your M dwarf: Measuring effective temperature, bolometric luminosity, mass, and radius. Astrophys. J. 2015, 804, 64. [Google Scholar] [CrossRef]
- Vitrichenko, E.; Nadyozhin, D.; Razinkova, T. Mass-luminosity relation for massive stars. Astron. Lett. 2007, 33, 251–258. [Google Scholar] [CrossRef]
- Nelson, L.A.; Rappaport, S.A.; Joss, P.C. The evolution of very low mass stars. Astrophys. J. 1986, 311, 226–240. [Google Scholar] [CrossRef]
- Cassisi, S.; Potekhin, A.Y.; Pietrinferni, A.; Catelan, M.; Salaris, M. Updated electron-conduction opacities: The impact on low-mass stellar models. Astrophys. J. 2007, 661, 1094. [Google Scholar] [CrossRef]
| 1 | Unless explicitly specified otherwise, we use the term “density” to refer to “surface mass density”, for brevity. |
| 2 | |
| 3 | Halo mass within a cylinder of radius r should not be confused with mass within a sphere of radius r [33]. |
| 4 | See Appendix B for details on stellar MLR coefficients. |
| 5 | This procedure shall not be used to find exact populations which must additionally obey observed metallicity and other physical properties, and where Σ(r) must exclude non-stellar matter. |
| 6 | This fact alone is a strong argument against dark matter. Galactic rotation is shaped by ordinary baryons. |
| 7 | For 15 out 82 galaxies, average excess density is above 20 M⊙/pc2, requiring additional data checks. |
| 8 | Excluding the centers of galaxies where super-massive objects and other factors complicate dynamics and the outskirts where stellar radiation signal-to-noise ratio is too low for modern equipment. |
| 9 | 89% of all density/brightness datapoints in our sample are in compliance with main-sequence stellar MLR. |
| 10 | We acknowledge the existence of disk stability argument but do not find it convincing. We believe that conclusions about disk stability based on physics of fluids/gases or dynamical N-body simulations will remain tentative until computational power permits dynamical galaxy simulations of true scale and complexity. Modelling limitations shall not be used to shift responsibility for disk stability to hypothetical dark matter halos. |
| 11 | The thin disk approximation is justified given that scales in the disk plane are much greater than along z-axis, and vertical density distribution is typically narrow. Bulges and stellar halos can be accounted for by a higher surface mass density. We compared a thin disk- and a cylinder dynamical mass models of M31, both with rmax = 300 kpc and with non-parametrically computed radial distribution of density on the basis of the same rotation curve. Having assumed the cylinder height of 4 kpc and exponential density distribution along z-axis (with 400 pc scaleheight) for the cylinder model, we get <1% enclosed mass difference between the disk and cylinder beyond r = 109 kpc. |
| 12 | For clarity, in matrix algebra terms y = v ⊗ v, an outer product of two instances of column vector, each containing rotational velocity values from the RC. |
| 13 | Even if V0 = 0, it is possible to include central mass m0 in the model either by excluding mN or by resizing the linear system to N + 1 assuming VN + 1 = VN. |
| 14 | |
| 15 | |
| 16 | |
| 17 | |
| 18 | |
| 19 | |
| 20 | |
| 21 | For NGC3521 there is good agreement on velocities, but major differences in distances from 7.7 Mpc (SPARC) to 12 Mpc (NED), and inclinations from 62° (S4G) to 75° (Sofue, SPARC). |


| Category | Estimates | M⊙/pc2 |
|---|---|---|
| Gas (HI) | <10 M⊙/pc2 at R25 [51] | ~6.0 |
| Gas (H2) | <1 M⊙/pc2 at R25 [51] | ~0.6 |
| Gas (He) | He mass fraction Yp = 0.233 [52] | ~2.0 |
| Dust | Dust-to-gas ratio ~2 × 10⁻⁵ [53] | ~0.001 |
| Brown Dwarfs (BD) | 1011 in Milky Way; >0.03 M⊙ BD mass [54] | ~0.7 |
| White Dwarfs (WD) | 232 WDs within 25 pc around Sun [55,56,57]; 0.6 M⊙ WD mass | ~0.9 |
| Neutron Stars (NS) | 108–109 in Milky Way [58]; 1.4 M⊙ NS mass | ~0.3 |
| Black Holes (BH) | 108 in Milky Way; 10 M⊙ BH mass [59] | ~0.2 |
| Total | ~10.7 | |
© 2020 by the authors. Licensee MDPI, Basel, Switzerland. This article is an open access article distributed under the terms and conditions of the Creative Commons Attribution (CC BY) license (http://creativecommons.org/licenses/by/4.0/).
Share and Cite
Sipols, A.; Pavlovich, A. Dark Matter Dogma: A Study of 214 Galaxies. Galaxies 2020, 8, 36. https://doi.org/10.3390/galaxies8020036
Sipols A, Pavlovich A. Dark Matter Dogma: A Study of 214 Galaxies. Galaxies. 2020; 8(2):36. https://doi.org/10.3390/galaxies8020036
Chicago/Turabian StyleSipols, Alan, and Alex Pavlovich. 2020. "Dark Matter Dogma: A Study of 214 Galaxies" Galaxies 8, no. 2: 36. https://doi.org/10.3390/galaxies8020036
APA StyleSipols, A., & Pavlovich, A. (2020). Dark Matter Dogma: A Study of 214 Galaxies. Galaxies, 8(2), 36. https://doi.org/10.3390/galaxies8020036