Article

ASASSN-13db 2014–2017 Eruption as an Intermediate Luminosity Optical Transient

Department of Physics, Ariel University, P.O. Box 3, Ariel 4070000, Israel
*
Author to whom correspondence should be addressed.
Galaxies 2020, 8(1), 2; https://doi.org/10.3390/galaxies8010002
Submission received: 4 September 2019 / Revised: 11 December 2019 / Accepted: 12 December 2019 / Published: 19 December 2019

Abstract

:
The low mass star ASASSN-13db experienced an EXor outburst in 2013, which identified it as a Young Stellar Object (YSO). Then, from 2014 to 2017 it had another outburst, longer and more luminous than the earlier. We analyze the observations of the second outburst, and compare it to eruptions of Intermediate Luminosity Optical Transients (ILOTs). We show that the decline of the light curve is almost identical to that of the V838 Mon, a prototype of a type of ILOT known as Luminous Red Nova (LRN). This similarity becomes conspicuous when oscillations that are associated with rotation are filtered out from the light curve of ASASSN-13db. We suggest that the eruption was the result of accretion of a proto-planet of a few Earth masses. The proto-planet was shredded by tidal forces before it was accreted onto the YSO, releasing gravitational energy that powered the outburst for 800 days , and ended in a 55 days decline phase. When the accretion material started depleting the accretion rate lowered and the eruption light curve declined for almost two months. Then it exhausted completely, creating a sharp break in the light curve. Another possibility is that the mass was a result of an instability in the proto-planetary disk that lead to a large episode of accretion from an inner viscous disk. We find that the variation of the temperature of the outburst is consistent with the surface temperature expected from a depleted viscous accretion disk. The 2014–2017 outburst of ASASSN-13db may be the least energetic ILOT to have been discovered to date, with an energy budget of only 10 42 erg .

1. Introduction

Intermediate luminosity optical transients (ILOTs) are exotic outbursts with luminosities which fall between those of novae and supernovae (SN). Many new ILOTs are being discovered by modern surveys and dedicated campaigns (e.g., [1,2,3,4,5,6,7,8,9,10,11,12,13,14,15,16,17,18,19,20,21,22,23,24,25,26,27,28,29,30,31,32]. The group consists of many different astronomical eruptions which are diverse, but are found to have shared properties [33,34,35]. Kashi and collaborators [33] noticed similarities in the light curves of a few ILOTs, that were not considered to be similar. The shape of the light curve may start with a few peaks (frequently two peaks) followed by a downward concave curve. At first sight, the time-scale for decline, and the absolute magnitude of the curve may look different. Their similarity becomes evident when they are re-scaled, shifting the peak luminosities to coincide just before the decline in the light curve, and multiplying the light curves by a scaling factor. In [33] it was proposed that this similarity could indicate that a common physical mechanism is involved, that has a fingerprint in the form of this similar decline.
The Energy-Time Diagram (ETD; [33,35,36]) is used for classifying transients in terms of their characteristic time of decline and their total energy (The ETD webpage: phsites.technion.ac.il/soker/ilot-club/.). In the ETD many of the transients form a slated stripe more energetic, for a given time scale, than novae yet less energetic than SNe. We refer to this stripe as the Optical Transient Stripe. In [33] it was suggested that most objects that populate the stripe share a similar powering mechanism, that they suggest to be accretion energy. The different time scale are related to the accretion rate or the mass supply rate, that in some cases can be limited by the time it takes to dissipate the angular momentum of the accreted mass through viscosity.
One well studied transient is the 2002 outburst of V838 Mon [2]. It is considered a prototype of a sub-type of ILOTs, known as Luminous Red Novae (LRN). Both classical nova and He-shell flash were suggested as explanations for the unusual eruption, but later ruled out [37]. The star involved in the V838 Mon eruption was a massive star, possibly even on the main-sequence (MS). Perhaps the most unusual observation was that as time passed V838 Mon became redder [38,39], which is exactly opposite to the evolution of classical novae.
A model for the eruption of V838 Mon that involves a stellar merger event followed by an accretion process, in which the surviving star accreted the material of its destructed companion, was proposed by [40]. The model was named the merger-burst model. This model was able to account for all observations and its only drawback was that its parameters were not strictly constrained (see also [37,41]). The binary merger scenario in V838 Mon was strengthened by the eruption of the LRN V1309 Sco [13] where a clear signal of an eclipsing binary was observed prior to the eruption [42].
Recently, [16] also considered both single star and binary models for a collection of LRNe, and favored a binary merger model with common envelope ejection. They made a distinction for objects fainter than M V = 10 , which they termed Red Novae, and brighter than this value (typically at M V = 12 15 ), which they termed Luminous Red Novae. They suggested that different stellar progenitors are responsible for each of the two, but agreed that LRNe are “scaled-up” Red Novae. As we are interested in the physical mechanism we will not use this subdivision.
Interestingly, [43] suggested that merger of a planet with a Brown Dwarf or low mass star can lead to an eruption of shorter time scale and slightly less energetic, that would be on the lower left side of the optical transient stripe. It later was discovered that some eruptions can have shared properties with ILOTs even if they are external to the optical transient stripe [44,45]. In [44] it was suggested that the unusual outburst of the Young Stellar Object (YSO) ASASSN-15qi [46] is an ILOT event, similar in many respects to LRN events such as V838 Mon, but much fainter and of lower total energy. In other words, ASASSN-15qi is an unusual ILOT in the sense that it has low power and therefore resides below the OTS. The physical model for ASASSN-15qi suggests that in a similar manner to LRNe, a secondary object was tidally destroyed onto the primary YSO, releasing gravitational energy in the process [44]. They suggested that the secondary object was a Saturn-like planet instead of a low mass pre-MS companion in the LRN model. This process created an accretion disk and manifested as a gravitationally powered ILOT. Differently from V838 Mon which is much more energetic, the mass of the destructed planet is too low to cause the YSO to have an inflated envelope, and hence the merger remnant stays hot, and therefore does not redden as the LRNe.
In addition to ASASSN-15qi, [35] further suggested that another transient, ASASSN-13db [47], may also be a related object. The variable low-mass star ASASSN-13db was identified by the All Sky Automated Survey for SuperNovae (ASAS-SN; e.g., Jayasinghe et al. [32]), after brightening in the visual by 4 mag in September 2013 (Holoien et al. [48], Prieto et al. [49], Shappee et al. [50]). The outburst occurred in an M5 young star surrounded with a proto-planetary disk. FU Ori outbursts (e.g., [51,52] and references therein) occur in pre-MS stars, and are observed as an extreme change in magnitude with a slow decline that may last for years. The spectral type also changes during the outburst. FU Ori outbursts can be regarded as more energetic counterparts of the EXor class of outburst, of which EX Lupis is a prototype [53]. These are pre-MS variables that show flares of a few months to a few years, and of several magnitudes amplitude, as a result of episodic mass accretion [52,54]. The various intensities and various timescales are not only found observationally, but are also expected from theory [55,56,57]. ASASSN-13db was classified as an EXor but with remarkable luminosity, comparable to EX Lupi 2008 outburst [58], so that it may be a link between FUors and EXors [59].
The 2013 outburst was not the last word heard from ASASSN-13db [47]. Later, in 2014, ASASSN-13db had another outburst of a different nature (not an FU Ori outburst), in which the peak magnitude in the V-band was brighter by about 1 mag than the outburst in 2013. The entire 2014–2017 transient lasted about 800 days. It stayed bright at a high plateau for about 500 days, experiencing fluctuations of δ V 1 mag. Later it started gradually declining for another 250 days , which ended in 2017 with a fast decline by approximately 2.5 magnitudes over two months (see Figure 1 of Sicilia Aguilar et al. [47]).
In this paper we examine the possibility that the 2014–2017 outburst of ASASSN-13db (hereafter A13db1417) was an ILOT similar to a LRN. In Section 2 we discuss its properties in more detail, and compare it to a LRN. In Section 3 we propose a model for this outburst. Our summary and discussion appear in Section 4.

2. Observational Comparison

According to [48] ASASSN-13db is an M5 star with mass M 1 0.15 M , luminosity L 1 0.06 L and radius R 1 1.1 R . These values were measured during the short quiescence phase after the 2013 outburst. The distance of ASASSN-13db is estimated to be 380 pc [47]. We will adopt these properties in our analysis.
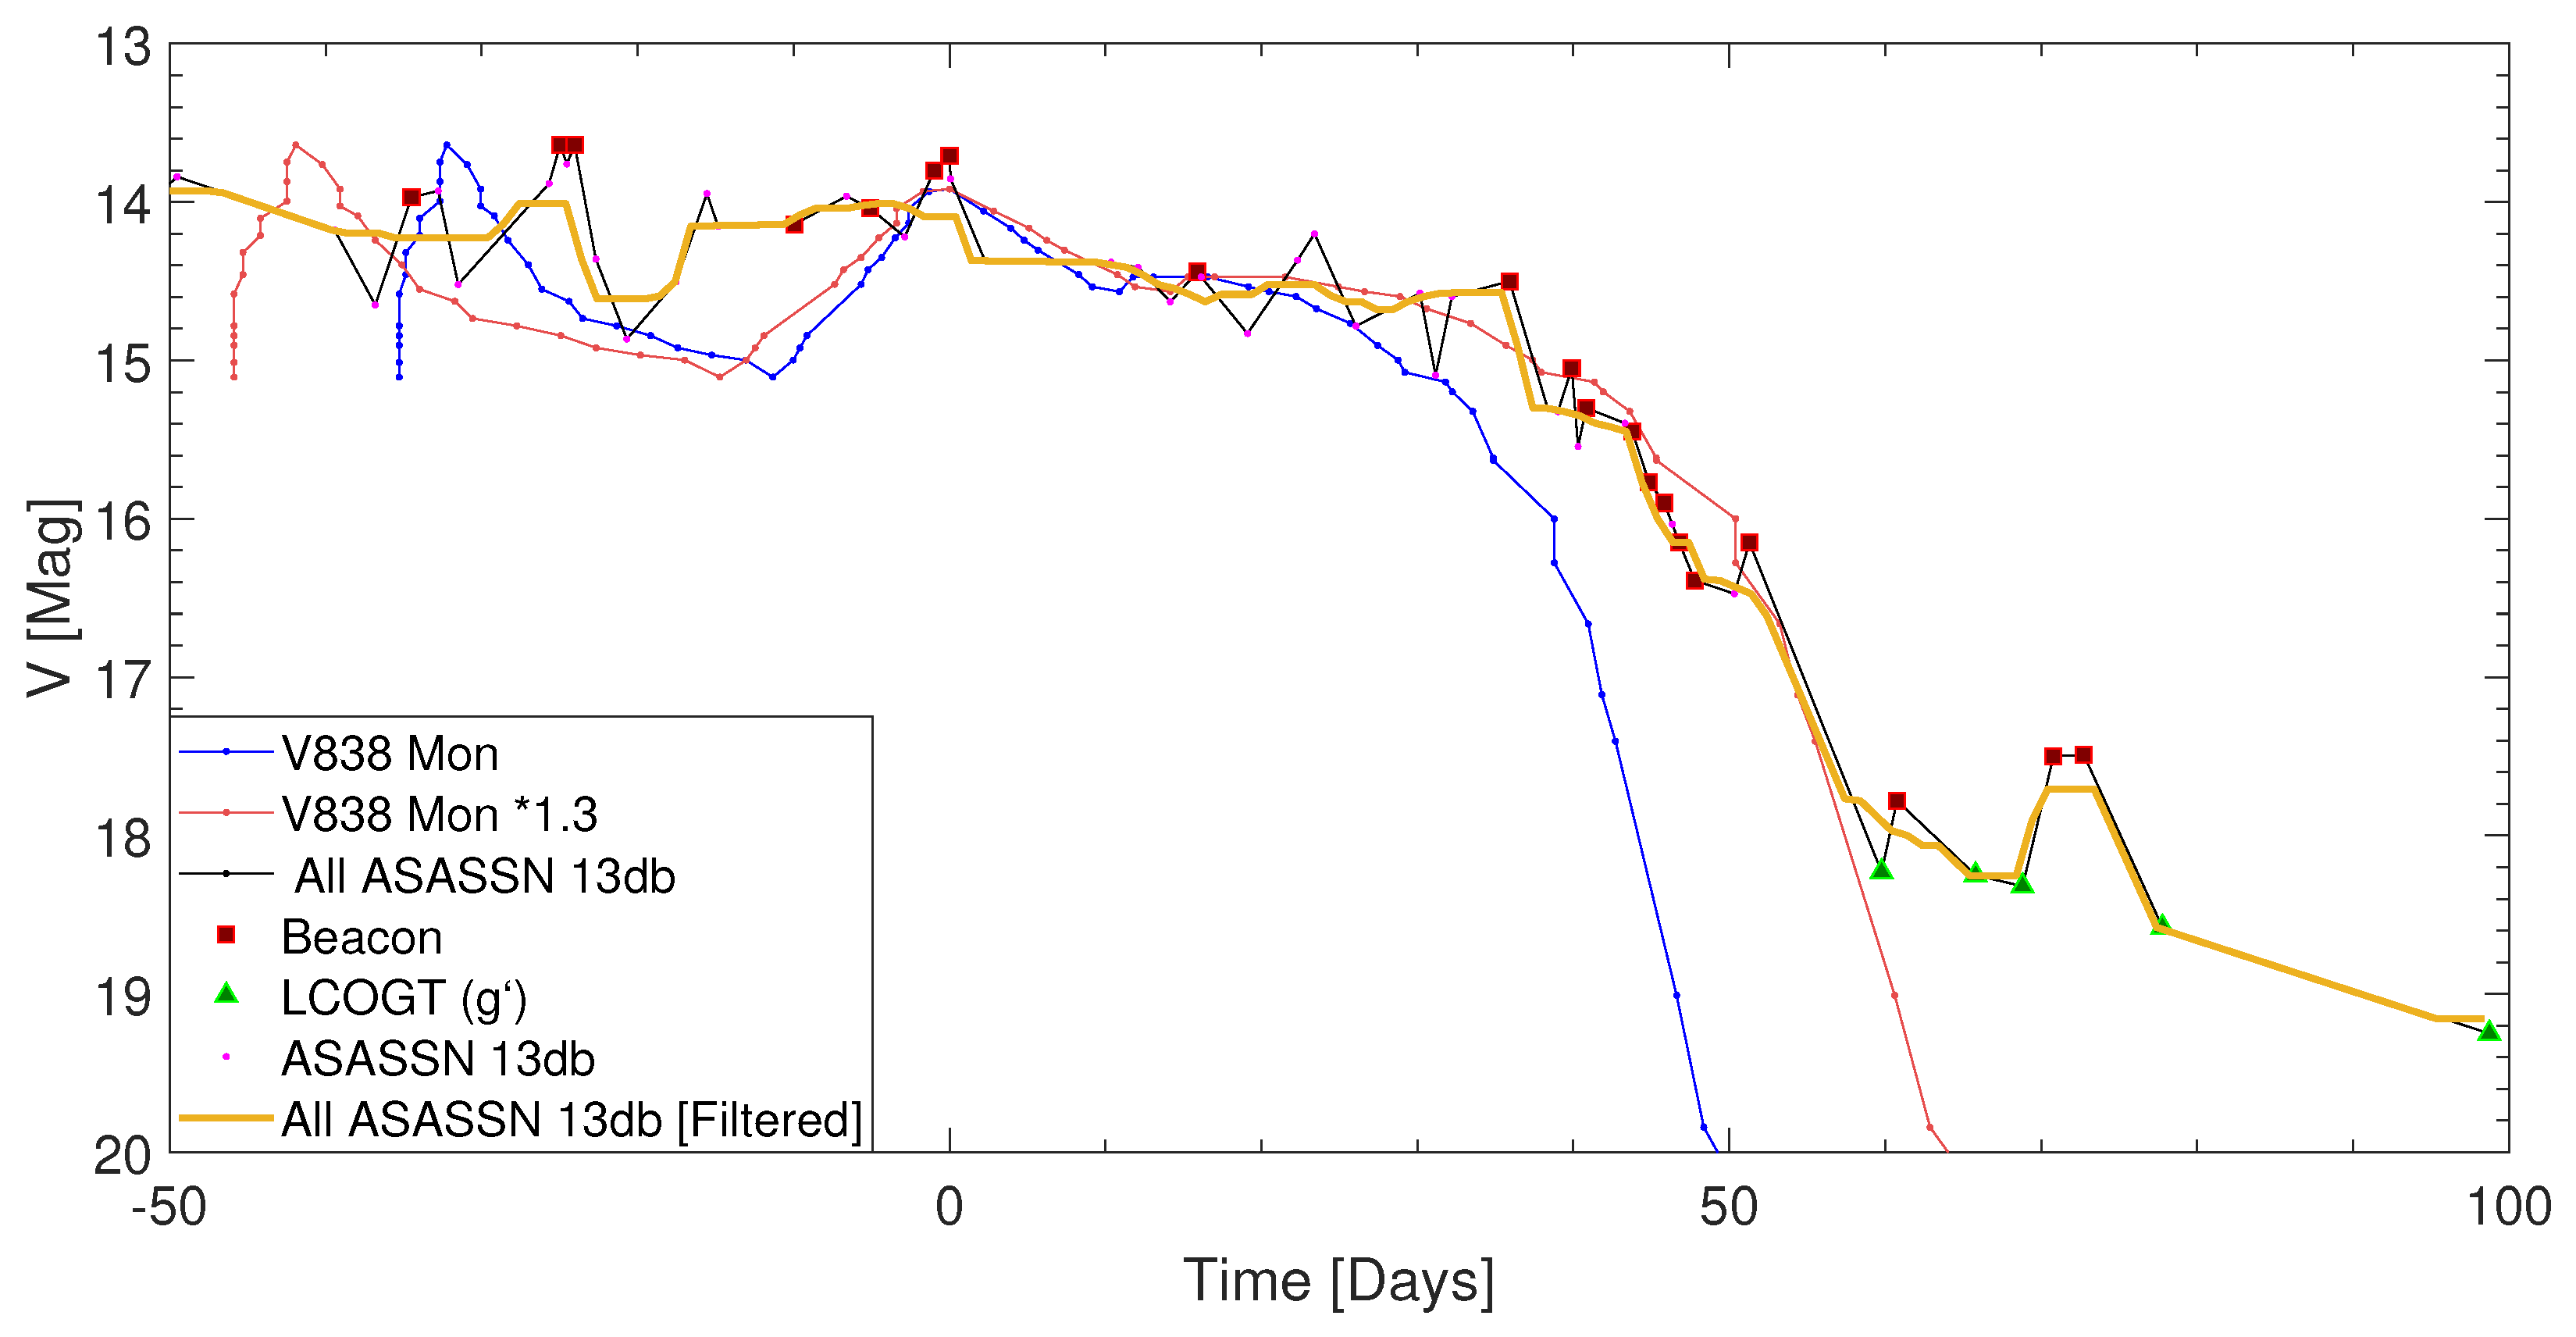
We focus on the decline phase of A13db1417. First, we gathered the light curves from the three observatories from where the data was provided separately in [47]: ASASSN V-band, Beacon V-band, and LCOGT g -band, into one combined light curve. This will appear later in Figure 1 as “All ASASSN 13db”. As evident in the observations of [47], the decline phase starts at V 14 and continues up to the V 18 , in a generally concave shape. Then, 51 59 days after the peak (there is a gap in the observations that makes it hard to tell), the light curve breaks to a shallow, bumpy decline.
In the study of SNe, it is a common practice to stretch the light curves in order to match them (e.g., [60,61]). This practice is essentially what made possible to derive the Parker law for SNe Ia, that allows using them as standard candles for determining cosmological distances. A reassembling process was recently suggested for classical novae [62]. This process was used for identifying candidate ILOTs and comparing between eruptions [33], and developing models for possible new ILOTs (e.g., [43]).
To apply this procedure we shifted down the much more luminous light curve of the 2002 outburst of V838 Mon [2,39,63] by 6.9 mag, to have its peak at the same brightness as that of A13db1417. We then superimposed the light curve of the outburst of V838 Mon on A13db1417.
Figure 1 shows in the upper panel the result of only a simple shift, for which the second peak before the decline (one before last) was matched for both transients. The two transients show a similar decline for about 3 magnitudes. The light curves of the two transients separate only after this shared decline, as A13db1417 at this point has a bump in the light curve (JD ≃ 2,457,779, which is 50 days after the last peak before decline). On the lower panel, we matched the peak just before the decline starts. We find that when the time axis of the light curve of V838 Mon is scaled by a factor of 1.3 the two light curves behave similarly for a decline of Δ V 4 mag.
A period of ∼4.2 days superimposed in the light curve of A13db1417 was found by [47]. Their explanation for that periodicity, which can even be seen by visually examining the data, was stellar rotation and the presence of spots. We wish to filter out this effect from the data, as we believe that this effect contaminates a light curve that is governed by accretion. We note that we filter out the variation regardless of its source, may it be spots, binary interaction or a different source.
The A13db1417 signal includes high rate temporal sampling, sometimes a few times per night and on other times one measurement per a few days. We analyze the unequally spaced signal power spectrum using the generalized Lomb-Scargle periodogram (GLSP; [64]), and obtain a wealth of high frequencies in the power spectrum. We use the following method to transfer A13db1417 unevenly spaced data to a per night regular sampled signal. We first focus on the data points that were sampled more than once at a night and decimate the signal using simple average result with a per night data point. Then we use spline interpolation on the signal to estimate the missing data points. This results in a regular sampled signal per night. We compare the GLSP analysis with our new regular signal using Welch method [65] as well as the GLSP (setting the relevant parameters to evenly spaced sampling) power spectrum making sure we did not lose information (mainly more than 4 days periods). As a final step we apply the median filter (again after checking with the power spectrum and making sure we do not lose information) to emphasize the signal trend behavior over the fast temporal fluctuation.
Figure 2 shows the results of this process. The obtained light curve is much more refined and less bumpy than the original. Therefore, much more resembling the smooth decline light curve of V838 Mon. We can see that as expected the two light curves match much better.
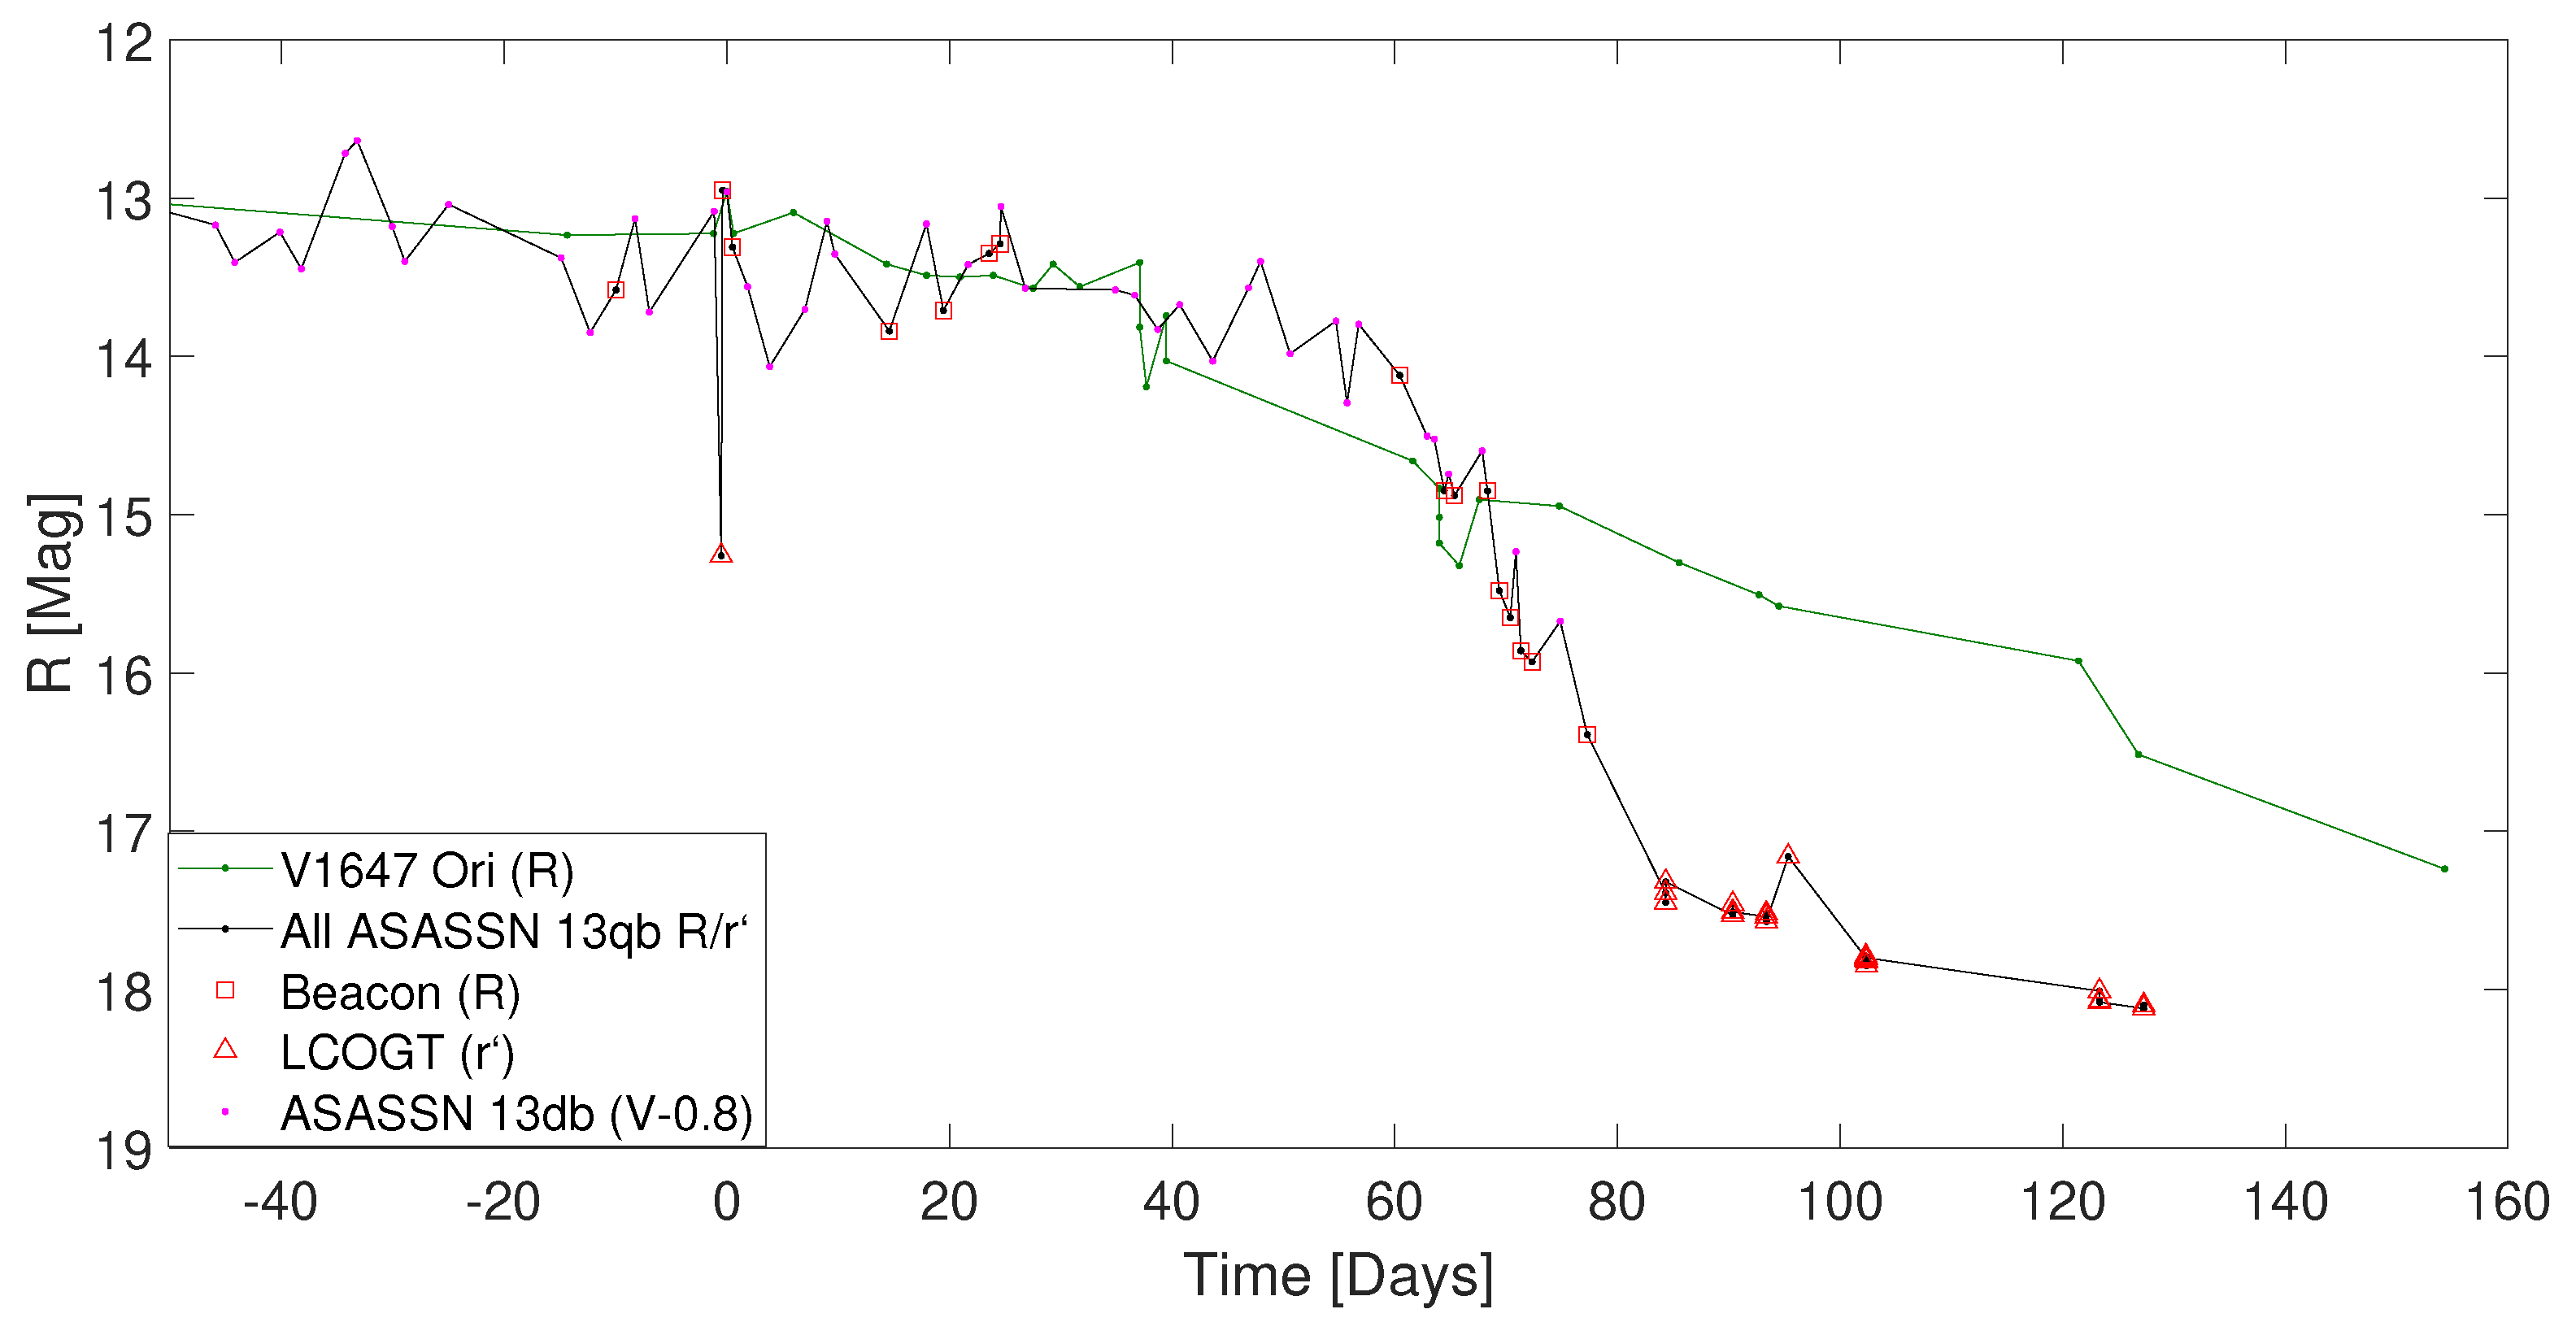
According to [47], the light curve of A13db1417 has an overall shape that strongly resembles in length, duration, and general shape (including the quick magnitude drop after a slow fading) the light curve of the FU Ori variable V1647 Ori that erupted in 2004 ([66] and references therein). The authors of [47] did not, however, present any comparison of these two light curves. Reference [66] do not bring V-band observations of V1647 Ori, but rather R c -band covering well the outburst and its decline. In Figure 3 we compare the R-band/ r -band light curve of A13db1417 with the R c -band of V1647 Ori. As there are no ASASSN R-band observations, but the observations from Beacon and LCOGT show thar R V and r g are almost constant, we adopt a constant shift of V R = 0.8 for the ASASSN observations, and use its V-band observations to obtain the R-band. We evaluate the error in this method is ± 0.1 mag. Figure 3 shows that, though we try to make the two light curves match, the two objects have quite different decline slopes, with that of V1647 Ori being much steeper. The comparison to V838 Mon is by far superior. We consider it to be another hint that A13db1417 is not an FU Ori eruption.
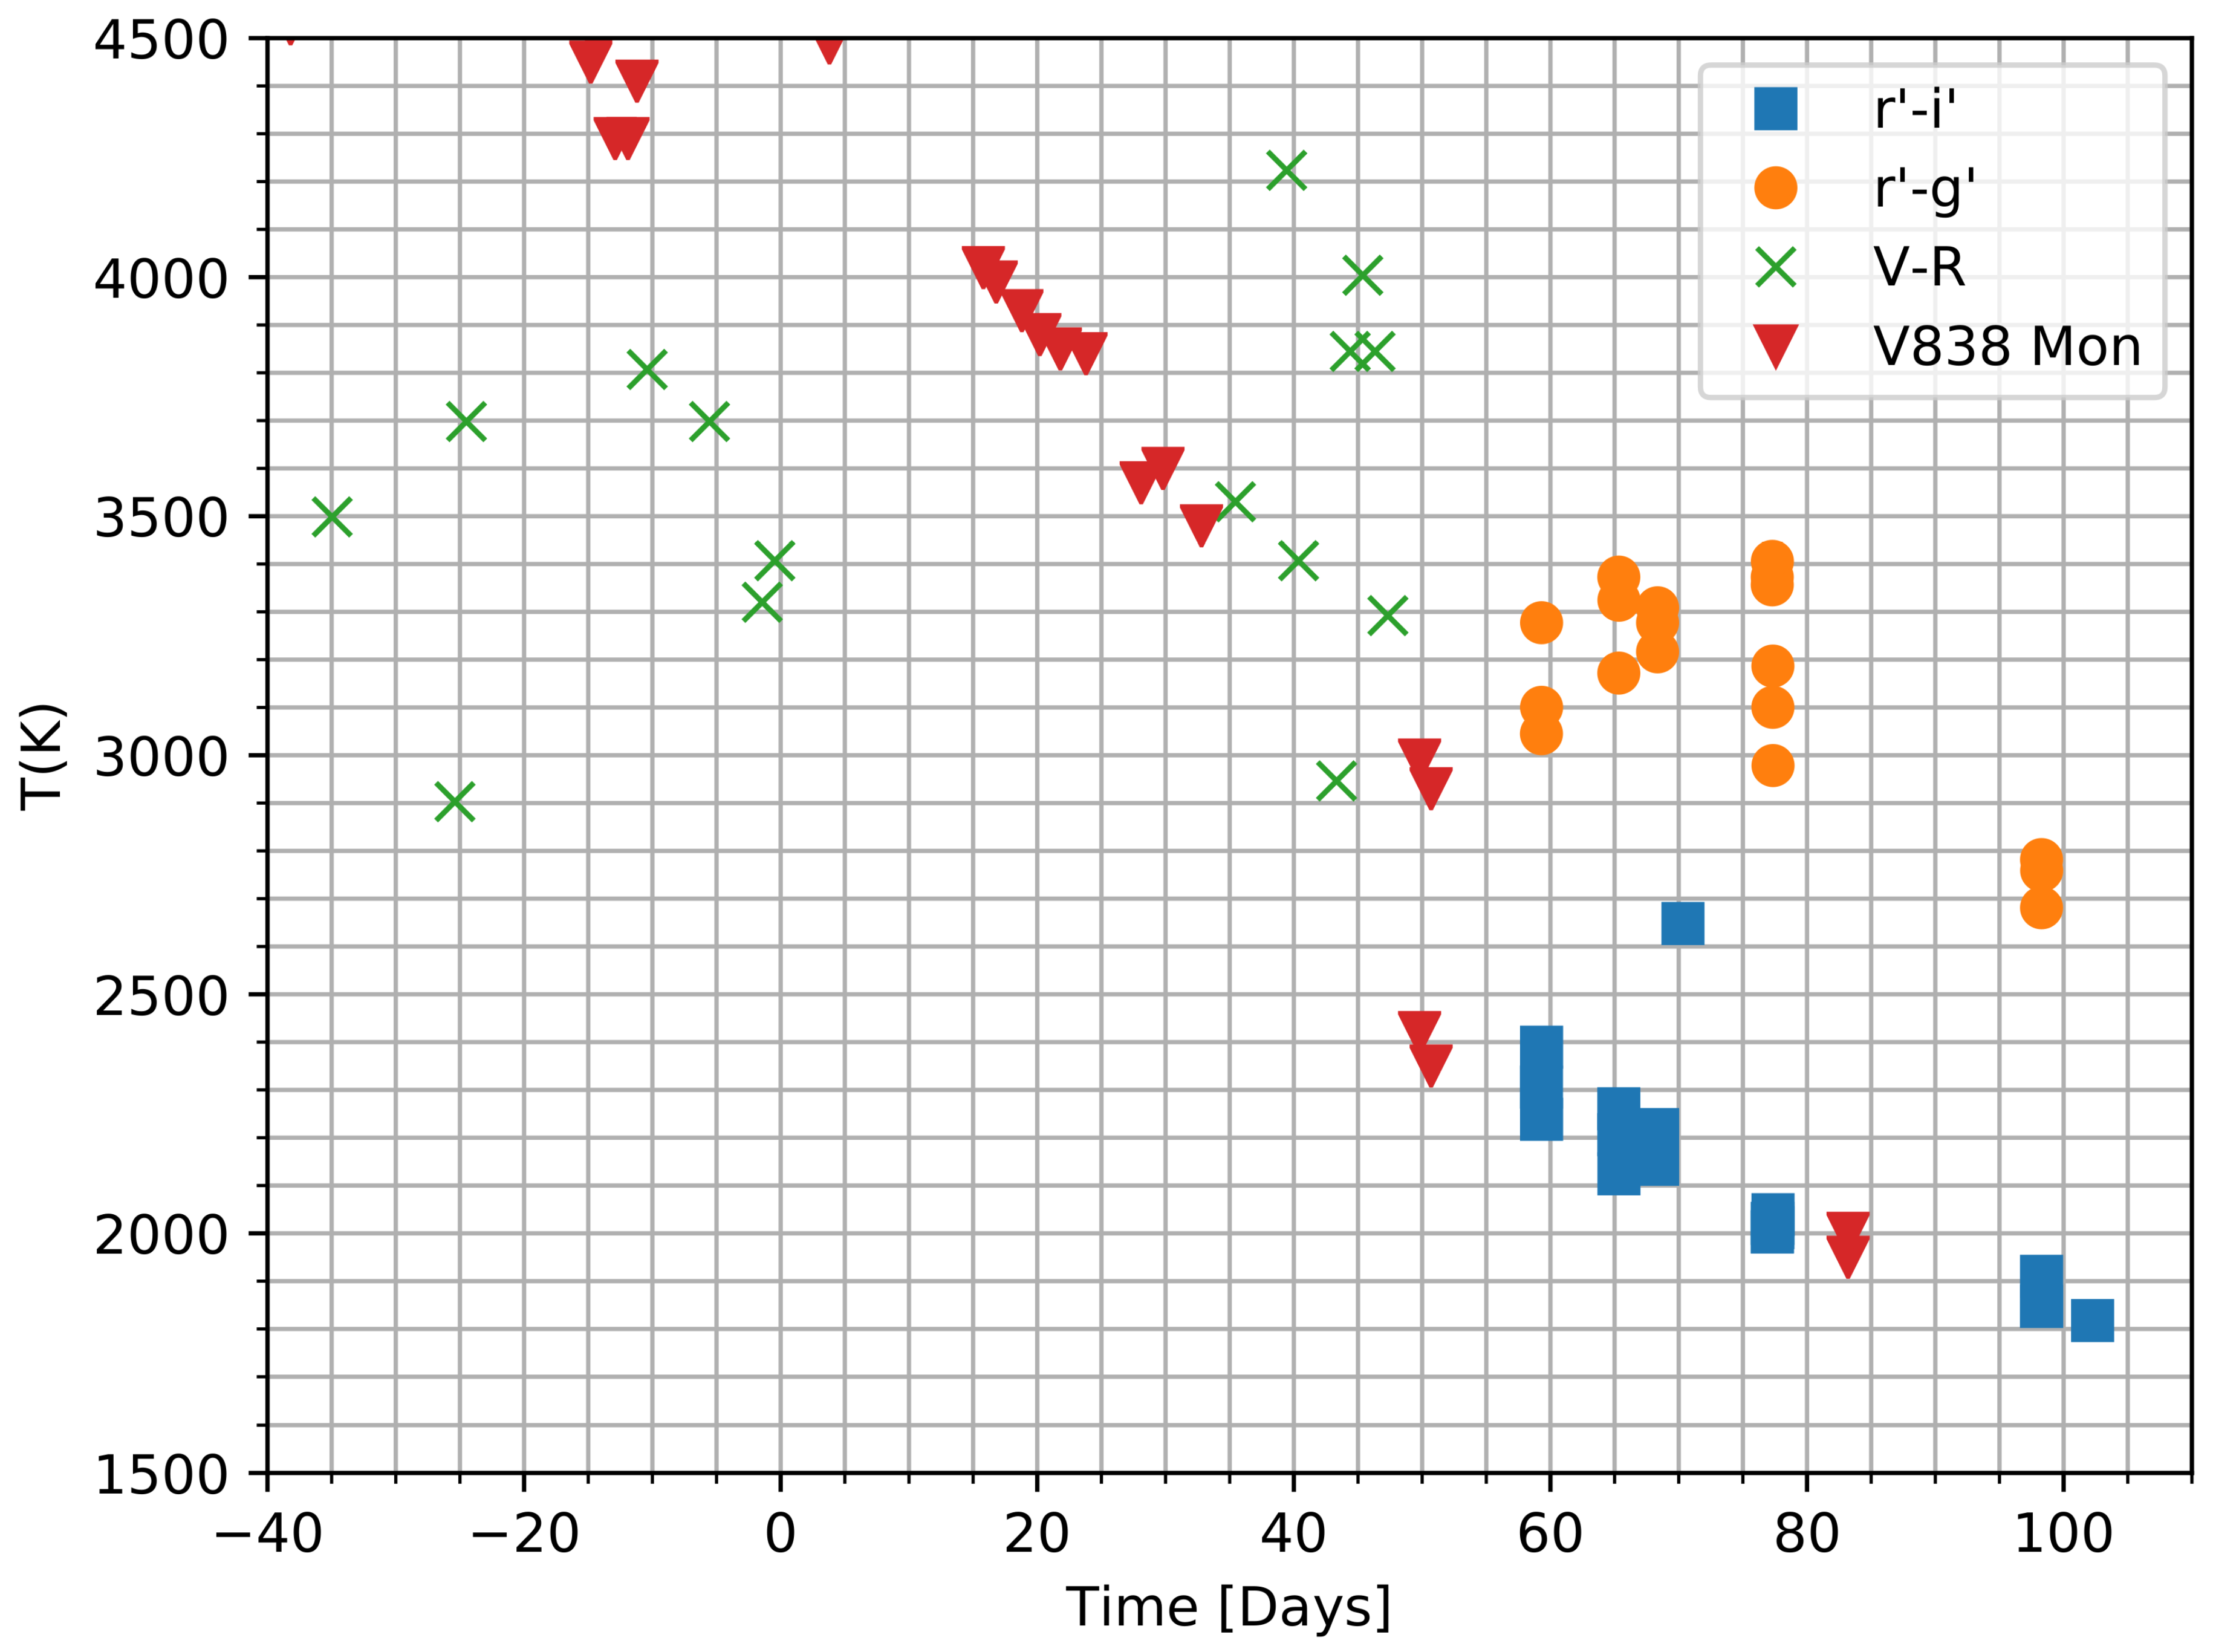
We calculate the temperature from the available observations, but the observations are quite noisy, and when calculating color the noise does not cancel. The results during the decline show that the effective temperature slowly declines with time during the 55 days of disk dissipation (Figure 4). The observations are insufficient for performing detailed comparison. However, we can compare them to the evolution of the effective temperature of V838 Mon (see Figure 2 in [67]). We can see that both objects had their effective temperature declining from 4500 K to 2000 K during the eruption, a similarity that adds to the similarity in the light curve we showed above.

3. An ILOT Model

In Section 2 we showed that the characteristic decline of the light curve of A13db1417 was similar to that of V838 Mon. We adopt the model of [40] that suggests that a merger event lead to the outburst of V838 Mon. In [40] it was estimated that the eruption of V838 Mon involved ejecting mass with kinetic energy of E kin 10 44 erg , which is about an order of magnitude larger than the emitted radiated energy of the eruption. As mentioned earlier in Section 1, in [44] the properties of the YSO eruption ASASSN-15qi were compared to those of V838 Mon. The merger-like scenario that they suggested involved a secondary object that was tidally destroyed onto the primary 2.4 M YSO, releasing gravitational energy in the process. They estimated that the ejected mass could have a similar value for the kinetic energy, E kin 10 44 erg .
We now turn to examine a model in which A13db1417 was a result of a destruction of a proto-planet onto the YSO. The innermost proto-planetary disk gas can be drained during the previous EXor outburst, creating a “disk gap” (e.g., [68,69]). But then in 2014 the planet arrives and shredded into fragments that from a temporary disk, that exists until its depletion in 2017. Such a destruction would be the result of instabilities in the proto-planetary disk that may contain a number of large bodies that interact with each other and with the material in the proto-planetary disk. If such an object comes into the tidal destruction radius of the YSO, it would be shredded and form an accretion disk. The material would fall onto the star, releasing gravitational energy. The process would continue until the available material is depleted, after which the light curve would decline. It is also possible, as we discuss below, that the instability in the disk causes accretion of material in the form of gas rather than a destructed planet. It is only required that the arriving material would posses enough angular momentum to form a close accretion disk around the proto-star.
Modeling the observations of A13db1417, [47] suggested accretion rates 3 × 10 7 M yr 1 . It is not mentioned, however, whether this estimate includes the kinetic energy (Namely, it was not mentioned whether the supply of the accreted gas can account only for radiation or for all the energy). The radiated energy during the 800 days of A13db1417 is E rad 2 × 10 41 erg . The wings of the H α line observed in A13db1417 reach 300 km s 1 [47], indicating the gas reach that velocity. We will calibrate the calculations of the energy with v ej = 300 km s 1 . The kinetic energy involved in the eruption of A13db1417 can therefore be calibrated as
E kin 9 × 10 41 M ej 10 6 M v ej 300 km s 1 2 erg ,
where M ej is the ejected mass. A lower velocity would result smaller energy, but as most of the mass probably travels in the range of 100 km s 1 , the energy should still be in the range of few × 10 41 erg . As the accreted mass is small, we do not expect the envelope to inflate, a process that may consume more energy, which is not observed. Namely the total energy involved in the A13db1417 eruption is E tot 10 42 erg . The gravitational energy that can be supplied through accretion of a total amount of mass M acc from a destructed object can be calibrated with the parameters of the YSO as
E grav 2.6 × 10 42 M 1 0.15 M M acc 10 5 M × R 1 1.1 R 1 erg .
Namely, the accreted object has the mass of a planet, possibly a proto-super-earth planet with mass of few × 10 6 10 5 M . The average accretion rate we obtain over the t acc 800 days of the eruption is
M ˙ acc 4 × 10 6 M p 3 M t acc 800 days 1 M yr 1 .
This value (for the accretion rate during the outburst) is about 3000 times larger than the quiescence accretion rate from the proto-planetary disk, obtained from spectroscopic lines [47]. It might be that the mass is supplied not from a proto-planet but rather directly from the proto-planetary disk, that due to an instability increases the accretion rate for the duration of the eruption. In this case an inner denser disk may from (or a thicker disk-like structure) that contains the mass that was transferred from the protoplantary disk to the star, while it is being consumed by the proto-star.
The radii of proto-planets depend on their age, the size of the core, the accretion rate onto the core (if they are created by accretion of planetesimals), the planet pressure profile, and the efficiency of cooling with the presence (or obscuration) of stellar irradiation and tidal heating (e.g., Baruteau et al. [70], Fortney et al. [71], Guillot [72] and references therein). According to these studies, at a young age the radius can be twice or more the final radius. Fortney et al. [71] emphasize that planets that form closer to their star have a larger radius, especially at young ages. Therefore the expected density of a proto-super-earth is
ρ p 1.06 M p 3 M R p 2.5 R 1 g cm 3 ,
where M p and R p are the planet mass and radius, respectively.
We would like to clarify that when we use the name super-earth we do not necessarily mean that the planet is of a rocky nature. We only use this term to make a connection to the mass of the planet we discuss. It may well be a that this planet is gaseous, and the exact composition does not make a significant difference to the applicability of our model. Indeed, a peculiar composition will reflect in the observed spectra, but we expect the accreting object to have formed from the very same cloud that formed the YSO, so their composition should be similar.
The Roche limit for tidal destruction of such a proto-planet is
r d 2.44 ρ 1 ρ p 1 / 3 R 1 1.43 ρ 1 0.16 g cm 3 1 / 3 ρ p 1.06 g cm 3 1 / 3 × R 1 1.1 R R
where ρ 1 is the density of the YSO, calculated based on the parameters derived by [47]. The proto-planet is likely to have approached to the YSO in a grazing angle, due to an instability in the proto-planetary disk. As Roche limit is larger than the YSO radius, the proto-planet would be destructed as it comes closer to the YSO by its gravitational field even though its average density is larger.
Close to the end of the 800 days of accretion, once the mass supply from the shredded proto-planet material is terminated, there is an accretion disk (could be a thick disk) left that will exhaust itself on a viscosity timescale.
t visc R 1 2 ν 55 α 0.1 1 H / R a 0.1 1 C s / v ϕ 0.1 1 × R 1 1.1 R 3 / 2 M 1 0.15 M 1 / 2 days ,
where H is the thickness of the disk, C s is the sound speed, α is the disk viscosity parameter, ν = α C s H is the viscosity of the disk, and v ϕ is the Keplerian velocity. We get that t visc matches the time of the break in the light curve, discussed above. This may indicate that for 2 months the light curve is governed (other than the contamination from the rotating spot) by the depletion of the accretion disk that the proto-planet created. Then comes the break in the light curve and a shallower decline in brightness.
In the above calculation we used a constant accretion radius of 1.1 R . Spectral analysis of A13db1417, that found many lines to have inverse P Cygni or YY Ori type profiles, lead [47] to conclude that: (1) The YSO and its proto-planetary disk are viewed almost edge-on. (2) The effective temperature during the eruption is lower than at quiescence.
We estimate the Keplerian time at the destruction radius to be t k 0.5 ( r d / 1.4 R ) 3 / 2 days . The ratio of viscous to Keplerian timescale is t visc / t K 110 . Therefore as the accreted material from the planet is destructed onto the YSO, it might create a thick accretion disk.
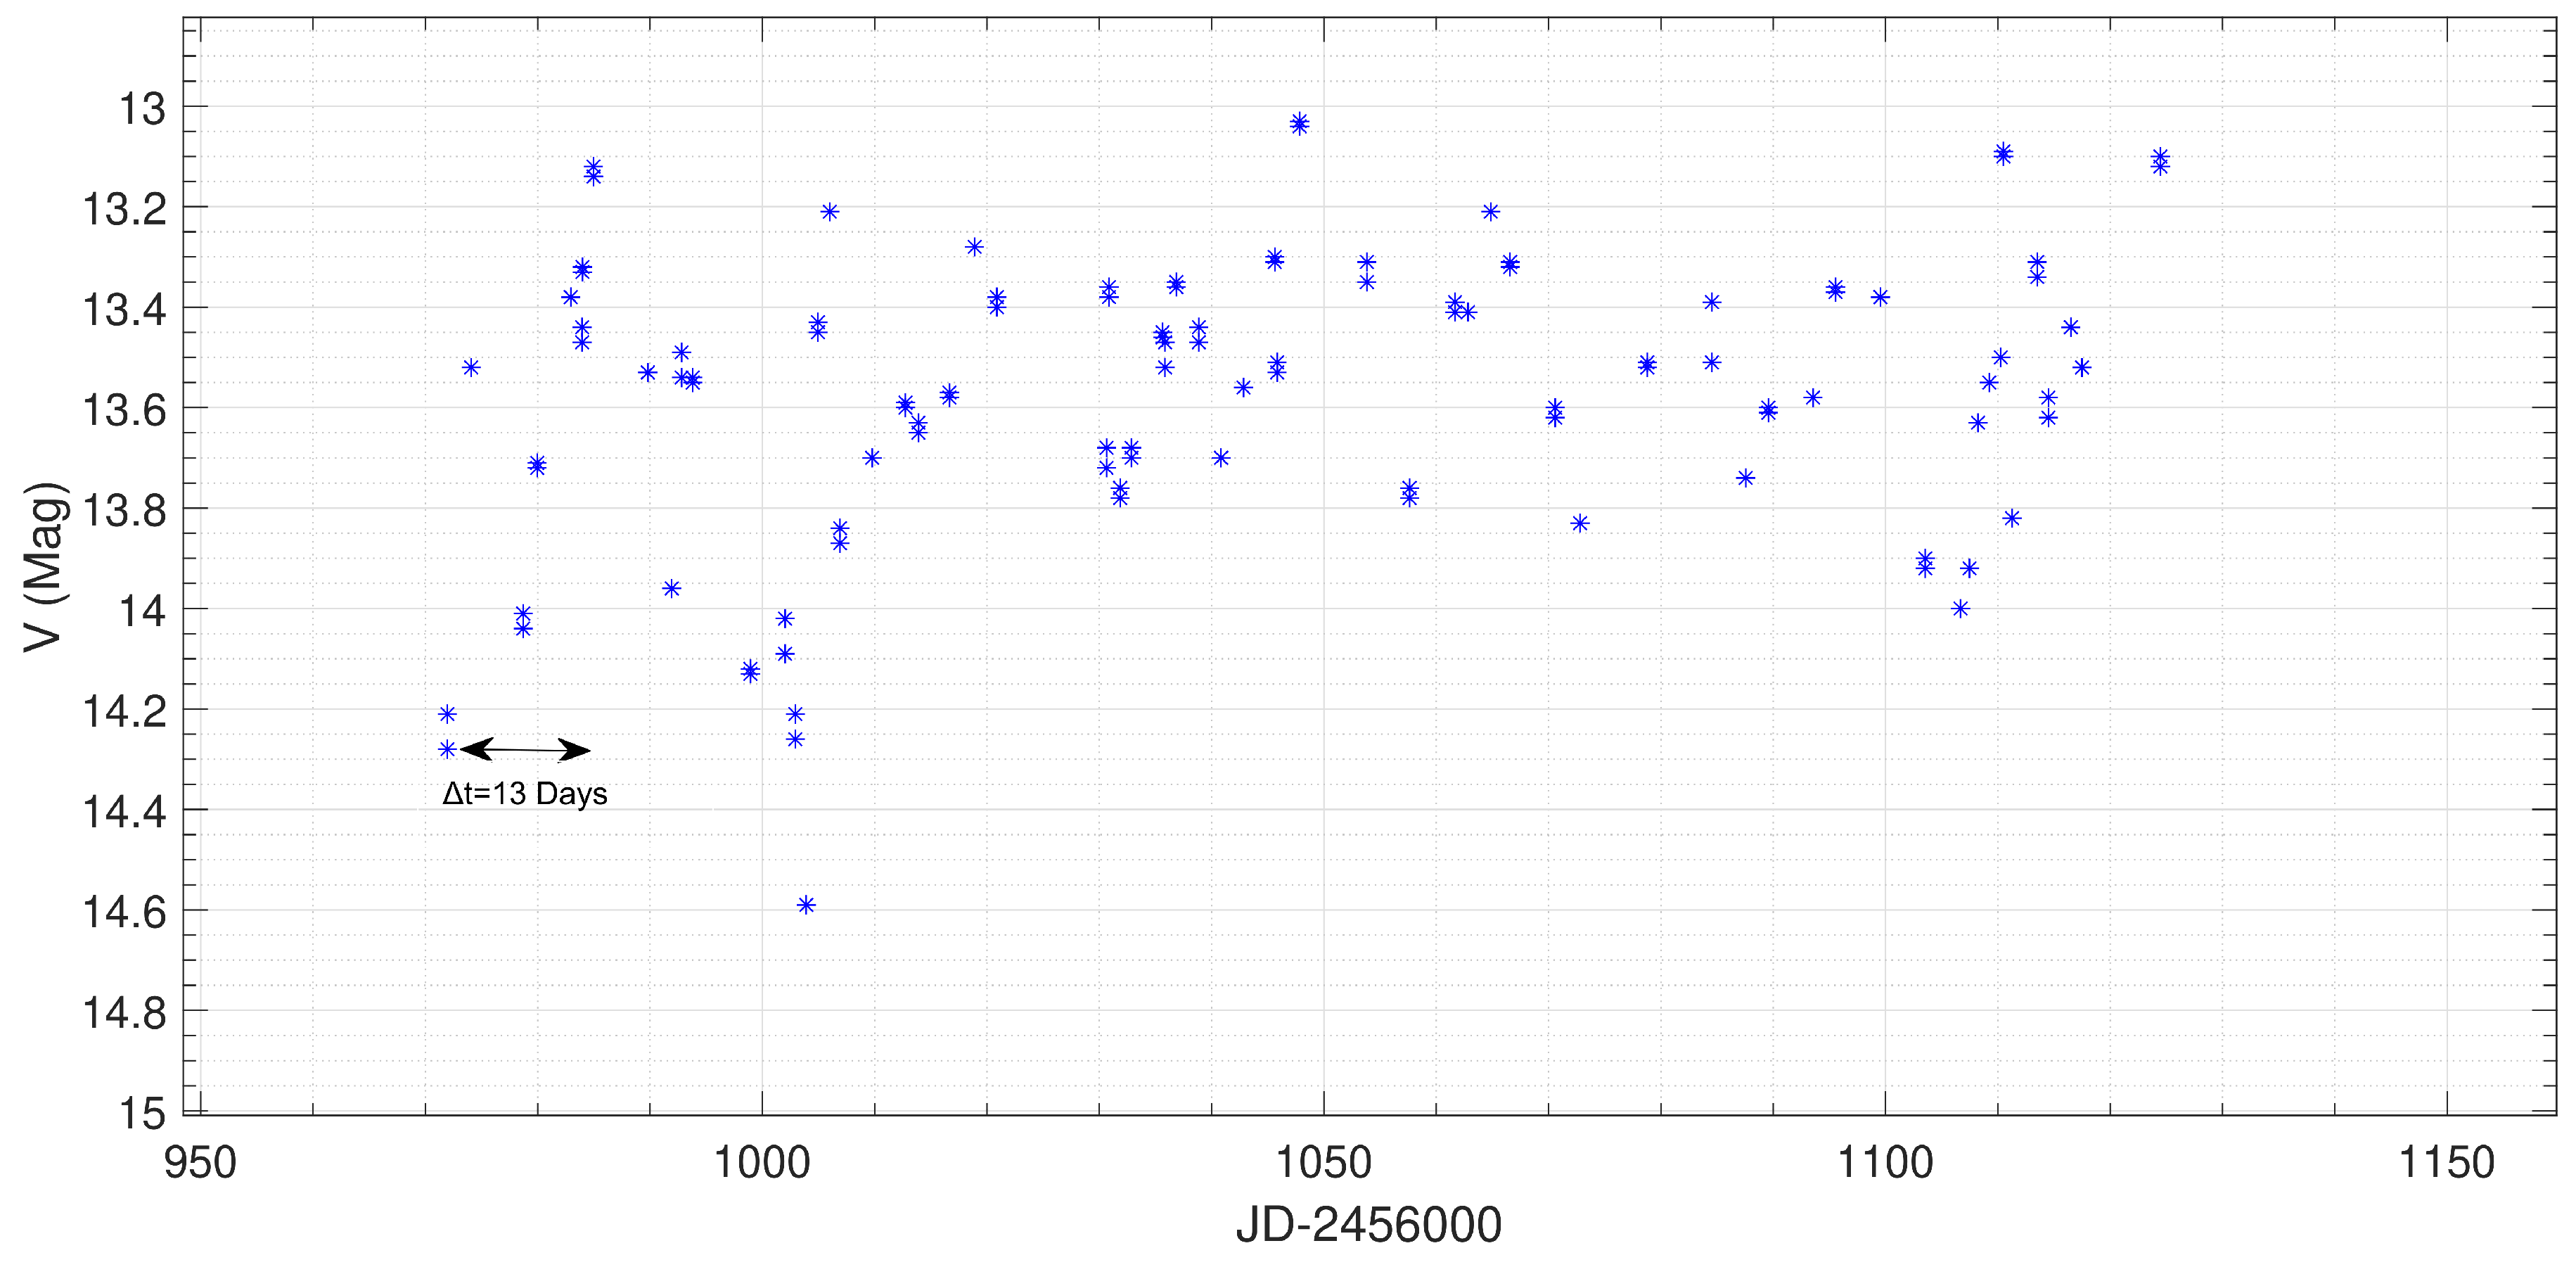
Let us discuss the beginning of A13db1417. At the beginning of the 800 days outburst, a planet is destructed. The fall-back time for mass to start being accreted is about 6 days for the parameters we adopted/derived. Very quickly, in a matter of a few dynamical times (namely a few days) most of the destructed material which falls with a non-zero angular momentum, will form an accretion disk. Therefore we expect, and indeed there is, a steep increase in the luminosity. Figure 5 focuses on the beginning on the outburst, showing its fast increase in brightness. As a characteristic observational constraint to the increase in the luminosity at the beginning of A13db1417, we take the time from the first detection to the first local peak, which about 13 days . This time scale can give a rough estimate to the transition time from the fal-lback accretion, for which the destruction time scale is the relevant timescale, and the viscous accretion. We emphasize that the source of the luminosity during the remainder of the 800 days is not from the destruction itself, but rather from continuous accretion of the mass of the planet onto the star. It is therefore possible to very crudely constrain the fall-back time scale to 13 days , which is in agreement with the fall-back time and the onset of the viscous accretion disk.
While the disk exists it may reduce the number of ionizing photons escaping from the YSO close to the equator, and also lower the effective temperature. If the YSO, is observed from, or close to, an edge-on line of sight, this will be evident in the spectra. Therefore we suggest that the ILOT model can also account for the variation in the observed line intensities.
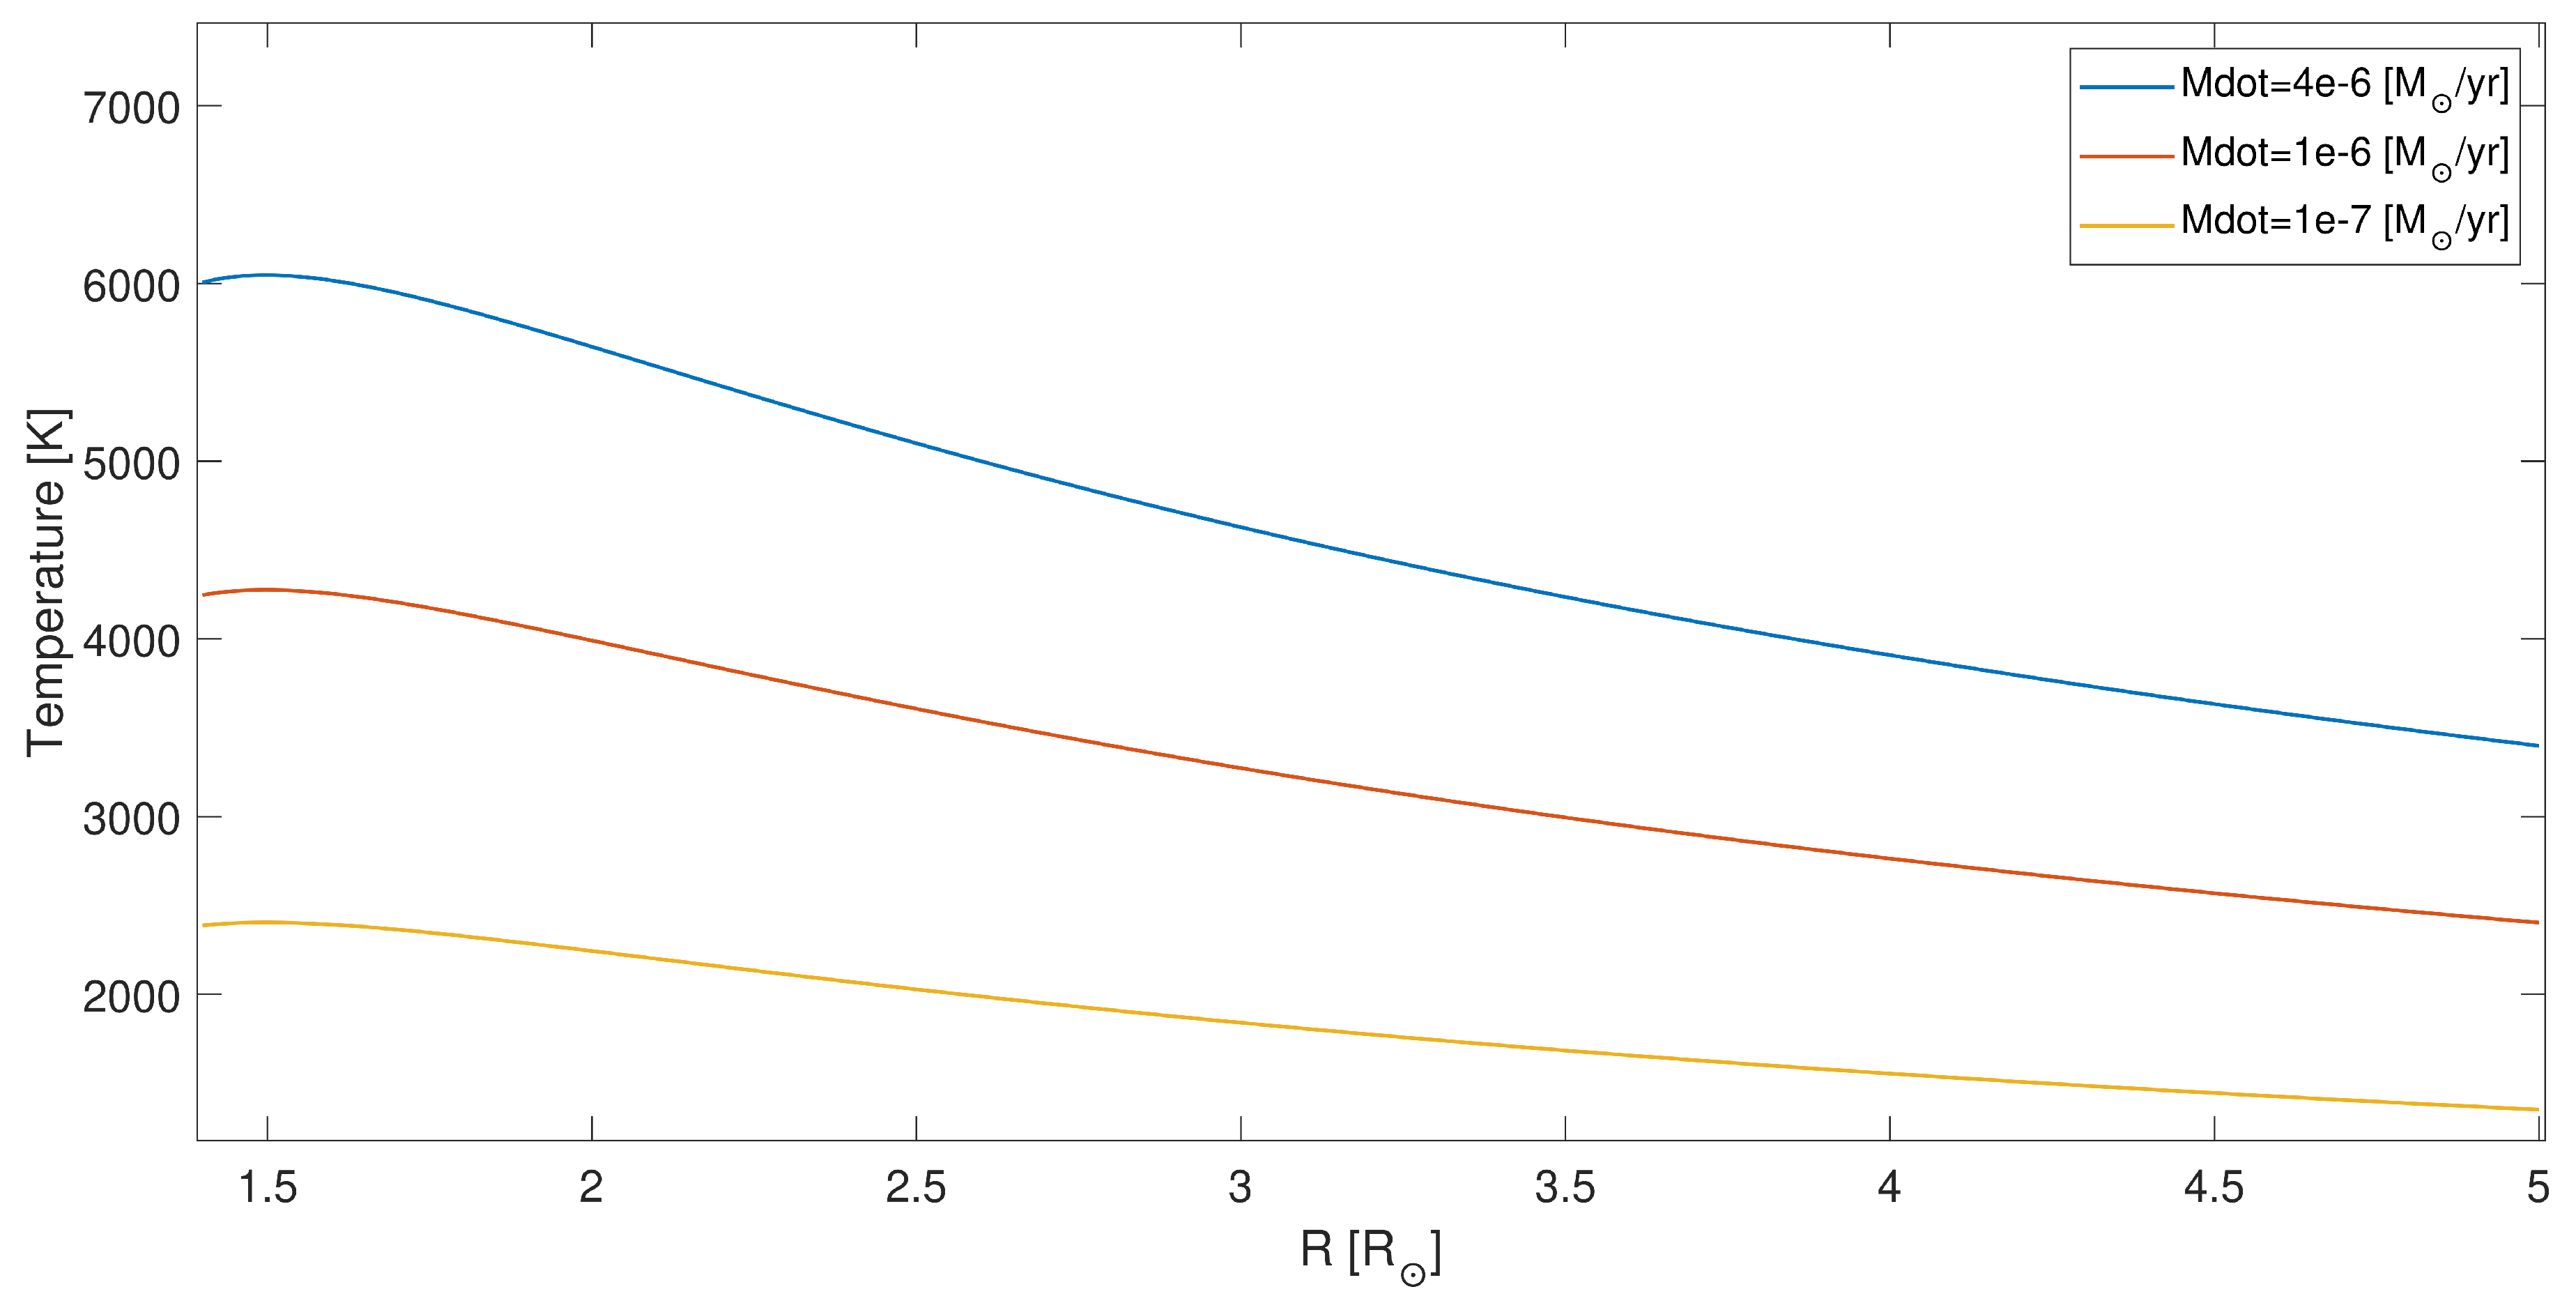
Analyzing the data, we find that the effective temperature of A13db1417 declined from ≃ 4500 K to ≃ 2000 K during the last stage of the eruption. The trend and the values are similar to the effective temperature from of V838 Mon [67]. According to our model, the emission of A13db1417 comes from a viscous disk. Modeling the emission in our specific case would require an extensive numerical study, that might be too excessive given the rough estimate of the parameters. But for a crude estimate, we calculate the temperature for a classical accretion disk model
T ( R ) = 3 G M 1 M ˙ acc 8 π R 3 σ 1 R 1 R 1 / 2 1 / 4
where R is the disk radius and σ is the Stefan-Boltzmann constant. Figure 4 shows the surface temperature for the disk according to Equation (7). As the disk depletes during the 55 days , the mass accretion rate drops. Consequently, the temperature drops as T M ˙ acc 1 / 4 . The outer part of the disk, that has the largest surface area and thus dominant in the spectrum, has a surface temperature in the range of 3500 4500 K . During the decline in the emission of the outburst drops by Δ V 4 mag in 55 days (see Figure 1), corresponding to a drop in the brightness by a factor of 40 . Therefore, according to the model, M ˙ needs to drop by that factor as well. As the accretion rate drops by that factor of 40 the temperature drops by a factor of 2.5 . We note that Equation (7) describes a steady state and does not accurately account for the thermal changes during the dynamic phase of the depletion. Given the crude estimate, it turns out that the disk surface temperature is consistent with the observations that show a surface temperature drop to 2000 K at the end of the outburst (Figure 6).

4. Summary and Discussion

We discussed the eruptions of the YSO ASASSN-13db, which erupted twice: a short eruption in 2013, and a longer one from 2014 to 2017. The 2013 event is a typical YSO outburst, but the 2014–2017 event (A13db1417) is clearly different. The object may be intermediate between FUor and EXor outbursts. It has been proposed that there is a continuous spectrum of variables between EXors and FUors [59], based on the outburst ranges, so that some bursts may be more FUor-like and some others more EXor like.
We found a strong resemblance in the decline light curves of A13db1417 and V838 Mon, a prototype LRN ILOT. The two outburst have similar decline in their light curves, which we suggest may not be a coincidence. Namely, we follow [33] who suggested that mass accretion that releases energy in a specific rate can account for a special shape of light curve, that will be similar for different objects when rescaled. There is also a similar decline in the effective temperature of the two transients. The evolution of the temperature also matches the expected decline of the surface temperature of a classical accretion disk, as a result from a decrease in the accretion rate. Therefore we examine the possibility that A13db1417 is an accretion-powered event, as was suggested for V838 Mon. We found that the time from the peak of the light curve of A13db1417, to the break were it begins a much shallower decline is the same as the viscosity time on which the shredded proto-planet is accreted, and therefore the supply of mass for gravitational energy to power the event is consumed.
Most stars are expected to form planets at some point, and during this process the orbits are in many cases unstable, what may lead to a collision course between the proto-planet and the proto-star. We examined the possibility that A13db1417 was caused by accretion of a proto-planet onto the proto-star, in what is termed an Intermediate Luminosity Optical Transient (ILOT).
It is possible that the A13db1417 eruption is accretion not from a destructed planet but rather of gas from the proto-planetary disk. The amount of accreted mass in this case would be the same as calculated in Section 3, from the energy considerations. In that case there should be an instability in the proto-planetary disk, that would increase the normal mass accretion rate to a few × 10 6 M yr 1 (see Equation (3)). If ASASSN-13db will have more eruptions with the same declining slope it will be in favor of the instability in the proto-planetary disk scenario, as it is less likely that a number of planets will interact with the YSO in the same manner. The proto-planetary disk, on the other hand, does not have such a constraint, and multiple instabilities that may lead to eruptions are possible.
In Section 3 we estimated that the total energy involved in the A13db1417 eruption is 10 42 erg . If the outburst is indeed an ILOT, A13db1417 is the least energetic one observed to date. The Eddington ratio for A13db1417 is Γ Edd 10 4 , which is very small compared to objects in the OTS, that can reach even Γ Edd 10 . It is therefore located at the bottom of the Energy Time Diagram (ETD), as a very weak eruption in terms of energy (as low as the energy of novae and below), and an intermediate duration in the scale of months.
ASASSN-13db is an important contribution to the ILOT family, as it expands the region on the ETD where ILOTs can reside. We see that an ILOT can be not “intermediate”, in the sense that its luminosity does not necessarily be in the gap between novae and SNe. The word ILOT does not classify an object in terms of its brightness, but rather designates an object with a specific physical process, accretion and release of gravitational energy.
The light curve of V838 Mon itself, which was used here as a reference is not yet completely understood. It was suggested to be the result of the merger-burst process, and was qualitatively obtained from analytic considerations, but further investigation is required. An different interpretation of the light curve of the prototype LRN, V838 Mon, as a sequence of three planet collision with the a red giant was proposed by [73] and [74]. Setting aside the fact that the progenitor of V838 Mon was not a red giant, the scenario they proposed could not account for the energy of the outburst, and it is nearly impossible that three planets would fall one after another onto their parent star on a timescale of months [37]. Our scenario is different than the scenario proposed by [73] as the planet does not have to arrive in a direct collision course, and it does not collide with the star but rather shredded before it arrives.
The model we consider here for the 2014–2017 eruption of ASASSN-13db (A13db1417), even though it involves a planet, has none of the issues listed above. It is a single event, that happened unrelated to the 2013 eruption of ASASSN-13db. Also, the model is designed specifically for the energy budget of A13db1417.
A13db1417 is another example of the process that manifest itself with the characteristic ILOT lightcurve. We postulate that this process is the depletion of an accretion disk. To show that, 3D numerical simulations are required, together with radiation-transfer analysis. This remains to be studied in a future work.

Author Contributions

All authors have read and agreed to the published version of the manuscript.

Funding

This research received no external funding.

Acknowledgments

We acknowledge support from the R&D authority, and the Chairman of the Department of Physics in Ariel University.

Conflicts of Interest

The authors declare no conflict of interest.

References

  1. Mould, J.; Cohen, J.; Graham, J.R.; Hamilton, D.; Matthews, K.; Picard, A.; Reid, N.; Schmidt, M.; Soifer, T.; Wilson, C.; et al. A Nova-like Red Variable in M31. Astrophys. J. Lett. 1990, 353, L35. [Google Scholar] [CrossRef]
  2. Bond, H.E.; Henden, A.; Levay, Z.G.; Panagia, N.; Sparks, W.B.; Starrfield, S.; Wagner, R.M.; Corradi, R.L.M.; Munari, U. An energetic stellar outburst accompanied by circumstellar light echoes. Nature 2003, 422, 405. [Google Scholar] [CrossRef] [PubMed]
  3. Rau, A.; Kulkarni, S.R.; Ofek, E.O.; Yan, L. Spitzer Observations of the New Luminous Red Nova M85 OT2006-1. Astrophys. J. 2007, 659, 1536. [Google Scholar] [CrossRef] [Green Version]
  4. Rau, A.; Kulkarni, S.R.; Law, N.M.; Bloom, J.S.; Ciardi, D.; Djorgovski, G.S.; Fox, D.B.; Gal-Yam, A.; Grillmair, C.C.; Kasliwal, M.M.; et al. Exploring the Optical Transient Sky with the Palomar Transient Factory. Publ. Astron. Soc. Pac. 2009, 121, 1334. [Google Scholar] [CrossRef] [Green Version]
  5. Ofek, E.O.; Kulkarni, S.R.; Rau, A.; Cenko, S.B.; Peng, E.W.; Blakeslee, J.P.; Côté, P.; Ferrarese, L.; Jordán, A.; Mei, S.; et al. The Environment of M85 Optical Transient 2006-1: Constraints on the Progenitor Age and Mass. Astrophys. J. 2008, 674, 447. [Google Scholar] [CrossRef] [Green Version]
  6. Ofek, E.O.; Cenko, S.B.; Shaviv, N.J.; Duggan, G.; Strotjohann, N.L.; Rubin, A.; Kulkarni, S.R.; Gal-Yam, A.; Sullivan, M.; Cao, Y.; et al. PTF13efv—An Outburst 500 Days Prior to the SNHunt 275 Explosion and Its Radiative Efficiency. Astrophys. J. 2016, 824, 6. [Google Scholar] [CrossRef] [Green Version]
  7. Prieto, J.L.; Sellgren, K.; Thompson, T.A.; Kochanek, C.S. A Spitzer/IRS Spectrum of the 2008 Luminous Transient in NGC 300: Connection to Proto-Planetary Nebulae. Astrophys. J. 2009, 705, 1425. [Google Scholar] [CrossRef]
  8. Botticella, M.T.; Pastorello, A.; Smartt, S.J.; Meikle, W.P.S.; Benetti, S.; Kotak, R.; Cappellaro, E.; Crockett, R.M.; Mattila, S.; Sereno, M.; et al. SN 2008S: an electron-capture SN from a super-AGB progenitor? Mon. Not. R. Astron. Soc. 2009, 398, 1041. [Google Scholar] [CrossRef] [Green Version]
  9. Smith, N.; Ganeshalingam, M.; Chornock, R.; Filippenko, A.V.; Li, W.; Silverman, J.M.; Steele, T.N.; Griffith, C.V.; Joubert, N.; Lee, N.Y.; et al. SN 2008S: A Cool Super-Eddington Wind in a Supernova Impostor. Astrophys. J. Lett. 2009, 697, L49. [Google Scholar] [CrossRef]
  10. Berger, E.; Foley, R.; Ivans, I. SN 2009ip is an LBV Outburst 2009a, The Astronomer’s Telegram, No. 2184. Available online: https://ui.adsabs.harvard.edu/abs/2009ATel.2184....1B/abstract (accessed on 2 September 2009).
  11. Berger, E.; Soderberg, A.M.; Chevalier, R.A.; Fransson, C.; Foley, R.J.; Leonard, D.C.; Debes, J.H.; Diamond-Stanic, A.M.; Dupree, A.K.; Ivans, I.I.; et al. An Intermediate Luminosity Transient in NGC 300: The Eruption of a Dust-Enshrouded Massive Star. Astrophys. J. 2009, 699, 1850. [Google Scholar] [CrossRef]
  12. Kulkarni, S.R.; Kasliwal, M.M. astro2010: The Astronomy and Astrophysics Decadal Survey; Science White Papers: Woodview, UK, 2010; p. 165. [Google Scholar]
  13. Mason, E.; Diaz, M.; Williams, R.E.; Preston, G.; Bensby, T. The peculiar nova V1309 Scorpii/nova Scorpii 2008. A candidate twin of V838 Monocerotis. Astron. Astrophys. 2010, 516, A108. [Google Scholar] [CrossRef]
  14. Pastorello, A.; Botticella, M.T.; Trundle, C.; Taubenberger, S.; Mattila, S.; Kankare, E.; Elias-Rosa, N.; Benetti, S.; Duszanowicz, G.; Hermansson, L.; et al. Multiple major outbursts from a restless luminous blue variable in NGC 3432. Mon. Not. R. Astron. Soc. 2010, 408, 181–198. [Google Scholar] [CrossRef] [Green Version]
  15. Pastorello, A.; Chen, T.W.; Cai, Y.Z.; Morales-Garoffolo, A.; Cano, Z.; Mason, E.; Barsukova, E.A.; Benetti, S.; Berton, M.; Bose, S.; et al. The evolution of luminous red nova AT 2017jfs in NGC 4470. Astron. Astrophys. 2019, 625, L8. [Google Scholar] [CrossRef]
  16. Pastorello, A.; Mason, E.; Taubenberger, S.; Fraser, M.; Cortini, G.; Tomasella, L.; Botticella, M.T.; Elias-Rosa, N.; Kotak, R.; Smartt, S.J.; et al. Luminous Red Novae: Stellar Mergers or Giant Eruptions? Astron. Astrophys. 2019, 630, 75. [Google Scholar] [CrossRef] [Green Version]
  17. Kasliwal, M.M.; Kulkarni, S.R.; Arcavi, I.; Quimby, R.M.; Ofek, E.O.; Nugent, P.; Jacobsen, J.; Gal-Yam, A.; Green, Y.; Yaron, O.; et al. PTF 10fqs: A Luminous Red Nova in the Spiral Galaxy Messier 99. Astrophys. J. 2011, 730, 134. [Google Scholar] [CrossRef]
  18. Kasliwal, M.M. IAUS 281: Binary Paths to the Explosions of type Ia Supernovae; Kluwer Academic Publishers: Dordrecht, The Netherlands, 2013; p. 9. [Google Scholar]
  19. Tylenda, R.; Kamiński, T.; Udalski, A.; Soszyński, I.; Poleski, R.; Szymański, M.K.; Kubiak, M.; Pietrzyński, G.; Kozłowski, S.; Pietrukowicz, P. OGLE-2002-BLG-360: from a gravitational microlensing candidate to an overlooked red transient. Astron. Astrophys. 2013, 555, A16. [Google Scholar] [CrossRef] [Green Version]
  20. Kurtenkov, A.A.; Pessev, P.; Tomov, T.; Barsukova, E.A.; Fabrika, S.; Vida, K.; Hornoch, K.; Ovcharov, E.P.; Goranskij, V.P.; Valeev, A.F.; et al. The January 2015 outburst of a red nova in M 31. Astron. Astrophys. 2015, 578, L10. [Google Scholar] [CrossRef] [Green Version]
  21. Smartt, S.J.; Valenti, S.; Fraser, M.; Inserra, C.; Young, D.R.; Sullivan, M.; Pastorello, A.; Benetti, S.; Gal-Yam, A.; Knapic, C.; et al. PESSTO: survey description and products from the first data release by the Public ESO Spectroscopic Survey of Transient Objects. Astron. Astrophys. 2015, 579, A40. [Google Scholar] [CrossRef]
  22. Williams, S.C.; Darnley, M.J.; Bode, M.F.; Steele, I.A. A Luminous Red Nova in M31 and its Progenitor System. Astrophys. J. Lett. 2015, 805, L18. [Google Scholar] [CrossRef] [Green Version]
  23. Pejcha, O.; Metzger, B.D.; Tomida, K. Cool and luminous transients from mass-losing binary stars. Mon. Not. R. Astron. Soc. 2016, 455, 4351. [Google Scholar] [CrossRef] [Green Version]
  24. Pejcha, O.; Metzger, B.D.; Tomida, K. Binary stellar mergers with marginally bound ejecta: excretion discs, inflated envelopes, outflows, and their luminous transients. Mon. Not. R. Astron. Soc. 2016, 461, 2527. [Google Scholar] [CrossRef] [Green Version]
  25. Tartaglia, L.; Pastorello, A.; Sullivan, M.; Baltay, C.; Rabinowitz, D.; Nugent, P.; Drake, A.J.; Djorgovski, S.G.; Gal-Yam, A.; Fabrika, S.; et al. Interacting supernovae and supernova impostors. LSQ13zm: an outburst heralds the death of a massive star. Mon. Not. R. Astron. Soc. 2016, 459, 1039. [Google Scholar] [CrossRef] [Green Version]
  26. Villar, V.A.; Berger, E.; Chornock, R.; Margutti, R.; Laskar, T.; Brown, P.J.; Blanchard, P.K.; Czekala, I.; Lunnan, R.; Reynolds, M.T. The Intermediate Luminosity Optical Transient SN 2010da: The Progenitor, Eruption, and Aftermath of a Peculiar Supergiant High-mass X-ray Binary. Astrophys. J. 2016, 830, 11. [Google Scholar] [CrossRef] [Green Version]
  27. Humphreys, R.M.; Davidson, K.; Van Dyk, S.D.; Gordon, M.S. A Tale of Two Impostors: SN2002kg and SN1954J in NGC 2403. Astrophys. J. 2017, 848, 86. [Google Scholar] [CrossRef] [Green Version]
  28. Humphreys, R.M.; Stangl, S.; Gordon, M.S.; Davidson, K.; Grammer, S.H. Luminous and Variable Stars in NGC 2403 and M81. Astron. J. 2019, 157, 22. [Google Scholar] [CrossRef] [Green Version]
  29. Blagorodnova, N.; Kotak, R.; Polshaw, J.; Kasliwal, M.M.; Cao, Y.; Cody, A.M.; Doran, G.B.; Elias-Rosa, N.; Fraser, M.; Fremling, C. VizieR Online Data Catalog: Follow-up photometry of M101 OT2015-1. Astrophys. J. 2017, 834, 107. [Google Scholar] [CrossRef] [Green Version]
  30. Adams, S.M.; Blagorodnova, N.; Kasliwal, M.M.; Adams, S.M.; Blagorodnova, N.; Kasliwal, M.M.; Amanullah, R.; Barlow, T.; Bue, B.; Bulla, M.; et al. iPTF Survey for Cool Transients. Publ. Astron. Soc. Pac. 2018, 130, 985. [Google Scholar] [CrossRef] [Green Version]
  31. Bellm, E.C.; Kulkarni, S.R.; Graham, M.J.; Dekany, R.; Smith, R.M.; Riddle, R.; Masci, F.J.; Helou, G.; Prince, T.A.; Adams, S.M.; et al. The Zwicky Transient Facility: System Overview, Performance, and First Results. Publ. Astron. Soc. Pac. 2019, 131, 18002. [Google Scholar] [CrossRef]
  32. Jayasinghe, T.; Stanek, K.Z.; Kochanek, C.S.; Shappee, B.J.; Holoien, T.W.S.; Thompson, T.A.; Prieto, J.L.; Dong, S.; Pawlak, M.; Pejcha, O.; et al. The ASAS-SN catalogue of variable stars—II. Uniform classification of 412,000 known variables. Mon. Not. R. Astron. Soc. 2019, 486, 1907. [Google Scholar]
  33. Kashi, A.; Frankowski, A.; Soker, N. NGC 300 OT2008-1 as a Scaled-down Version of the Eta Carinae Great Eruption. Astrophys. J. Lett. 2010, 709, L11. [Google Scholar] [CrossRef]
  34. Soker, N.; Kashi, A. Explaining two recent intermediate-luminosity optical transients (ILOTs) by a binary interaction and jets. Mon. Not. R. Astron. Soc. 2016, 462, 217. [Google Scholar] [CrossRef] [Green Version]
  35. Kashi, A. Simulations and Modeling of Intermediate Luminosity Optical Transients and Supernova Impostors. Galaxies 2018, 6, 82. [Google Scholar] [CrossRef] [Green Version]
  36. Kashi, A.; Soker, N. Operation of the jet feedback mechanism (JFM) in intermediate luminosity optical transients (ILOTs). Res. Astron. Astrophys. 2016, 16, 99. [Google Scholar] [CrossRef] [Green Version]
  37. Tylenda, R.; Soker, N. Eruptions of the V838 Mon type: Stellar merger versus nuclear outburst models. Astron. Astrophys. 2006, 451, 223. [Google Scholar] [CrossRef] [Green Version]
  38. Evans, A.; Geballe, T.R.; Rushton, M.T.; Smalley, B.; van Loon, J.T.; Eyres, S.P.S.; Tyne, V.H. V838 Mon: An L supergiant? Mon. Not. R. Astron. Soc. 2003, 343, 1054. [Google Scholar] [CrossRef] [Green Version]
  39. Starrfield, S.; Wagner, R.M.; Hauschildt, P.H.; Bond, H.E.; Evans, A.; Rushton, M.T.; Munari, U.; Henden, A.; Levay, Z.G.; Panagia, N.; et al. The 2002 outburst of V838 Mon: As cool as it gets. In Proceedings of the 13th Cambridge Workshop on Cool Stars, Stellar Systems and the Sun, Hamburg, Germany, 5–9 July 2004; European Space Agency: Paris, France, 2005; p. 359. [Google Scholar]
  40. Soker, N.; Tylenda, R. Violent stellar merger model for transient events. Mon. Not. R. Astron. Soc. 2006, 373, 733. [Google Scholar] [CrossRef]
  41. Tylenda, R.; Soker, N.; Szczerba, R. On the progenitor of V838 Monocerotis. Astron. Astrophys. 2005, 441, 1099. [Google Scholar] [CrossRef] [Green Version]
  42. Tylenda, R.; Hajduk, M.; Kamiński, T.; Udalski, A.; Soszyński, I.; Szymański, M.K.; Kubiak, M.; Pietrzyński, G.; Poleski, R.; Wyrzykowski, Ł.; et al. The peculiar nova V1309 Scorpii/nova Scorpii 2008. A candidate twin of V838 Monocerotis. Astron. Astrophys. 2011, 528, A114. [Google Scholar] [CrossRef]
  43. Bear, E.; Kashi, A.; Soker, N. Mergerburst transients of brown dwarfs with exoplanets. Mon. Not. R. Astron. Soc. 2011, 416, 1965. [Google Scholar] [CrossRef] [Green Version]
  44. Kashi, A.; Soker, N. An intermediate luminosity optical transient (ILOTs) model for the young stellar object ASASSN-15qi. Mon. Not. R. Astron. Soc. 2017, 468, 4938. [Google Scholar] [CrossRef] [Green Version]
  45. Soker, N. Planets, Planetary Nebulae, and Intermediate Luminosity Optical Transients (ILOTs). Galaxies 2018, 6, 58. [Google Scholar] [CrossRef] [Green Version]
  46. Herczeg, G.J.; Dong, S.; Shappee, B.J.; Chen, P.; Hillenbrand, L.A.; Jose, J.; Kochanek, C.S.; Prieto, J.L.; Stanek, K.Z.; Kaplan, K.; et al. The Eruption of the Candidate Young Star ASASSN-15qi. Astrophys. J. 2016, 831, 133. [Google Scholar] [CrossRef] [Green Version]
  47. Sicilia-Aguilar, A.; Oprandi, A.; Froebrich, D.; Fang, M.; Prieto, J.L.; Stanek, K.; Scholz, A.; Kochanek, C.S.; Henning, T.; Gredel, R.; et al. The 2014-2017 outburst of the young star ASASSN-13db. A time-resolved picture of a very-low-mass star between EXors and FUors. Astron. Astrophys. 2017, 607, A127. [Google Scholar] [CrossRef] [Green Version]
  48. Holoien, T.W.S.; Prieto, J.L.; Stanek, K.Z.; Kochanek, C.S.; Shappee, B.J.; Zhu, Z.; Sicilia-Aguilar, A.; Grupe, D.; Croxall, K.; Adams, J.J.; et al. Discovery and Observations of ASASSN-13db, an EX Lupi-type Accretion Event on a Low-mass T Tauri Star. Astrophys. J. 2014, 785, L35. [Google Scholar] [CrossRef] [Green Version]
  49. Prieto, J.L.; Holoien, T.S.; Stanek, K.Z.; Kochanek, C.S.; Davis, A.B.; Simonian, G.; Basu, U.; Beacom, J.F.; Shappee, B.J.; Bersier, D.; et al. New Bright Outburst of the EXor ASASSN-13db. In The Astronomer’s Telegram 6692; SAO/NASA Astrophysics Data System: Washington, DC, USA, 2014. [Google Scholar]
  50. Shappee, B.; Prieto, J.; Stanek, K.Z.; Kochanek, C.S.; Holoien, T.; Jencson, J.; Basu, U.; Beacom, J.F.; Szczygiel, D.; Pojmanski, G.; et al. All Sky Automated Survey for SuperNovae (ASAS-SN or “Assassin”). In Proceedings of the American Astronomical Society Meeting Abstracts #223, Seattle, WA, USA, 5–9 January 2014; p. 236.03. [Google Scholar]
  51. Hartmann, L.; Kenyon, S.J. The FU Orionis Phenomenon. Annu. Rev. Astron. Astrophys. 1996, 34, 207. [Google Scholar] [CrossRef]
  52. Audard, M.; Ábrahám, P.; Dunham, M.M.; Green, J.D.; Grosso, N.; Hamaguchi, K.; Kastner, J.H.; Kóspál, Á.; Lodato, G.; Romanova, M.M.; et al. Protostars and Planets VI; Beuther, H., Klessen, R.S., Dullemond, C.P., Henning, T., Eds.; University of Arizona Press: Tucson, AZ, USA, 2014; p. 387. [Google Scholar]
  53. Herbig, G.H. EX Lupi: History and Spectroscopy. Astron. J. 2007, 133, 2679. [Google Scholar] [CrossRef]
  54. Herbig, G.H. The Young Cluster IC 348. Astrophys. J. 1998, 497, 736. [Google Scholar] [CrossRef]
  55. Clarke, C.; Lodato, G.; Melnikov, S.Y.; Ibrahimov, M.A. The photometric evolution of FU Orionis objects: disc instability and wind-envelope interaction. Mon. Not. R. Astron. Soc. 2005, 361, 942. [Google Scholar] [CrossRef] [Green Version]
  56. Zhu, Z.; Hartmann, L.; Gammie, C. Nonsteady Accretion in Protostars. Astrophys. J. 2009, 694, 1045. [Google Scholar] [CrossRef]
  57. Vorobyov, E.I.; DeSouza, A.L.; Basu, S. The Burst Mode of Accretion in Primordial Protostars. Astrophys. J. 2013, 768, 131. [Google Scholar] [CrossRef]
  58. Aspin, C.; Reipurth, B.; Herczeg, G.J.; Capak, P. The 2008 Extreme Outburst of the Young Eruptive Variable Star EX Lupi. Astrophys. J. Lett. 2010, 719, L50. [Google Scholar] [CrossRef]
  59. Contreras Peña, C.; Lucas, P.W.; Minniti, D.; Kurtev, R.; Stimson, W.; Navarro Molina, C.; Borissova, J.; Kumar, M.S.N.; Thompson, M.A.; Gledhill, T.; et al. The evolution of the galaxy content of dark matter haloes. Mon. Not. R. Astron. Soc. 2017, 465, 3011. [Google Scholar] [CrossRef]
  60. Goldhaber, G.; Groom, D.E.; Kim, A.; Aldering, G.; Astier, P.; Conley, A.; Deustua, S.E.; Ellis, R.; Fabbro, S.; Fruchter, A.S.; et al. Timescale Stretch Parameterization of Type Ia Supernova B-Band Light Curves. Astrophys. J. 2001, 558, 359. [Google Scholar] [CrossRef] [Green Version]
  61. Conley, A.; Sullivan, M.; Hsiao, E.Y.; Guy, J.; Astier, P.; Balam, D.; Balland, C.; Basa, S.; Carlberg, R.G.; Fouchez, D.; et al. SiFTO: An Empirical Method for Fitting SN Ia Light Curves. Astrophys. J. 2008, 681, 482. [Google Scholar] [CrossRef] [Green Version]
  62. Hachisu, I.; Kato, M. A Light-curve Analysis of 32 Recent Galactic Novae: Distances and White Dwarf Masses. Astrophys. J. Suppl. 2019, 242, 18. [Google Scholar] [CrossRef] [Green Version]
  63. Sparks, W.B.; Bond, H.E.; Cracraft, M.; Levay, Z.; Crause, L.A.; Dopita, M.A.; Henden, A.A.; Munari, U.; Panagia, N.; Starrfield, S.G.; et al. V838 Monocerotis: A Geometric Distance from Hubble Space Telescope Polarimetric Imaging of its Light Echo. Astron. J. 2008, 135, 605. [Google Scholar] [CrossRef] [Green Version]
  64. Zechmeister, M.; Kürster, M. The generalised Lomb-Scargle periodogram. A new formalism for the floating-mean and Keplerian periodograms. Astron. Astrophys. 2009, 496, 577. [Google Scholar] [CrossRef]
  65. Welch, P.D. The Use of Fast Fourier Transform for the Estimation of Power Spectra: A Method Based on Time Averaging Over Short, Modified Periodograms. IEEE Trans. Audio Electroacoust. 1967, 15, 70. [Google Scholar] [CrossRef] [Green Version]
  66. Fedele, D.; van den Ancker, M.E.; Petr-Gotzens, M.G.; Rafanelli, P. Optical and infrared properties of V1647 Orionis during the 2003-2006 outburst. II. Temporal evolution of the eruptive source. Astron. Astrophys. 2007, 472, 207. [Google Scholar] [CrossRef] [Green Version]
  67. Tylenda, R. Evolution of V838 Monocerotis during and after the 2002 eruption. Astron. Astrophys. 2005, 436, 1009. [Google Scholar] [CrossRef] [Green Version]
  68. Goto, M.; Regály, Z.; Dullemond, C.P.; van den Ancker, M.; Brown, J.M.; Carmona, A.; Pontoppidan, K.; Ábrahám, P.; Blake, G.A.; Fedele, D.; et al. Fundamental Vibrational Transition of CO During the Outburst of EX Lupi in 2008. Astrophys. J. 2011, 728, 5. [Google Scholar] [CrossRef]
  69. Banzatti, A.; Pontoppidan, K.M. An Empirical Sequence of Disk Gap Opening Revealed by Rovibrational CO. Astrophys. J. 2015, 809, 167. [Google Scholar]
  70. Baruteau, C.; Bai, X.; Mordasini, C.; Mollière, P. Formation, Orbital and Internal Evolutions of Young Planetary Systems. SSRv 2016, 205, 77–124. [Google Scholar]
  71. Fortney, J.J.; Marley, M.S.; Barnes, J.W. Planetary Radii across Five Orders of Magnitude in Mass and Stellar Insolation: Application to Transits. Astrophys. J. 2007, 659, 1661. [Google Scholar] [CrossRef] [Green Version]
  72. Guillot, T. The interiors of giant planets: Models and outstanding questions. Annu. Rev. Earth Planet. Sci. 2005, 33, 493–530. [Google Scholar] [CrossRef]
  73. Retter, A.; Marom, A. A model of an expanding giant that swallowed planets for the eruption of V838 Monocerotis. Mon. Not. R. Astron. Soc. 2003, 345, L25. [Google Scholar] [CrossRef] [Green Version]
  74. Retter, A.; Zhang, B.; Siess, L.; Levinson, A. The planets capture model of V838 Monocerotis: conclusions for the penetration depth of the planet(s). Mon. Not. R. Astron. Soc. 2006, 370, 1573. [Google Scholar] [CrossRef] [Green Version]
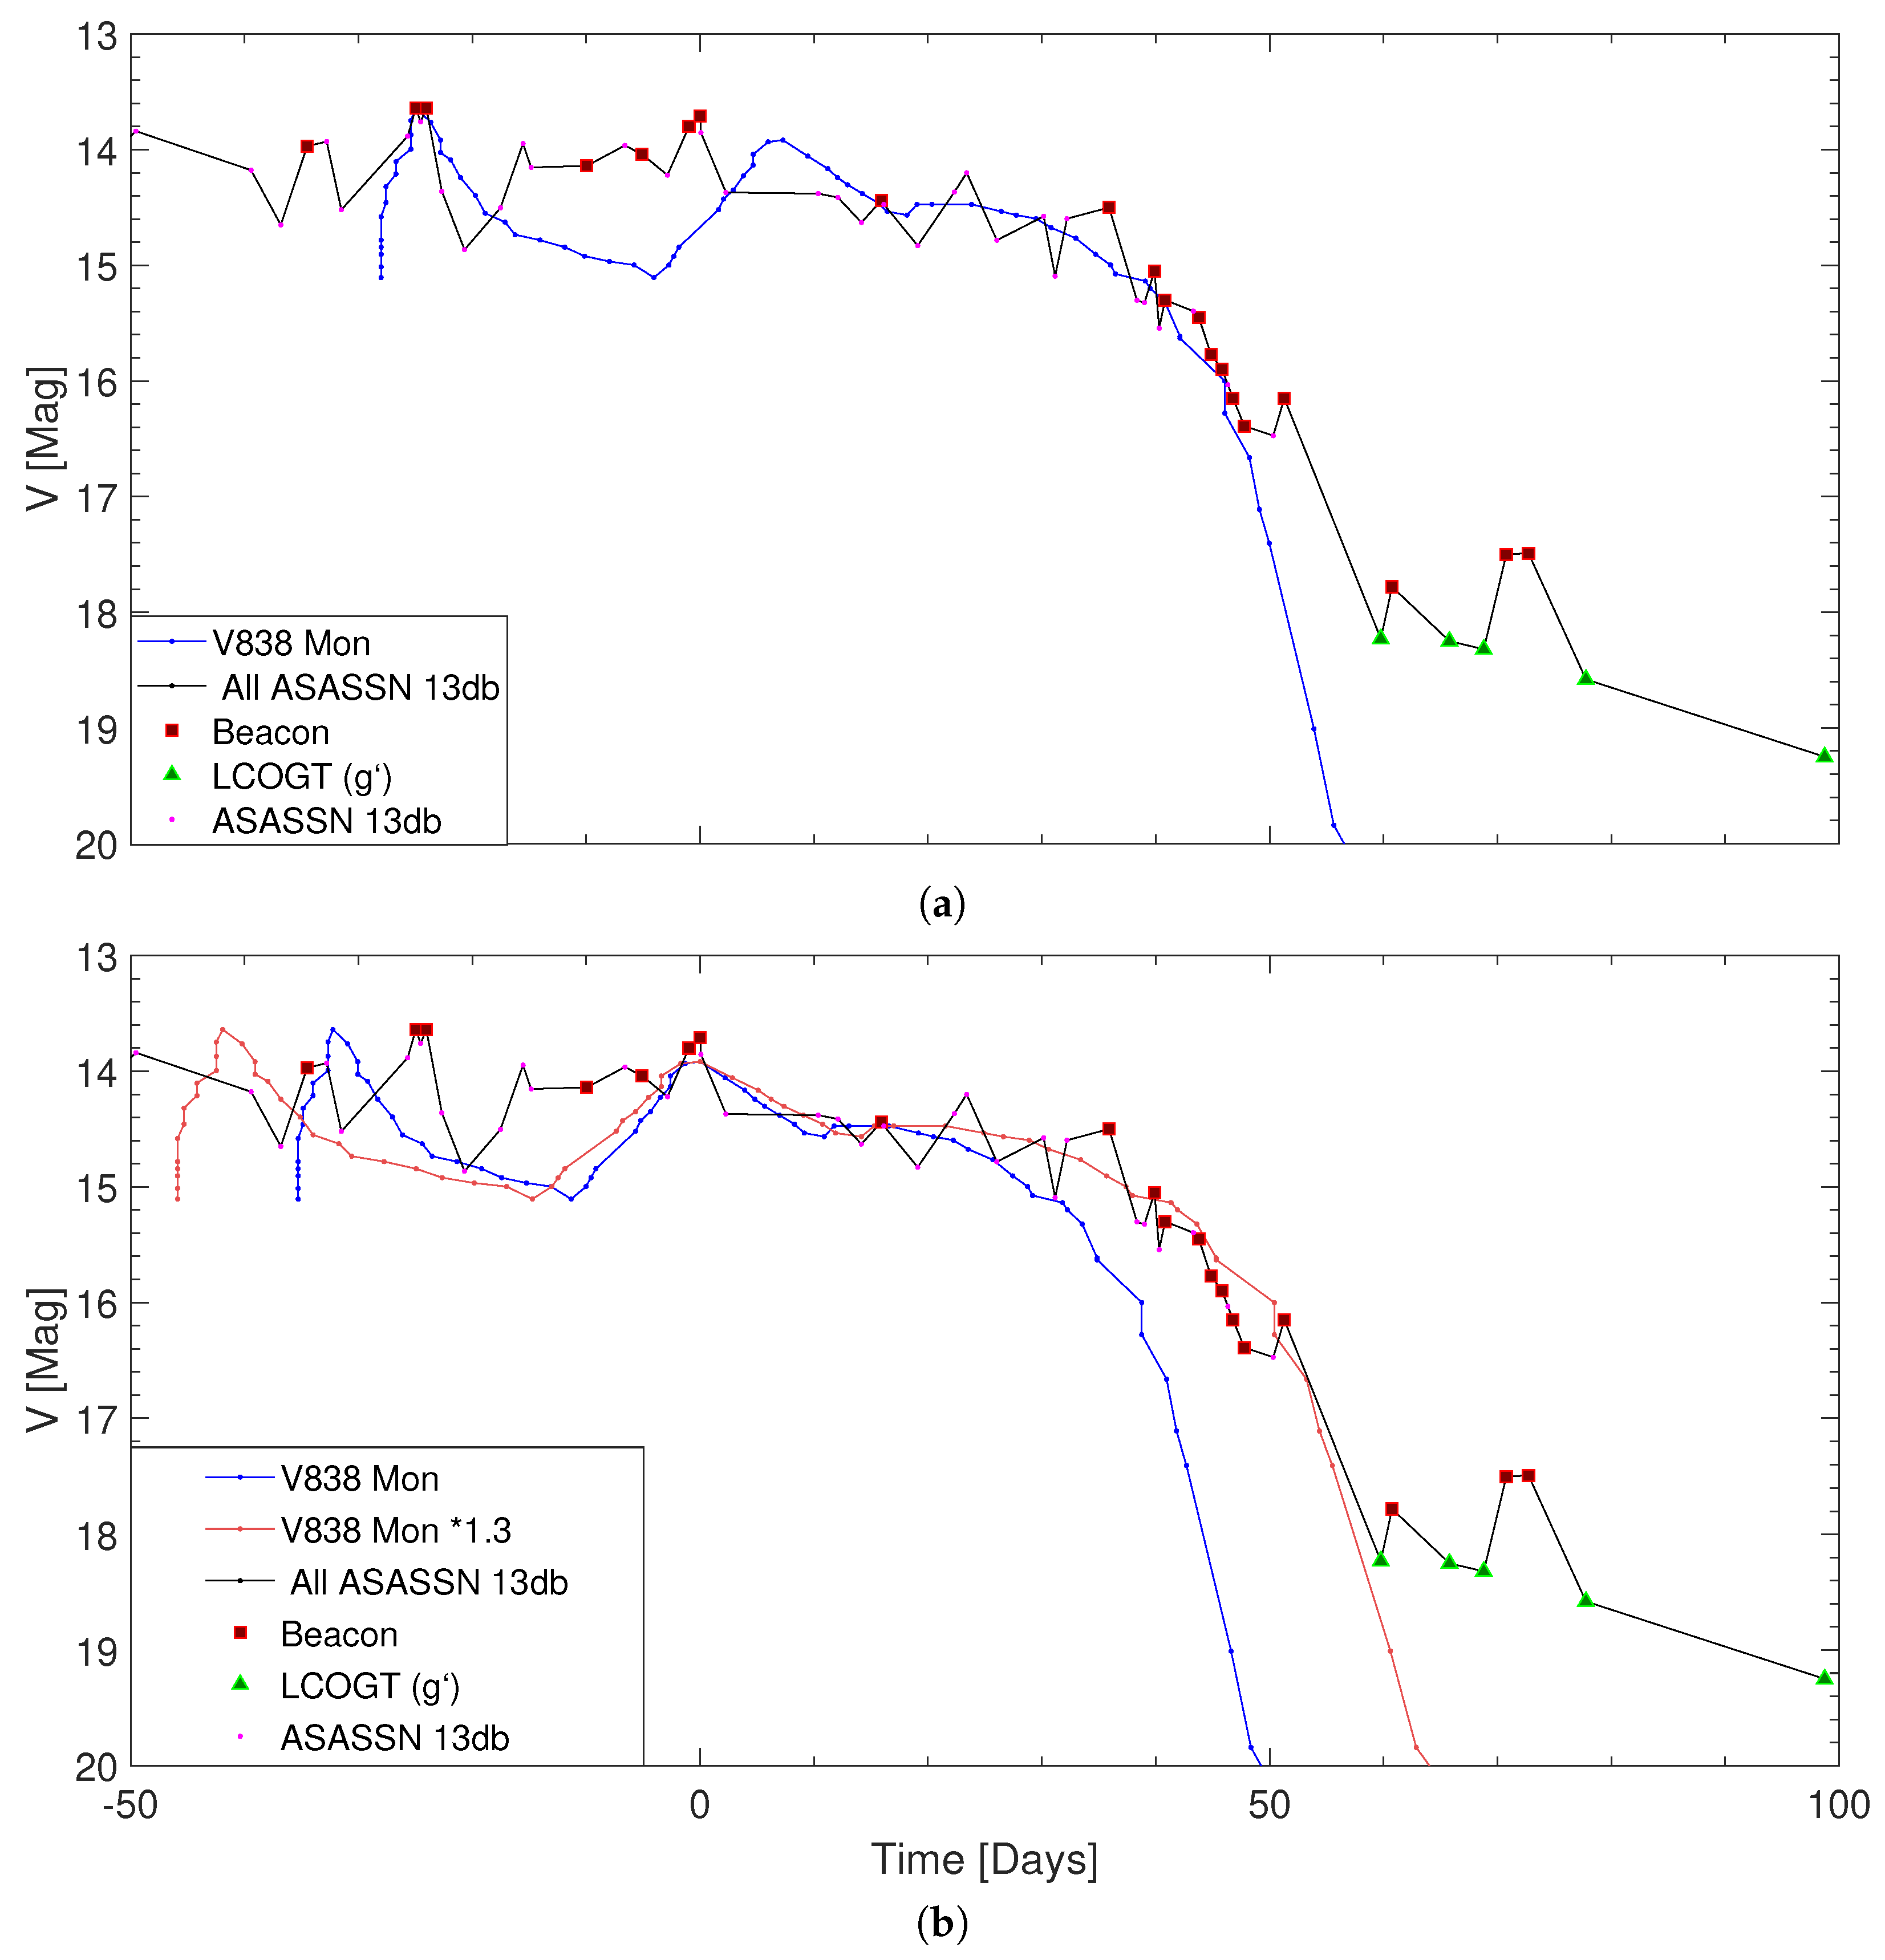
Figure 1. (a) Comparing the V-band light curves of A13db1417 [47] and V838 Mon (Bond et al. [2], Starrfield et al. [39], Sparks et al. [63]). The magnitude scale is the apparent magnitude for A13db1417. The light curve of V838 Mon was shifted by Δ V V 838 Mon = 6.9 mag to match the second peak before decline. The time axis focuses on the end of the 800 days duration of A13db1417 (see Sicilia Aguilar et al. [47]) which is the 55 days decline phase. The peak at JD 2,457,728 marks t = 0 . (b) Same us the upper panel, but the light curves were shifted to match the peak just before decline. In addition, the time axis of the light curve V838 Mon is scaled by a factor of 1.3 relative to the matched peak. This results in that the two light curves match for about 4 mag.
Galaxies 08 00002 g001
Figure 2. The light curve of A13db1417, with the variability resulted by rotation of stellar spot filtered out, compared to the light curve of V838 Mon. This variability caused oscillations of δ V 1 mag. By filtering out the effect of rotation, we isolate the component resulted from accretion. The filtered signal matches better the scaled light curve of V838 Mon.
Galaxies 08 00002 g002
Figure 3. The light curve of A13db1417 compared to that of the FU Ori eruption of V1647 Ori [66]. It can be seen that the two curves are very different and the decline does not follow the same slope. This suggest that this objects are different. Note that the LCOGT observation at t = 2 days may be an outlier.
Galaxies 08 00002 g003
Figure 4. The effective temperature of A13db1417, obtained from different filters as indicated in the legend. The calculation was performed assuming black-body emission, which is apparently not the emitting spectrum, hence the differences between the estimated in different filter pairs. Nevertheless we can see that the effective temperature is declining from 4500 K to 2000 K during the eruption. Over-plotted is the effective temperature from of V838 Mon, adopted from [67]. It is evident that both objects have a similar decline.
Galaxies 08 00002 g004
Figure 5. A focus on the fast increase in luminosity at the beginning of A13db1417. Observations are taken from [47].
Galaxies 08 00002 g005
Figure 6. An estimate to a classical accretion disk surface temperature, according to Equation (7). When the disk is depleted the mass accretion rate decreases and so does the surface temperature of the disk.
Galaxies 08 00002 g006