Article

Properties of Subhalos in the Interacting Dark Matter Scenario

by
Ángeles Moliné
1,2,*,
Jascha A. Schewtschenko
3,
Miguel A. Sánchez-Conde
1,2,
Alejandra Aguirre-Santaella
1,2,
Sofía A. Cora
4,5,6 and
Mario G. Abadi
7,8
1
Instituto de Física Teórica UAM-CSIC, Universidad Autónoma de Madrid, C/ Nicolás Cabrera, 13-15, 28049 Madrid, Spain
2
Departamento de Física Teórica, M-15, Universidad Autónoma de Madrid, E-28049 Madrid, Spain
3
Institute of Cosmology and Gravitation, University of Portsmouth, Dennis Sciama Building, Portsmouth PO1 3FX, UK
4
Instituto de Astrofísica de La Plata (CCT La Plata, CONICET, UNLP), Observatorio Astronómico, Paseo del Bosque, B1900FWA La Plata, Argentina
5
Facultad de Ciencias Astronómicas y Geofísicas, Universidad Nacional de La Plata, Observatorio Astronómico, Paseo del Bosque, B1900FWA La Plata, Argentina
6
Consejo Nacional de Investigaciones Científicas y Técnicas (CONICET), Godoy Cruz 2290, C1425FQB CABA, Argentina
7
Observatorio Astronómico, Universidad Nacional de Córdoba, Laprida 854, X5000BGR Córdoba, Argentina
8
Instituto de Astronomía Teórica y Experimental (IATE), CONICET-Universidad Nacional de Córdoba, Córdoba, Argentina
*
Author to whom correspondence should be addressed.
Galaxies 2019, 7(4), 80; https://doi.org/10.3390/galaxies7040080
Submission received: 26 July 2019 / Revised: 17 September 2019 / Accepted: 18 September 2019 / Published: 21 September 2019
(This article belongs to the Special Issue The Role of Halo Substructure in Gamma-Ray Dark Matter Searches)

Abstract

:
One possible and natural derivation from the collisionless cold dark matter (CDM) standard cosmological framework is the assumption of the existence of interactions between dark matter (DM) and photons or neutrinos. Such a possible interacting dark matter (IDM) model would imply a suppression of small-scale structures due to a large collisional damping effect, even though the weakly-interacting massive particle (WIMP) can still be the DM candidate. Because of this, IDM models can help alleviate alleged tensions between standard CDM predictions and observations at small mass scales. In this work, we investigate the properties of the DM halo substructure or subhalos formed in a high-resolution cosmological N-body simulation specifically run within these alternative models. We also run its CDM counterpart, which allowed us to compare subhalo properties in both cosmologies. We show that, in the lower mass range covered by our simulation runs, both subhalo concentrations and abundances are systematically lower in IDM compared to the CDM scenario. Yet, as in CDM, we find that median IDM subhalo concentration values increase towards the innermost regions of their hosts for the same mass subhalos. Similarly to CDM, we find IDM subhalos to be more concentrated than field halos of the same mass. Our work has a direct application to studies aimed at the indirect detection of DM where subhalos are expected to boost the DM signal of their host halos significantly. From our results, we conclude that the role of the halo substructure in DM searches will be less important in interacting scenarios than in CDM, but is nevertheless far from being negligible.

1. Introduction

The current standard model of cosmology, Λ CDM, is based on a cosmological constant to explain the late-time accelerated expansion of the Universe and a cold dark matter (CDM) component to account for the required additional gravitational attraction to form and support the galaxies and larger structures we observe today [1]. In this framework, the structure of the Universe is formed via a hierarchical, bottom-up scenario (see, e.g., [2]) with small primordial density perturbations growing to the point where they collapse into the filaments, walls, and eventually dark matter (DM) halos that form the underlying large-scale-structure filamentary web of the Universe. The galaxies are embedded in these massive, extended DM halos teeming with a self-bound substructure. Any viable cosmological model has to predict both the abundance and internal properties of these structures and their substructures successfully, and match the observational data on a wide range of scales. Λ CDM achieves this challenging feat well on the largest scales [3,4,5,6,7]. Yet, on small scales, tensions have been reported between its predictions and observations in our local cosmological neighbourhood. The abundance of DM substructures predicted by numerical simulations of structure formation exceeds significantly the number of satellite galaxies observed around the Milky Way and neighbouring Andromeda galaxy (see, e.g., [8,9]). Various explanations for this and similar discrepancies such as the “too big to fail” [10], “cusp vs. core” [11], and “satellite alignment” problems [12,13] were brought forward, with some of them attributed to feedback mechanisms in the baryonic sector that suppressed star formation in such small halos (see, e.g., [14]), thus leaving them without any observable tracers in the observational surveys [15], or altering the DM profiles within the halos [16,17,18,19,20,21]. Others turned to alternative models for the DM to account for the lower amount of small subhalos (see, e.g., [22,23])) or deviations of their expected properties [24,25,26]. The latter pathway is not only well motivated, as the properties of DM have yet remained largely a mystery, but in return, this also allows us to use the study of galaxies and their structural properties as effective probes into the very nature of the elusive DM particle.
One natural deviation from the collisionless CDM in the standard model is the assumption of the existence of interactions between DM and the standard model (SM) particles we know about, in particular, photons or neutrinos [27,28,29]. This does not only affect, as we show in this article, the formation of DM structures on small scales, but also provides an explanation for the exact relic abundance of DM, Ω cdm h 2 = 0.12011 , found in the Universe today [1]. With such interactions, DM was in full thermal equilibrium with SM particles at sufficiently early times and then annihilated into SM particles until the DM decoupled from the standard sector as the Universe expanded and cooled down. The cross-section needed to retain the observed abundance of DM is surprisingly close to the one expected from the interaction via the weak force in the SM, thus coining the name “weakly interacting massive particles (WIMP) miracle”. Beyond-SM theories provide a variety of WIMP DM candidates such as the minimal SUSY standard model with the neutralino and sneutrino and their electroweak scale interactions [30] or the minimal Universal extra dimension model of the Kaluza–Klein (KK) theory with the first excitation mode of the gauge field as the lightest KK-particle [31]. When it comes to the interaction partner, the usefulness of baryons is limited due to their relatively low abundance in the Universe at any time and the existing constrains on the cross-section with DM from direct detection experiments. Similarly, charged leptons, whose potential coupling with “leptophilic” DM was initially proposed as an explanation for an excess positron flux from outer space, as well as DM direct detection signals [32], are constrained by, e.g., the lack of observations of such interactions in collider experiments [33]. On the other hand, relativistic neutrinos and photons can be found in high abundance in the radiation-dominated era of the early Universe and particle-physics experiments, e.g., particle colliders, providing only very few constraints on their potential interaction with DM. Additionally, the cross-section considered in this work is sufficiently low that, e.g., the scattering rate of observable cosmic photons on DM halos is negligible as the mean free path of a photon even within the high-density inner regions of large DM halos is still many orders of a magnitude larger than these regions themselves.
In our work, we do not pick a specific model, but simply work within an effective theory, i.e., an effective interaction term between some unspecified, otherwise sterile DM particles and our SM particles of choice, photons and neutrinos in the Lagrangian. We will refer to this model as interacting dark matter (IDM). Depending on the actual type/mass of the mediator in our “black box”, this can lead to the momentum/velocity-dependence of our effective cross-sections but, for simplicity, we mainly focus on the following inn velocity-independent scenarios. For any given cross-section, the DM remains coupled to the radiation in the early Universe until the latter is diluted enough as the Universe expands for the DM to become decoupled. As a result of this coupling, primordial perturbations, and thus, the seeds of late-time structures, are suppressed within the DM below a certain scale. This is visible as a cut-off in the linear matter power spectrum. For a DM–radiation scattering cross-section of σ / σ Th = 2 × 10 9 ( m dm / GeV ) with σ Th , the Thomson cross-section, and m dm the DM mass, this characteristic scale is ∼100 kpc [34] and increases or decreases with the cross-section [28,35,36,37,38,39,40].
Returning to the premise of using the halo and subhalo population as a probe into the nature of DM, we can use this suppression and its consequences for the structure formation to find bounds on the interaction cross-section. Unfortunately, as previously mentioned, a more direct study of the halo population is difficult as the distribution of its visible tracers, i.e., stars and gas, is also subject to not fully-quantified astrophysical processes. Strong lensing may provide a way to determine the DM profile of larger halos [41], but the halos around the cut-off scale are orders of magnitude smaller. Indirect methods, on the other hand, namely the detection of the annihilation or decay products of DM particles, are highly dependent on the statistical and structural properties of the halo and subhalo population. For instance, the extragalactic γ -ray and neutrino signals due to DM annihilations, when estimated via the so-called halo model [42,43,44], depend mainly on the DM halo and subhalo structural properties, as well as their abundances (see, e.g., [45,46,47,48,49]). Clearly, the considered cosmological model is crucial for such DM searches as different predictions for structure formation on small scales imply different gamma-ray or neutrino signal estimations. Ultimately, this may translate into different constraints on the DM annihilation cross-section when compared to those obtained assuming the standard Λ CDM scenario. In [50], the isotropic extragalactic signals expected from DM annihilations into γ -rays and neutrinos were investigated for both IDM and Λ CDM models using only the main halo properties as extracted from DM-only simulations. In this work, we study the properties of the halo substructure in the same IDM scenario of [50], for which we now use a set of N-body, DM-only cosmological simulations with higher particle resolution. Due, mainly, to the tidal stripping effects on the subhalo population, describing the subhalo DM density profiles is not a trivial task (see, e.g., the discussion in [49]). Thanks to our higher resolution simulations, by taking a profile-independent approach, we study IDM halo and subhalo structural properties as a function of the distance to the host halo centre and subhalo mass for the first time. As we explain in this work, one such way to characterize such properties without assuming a given density profile is to consider in the analysis the peak circular velocity V max and the radius at which this velocity is attained R max . In previous works [34,50], halo properties were presented as a function of halo mass. In order to compare halo and subhalo properties, in this work, we also present these properties as a function of V max . On the other hand, in [51], a study about the number of subhalos in a Milky-Way-sized halo was performed as a function of V max . In this work, we present such analyses as a function of the distance to the host halo centre and subhalo mass.
The work is organized as follows. We briefly summarize the theory behind IDM in Section 2, followed by a description of our simulations in Section 3. For both IDM and Λ CDM models, in Section 4, we present our results for subhalo properties such as concentrations, abundances, and subhalo radial distributions within the host halos. We finally discuss these results and draw our conclusions in Section 5.

2. Interacting Dark Matter

In our effective theory of IDM, the interactions between DM and photons (or alternatively neutrinos) result in additional terms in the equations governing the evolution of the cosmic components (see, e.g., [52]),
θ ˙ b = k 2 ψ H θ b + c s 2 k 2 δ b R 1 κ ˙ θ b θ γ ,
θ ˙ γ = k 2 ψ + 1 4 δ γ σ γ k 2 δ b κ ˙ θ γ θ b C γ DM ,
θ ˙ DM = k 2 ψ H θ DM C DM γ ,
where ψ is the gravitational potential, H = a H is the conformal Hubble rate, c s is the baryon sound speed, and δ , θ , and σ are the density, velocity divergence, and anisotropic stress potential, respectively, associated with the baryon (b), photon ( γ ), and DM fluid. For the electromagnetic interactions (EM) in the SM, the first two equations include terms with the Thomson scattering rate κ ˙ a σ Th c n e , where c is the speed of light and n e the density of free electrons (the scale factor a appears since the derivative is taken with respect to conformal time). The ratio of the baryon to photon density, R ( 3 / 4 ) ( ρ b / ρ γ ) , is a pre-factor to ensure momentum conservation. C DM γ and C γ DM = S 1 C DM γ are the new interactions terms that have to be added to include interactions between DM and the cosmic photon background with S ( 3 / 4 ) ( ρ DM / ρ γ ) as the scaling of the counter term in the momentum, and ρ D M is the dark matter energy density. Analogous to the EM interaction,
C DM γ = μ ˙ θ DM θ γ
depends on the new interaction rate μ ˙ a σ DM γ c n DM . Here, σ DM γ is the elastic scattering cross-section between DM and photons, while n D M = ρ D M / m D M is the DM number density. For the DM–neutrino interactions, similar modifications can be added. In [38], an implementation of these modified Euler equations for the CLASS Boltzmann solver was presented. We are using this work to calculate the linear evolution of the Universe up to the point (in this work, at redshift z = 127 ) where we switch to simulations to also cover the full non-linear evolution and resulting structure formation accurately (for more details, see also [51]).

3. Simulations

For this work, we calculated the non-linear evolution of the matter distribution using a suite of cosmological DM-only simulations. This includes both simulations of single-resolution periodic volumes of 100 Mpc, as well as zoom-in simulations, which focus on representative sub-volumes to improve the maximum resolution for a subset of the obtained DM structure samples.
We performed these simulations with the parallel tree-particle mesh N-body code, P-Gadget3 [53], for both a standard, collision-less CDM and a γ CDM model with a cross-section σ / σ Th = 2 × 10 9 ( m DM / GeV ) . This value is (roughly) the upper bound obtained in previous works from satellite number counts of Milky-Way-sized halos [34,51]. In [54], a more conservative constraint was claimed using measurements of the ionization history of the Universe at several redshifts, results from N-body simulations, and recent estimates of the number of Milky Way satellite galaxies. However, the approach implemented can generate large uncertainties since the presence of low-mass subhalos in galactic halos, which simulations cannot resolve, and extrapolations are necessary to obtain the results. Note that whereas larger cross-sections would erase most of the observed substructure, smaller cross-sections would imply results in between CDM and IDM. The simulations begin at a redshift of z = 127 (the DM–radiation interaction rate is negligible at all times afterwards). For the initial conditions, we used the same cosmology (WMAP7), random phases, and second-order Lagrangian perturbation theory (2LPT) method [55] as the APOSTLE project [56] and our previous studies of the impact of IDM on galactic substructures [51]. After having performed the full-volume run for both standard CDM and γ CDM with a particle mass m Part = 1.96 × 10 8 M / h and a comoving softening length l soft = 2.7 kpc , we identified the DM structures within using the Rockstar halo finder [57]. All halo properties were determined for spherically-overdense regions with a density of 200-times the critical density of the Universe at present, ρ c . With these results, a cubic sub-volume was chosen at z = 0 with a side length of 14 Mpc/h that reproduces the overall halo mass function on the mass scales covered by it. A 1 Mpc -wide margin was added, and the resulting volume traced back to the initial redshift. We checked that the sub-volume thus constructed was still convex in these Lagrangian coordinates. This ensured that the progenitors of the structures within the targeted region evolved well within the high-resolution region, when the resulting volume was re-run using a zooming technique [58] with m Part = 4.85 × 10 5 M / h and l soft = 860 pc in the targeted region.
Throughout this work, we use the term Box to refer to the full-volume simulation (100 Mpc) at z = 0 for each cosmology. The zoom re-simulations model four Local Groups (LGs). We filtered the results to pick only those halos that were well within the higher resolution region, namely inside a ∼2.1-Mpc/h radius at z = 0 . This was done in order to avoid boundary affects, such has halos that consist partly of higher-mass particles, which are ignored here. The total number of halos and subhalos found in both Box and LGs simulations is given in Table 1, together with the most relevant parameters of these simulations.

4. Results

As mentioned, IDM exhibits a linear matter spectrum different from the one of CDM [28,35,36,37,38,39,40]. The IDM matter power spectrum features a cut-off around a smooth scale of ∼100 kpc for the cross-section that we are considering in this work ( σ / σ Th = 2 × 10 9 ( m DM / GeV ) ). Therefore, a suppression of the number of halos below the scale of those hosting dwarf galaxies was expected (i.e., for halo masses below ∼ 10 10 M / h ). In addition, such a linear matter power spectrum impacts the structural halo properties, such as shape, spin, density profile, and halo concentrations [34,50,51]. In this section, we show the results we found for halo and subhalo concentrations in our simulations, as well as subhalo abundances.

4.1. Halo Concentrations

We considered two different definitions for the concentration parameter. The first and more standard is c Δ R vir / r 2 , i.e., the ratio between the halo virial radius, R vir , and the radius r 2 at which the logarithmic slope of the DM density profile d log ρ d log r = 2 . The other definition has the advantage of being independent of the adopted DM density profile and the particular definition used for the virial radius [59,60,61]:
c V = ρ ¯ ( R max ) ρ c = 2 V max H 0 R max 2 ,
where ρ ¯ is the mean physical density within R max and H 0 the Hubble constant. At a given V max , the concentration provides an alternative measure of the characteristic density of a halo.
Assuming an NFWprofile [62,63], the relation between c V and c Δ is given by [59]:
c V = c Δ 2 . 163 3 f ( R max / r s ) f ( c Δ ) Δ ,
where f ( x ) = l n ( 1 + x ) x / ( 1 + x ) and r s = r 2 is the scale radius. For spherical (untruncated) halos1 with a virial mass M Δ and virial radius R Δ at redshift z = 0 , we have:
M Δ = 4 π 3 R Δ 3 ρ c Δ .
where ρ c is the critical density of the Universe at present, Δ is the overdensity factor that defines the halos, and r Δ is its virial radius.
Using our set of simulations, both Box and LGs for IDM and CDM models, we obtained the medians of c V and c Δ . The latter was found by applying the c V - c Δ relation of Equation (6) to the c V ( V max ) values found for every halo in the simulations. We adopted Δ = 200 as the value for the overdensity to define the halos. For Box, we applied a restriction on halo maximum circular velocity such that only halos with V max > 60 km/s were included; in the case of the LG dataset, this restriction was set at V max > 10 km/s. Both criteria were adopted in order to avoid resolution issues in the determination of c V at the smallest scales resolved by the simulations. We grouped halos into bins of V max and obtained the medians of c V . For both the LGs and Box simulations, similar bin sizes were chosen to cover the entire V max range, ∼10 km/s < V max < 10 3 km/s. For each cosmology, we considered five bins in LGs and nine bins for Box simulations.
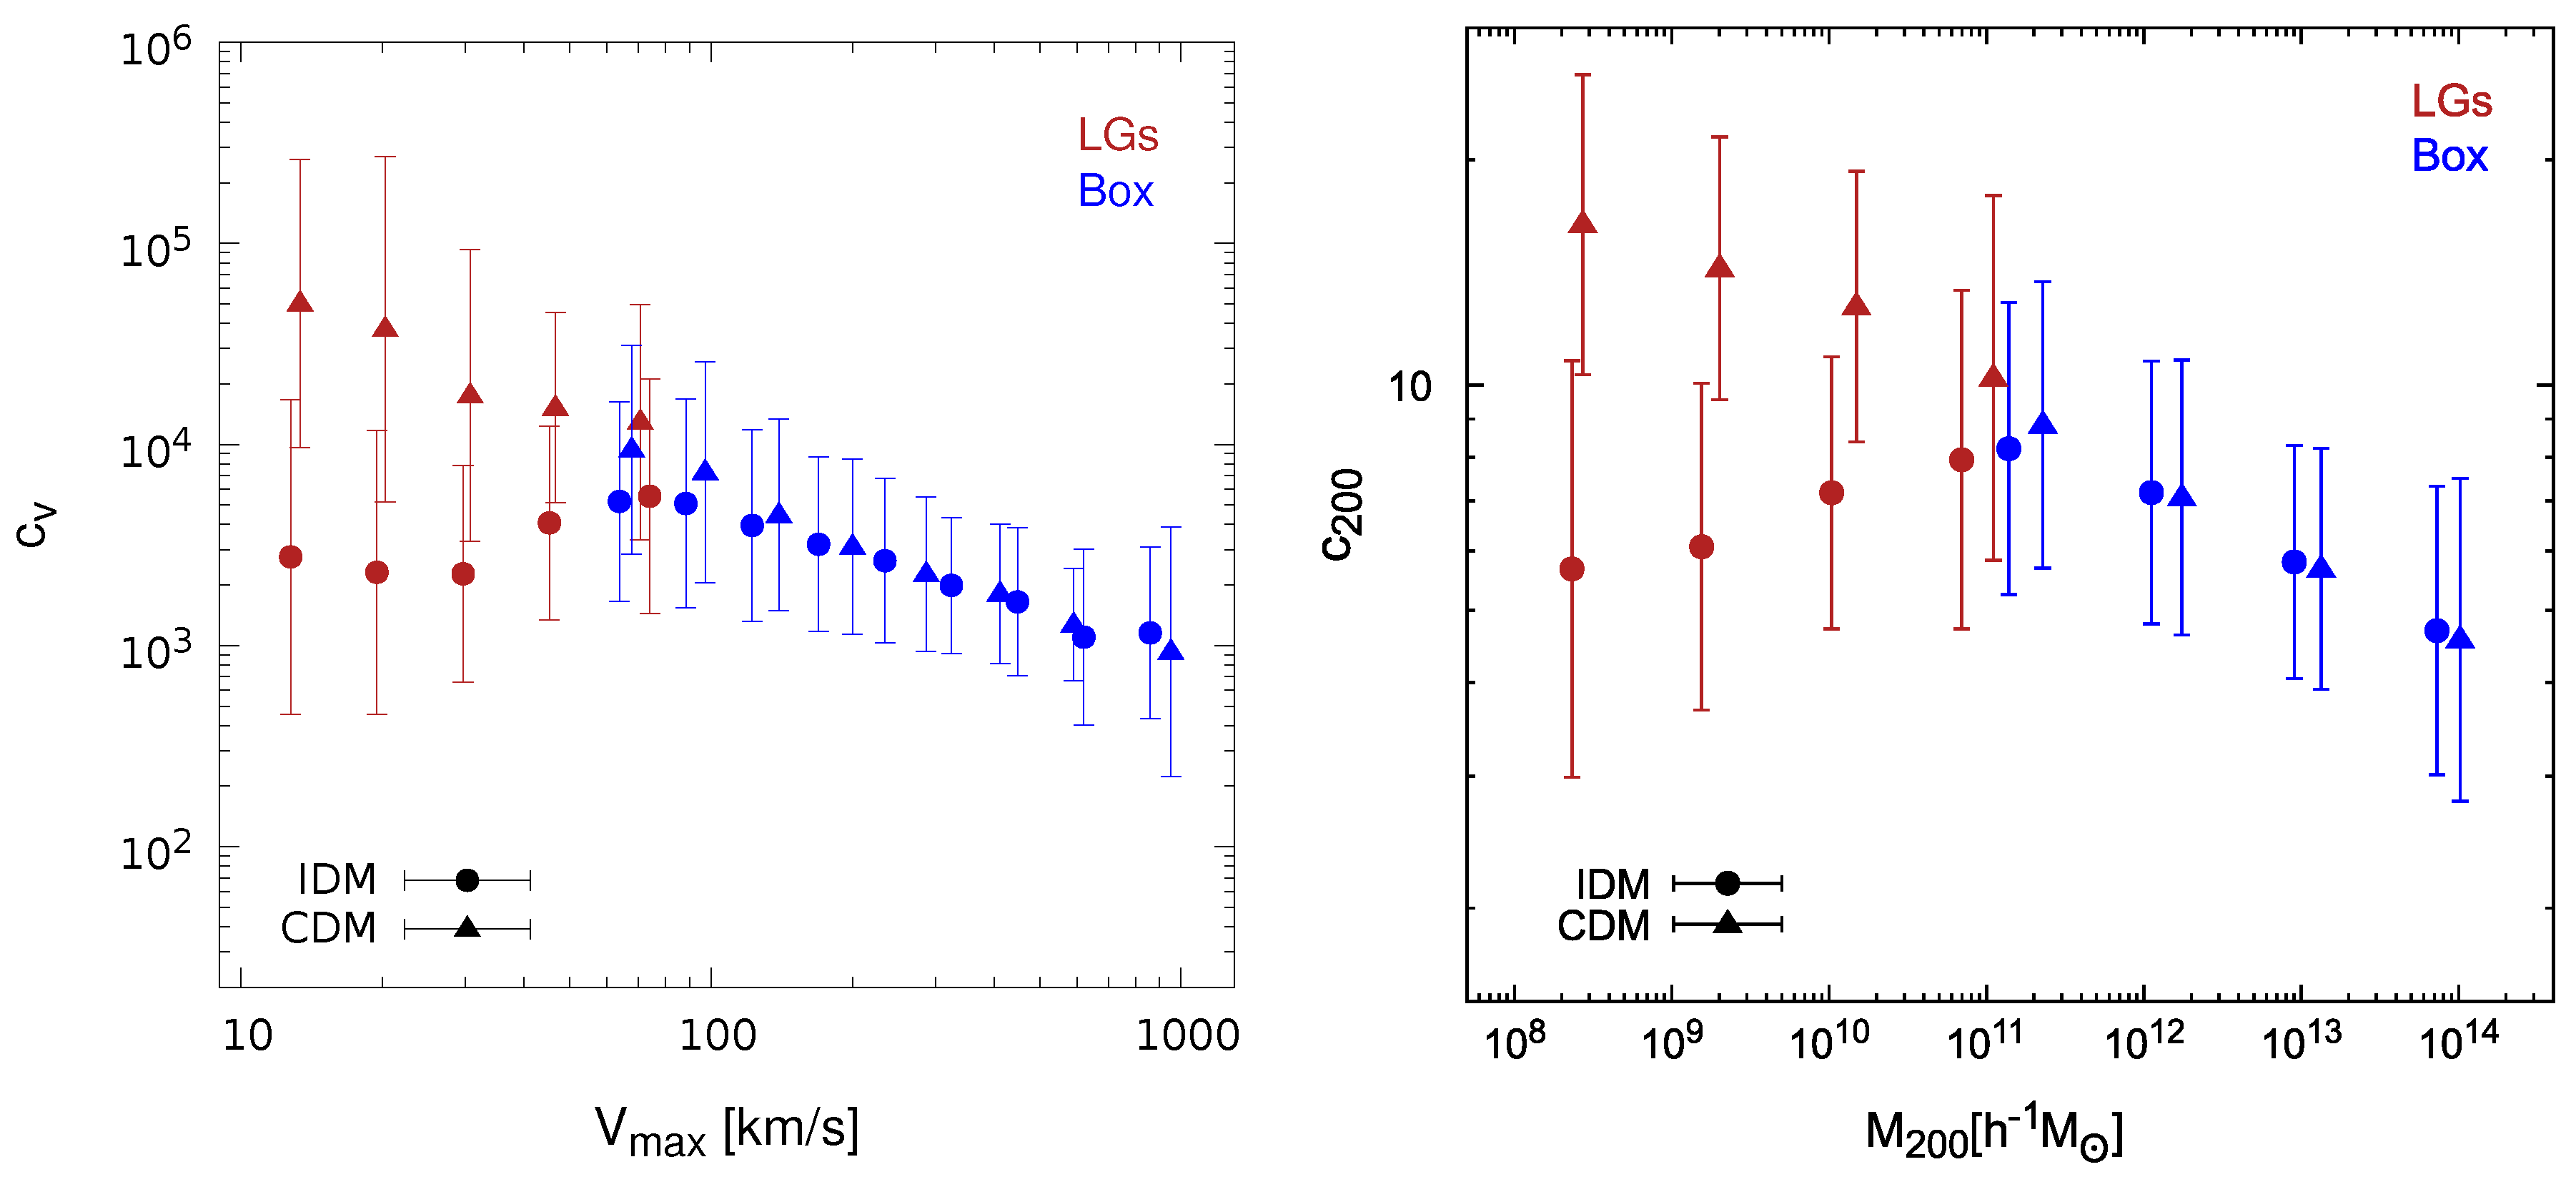
In Figure 1, we show halo concentration values and the corresponding 1 σ standard deviation (left panel) as found in Box (blue) and the four LG (red) simulation runs. Left and right panels show, respectively, results for both median c V ( V max ) and c 200 ( M 200 ) values, the latter in bins of the halo mass M 200 (four for both Box and LG data), calculated using Equation (7) and covering a mass range of 10 8 M / h < M 200 < 10 14 M / h . In order to have truly isolated halos, the so-called “field halos”, in our analysis, we only considered halos that do not have another massive neighbour (defined as more than half the mass of the halo under consideration) located within a distance of 1.5-times its virial radius, R 200 . In order to compare IDM and CDM subhalo concentrations one-to-one, we also include in Figure 1 the corresponding CDM concentrations.
First, it is worth noting that Figure 1 shows an excellent agreement between the concentration values found in both Box and LGs at the scale where the simulations overlap. Furthermore, as expected, both IDM and CDM yielded similar results at large halo masses, while we derived significantly lower median concentration values below halo masses ∼ 10 11 M / h in the case of IDM compared to CDM. Interestingly, this decrease of concentration values was similar to that found in WDM simulations, an effect that has been explained as being due to the delayed formation time of low-mass halos [64]. In addition, a similar analysis for c 200 was performed in [34,50] where also the dependence on redshift was presented. Our results were in good agreement with such previous ones at z = 0 . As we explained above, such results for the concentration-mass relation, c 200 ( M 200 ) , were obtained from c V ( V max ) (see Equation (6)). In this way, we double checked previous results for IDM halo concentrations where a NFW profile was assumed. At late times, interacting DM models become (effectively) non-collisional for the cross-section studied here, in the same way that the free-streaming in WDM models becomes negligible at low redshifts. Therefore, the observed lower IDM concentration values at small halo masses also originate from the later collapse of DM halos in these models.

4.2. Subhalo Concentrations

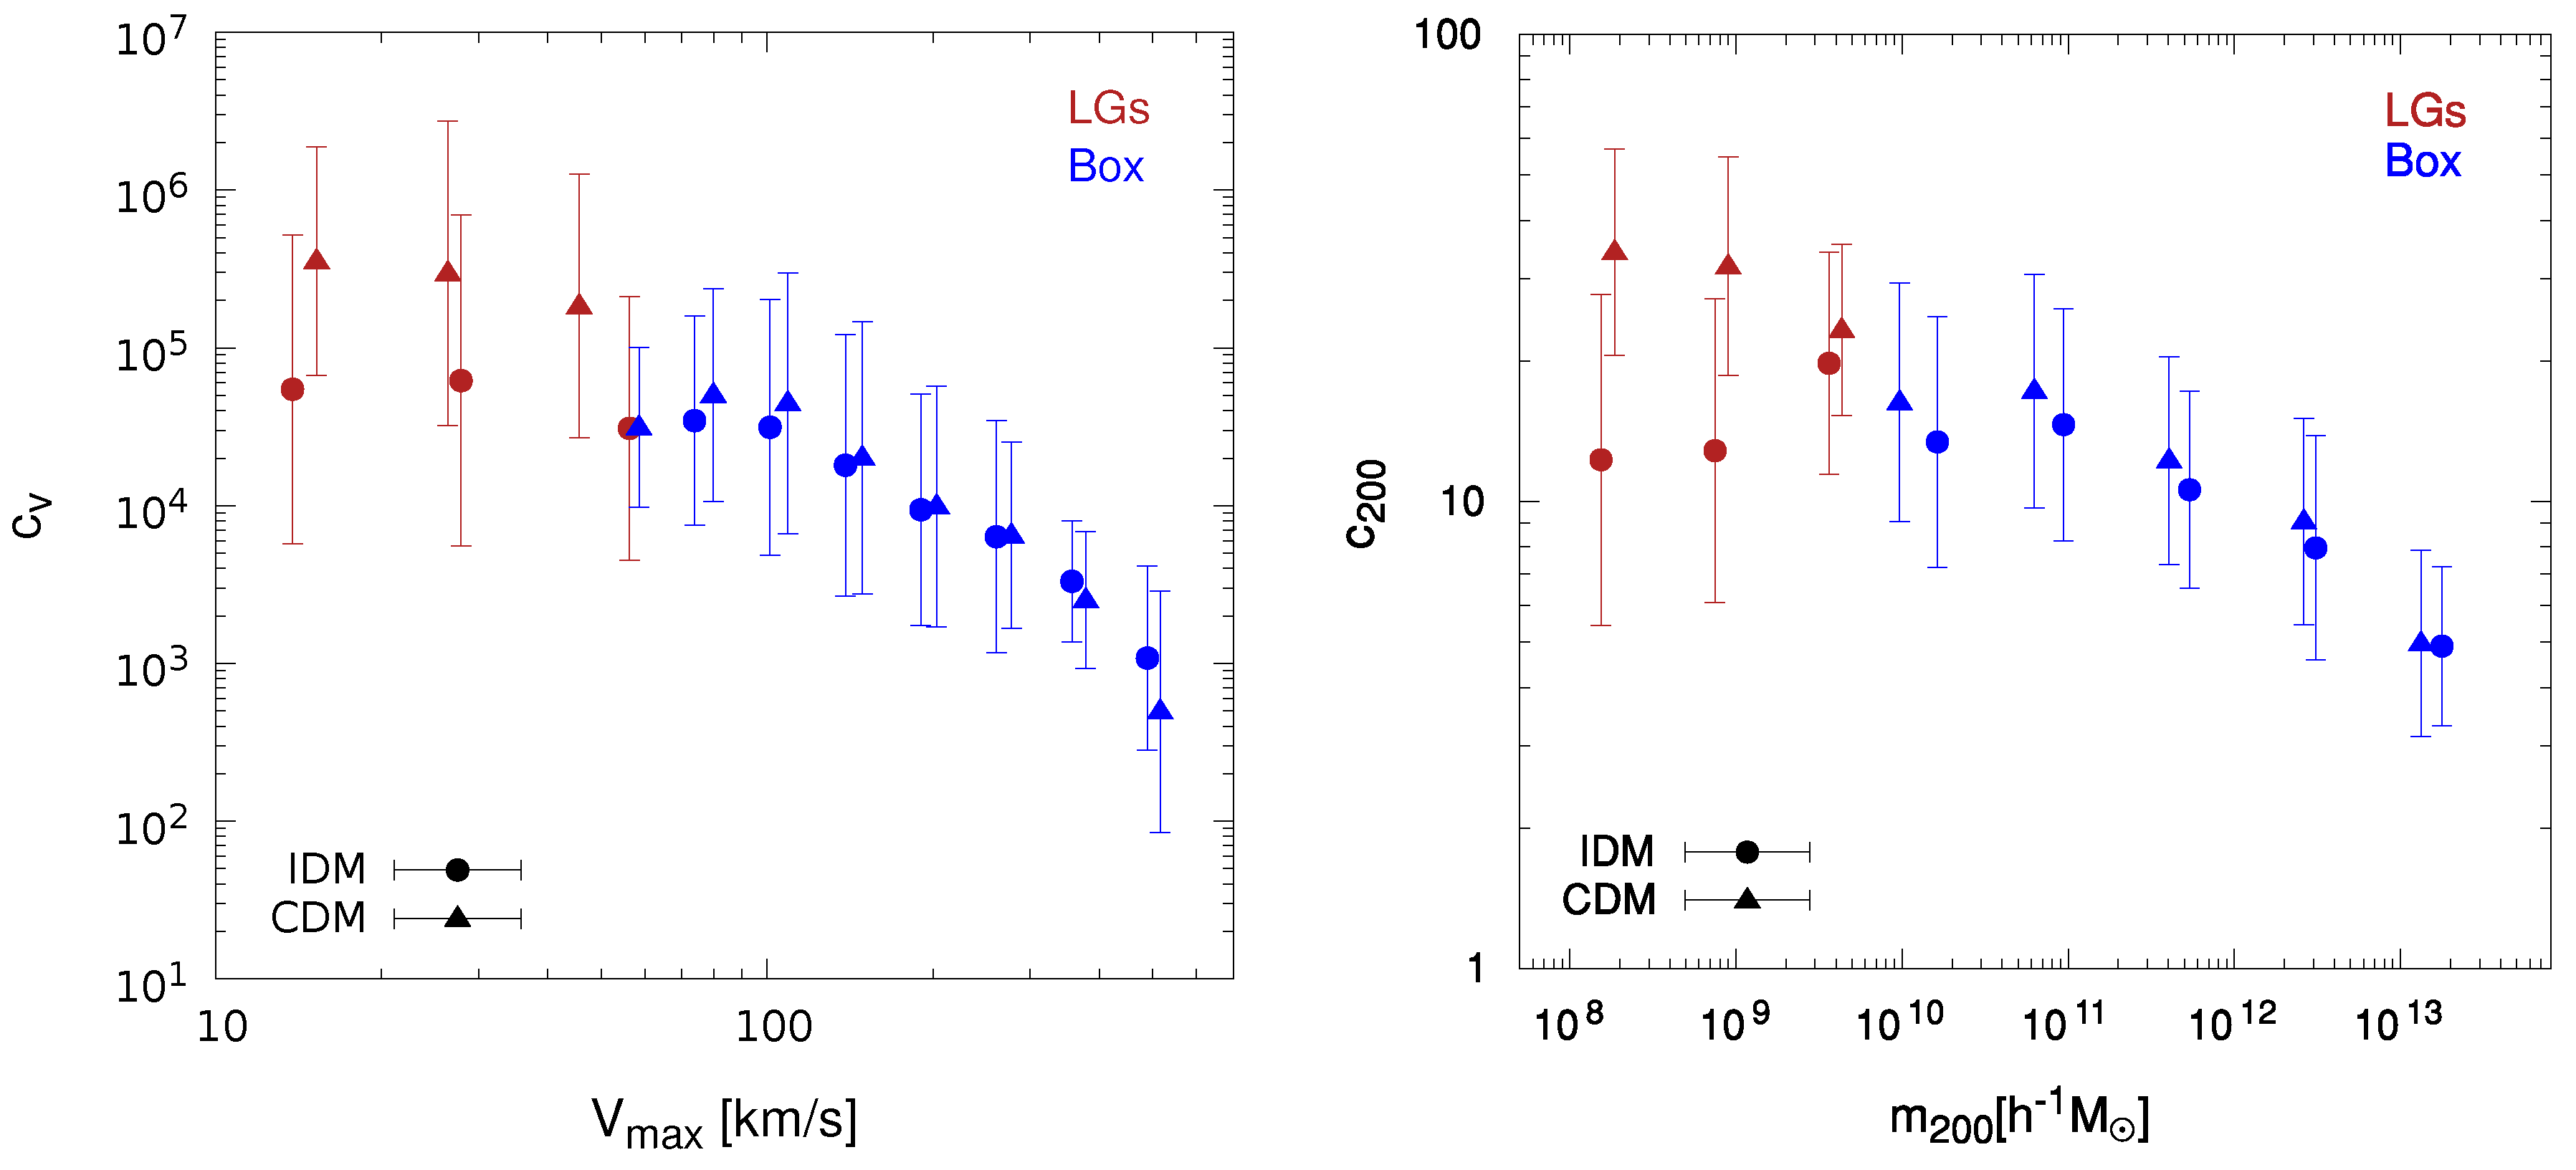
The same analysis in V max and subhalo mass, m 200 , bins was performed for c V and c 200 subhalo concentrations, respectively. In this case for Box, eight bins were considered to cover the V max range and five for m 200 . We applied a restriction on subhalo maximum circular velocity such that only subhalos with V max > 60 km/s were included; for the LGs, this restriction was set at V max > 10 km/s considering just three bins for both V max and m 200 in order to obtain the median concentration values with good subhalo statistics. From the results of Box and LG simulations together, the V max range covered was 10 < V max < 500 km/s in each cosmology.
In the left panel of Figure 2, we depict median c V ( V max ) values and corresponding 1 σ errors as found in Box (blue) and the four LGs (red). The right panel shows the results for c 200 ( m 200 ) . As in Figure 1, we also include the corresponding CDM concentrations. As can be seen, the medians of c V ( c 200 ) in both cosmologies were similar for V max > 60 km/s ( m 200 > 2 × 10 9 M /h), while there was a significant departure between them at lower V max ( m 200 ) values. Unfortunately, the simulations had a limited mass resolution and subhalo statistics in that range, which translated into large 1 σ errors, and as a consequence, our results were not conclusive. Yet, they provided a consistent picture of the subhalos’ concentration behaviour at small V max ( m 200 ) values, IDM subhalos exhibiting lower concentrations than CDM subhalos in the mentioned V max < 60 km/s range.
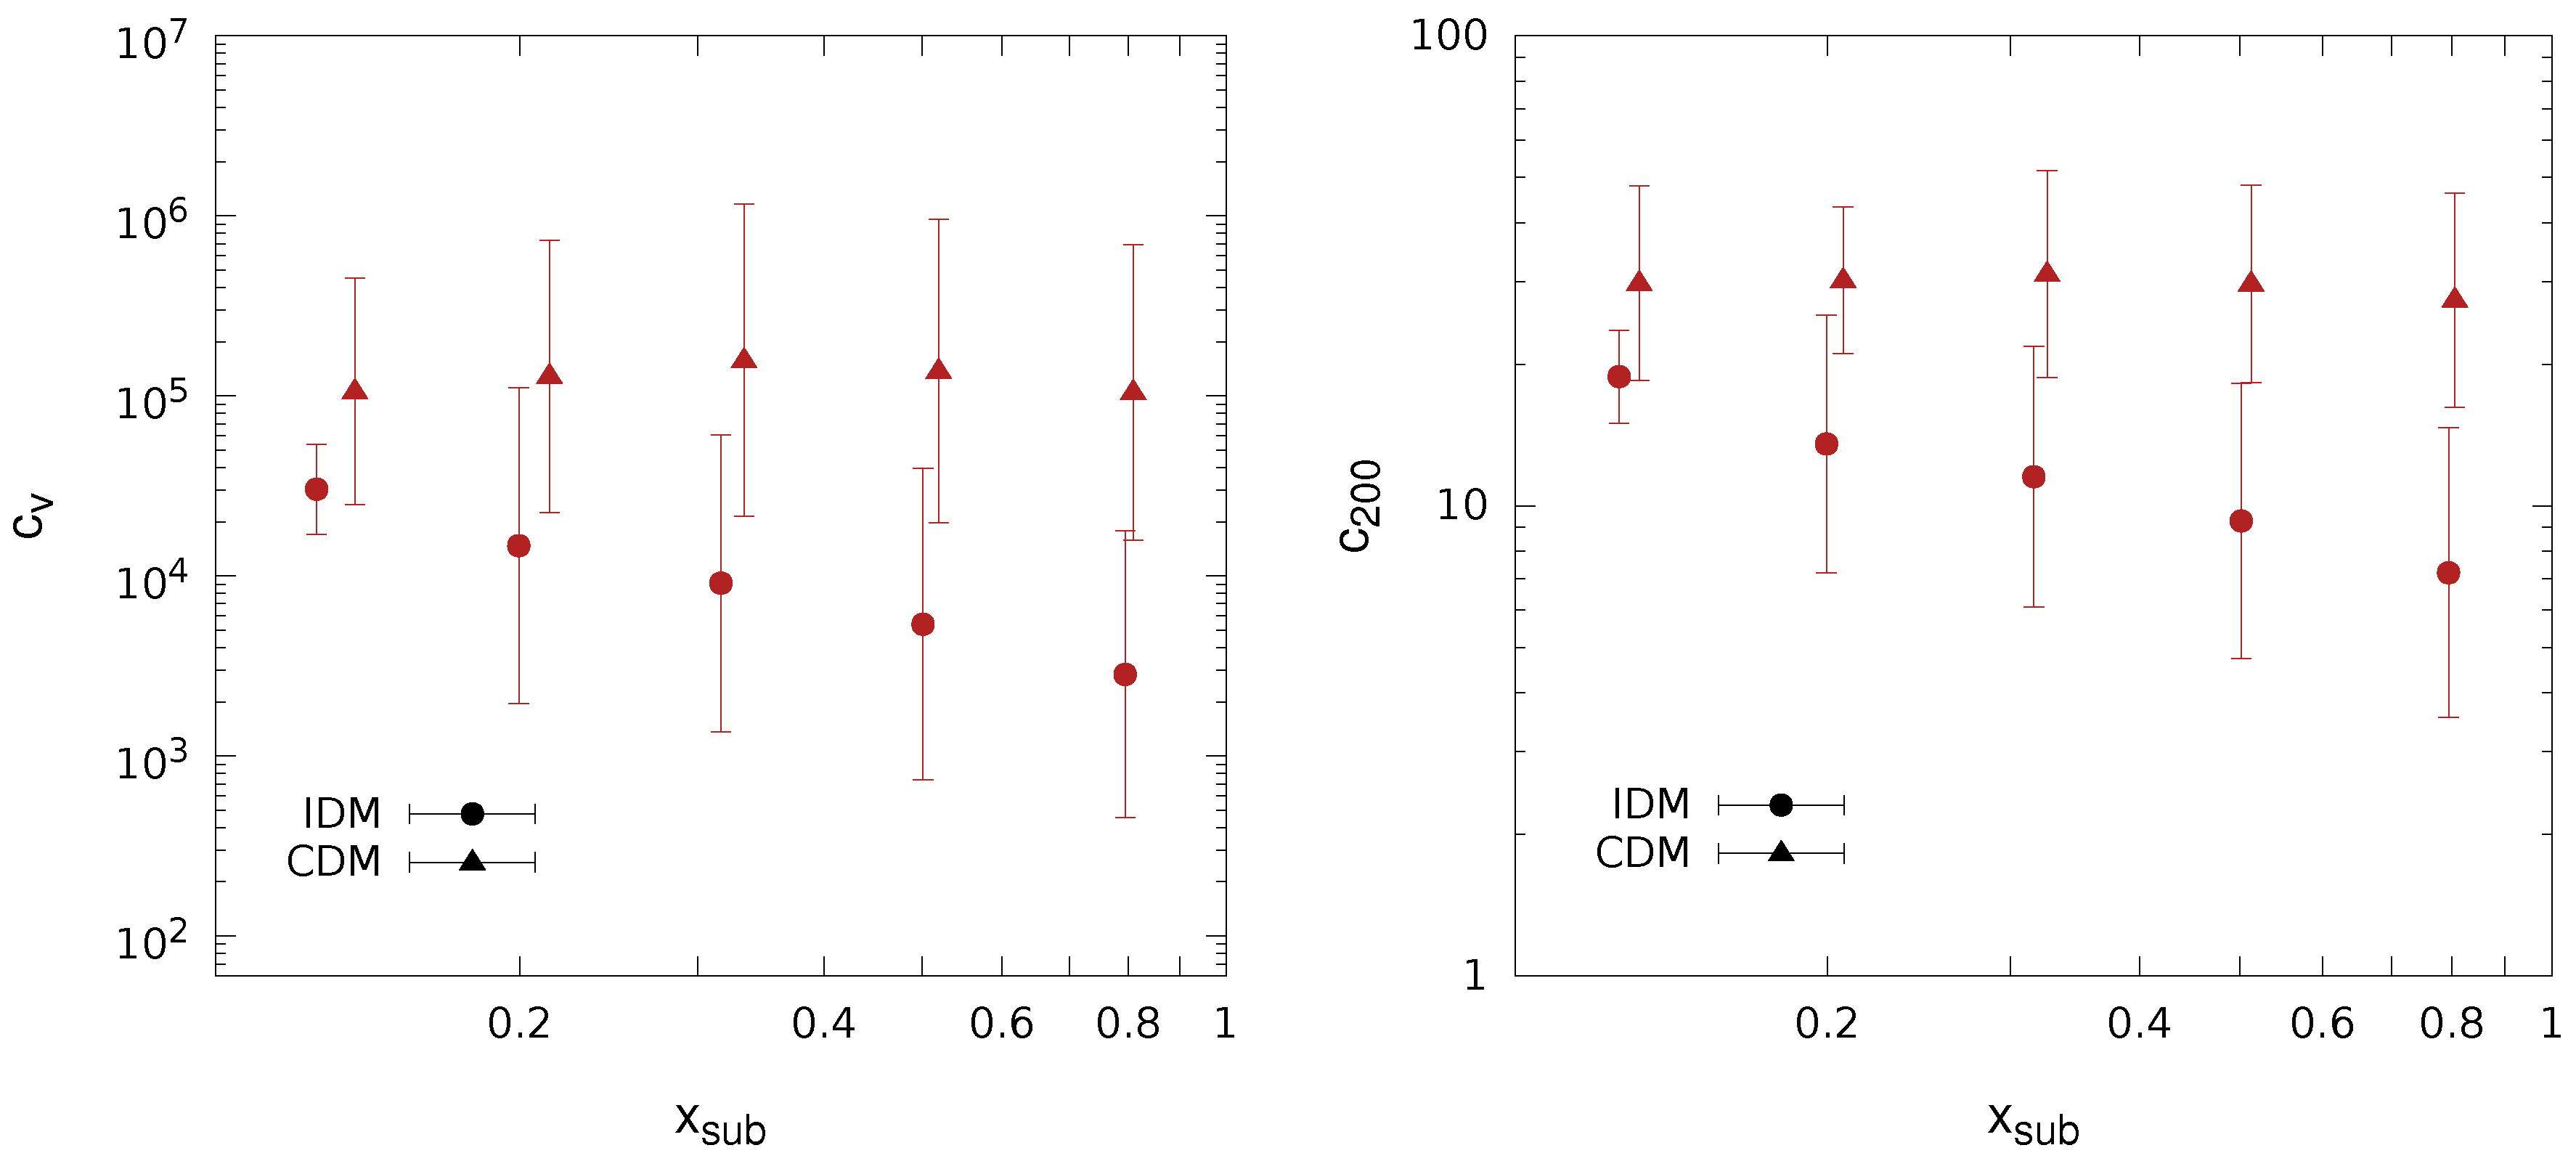
Assuming a CDM framework, previous works have shown that the subhalo concentration depends not only on the mass of the subhalo, but also on the distance to the centre of its host halo [49,60,65]. In order to know if the same behaviour is found for IDM subhalos, Figure 3 depicts, for the LGs, the medians and 1 σ errors of c V (left panel) and c 200 (right panel) as a function of the distance from the host halo centre in units of R 200 . As before, we also include in the figure our results for the CDM case, which were in good agreement with the previous ones presented in [49]. The median IDM subhalo concentration increased towards the centre of the host halo more significantly than in the CDM case. Yet, for each considered radial bin, IDM concentrations were significantly and consistently lower than CDM ones. Such effects could be understood by studying in detail the properties of both CDM and IDM subhalos at infall. This study is beyond the scope of this paper and will be presented elsewhere. Again, large error bars prevented us from extracting firm conclusions, and thus, we will not propose any parametric fits to the data in this paper. However, this is an interesting qualitative result that points to a significantly different distribution of subhalo concentrations inside the host halo in the IDM scenario compared to CDM.
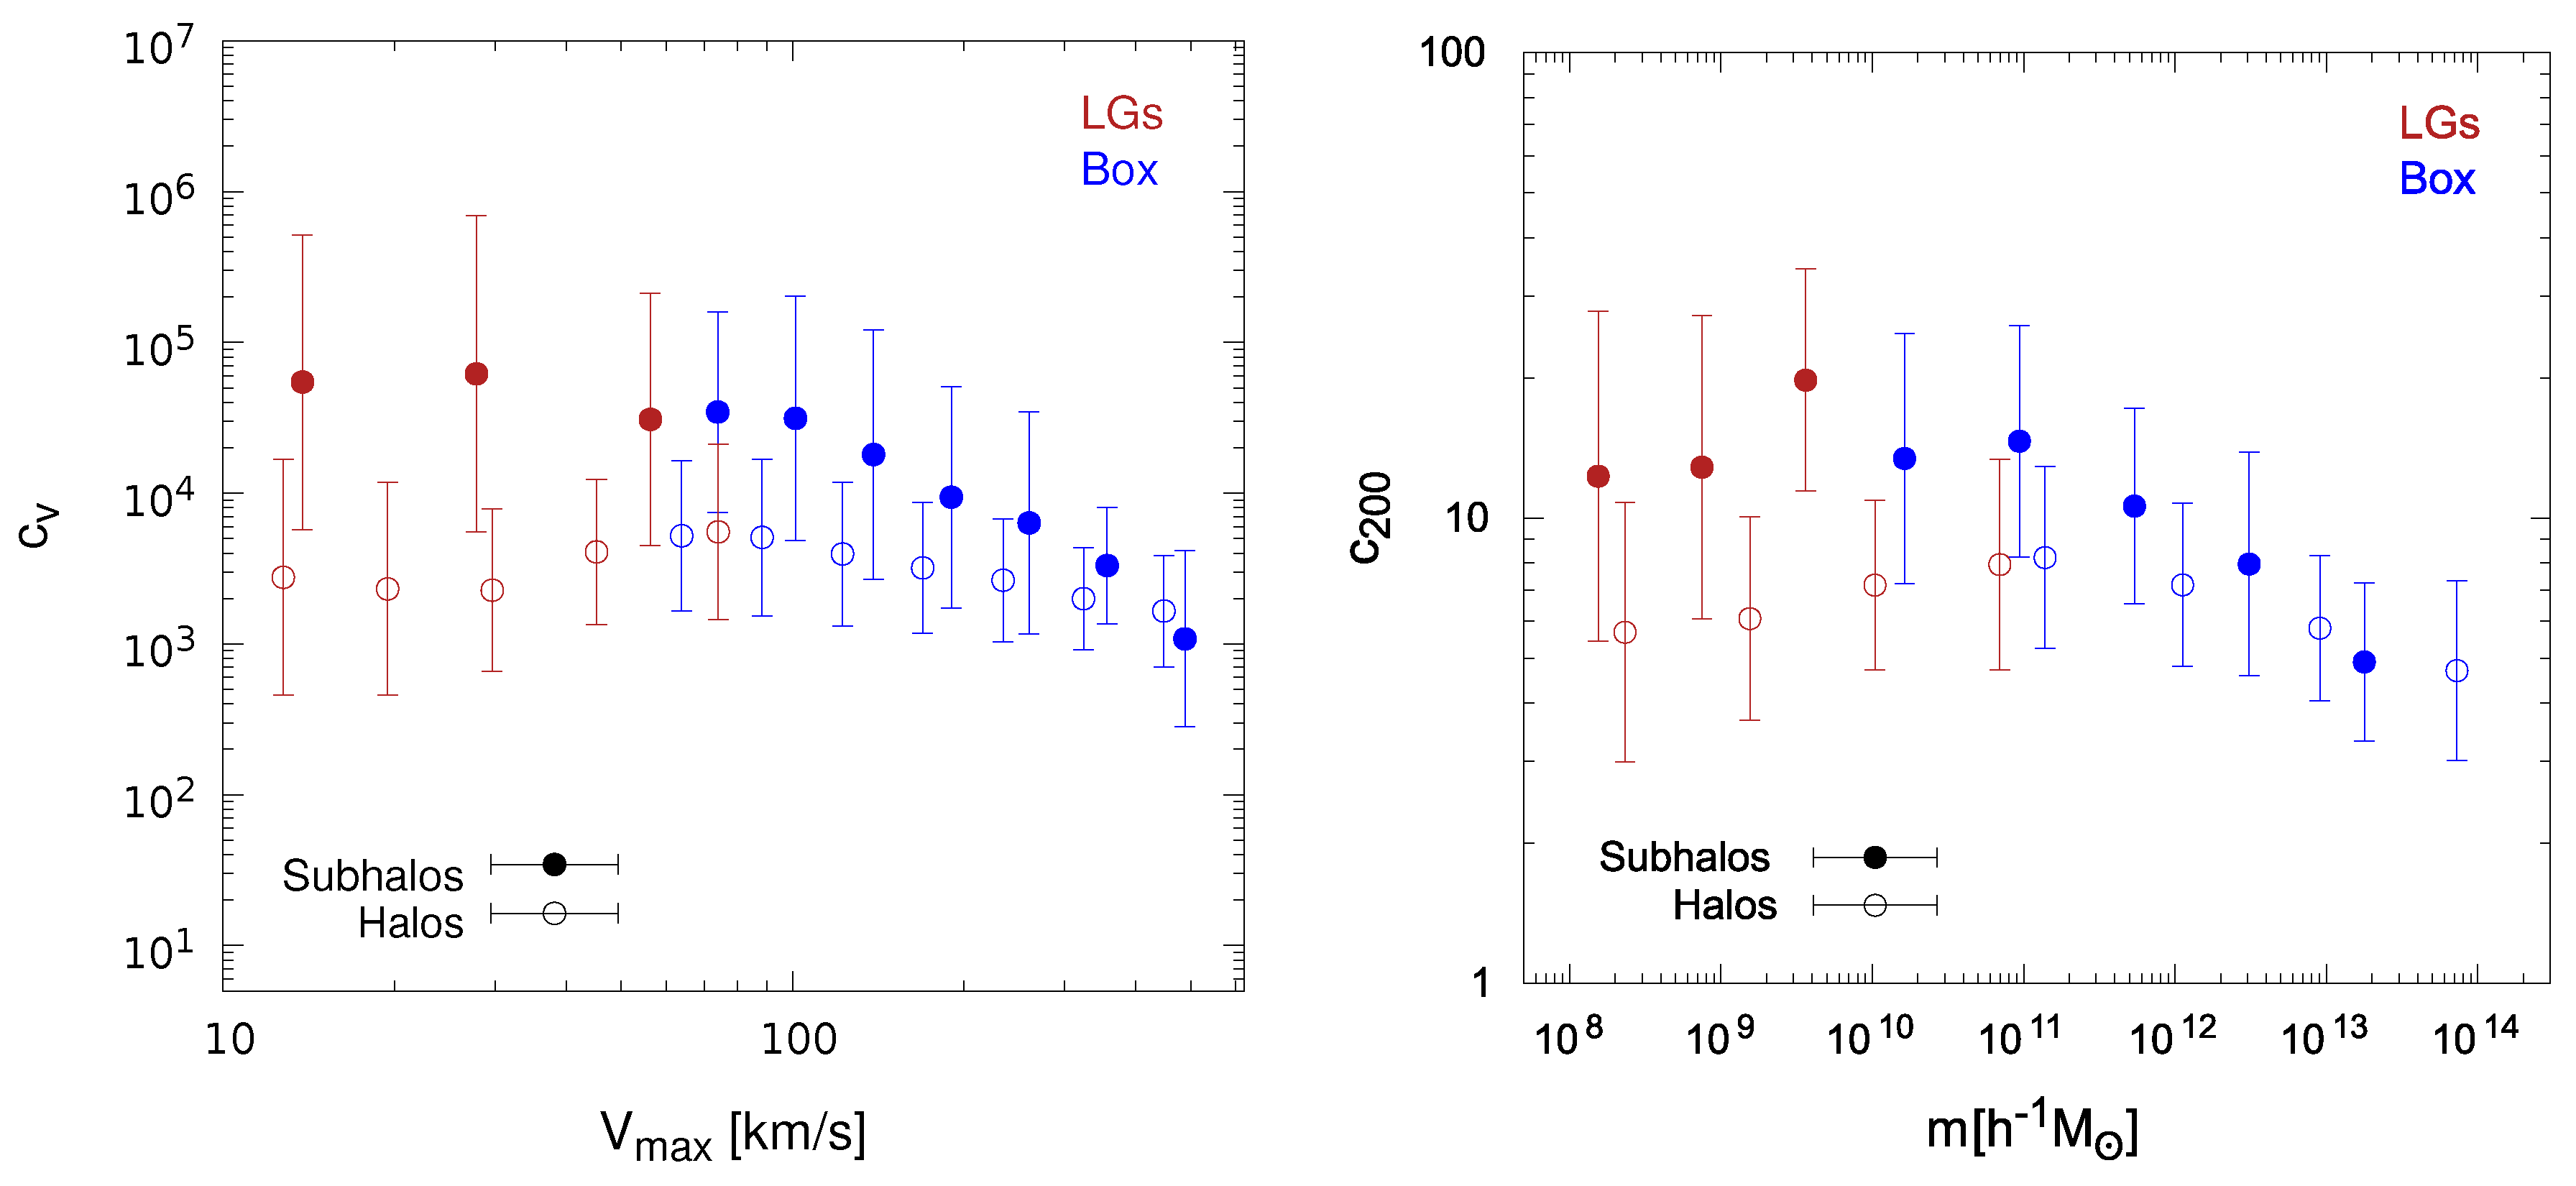
In the standard CDM cosmological framework, it is well established from simulations that subhalos are more concentrated than field halos of the same mass [9,45,49,60,65,66,67,68,69]. It might not be the case in the IDM model; indeed, the mean subhalo concentration values (see Figure 2) fell within the values of halo concentrations studied in previous works for CDM. However, from Figure 1, we see that the IDM halos exhibited lower concentrations compared with the halo concentrations in CDM of the same mass, and then, differences were expected between the concentrations of subhalos and their hosts in the interacting models. In Figure 4, we shape such differences between halos and subhalos in the IDM scenario by comparing their median c V ( c 200 ) values and 1 σ errors as a function of V max ( m 200 ) as found in our set of simulations. Analogously to what occurs in CDM, we obtained that also in IDM models, subhalos with mass m 200 < 10 11 M /h tended to be more concentrated than their host halos. As in the previous cases above, a more quantitative statement about the observed trend is nevertheless not possible for the moment, given the relatively large uncertainties involved in our study.

4.3. Subhalo Abundances

As mentioned, DM interactions lead to a matter power spectrum different from the one in CDM. This matter power spectrum features a cut-off around a smooth scale of 100 kpc and therefore a suppression of the number of halos in the lower mass range. The impact of such an IDM initial matter power spectrum on the abundance of halos was studied in [34,50], where a comparison with the standard CDM result was also presented. A suppression of the number of low-mass halos with masses below M 200 10 11 h 1 M was found, which became particularly significant at the smallest considered halo masses. In this section, we will complement these previous studies by using our set of IDM simulations to obtain the first results for subhalo abundances. We will do so in a broad subhalo mass range, i.e., [ 2 × 10 6 , 10 12 ] M / h .
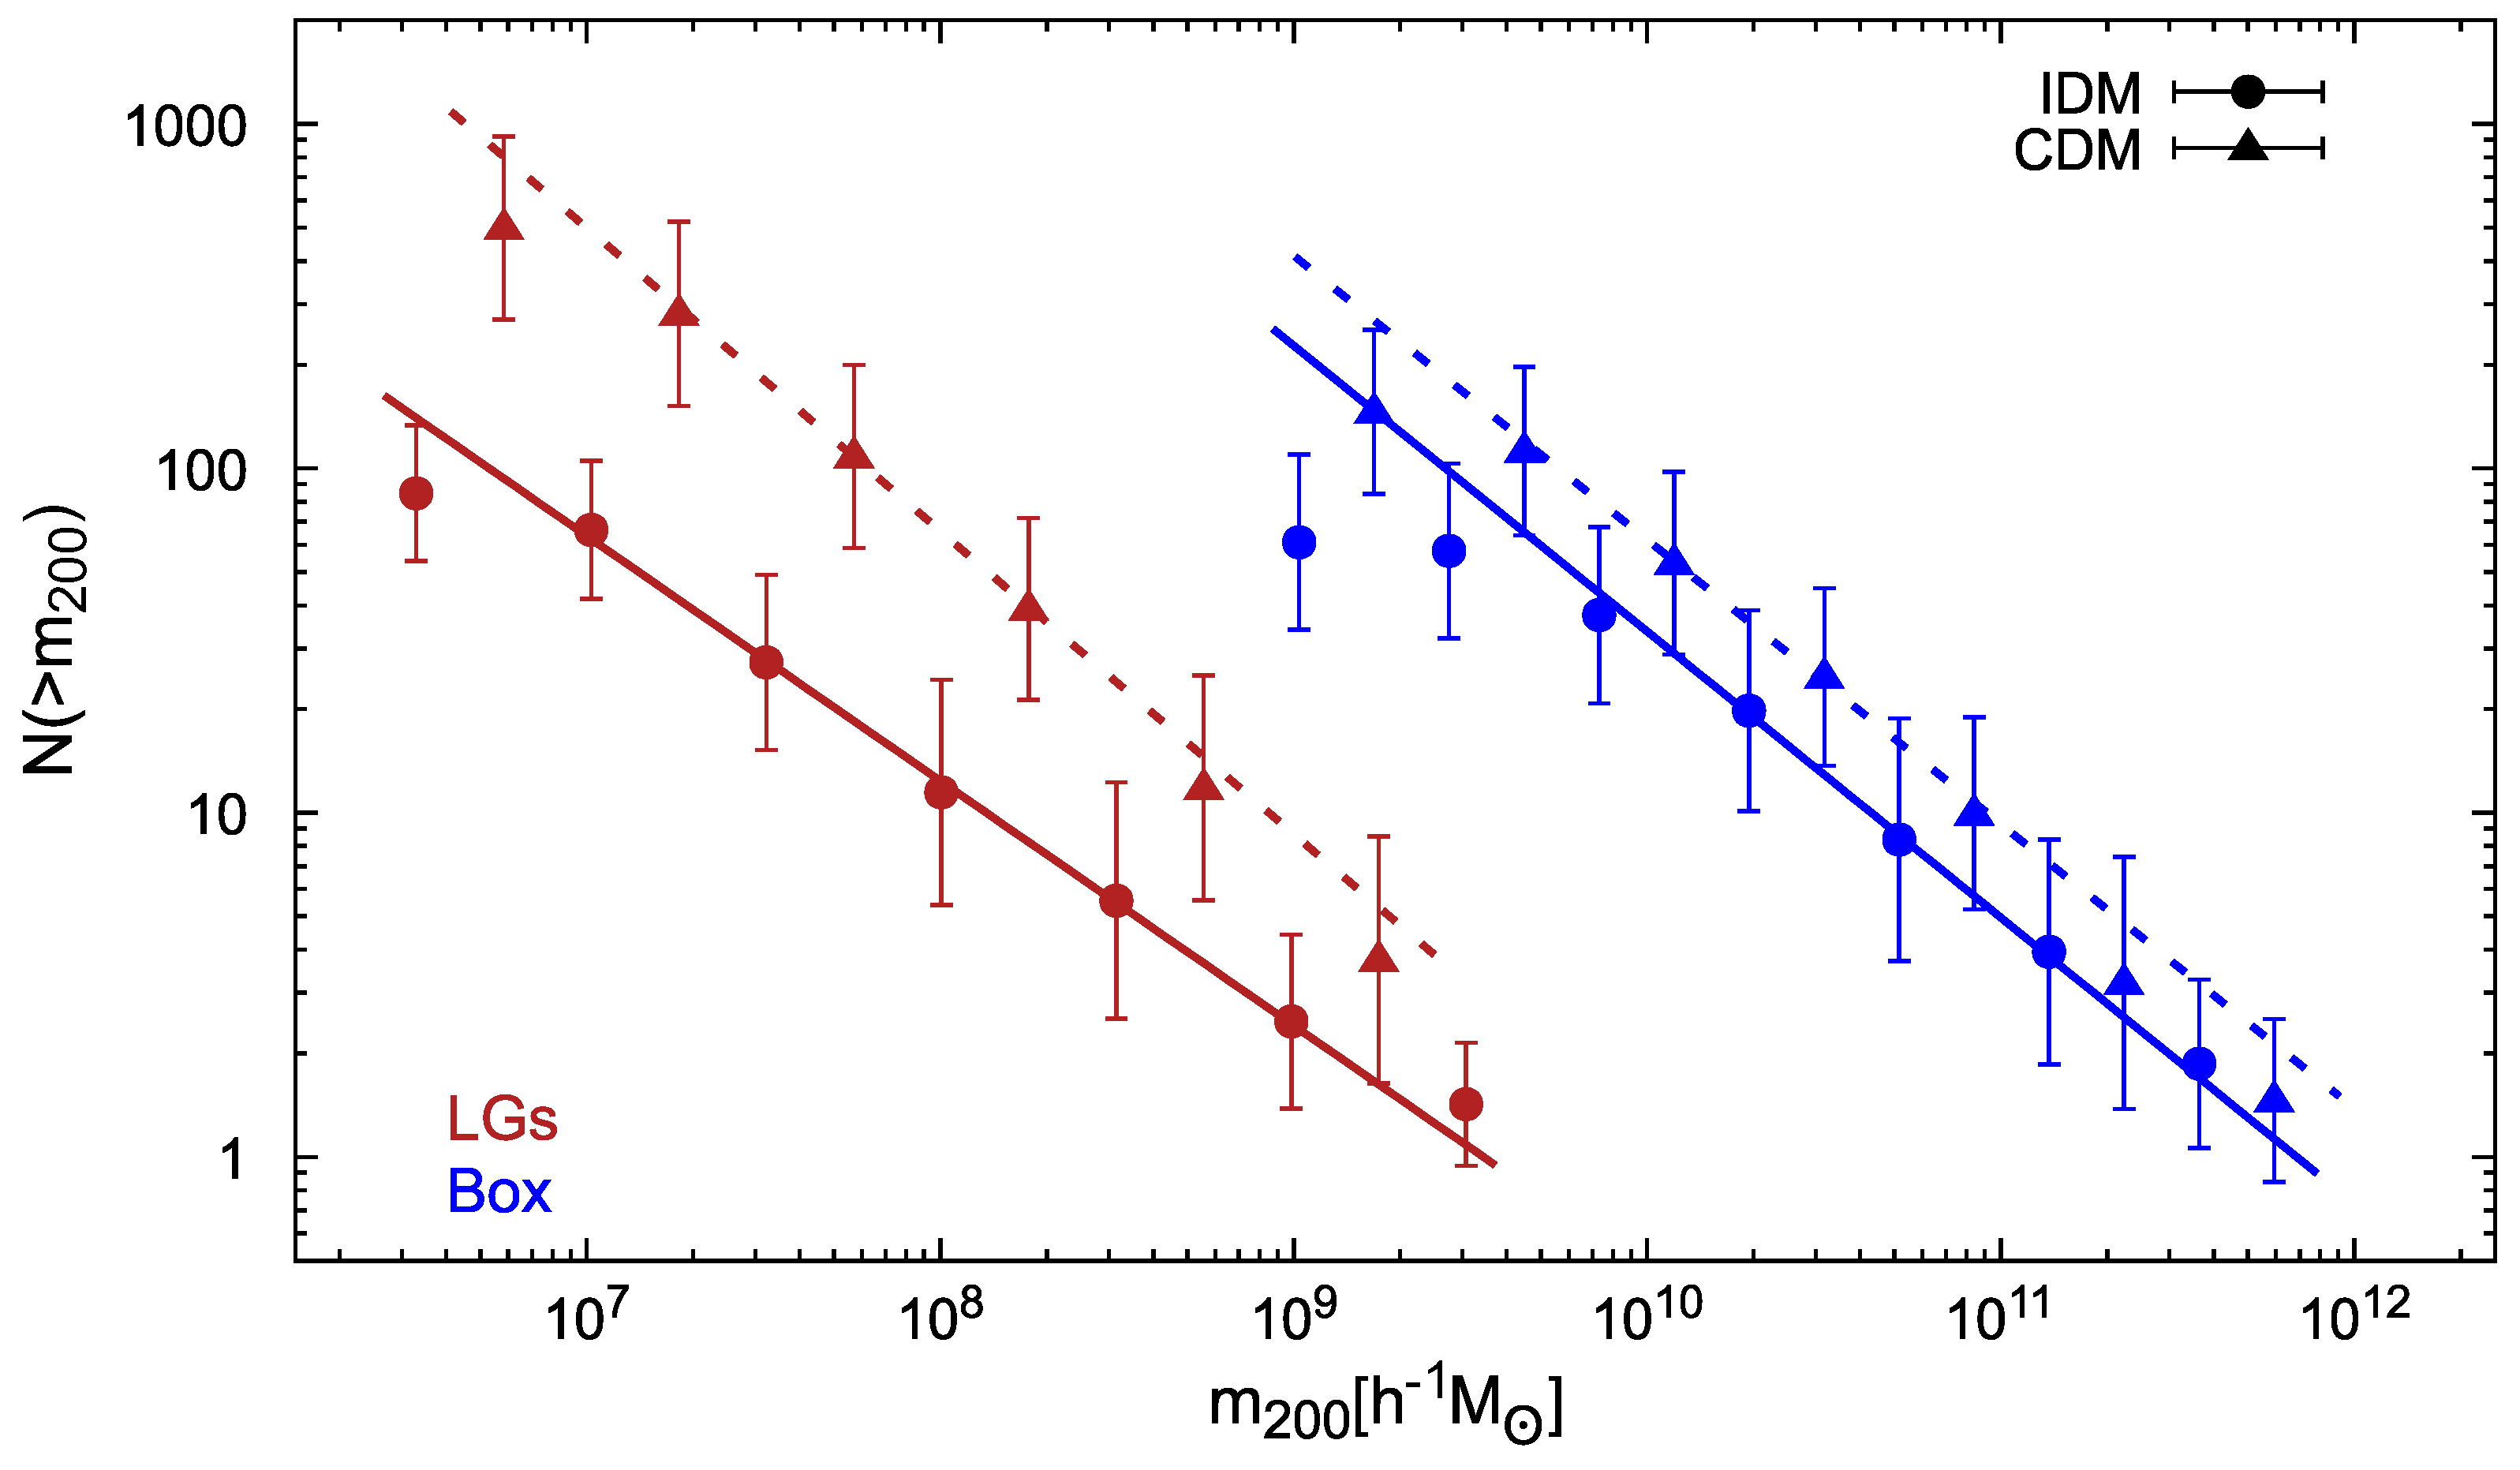
In Figure 5, we show the cumulative number of subhalos, N ( > m 200 ) , as a function of subhalo mass, m 200 , for both IDM and CDM scenarios and for both Box and LGs. Then, we consider all subhalos residing in halos with M h > 3 × 10 13 M / h for Box and 3 × 10 11 M / h < M h < 1 . 4 × 10 12 M / h for LGs. These ranges allow us to have more than 30 subhalos per host in both cosmologies and both simulation sets. For each halo, we calculate the cumulative number of subhalos by adopting 100 subhalo mass bins and by finding the mean for each subhalo mass bin over all the main halos in the corresponding simulation. In the same Figure 5, we also show in solid lines the result of fitting the data with the following parametric expression:
N ( > m 200 ) = β m 200 γ
This fitting function follows previous works that calculated the cumulative subhalo mass function from N-body cosmological simulations and where the subhalo mass function was found to obey a power law d N / d m m 200 α . [59]. Both the normalization factor, β , and the slopes, γ = α + 1 , will depend on the adopted cosmological model. In Table 2, we report the best-fit values we found in our simulations for γ and β , both for the CDM and IDM scenarios. Using the LG data, the fits worked well for the subhalo mass range [ 0.59 , 3.39 ] × 10 10 M / h and [ 1.19 , 9.66 ] × 10 10 M / h for Box, in both cosmological models.
As can be seen in Figure 5 and in Table 2, in the case of the LGs, the normalization of the cumulative subhalo mass function in the IDM case was significantly lower than that of CDM subhalos. More precisely, we found that mean N ( > m 200 ) values for IDM subhalos were almost a factor 10 lower than those of CDM for subhalos in the range 10 7 M / h < m 200 < 10 8 M / h , this factor decreasing towards large subhalo masses. In Box, which covers comparatively larger halo masses, the differences among the two considered cosmologies were not statistically significant any more. Indeed, all these results were as expected. As discussed above, the particular differences between the IDM and CDM initial matter power spectra led to a suppression of smaller structures in the former case with respect to the latter, an effect that must become more evident in the LGs compared to Box, as the former simulations resolved smaller subhalo masses.
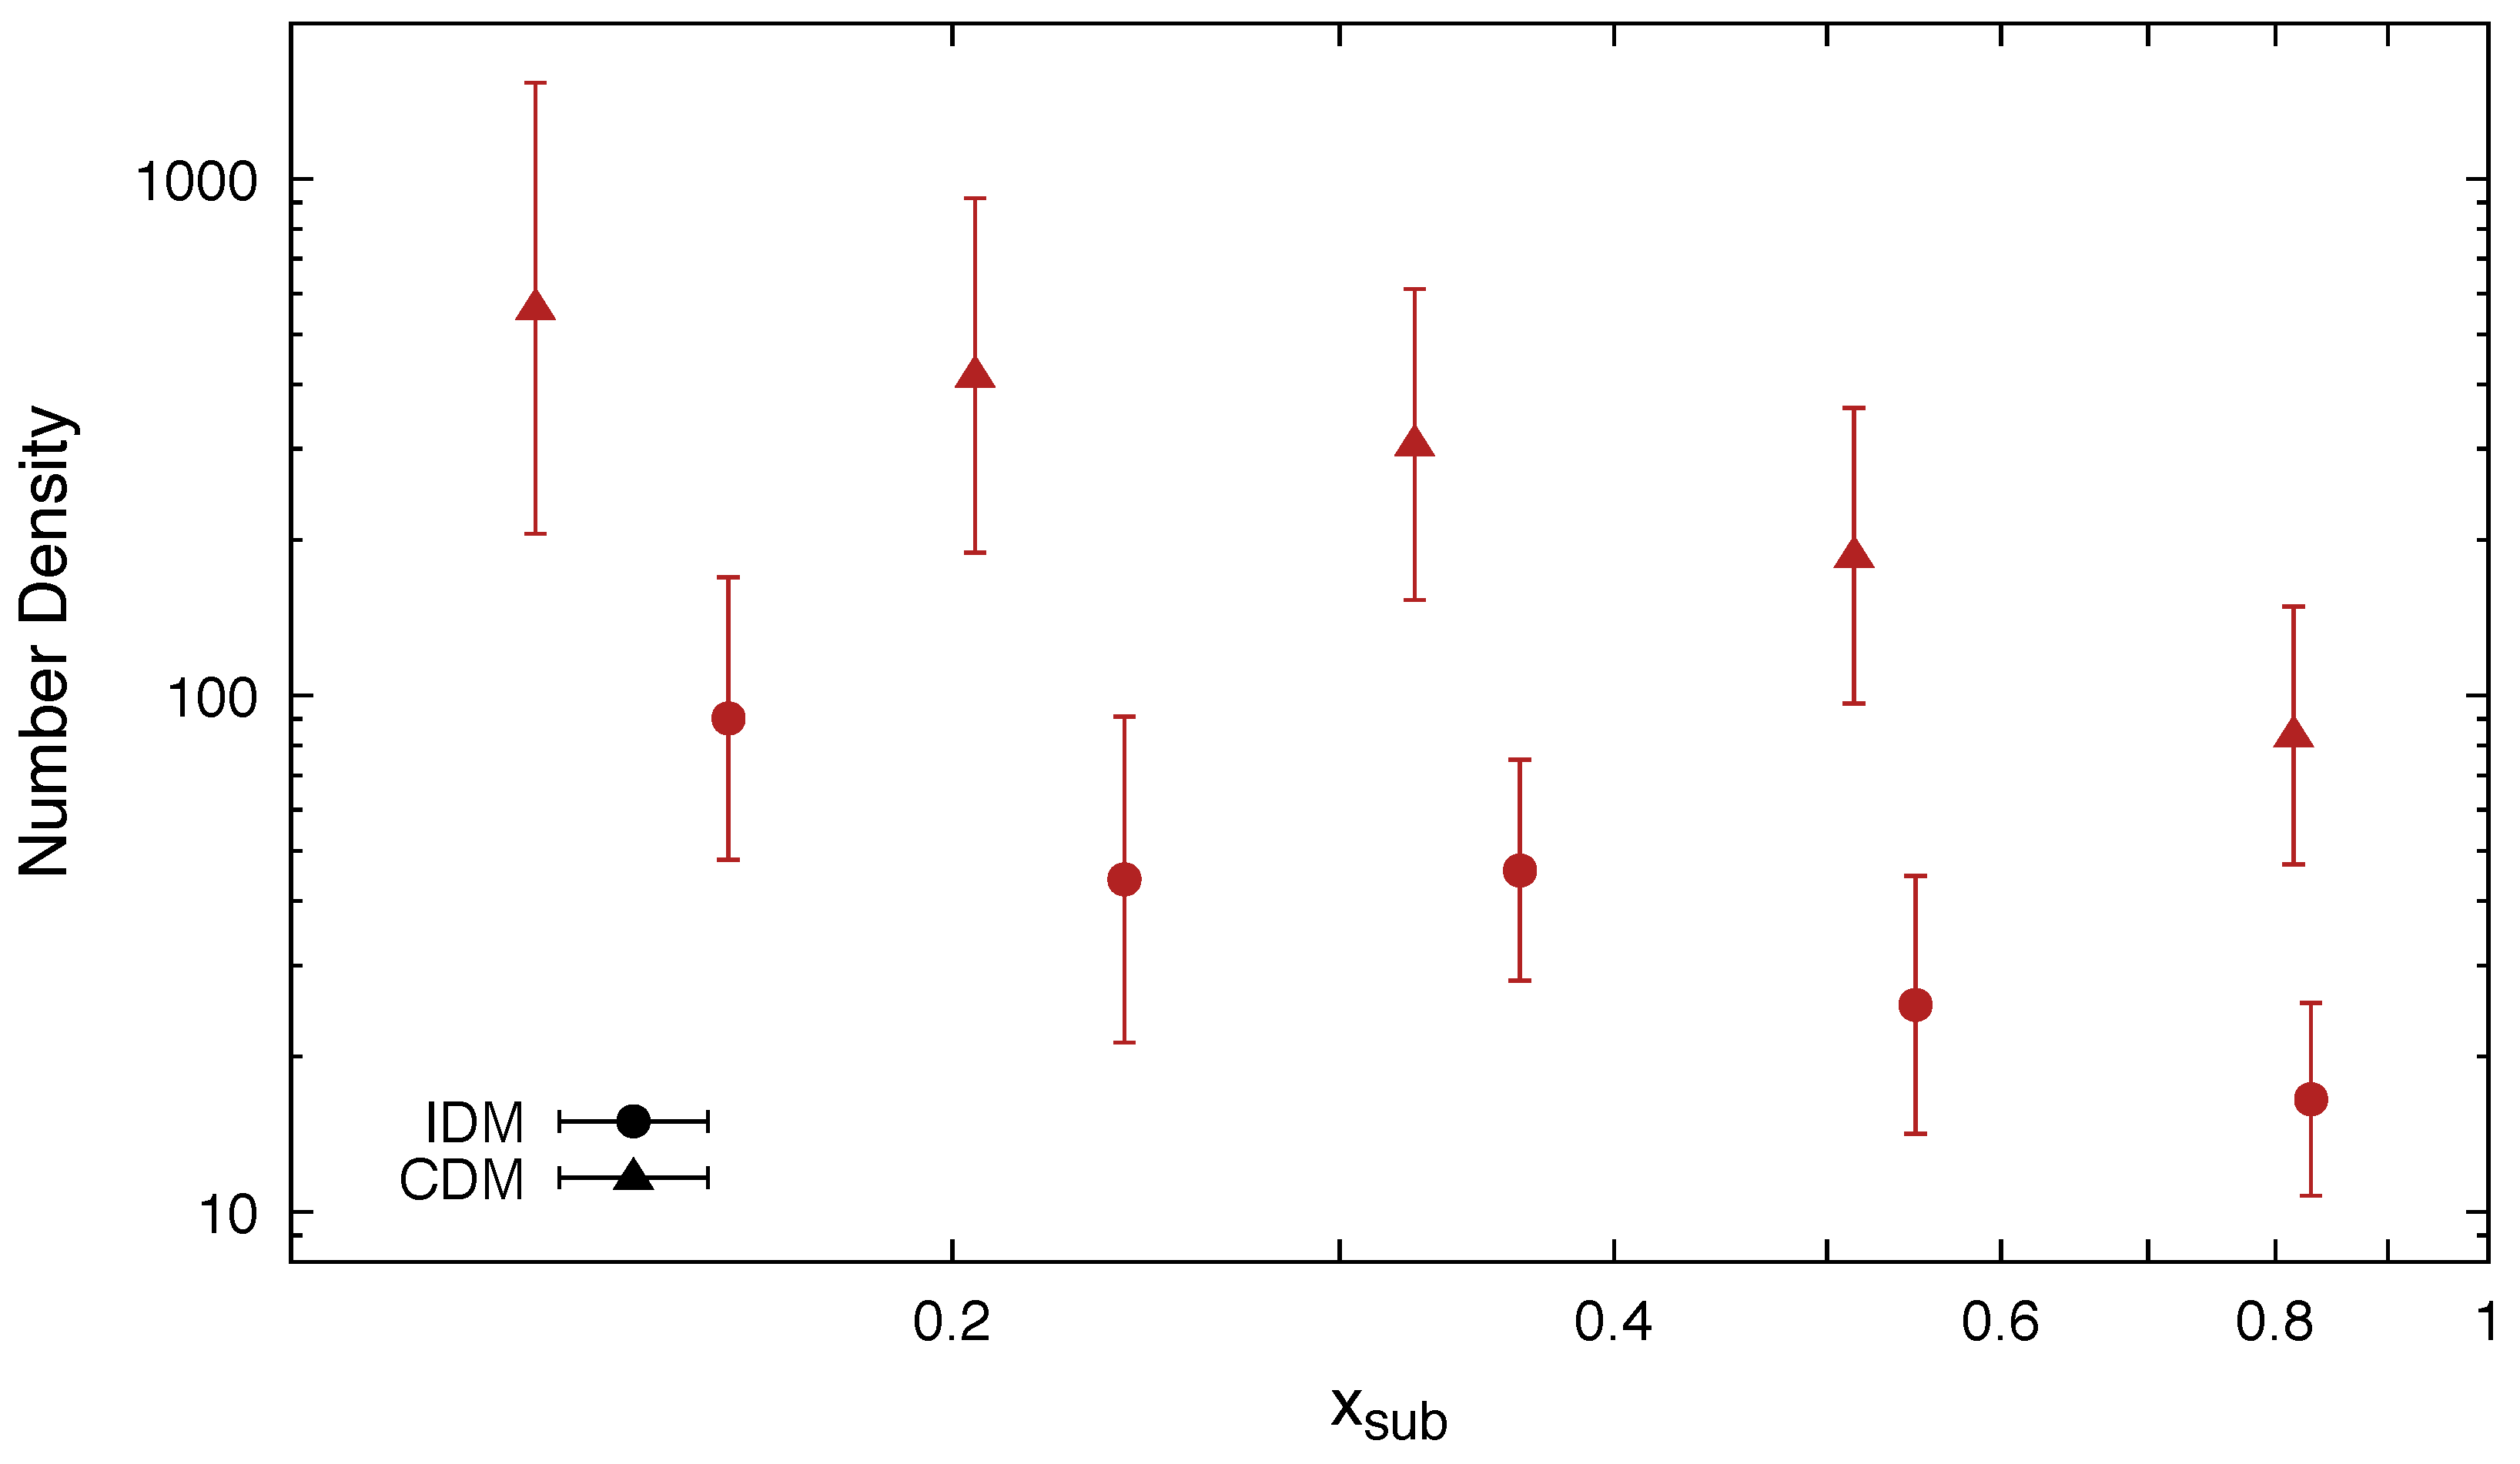
Finally, we also studied the radial dependence of the number of subhalos in the IDM case and compared it to the more standard CDM subhalo radial distribution. We did so only for the LGs, since high-resolution simulations are necessary to perform this kind of analysis. Indeed, we checked that the statistics in the Box simulation was not sufficient to perform the work properly. Figure 6 depicts mean values and corresponding 1 σ errors of the number density as a function of the distance from the centre of the host halo (in units of its R 200 ) for halos with [0.5–1] × 10 12 M / h . As can be seen, the radial number density of IDM subhalos increased towards the centre of the host halo as in the CDM case, but is significantly lower than the latter at all host radii.

5. Summary and Discussion

We investigated DM subhalo properties in models where the linear matter power spectrum is suppressed at small scales due to DM interactions with radiation (photons or neutrinos). We did so by making use of N-body cosmological simulations, which are known to be a crucial tool to study the properties of DM structures. More precisely, we used data from our own set of simulations, described in Section 3. The runs were performed in both the standard CDM paradigm and in the IDM scenario, where the latter assumed interactions of DM with photons.2 This allowed us to compare DM halo and subhalo properties as found in both cosmologies. Since the main impact of the DM-photon interactions on structure formation occurs mainly at small scales, we used data not only from a large simulation box (100 Mpc), but also high-resolution zoom-in simulations of four local groups.
First, in Section 4.1 and Section 4.2, we studied, respectively, halo and subhalo concentrations as a function of halo/subhalo mass (and, alternatively, V max ). Both for halos and subhalos, we observed a significant reduction of the concentrations in the lower mass range (or, alternatively, small V max values). Our result for halos confirmed the findings of previous works, e.g., [34,50], while this was the first time that the concentration of IDM subhalos was studied. This decrease of concentration values was expected and originated from the later collapse of low-mass DM halos and subhalos in IDM cosmologies, similarly to that observed in WDM simulations [64].
In Section 4.2, we studied subhalo concentrations as a function of the subhalo distance to the host halo centre. As in the CDM framework, we found that the median subhalo concentration values increased towards the innermost regions of the host for subhalos of the same mass. Yet, we obtained significantly lower median concentrations in the IDM case with respect to CDM at all radii (see Figure 3). Limitations in the number of subhalos prevented us from quantifying this effect more in detail; thus, it seemed robust to present in our data clearly. New N-body cosmological simulations with improved resolution will be needed in order to perform a more exhaustive analysis in this direction.
In addition, when comparing our results for IDM halos and subhalos of the same mass, we concluded that in these IDM models, the subhalos were more concentrated than field halos (see Figure 4), similarly to what has been found for CDM, e.g., [49].
Finally, we also presented in Section 4.3 our results for subhalos abundances as a function of the distance to the host halo centre and subhalo mass. Our results were in agreement with expectations for IDM models, namely we found a significantly smaller number of subhalos in IDM with respect to that observed in our CDM simulations. However, not only the normalization of the cumulative subhalo mass function decreased (up to a factor ∼10 at the smallest resolved subhalo scales), also its slope was substantially lower in IDM ( γ = 0.71 versus γ = 0.88 for CDM in the approximated range 10 7 M / h < m 200 < 10 9 M / h ; see Figure 5 and Table 2). As expected from theory, these differences among both cosmologies were not observed in the larger Box simulation. The radial distribution of subhalos within host halos exhibited a similar trend: there were fewer subhalos in IDM compared to CDM. Yet, we did not find appreciable differences in behaviour, i.e., the functional form of both radial distributions was similar.
In addition to the obvious interest in structure formation and the study of halo and subhalo properties, we note that our work has a direct application to studies aimed at the indirect detection of DM, namely the detection of the annihilation or decay products of DM particles. For instance, the extragalactic γ -ray and neutrino emission due DM annihilations depends mainly on the DM halos and subhalo properties (see, e.g., [45,46,48,49]). Another example is the so-called subhalo boost: subhalos are expected to boost the DM signal of their host halos significantly, e.g., [47,49]. This subhalo boost is very sensitive to the details of both subhalo concentration and subhalo abundance. Overall, from our results, we conclude that the role of halo substructure in DM searches will be less important in IDM scenarios than in CDM, given the fact that both the subhalo concentrations and abundances are lower in the former compared to the latter. Yet, it will not be negligible, as we also found in our IDM simulations larger concentrations for subhalos with respect to field halos of the same mass. Although this work represents an important step in addressing this and related issues, a quantitative study of the precise role of IDM subhalos for DM searches is left for future work: the IDM cosmological model mainly impacts low mass structures; thus, it will be necessary to have higher resolution simulations than those used in this work in order to do so. Likewise, for a full analysis of IDM halo and subhalo properties, it will be also necessary to run IDM simulations adopting other values of the cross-section of DM interactions.

Author Contributions

Conceptualization, Á.M.; Data curation, Á.M., J.A.S., A.A.-S. and S.A.C.; Formal analysis, Á.M.; Funding acquisition, M.A.S.-C. and S.A.C.; Investigation, Á.M., J.A.S., A.A.-S. and M.G.A.; Methodology, Á.M. and M.A.S.-C.; Project administration, Á.M.; Resources, J.A.S.; Software, J.A.S.; Supervision, Á.M. and M.A.S.-C.; Validation, Á.M.; Writing—original draft, Á.M.; Writing—review & editing, J.A.S., M.A.S.-C. and M.G.A.

Funding

A.M., A.A.-S., and M.A.S.-C. are supported by the Atracción de Talento Contract No. 2016-T1/TIC-1542 granted by the Comunidad de Madrid in Spain. They also acknowledge the support of the Spanish Agencia Estatal de Investigación through the grants PGC2018-095161-B-I00, IFT Centro de Excelencia Severo Ochoa SEV-2016-0597, and Red Consolider MultiDark FPA2017-90566-REDC. A.M. also thanks the Institute of Astrophysics and Space Sciences of Portugal, where part of this work was done and the partial support of the RAICES Argentinian program. We made use of the DiRACData Centric system at Durham University, operated by the ICC on behalf of the STFCDiRAC HPC Facility (www.dirac.ac.uk). This equipment was funded by BIS National E-infrastructure Capital Grant ST/K00042X/1, STFCCapital Grant ST/H008519/1, STFC DiRAC Operations Grant ST/K003267/1, and Durham University. DiRAC is part of the National E-Infrastructure. Furthermore, numerical computations were also done on the Sciama High Performance Compute (HPC) cluster, which is supported by the ICG, SEPNet, and the University of Portsmouth. SAC acknowledges funding from Consejo Nacional de Investigaciones Científicas y Técnicas (CONICET, PIP-0387), Agencia Nacional de Promoción Científica y Tecnológica (ANPCyT, PICT-2013-0317), and Universidad Nacional de La Plata (G11-124; G11-150), Argentina.

Conflicts of Interest

The authors declare no conflict of interest. The funders had no role in the design of the study; in the collection, analyses, or interpretation of data; in the writing of the manuscript, or in the decision to publish the results.

References

  1. Aghanim, N.; Akrami, Y.; Ashdown, M.; Aumont, J.; Baccigalupi, C.; Ballardini, M.; Banday, A.J.; Barreiro, R.B.; Bartolo, N.; Basak, S.; et al. Planck 2018 results. VI. Cosmological parameters. arXiv 2018, arXiv:astro-ph.CO/1807.06209. [Google Scholar]
  2. Frenk, C.S.; White, S.D.M. Dark matter and cosmic structure. Ann. Phys. 2012, 524, 507–534. [Google Scholar] [CrossRef] [Green Version]
  3. Netterfield, C.B.; Ade, P.A.R.; Bock, J.J.; Bond, J.R.; Borrill, J.; Boscaleri, A.; Coble, K.; Contaldi, C.R.; Crill, B.P.; de Bernardis, P. A measurement by Boomerang of multiple peaks in the angular power spectrum of the cosmic microwave background. Astrophys. J. 2002, 571, 604–614. [Google Scholar] [CrossRef]
  4. Hinshaw, G.; Barnes, C.; Bennett, C.L.; Greason, M.R.; Halpern, M.; Hill, R.S.; Jarosik, N.; Kogut, A.; Limon, M.; Meyer, S.S.; et al. First year Wilkinson Microwave Anisotropy Probe (WMAP) observations: Data processing methods and systematic errors limits. Astrophys. J. Suppl. 2003, 148, 63. [Google Scholar] [CrossRef]
  5. Riess, A.G.; Filippenko, A.V.; Challis, P.; Clocchiatti, A.; Diercks, A.; Garnavich, P.M.; Gilliland, R.L.; Hogan, C.J.; Jha, S.; Kirshner, R.P.; et al. Observational evidence from supernovae for an accelerating universe and a cosmological constant. Astron. J. 1998, 116, 1009–1038. [Google Scholar] [CrossRef]
  6. Davis, T.M.; Mörtsell, E.; Sollerman, J.; Becker, A.C.; Blondin, S.; Challis, P.; Clocchiatti, A.; Filippenko, A.V.; Foley, R.J.; Garnavich, P.M.; et al. Scrutinizing Exotic Cosmological Models Using ESSENCE Supernova Data Combined with Other Cosmological Probes. Astrophys. J. 2007, 666, 716–725. [Google Scholar] [CrossRef]
  7. Hamuy, M. The acceleration of the Universe in the light of supernovae - The key role of the Cerro Tololo Inter-American Observatory. arXiv 2013, arXiv:astro-ph.CO/1311.5099. [Google Scholar]
  8. Klypin, A.A.; Kravtsov, A.V.; Valenzuela, O.; Prada, F. Where are the missing Galactic satellites? Astrophys. J. 1999, 522, 82–92. [Google Scholar] [CrossRef]
  9. Moore, B.; Ghigna, S.; Governato, F.; Lake, G.; Quinn, T.; Stadel, J.; Tozzi, P. Dark matter substructure within galactic halos. Astrophys. J. 1999, 524, L19–L22. [Google Scholar] [CrossRef]
  10. Boylan-Kolchin, M.; Bullock, J.S.; Kaplinghat, M. Too big to fail? The puzzling darkness of massive Milky Way subhaloes. Mon. Not. R. Astron. Soc. 2011, 415, L40–L44. [Google Scholar] [CrossRef] [Green Version]
  11. Dubinski, J.; Carlberg, R.G. The structure of cold dark matter halos. Astrophys.J. 1991, 378, 496–503. [Google Scholar] [CrossRef]
  12. Goetz, M.; Sommer-Larsen, J. Galaxy formation: Warm dark matter, missing satellites, and the angular momentum problem. Astrophys. Space Sci. 2003, 284, 341–344. [Google Scholar] [CrossRef]
  13. Vogelsberger, M.; Zavala, J.; Loeb, A. Subhaloes in Self-Interacting Galactic Dark Matter Haloes. Mon. Not. R. Astron. Soc. 2012, 423, 3740. [Google Scholar] [CrossRef]
  14. Sawala, T.; Frenk, C.S.; Fattahi, A.; Navarro, J.F.; Bower, R.G.; Crain, R.A.; Vecchia, C.D.; Furlong, M.; Helly, J.C.; Jenkins, A.; et al. The APOSTLE simulations: Solutions to the Local Group’s cosmic puzzles. arXiv 2015, arXiv:1511.01098. [Google Scholar] [CrossRef]
  15. Kim, S.Y.; Peter, A.H.G.; Hargis, J.R. Missing Satellites Problem: Completeness Corrections to the Number of Satellite Galaxies in the Milky Way are Consistent with Cold Dark Matter Predictions. Phys. Rev. Lett. 2018, 121, 211302. [Google Scholar] [CrossRef] [Green Version]
  16. Renaud, F.; Bournaud, F.; Emsellem, E.; Elmegreen, B.; Teyssier, R.; Alves, J.; Chapon, D.; Combes, F.; Dekel, A.; Gabor, J.; et al. A sub-parsec resolution simulation of the Milky Way: Global structure of the interstellar medium and properties of molecular clouds. Mon. Not. R. Astron. Soc. 2013, 436, 1836–1851. [Google Scholar] [CrossRef]
  17. Rosdahl, J.; Schaye, J.; Dubois, Y.; Kimm, T.; Teyssier, R. Snap, crackle, pop: Sub-grid supernova feedback in AMR simulations of disc galaxies. Mon. Not. R. Astron. Soc. 2016, 466, 11–33. [Google Scholar] [CrossRef]
  18. Pillepich, A.; Springel, V.; Nelson, D.; Genel, S.; Naiman, J.; Pakmor, R.; Hernquist, L.; Torrey, P.; Vogelsberger, M.; Weinberger, R.; et al. Simulating galaxy formation with the IllustrisTNG model. Mon. Not. R. Astron. Soc. 2017, 473, 4077–4106. [Google Scholar] [CrossRef] [Green Version]
  19. Springel, V.; Pakmor, R.; Pillepich, A.; Weinberger, R.; Nelson, D.; Hernquist, L.; Vogelsberger, M.; Genel, S.; Torrey, P.; Marinacci, F.; et al. First results from the IllustrisTNG simulations: Matter and galaxy clustering. Mon. Not. R. Astron. Soc. 2017, 475, 676–698. [Google Scholar] [CrossRef]
  20. Read, J.I.; Gilmore, G. Mass loss from dwarf spheroidal galaxies: The origins of shallow dark matter cores and exponential surface brightness profiles. Mon. Not. R. Astron. Soc. 2005, 356, 107–124. [Google Scholar] [CrossRef]
  21. Navarro, J.F.; Eke, V.R.; Frenk, C.S. The cores of dwarf galaxy haloes. Mon. Not. R. Astron. Soc. 1996, 283, L72–L78. [Google Scholar] [CrossRef]
  22. Bode, P.; Ostriker, J.P.; Turok, N. Halo formation in warm dark matter models. Astrophys. J. 2001, 556, 93–107. [Google Scholar] [CrossRef]
  23. Bose, S.; Hellwing, W.A.; Frenk, C.S.; Jenkins, A.; Lovell, M.R.; Helly, J.C.; Li, B.; Gonzalez-Perez, V.; Gao, L. Substructure and galaxy formation in the Copernicus Complexio warm dark matter simulations. Mon. Not. R. Astron. Soc. 2016, 464, 4520–4533. [Google Scholar] [CrossRef] [Green Version]
  24. Rocha, M.; Peter, A.H.; Bullock, J.S.; Kaplinghat, M.; Garrison-Kimmel, S.; Onorbe, J.; Moustakas, L.A. Cosmological simulations with self-interacting dark matter—I. Constant-density cores and substructure. Mon. Not. R. Astron. Soc. 2013, 430, 81–104. [Google Scholar] [CrossRef]
  25. Vogelsberger, M.; Zavala, J.; Simpson, C.; Jenkins, A. Dwarf galaxies in CDM and SIDM with baryons: Observational probes of the nature of dark matter. Mon. Not. R. Astron. Soc. 2014, 444, 3684–3698. [Google Scholar] [CrossRef]
  26. Bernal, N.; Cosme, C.; Tenkanen, T. Phenomenology of self-interacting dark matter in a matter-dominated universe. Eur. Phys. J. C 2019, 79, 99. [Google Scholar] [CrossRef]
  27. Boehm, C.; Fayet, P.; Schaeffer, R. Constraining dark matter candidates from structure formation. Phys. Lett. B 2001, 518, 8–14. [Google Scholar] [CrossRef]
  28. Boehm, C.; Riazuelo, A.; Hansen, S.H.; Schaeffer, R. Interacting dark matter disguised as warm dark matter. Phys. Rev. D 2002, 66, 083505. [Google Scholar] [CrossRef]
  29. Boehm, C.; Schaeffer, R. Constraints on dark matter interactions from structure formation: Damping lengths. Astron. Astrophys. 2005, 438, 419–442. [Google Scholar] [CrossRef]
  30. Chung, D.; Everett, L.; Kane, G.; King, S.; Lykken, J.; Wang, L.T. The soft supersymmetry-breaking Lagrangian: Theory and applications. Phys. Rep. 2005, 407, 1–203. [Google Scholar] [CrossRef]
  31. Servant, G.; Tait, T.M. Is the lightest Kaluza–Klein particle a viable dark matter candidate? Nucl. Phys. B 2003, 650, 391–419. [Google Scholar] [CrossRef]
  32. Fox, P.J.; Poppitz, E. Leptophilic dark matter. Phys. Rev. D 2009, 79, 083528. [Google Scholar] [CrossRef] [Green Version]
  33. Fox, P.J.; Harnik, R.; Kopp, J.; Tsai, Y. LEP shines light on dark matter. Phys. Rev. D 2011, 84, 014028. [Google Scholar] [CrossRef]
  34. Schewtschenko, J.A.; Wilkinson, R.J.; Baugh, C.M.; Bœhm, C.; Pascoli, S. Dark matter–radiation interactions: The impact on dark matter haloes. Mon. Not. R. Astron. Soc. 2015, 449, 3587–3596. [Google Scholar] [CrossRef]
  35. Sigurdson, K.; Doran, M.; Kurylov, A.; Caldwell, R.R.; Kamionkowski, M. Dark-matter electric and magnetic dipole moments. Phys. Rev. D 2004, 70, 083501. [Google Scholar] [CrossRef] [Green Version]
  36. Mangano, G.; Melchiorri, A.; Serra, P.; Cooray, A.; Kamionkowski, M. Cosmological bounds on dark matter-neutrino interactions. Phys. Rev. D 2006, 74, 043517. [Google Scholar] [CrossRef]
  37. Serra, P.; Zalamea, F.; Cooray, A.; Mangano, G.; Melchiorri, A. Constraints on neutrino—Dark matter interactions from cosmic microwave background and large scale structure data. Phys. Rev. D 2010, 81, 043507. [Google Scholar] [CrossRef]
  38. Wilkinson, R.J.; Lesgourgues, J.; Boehm, C. Using the CMB angular power spectrum to study Dark Matter-photon interactions. J. Cosmol. Astropart. Phys. 2014, 1404, 026. [Google Scholar] [CrossRef]
  39. Wilkinson, R.J.; Boehm, C.; Lesgourgues, J. Constraining Dark Matter-Neutrino Interactions using the CMB and Large-Scale Structure. J. Cosmol. Astropart. Phys. 2014, 1405, 011. [Google Scholar] [CrossRef]
  40. Cyr-Racine, F.Y.; de Putter, R.; Raccanelli, A.; Sigurdson, K. Constraints on Large-Scale Dark Acoustic Oscillations from Cosmology. Phys. Rev. 2014, D89, 063517. [Google Scholar] [CrossRef]
  41. Collett, T.E.; Buckley-Geer, E.; Lin, H.; Bacon, D.; Nichol, R.C.; Nord, B.; Morice-Atkinson, X.; Amara, A.; Birrer, S.; Kuropatkin, N.; et al. Core or Cusps: The Central Dark Matter Profile of a Strong Lensing Cluster with a Bright Central Image at Redshift 1. Astrophys. J. 2017, 843, 148. [Google Scholar] [CrossRef] [Green Version]
  42. Neyman, J.; Scott, E.L. A Theory of the Spatial Distribution of Galaxies. Astrophys. J. 1952, 116, 144. [Google Scholar] [CrossRef]
  43. Scherrer, R.J.; Bertschinger, E. Statistics of primordial density perturbations from discrete seed masses. Astrophys. J. 1991, 381, 349–360. [Google Scholar] [CrossRef]
  44. Cooray, A.; Sheth, R. Halo models of large scale structure. Phys. Rep. 2002, 372, 1–129. [Google Scholar] [CrossRef] [Green Version]
  45. Ullio, P.; Bergström, L.; Edsjö, J.; Lacey, C. Cosmological dark matter annihilations into γ rays: A closer look. Phys. Rev. D 2002, 66, 123502. [Google Scholar] [CrossRef]
  46. Moliné, Á.; Ibarra, A.; Palomares-Ruiz, S. Future sensitivity of neutrino telescopes to dark matter annihilations from the cosmic diffuse neutrino signal. J. Cosmol. Astropart. Phys. 2015, 2015, 005. [Google Scholar] [CrossRef]
  47. Sánchez-Conde, M.A.; Prada, F. The flattening of the concentration–mass relation towards low halo masses and its implications for the annihilation signal boost. Mon. Not. R. Astron. Soc. 2014, 442, 2271–2277. [Google Scholar] [CrossRef]
  48. Fermi LAT Collaboration. Limits on dark matter annihilation signals from the Fermi LAT 4-year measurement of the isotropic gamma-ray background. J. Cosmol. Astropart. Phys. 2015, 2015, 008. [Google Scholar] [CrossRef]
  49. Moliné, A.; Sánchez-Conde, M.A.; Palomares-Ruiz, S.; Prada, F. Characterization of subhalo structural properties and implications for dark matter annihilation signals. Mon. Not. R. Astron. Soc. 2017, 466, 4974–4990. [Google Scholar] [CrossRef]
  50. Moliné, Á.; Schewtschenko, J.A.; Palomares-Ruiz, S.; Bœhm, C.; Baugh, C.M. Isotropic extragalactic flux from dark matter annihilations: Lessons from interacting dark matter scenarios. J. Cosmol. Astropart. Phys. 2016, 2016, 069. [Google Scholar] [CrossRef]
  51. Boehm, C.; Schewtschenko, J.A.; Wilkinson, R.J.; Baugh, C.M.; Pascoli, S. Using the Milky Way satellites to study interactions between cold dark matter and radiation. Mon. Not. R. Astron. Soc. Lett. 2014, 445, L31–L35. [Google Scholar] [CrossRef] [Green Version]
  52. Ma, C.P.; Bertschinger, E. Cosmological Perturbation Theory in the Synchronous and Conformal Newtonian Gauges. Astrophys.J. 1995, 455, 7. [Google Scholar] [CrossRef] [Green Version]
  53. Springel, V. The Cosmological simulation code GADGET-2. Mon. Not. R. Astron. Soc. 2005, 364, 1105–1134. [Google Scholar] [CrossRef]
  54. Escudero, M.; Lopez-Honorez, L.; Mena, O.; Palomares-Ruiz, S.; Villanueva-Domingo, P. A fresh look into the interacting dark matter scenario. J. Cosmol. Astropart. Phys. 2018, 2018, 007. [Google Scholar] [CrossRef]
  55. Jenkins, A. Second-order Lagrangian perturbation theory initial conditions for resimulations. Mon. Not. R. Astron. Soc. 2010, 403, 1859–1872. [Google Scholar] [CrossRef] [Green Version]
  56. Navarro, J.F.; Oman, K.A.; Fattahi, A.; Sawala, T.; Jenkins, A.; Frenk, C.S.; Schaller, M.; Furlong, M.; Theuns, T.; Crain, R.A.; et al. The APOSTLE project: Local Group kinematic mass constraints and simulation candidate selection. Mon. Not. R. Astron. Soc. 2016, 457, 844–856. [Google Scholar] [CrossRef]
  57. Behroozi, P.S.; Wechsler, R.H.; Wu, H.Y. The Rockstar Phase-Space Temporal Halo Finder and the Velocity Offsets of Cluster Cores. Astrophys. J. 2012, 762, 109. [Google Scholar] [CrossRef]
  58. Oñorbe, J.; Garrison-Kimmel, S.; Maller, A.H.; Bullock, J.S.; Rocha, M.; Hahn, O. How to zoom: Bias, contamination and Lagrange volumes in multimass cosmological simulations. Mon. Not. R. Astron. Soc. 2014, 437, 1894–1908. [Google Scholar] [CrossRef]
  59. Diemand, J.; Kuhlen, M.; Madau, P. Formation and evolution of galaxy dark matter halos and their substructure. Astrophys. J. 2007, 667, 859–877. [Google Scholar] [CrossRef]
  60. Diemand, J.; Kuhlen, M.; Madau, P.; Zemp, M.; Moore, B.; Potter, D.; Stadel, J. Clumps and streams in the local dark matter distribution. Nature 2008, 454, 735–738. [Google Scholar] [CrossRef] [Green Version]
  61. Springel, V.; Wang, J.; Vogelsberger, M.; Ludlow, A.; Jenkins, A.; Helmi, A.; Navarro, J.F.; Frenk, C.S.; White, S.D.M. The Aquarius Project: The subhalos of galactic halos. Mon. Not. R. Astron. Soc. 2008, 391, 1685–1711. [Google Scholar] [CrossRef]
  62. Navarro, J.F.; Frenk, C.S.; White, S.D. The Structure of cold dark matter halos. Astrophys. J. 1996, 462, 563–575. [Google Scholar] [CrossRef]
  63. Navarro, J.F.; Frenk, C.S.; White, S.D. A Universal density profile from hierarchical clustering. Astrophys. J. 1997, 490, 493–508. [Google Scholar] [CrossRef]
  64. Lovell, M.R.; Eke, V.; Frenk, C.S.; Gao, L.; Jenkins, A.; Theuns, T.; Wang, J.; White, S.D.M.; Boyarsky, A.; Ruchayskiy, O. The haloes of bright satellite galaxies in a warm dark matter universe. Mon. Not. R. Astron. Soc. 2012, 420, 2318–2324. [Google Scholar] [CrossRef] [Green Version]
  65. Pieri, L.; Lavalle, J.; Bertone, G.; Branchini, E. Implications of High-Resolution Simulations on Indirect Dark Matter Searches. Phys. Rev. D 2011, 83, 023518. [Google Scholar] [CrossRef]
  66. Ghigna, S.; Moore, B.; Governato, F.; Lake, G.; Quinn, T.R.; Stadel, J. Density profiles and substructure of dark matter halos. Converging results at ultra-high numerical resolution. Astrophys. J. 2000, 544, 616. [Google Scholar] [CrossRef]
  67. Bullock, J.S.; Kolatt, T.S.; Sigad, Y.; Somerville, R.S.; Kravtsov, A.V.; Klypin, A.A.; Primack, J.R.; Dekel, A. Profiles of dark haloes. Evolution, scatter, and environment. Mon. Not. R. Astron. Soc. 2001, 321, 559–575. [Google Scholar] [CrossRef]
  68. Diemand, J.; Moore, B. The structure and evolution of cold dark matter halos. Adv. Sci. Lett. 2011, 4, 297–310. [Google Scholar] [CrossRef]
  69. Bartels, R.; Ando, S. Boosting the annihilation boost: Tidal effects on dark matter subhalos and consistent luminosity modeling. Phys. Rev. D 2015, 92, 123508. [Google Scholar] [CrossRef] [Green Version]
1
Which are not affected by tidal forces.
2
We do not include the case of DM-neutrino interactions, yet the results are expected to be similar to those presented in this work; see the discussions, e.g., in [34,51].
Figure 1. Median halo concentrations and 1 σ errors as found in our set of simulations, Box (blue) and LGs (red), at z = 0 . (a) Left panel: median c V values as a function of V max . (b) Right panel: c 200 as a function of M 200 . In both panels, the circle symbols refer to the IDM simulations, whereas the triangles to CDM.
Galaxies 07 00080 g001
Figure 2. Median subhalo concentrations and 1 σ errors as found in our set of simulations, Box (blue) and LGs (red), at z = 0 . The circle symbols represent the results from the IDM simulations, whereas the triangle symbols correspond to the CDM results. (a) Left panel: the median c V as a function of V max . (b) Right panel: c 200 as a function of m 200 as obtained using Equations (6) and (7) for every subhalo in the simulations.
Galaxies 07 00080 g002
Figure 3. Median subhalo concentrations and 1 σ errors as a function of x sub , i.e., the distance to the centre of the host halo normalized to R 200 . We show results for c V (left) and c 200 (right) as derived from our set of LG simulations.
Galaxies 07 00080 g003
Figure 4. Left panel: Median halo (open circles) and subhalo (filled circles) c V concentration values and corresponding 1 σ errors, as a function of V max , as found in our set of simulations for interacting dark matter (IDM) at z = 0 : Box (blue) and LGs (red). Right panel: the same, but for c 200 as a function of m 200 .
Galaxies 07 00080 g004
Figure 5. Cumulative number of subhalos, N ( > m 200 ) , as a function of subhalo mass, m 200 , in the case of IDM (circle symbols) and CDM (triangles) as obtained from Box (blue) and LG (red) simulations at z = 0 . We also show the corresponding fits using Equation (8) with the best-fit parameters reported in Table 2 (solid coloured lines).
Galaxies 07 00080 g005
Figure 6. Number density of subhalos as a function of distance to the host halo centre, x sub = r sub / R 200 . We show results for both IDM (circle symbols) and CDM (triangles). Both cases refer to the LG simulation set; see the text for details.
Galaxies 07 00080 g006
Table 1. Most relevant parameters of Box and Local Groups (LGs) simulations, together with their corresponding halo and subhalo abundances. Columns 2–4 indicate the box size L sim , the particle mass m Part , and the comoving softening length l soft . The rest of columns provide the total number of subhalos N sub , IDM / CDM and halos N h , IDM / CDM for each cosmological model. We remind that there are 4 LGs in each case.
L sim m Part l soft N sub , IDM N sub , CDM N h , IDM N h , CDM
Box100 Mpc 1.96 × 10 8 M / h 2.7 kpc 17,48127,973125,704197,208
LGs15 Mpc/h 4.85 × 10 5 M / h 860 pc 160611,09210,51340,874
Table 2. Best-fit parameters and χ 2 values for the cumulative subhalo mass function given in Equation (8) according to our data. We show results for both IDM and CDM as obtained from our LG and Box simulations.
γ LGs β LGs χ 2 , LGs γ Box β Box χ 2 , Box
IDM 0.71 6.04 × 10 6 0.27 0.83 6.74 × 10 9 0.068
CDM 0.88 7.22 × 10 8 0.19 0.83 1.10 × 10 10 0.36