1. Introduction
Spectroscopy is one of the main tools for detecting various species and probing physical conditions in the Universe. Stellar spectroscopy provides the information about basic stellar parameters (temperature, gravity, abundances, velocities) and combined with theoretical models and astrometric data it reveals stellar populations and their evolution. However, for correct interpretation of the observed spectra one needs accurate parameters of many spectral lines, which are imprinted in the emergent radiation. The most prominent and sensitive spectral features are sensitive to stellar parameter and thus we need a large amount of reliable data and the means for selecting relevant information for our targets. This huge amount of data is collected in specialised databases (DB) of atomic and molecular line parameters. Vienna Atomic Line Database (VALD) created in 1995 [
1] by astrophysists quickly became one of the most popular DB for the analysis of stellar spectra. The second version, VALD2 [
2], was running since 1999, and VALD3 [
3] started its work since 2015.
Throughout its development VALD became a meeting point of data producers and data users.
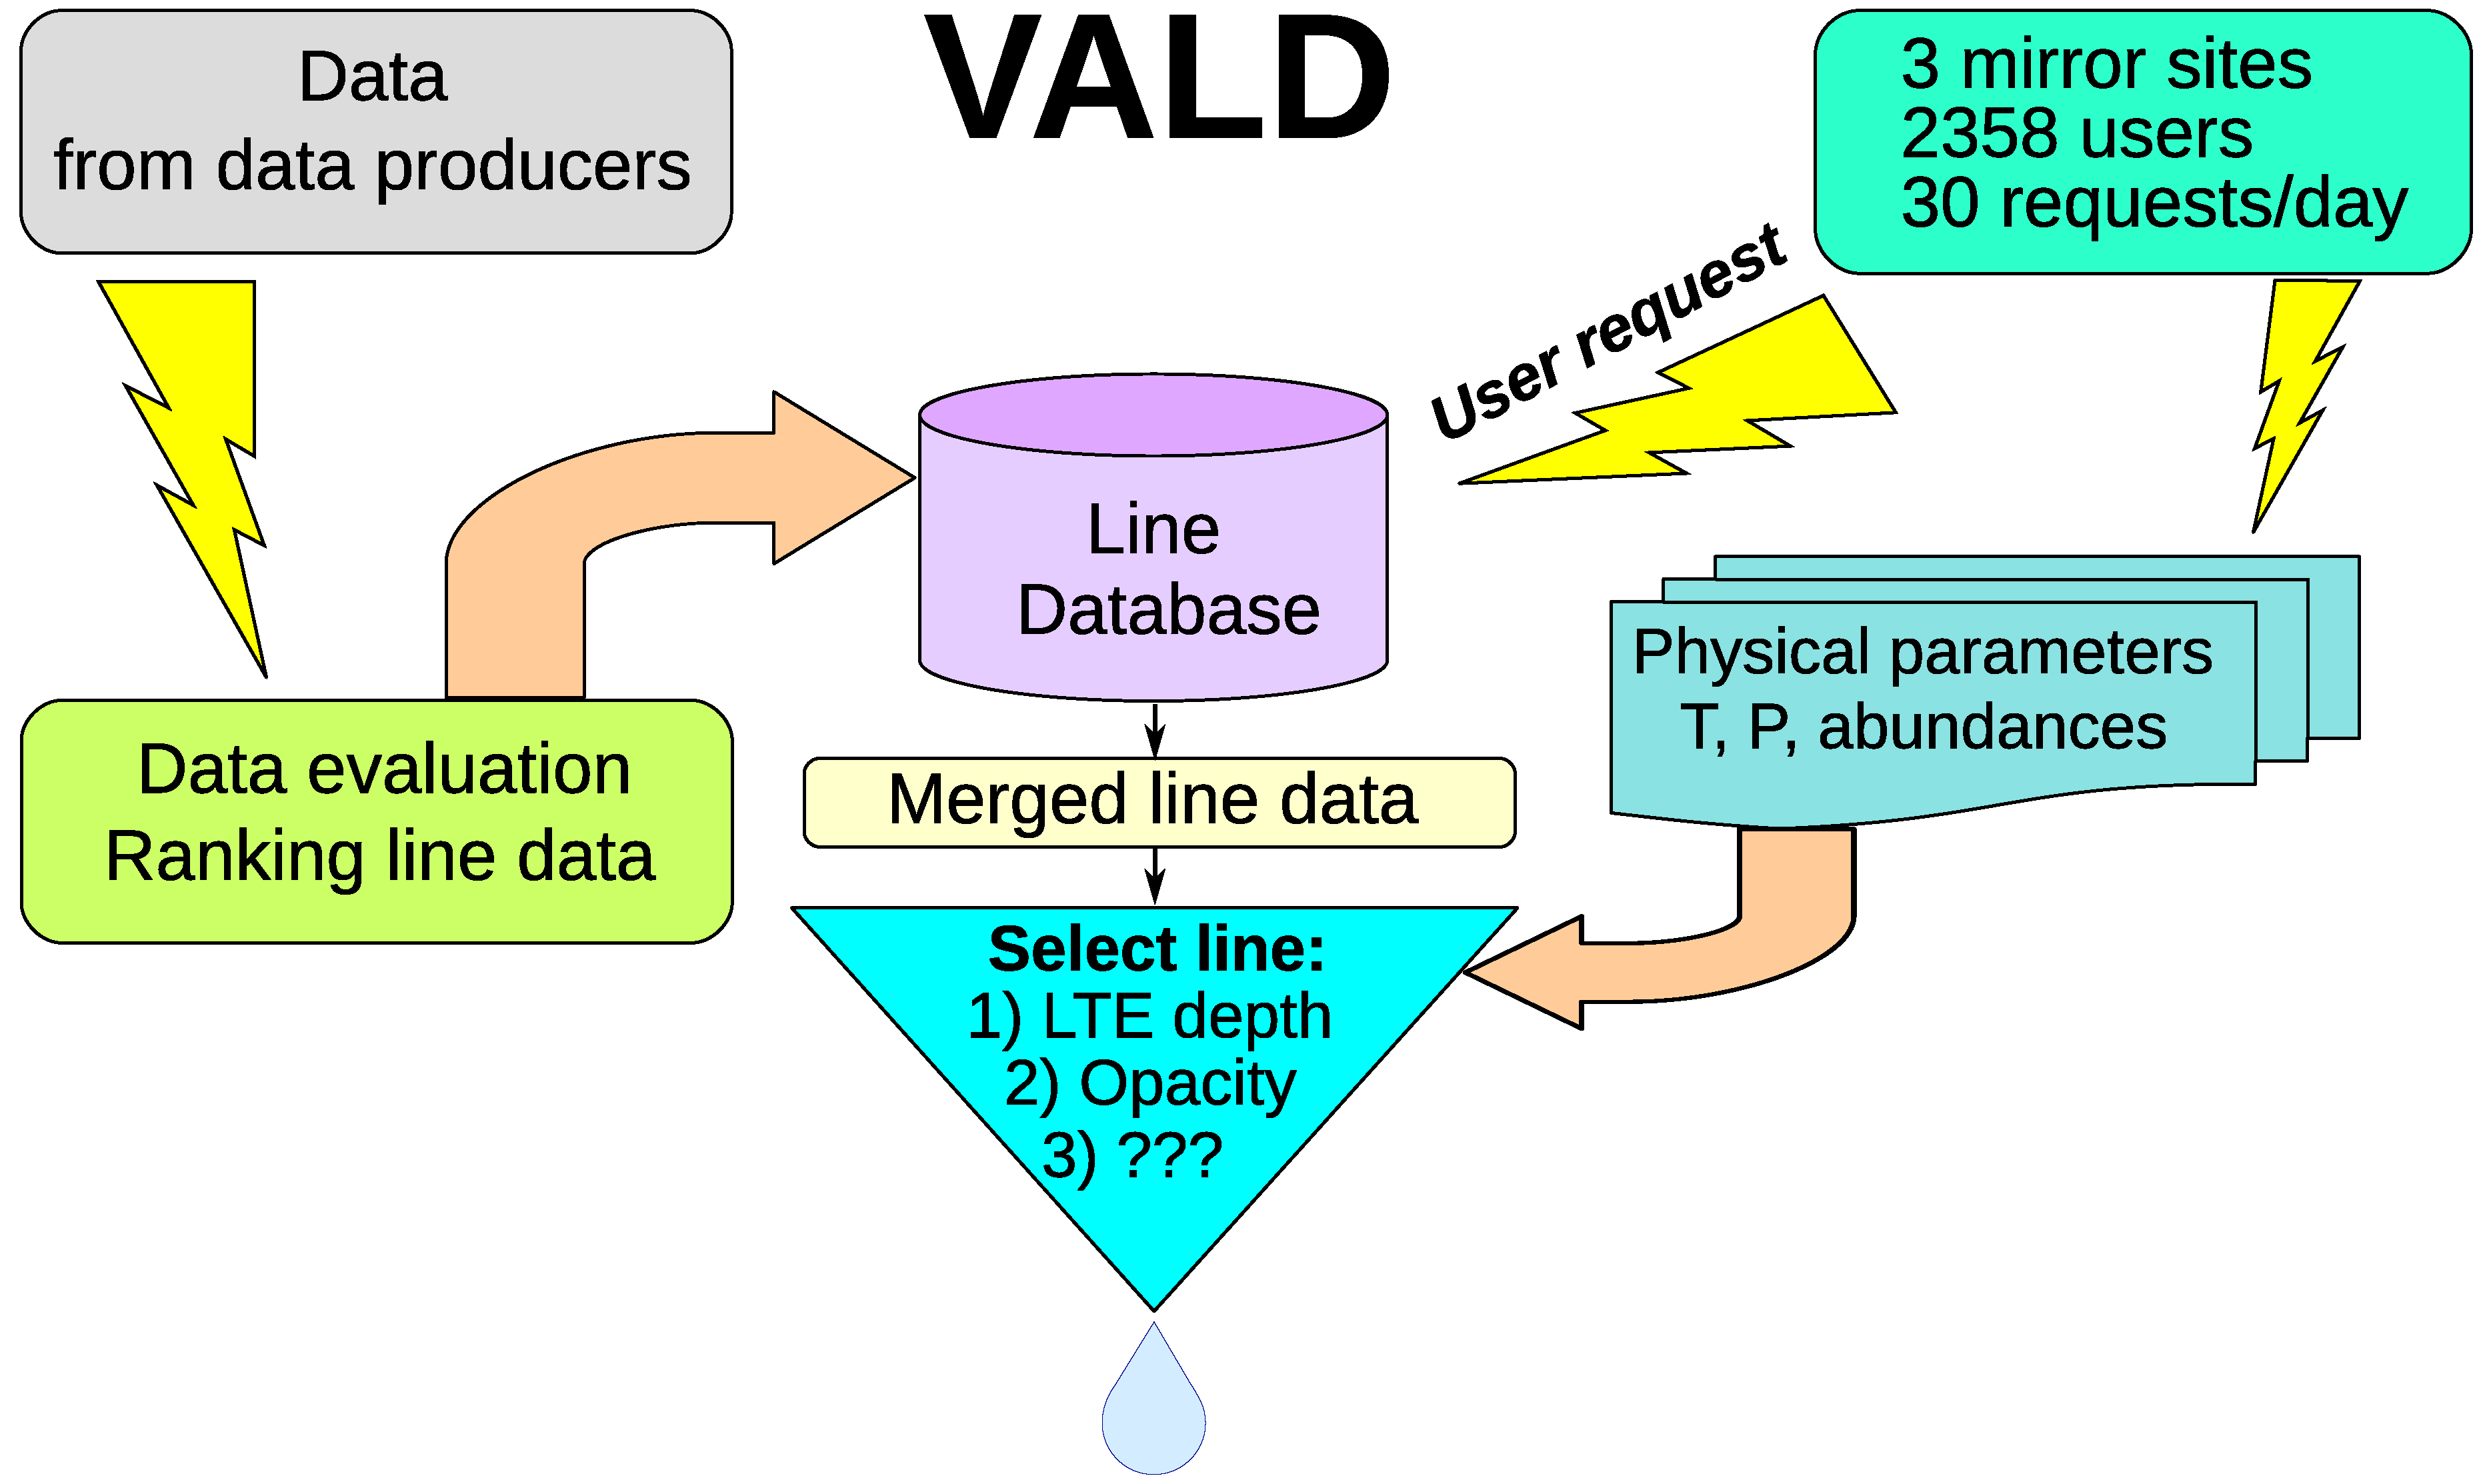
Figure 1 schematically represents the VALD structure. The VALD team critically analyses every new atomic and molecular parameter dataset (“line list” in VALD terminology) that we receive from data producers by comparing spectral fits to high-precision spectra of reference stars (the Sun, Sirius, Procyon, etc.). At this point we establish the rank for each data type in the new line list that is then included in VALD. In this way we save all previous datasets so that we can reproduce the results from earlier releases. The new data is seamlessly integrated in the extraction delivering the best content according to our evaluation. We regularly check our quality assessments against other centres and groups (e.g., NIST), constantly collect feedback from data users and discuss methodology in forums such as VAMDC (
www.vamdc.org). VALD team ranking is compiled in the so-called default VALD configuration. Users get the possibility to create their own copy of configuration where they can adjust the ranking parameters. The requested data is returned to the user by e-mail or ftp.
2. Data Extraction
The VALD users appreciate the variety of data extraction tools. It is possible to examine the full VALD collection of parameters for an individual spectral line and to get their combination to a final output (“Show Line ONLINE”), to extract all available data for a certain chemical species in a chosen spectral range (“Extract Element”), to get data for all species selected spectral range (“Extract All”), and to extract data for spectral lines noticeable in the emergent radiation of a star with a given effective temperature, surface gravity and metallicity (“Extract Stellar”). This last extraction tool is particularly popular among stellar spectroscopists because it allows to get lines with the most significant imprint on the stellar flux. It provides the estimated line strength and selects the minimal data set for successful spectral synthesis.
Figure 2 demonstrates the level of completeness of VALD and the efficiency of its extraction tools. We show the comparison of the high-resolution observations with synthetic spectra for stars of different effective temperatures:
Her (
= 17,500 K), 21 Peg (10,400 K), HD 32115 (7250 K), Sun (5777 K),
Eri (5040 K) and M1-dwarf UCAC4 443-054906 (3800 K). Spectra of
Her, 21 Peg, HD 32115 were obtained with the Echelle SpectroPolarimetric Device for the Observation of Stars (ESPaDOnS) attached at the 3.6 m Canada-France-Hawaii Telescope (CFHT) and were taken from the ESPaDOnS archive (
http://www.cadc-ccda.hia-iha.nrc-cnrc.gc.ca/AdvancedSearch).
Eri and UCAC4 443-054906 were observed with the HARPS spectrograph at the ESO 3.6 m telescope at La Silla. These were retrieved from the ESO archive (
http://archive.eso.org/eso/eso_archive_main.html). For the Sun we used the Kitt Peak Solar Atlas [
4]. Synthetic calculations were based on the VALD3 data extracted for each star using “Extract Stellar” tool.
A particular spectral region 5600–5630 Å was chosen because (1) it contains both atomic and molecular lines which may appear in stellar spectra of different temperatures and (2) the majority of massive spectral works use stellar spectra observed in visual region between 3700 and 7000 Å. While in the hottest star,
Her, only 8 lines reach central depths over 1% relative to continuum in the 5590–5630 Å spectral region, 1300 lines are needed to represent the observed spectrum of M1-dwarf. Most of the observed features belong to the molecular lines, and the fact that both atomic and molecular line parameters are retrieved through the same interface makes VALD the most efficient ’work horse’ for stellar spectroscopic analysis. The only other data collection by R. Kurucz (
http://kurucz.harvard.edu/) containing both atomic and molecular line data does not offer an “Extract Stellar”-like query option.
Another important new feature in VALD3 is propagation of bibliographic links. Each VALD3 record includes the source reference complemented with optional references to measured wavelength, oscillator strength and isotopic shifts. During the extraction records from different line lists describing the same transition are merged according to the ranking scheme. Thus, the output record may contain entries from several different sources. In VALD3 the bibliographic keys follow the merging procedure so that each field of the output record contains a matching reference. In the final stage of extraction VALD3 collects BibTeX entries matching unique reference keys and delivers them to the user in form of a separate BibTeX file.
3. Iron Analysis
Iron is one of the most important elements in stellar spectroscopy. It is a reference element for metallicity of stars and for chemical evolution of the Galaxy. Therefore the accuracy of iron abundance determination is particularly important. With the present quality of high-resolution spectroscopic observations this task is very sensitive to the accuracy of spectral line parameters. The NIST Atomic Spectra Database (ASD) [
5] assigns the highest accuracy estimates of 3–5% for the Oxford laboratory measurements of Fe I transition probabilities [
6,
7,
8,
9,
10]. Independent laboratory data of the Hannover group [
11,
12] show a small but systematic difference from the Oxford measurements (see
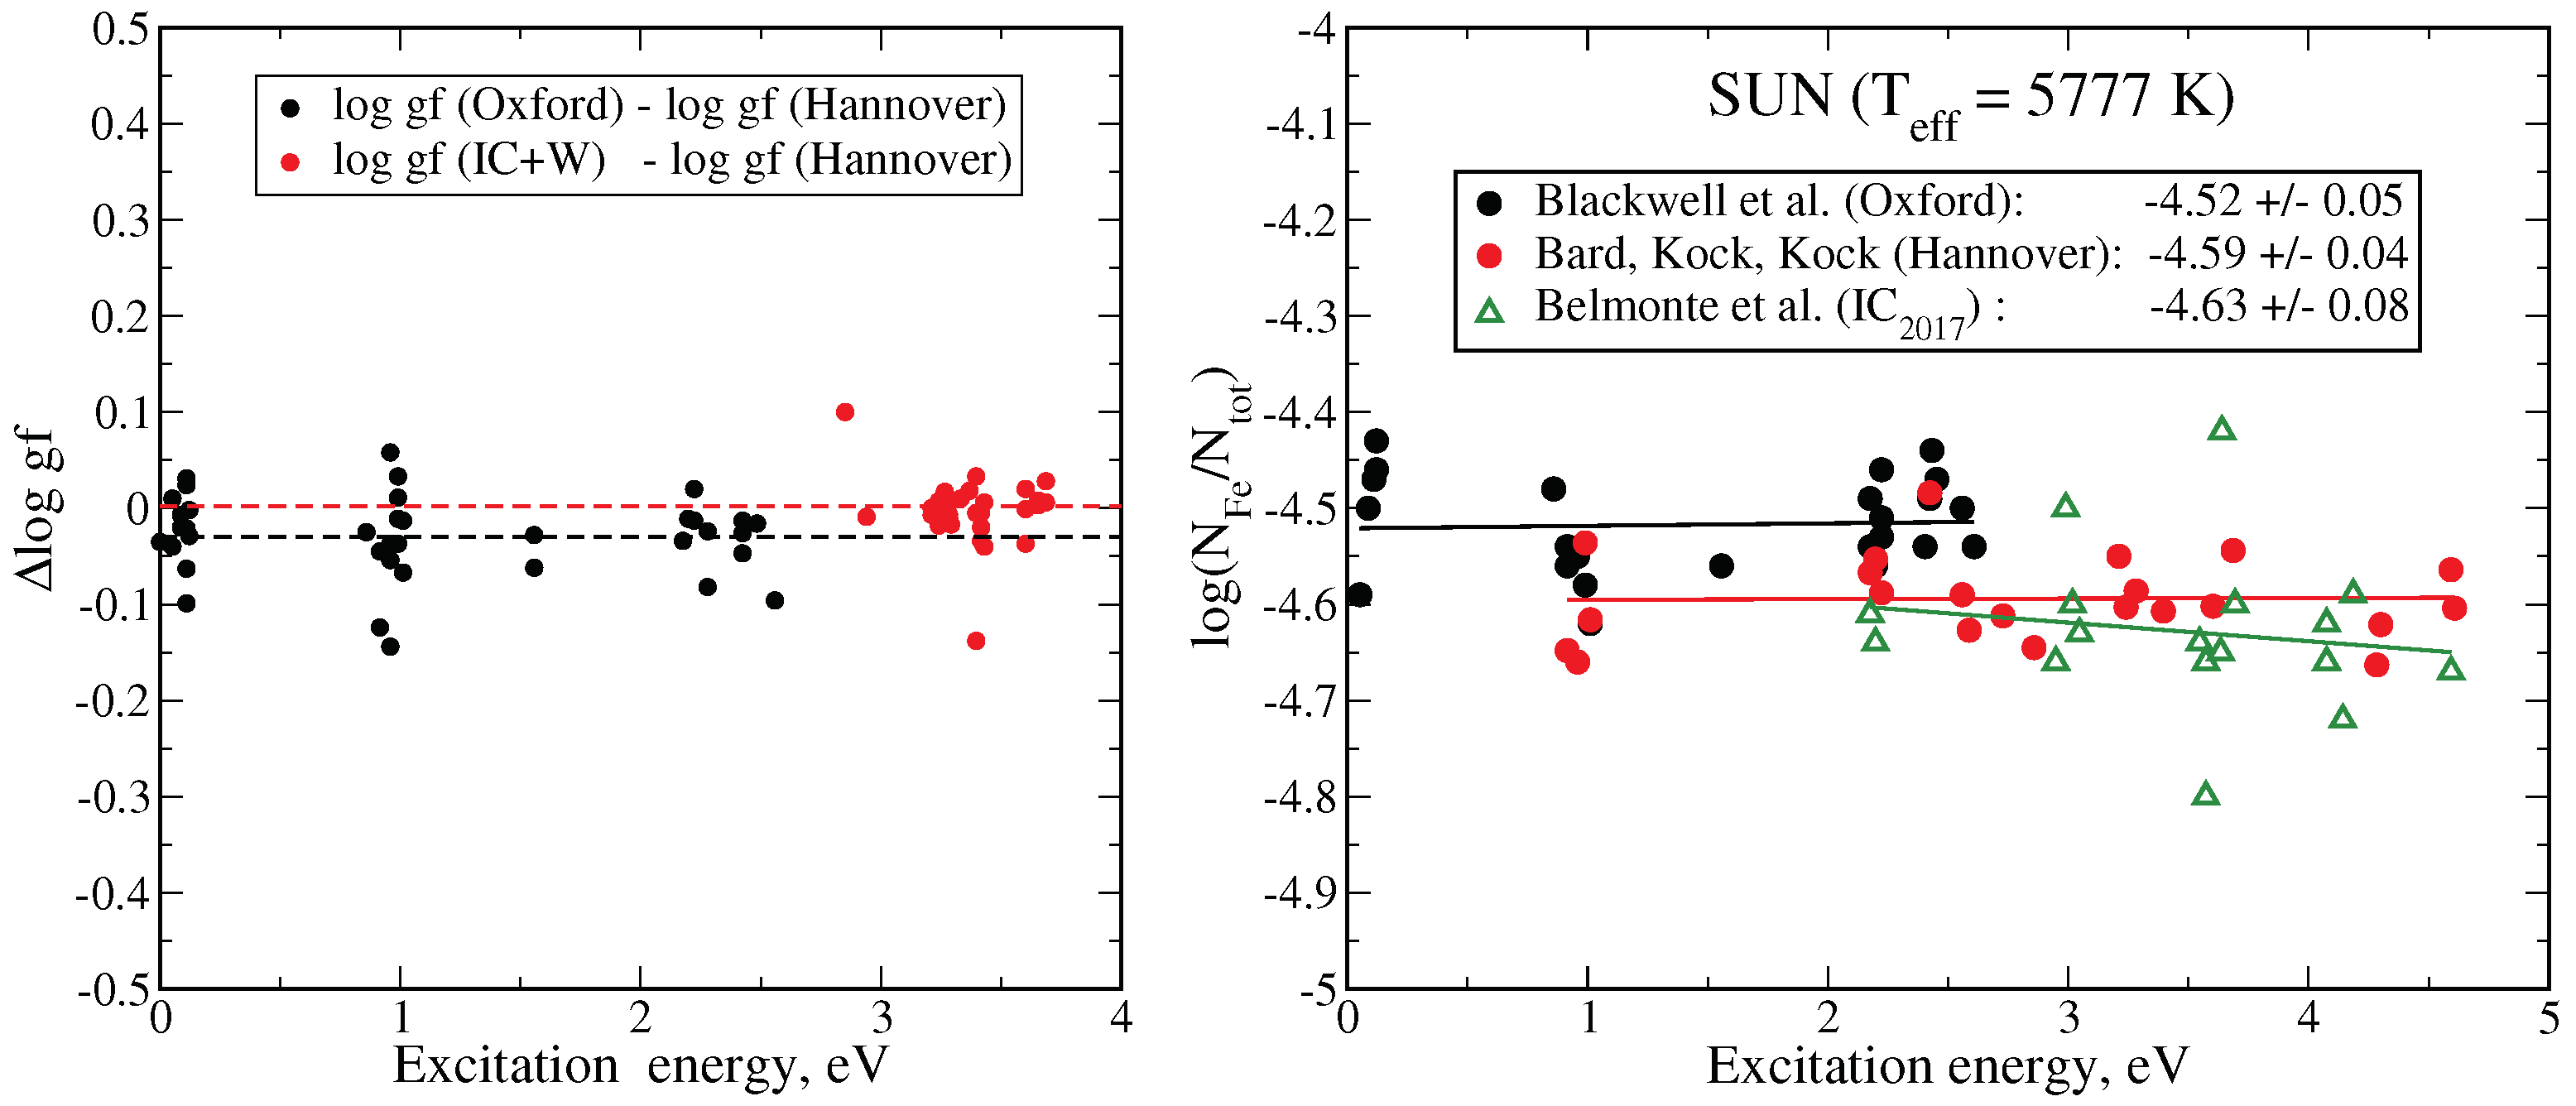
Figure 3, left panel). The claimed uncertainties of the Hannover data are 7–15% and this internal estimate agrees with the one by NIST. For common lines in both sets of measurements NIST recommends the use of Oxford values. The differences between Oxford and Hannover transition probabilities of Fe I lines are shown in
Figure 3 (left panel). Recently new laboratory data for Fe I transition probabilities were published by spectroscopy groups of Wisconsin University (USA) and Imperial College (UK): Ruffoni et al. [
13], Den Hartog et al. [
14], and Belmonte et al. [
15]. A comparison between the Wisconsin + IC data and Hannover transition probabilities is also shown in
Figure 3 (left panel). No systematic difference is visible. We performed Fe abundance measurements in the solar atmosphere with different sets of transition probabilities: Oxford, Hannover and IC [
15]. Abundances are displayed in
Figure 3 (right panel). We get systematically lower Fe abundance with Hannover and IC transition probabilities compared to that derived with the Oxford data. Careful analysis of all data sets using spectra of other than the Sun reference stars is required to establish a best final list of Fe I experimental transition probabilities recommended for abundance determinations in stellar atmospheres. This work will be done for the next VALD release.
Laboratory data are available for a limited number of spectral lines while one needs many more lines for theoretical presentation of the observed spectra. The majority of line parameters come from theoretical calculations. Recently, Peterson & Kurucz [
16,
17] performed an extensive analysis of Fe I level structure based on high quality stellar spectra which resulted in newly classified energy levels and new Fe I lines potentially detectable in stellar spectra. Present VALD3 version contains slightly more than 122,000 Fe I lines with accurate wavelengths. 2772 lines have experimentally measured transition probabilities, for other lines theoretical calculations are provided. With new data from [
17] the number of Fe I classified lines increases up to 128,000. To check the uncertainties of the theoretical data we compared transition probabilities calculated by R. Kurucz (
http://kurucz.harvard.edu/atoms/2600/gfemq2600.pos) with the experimental measurements by Wisconsin + IC.
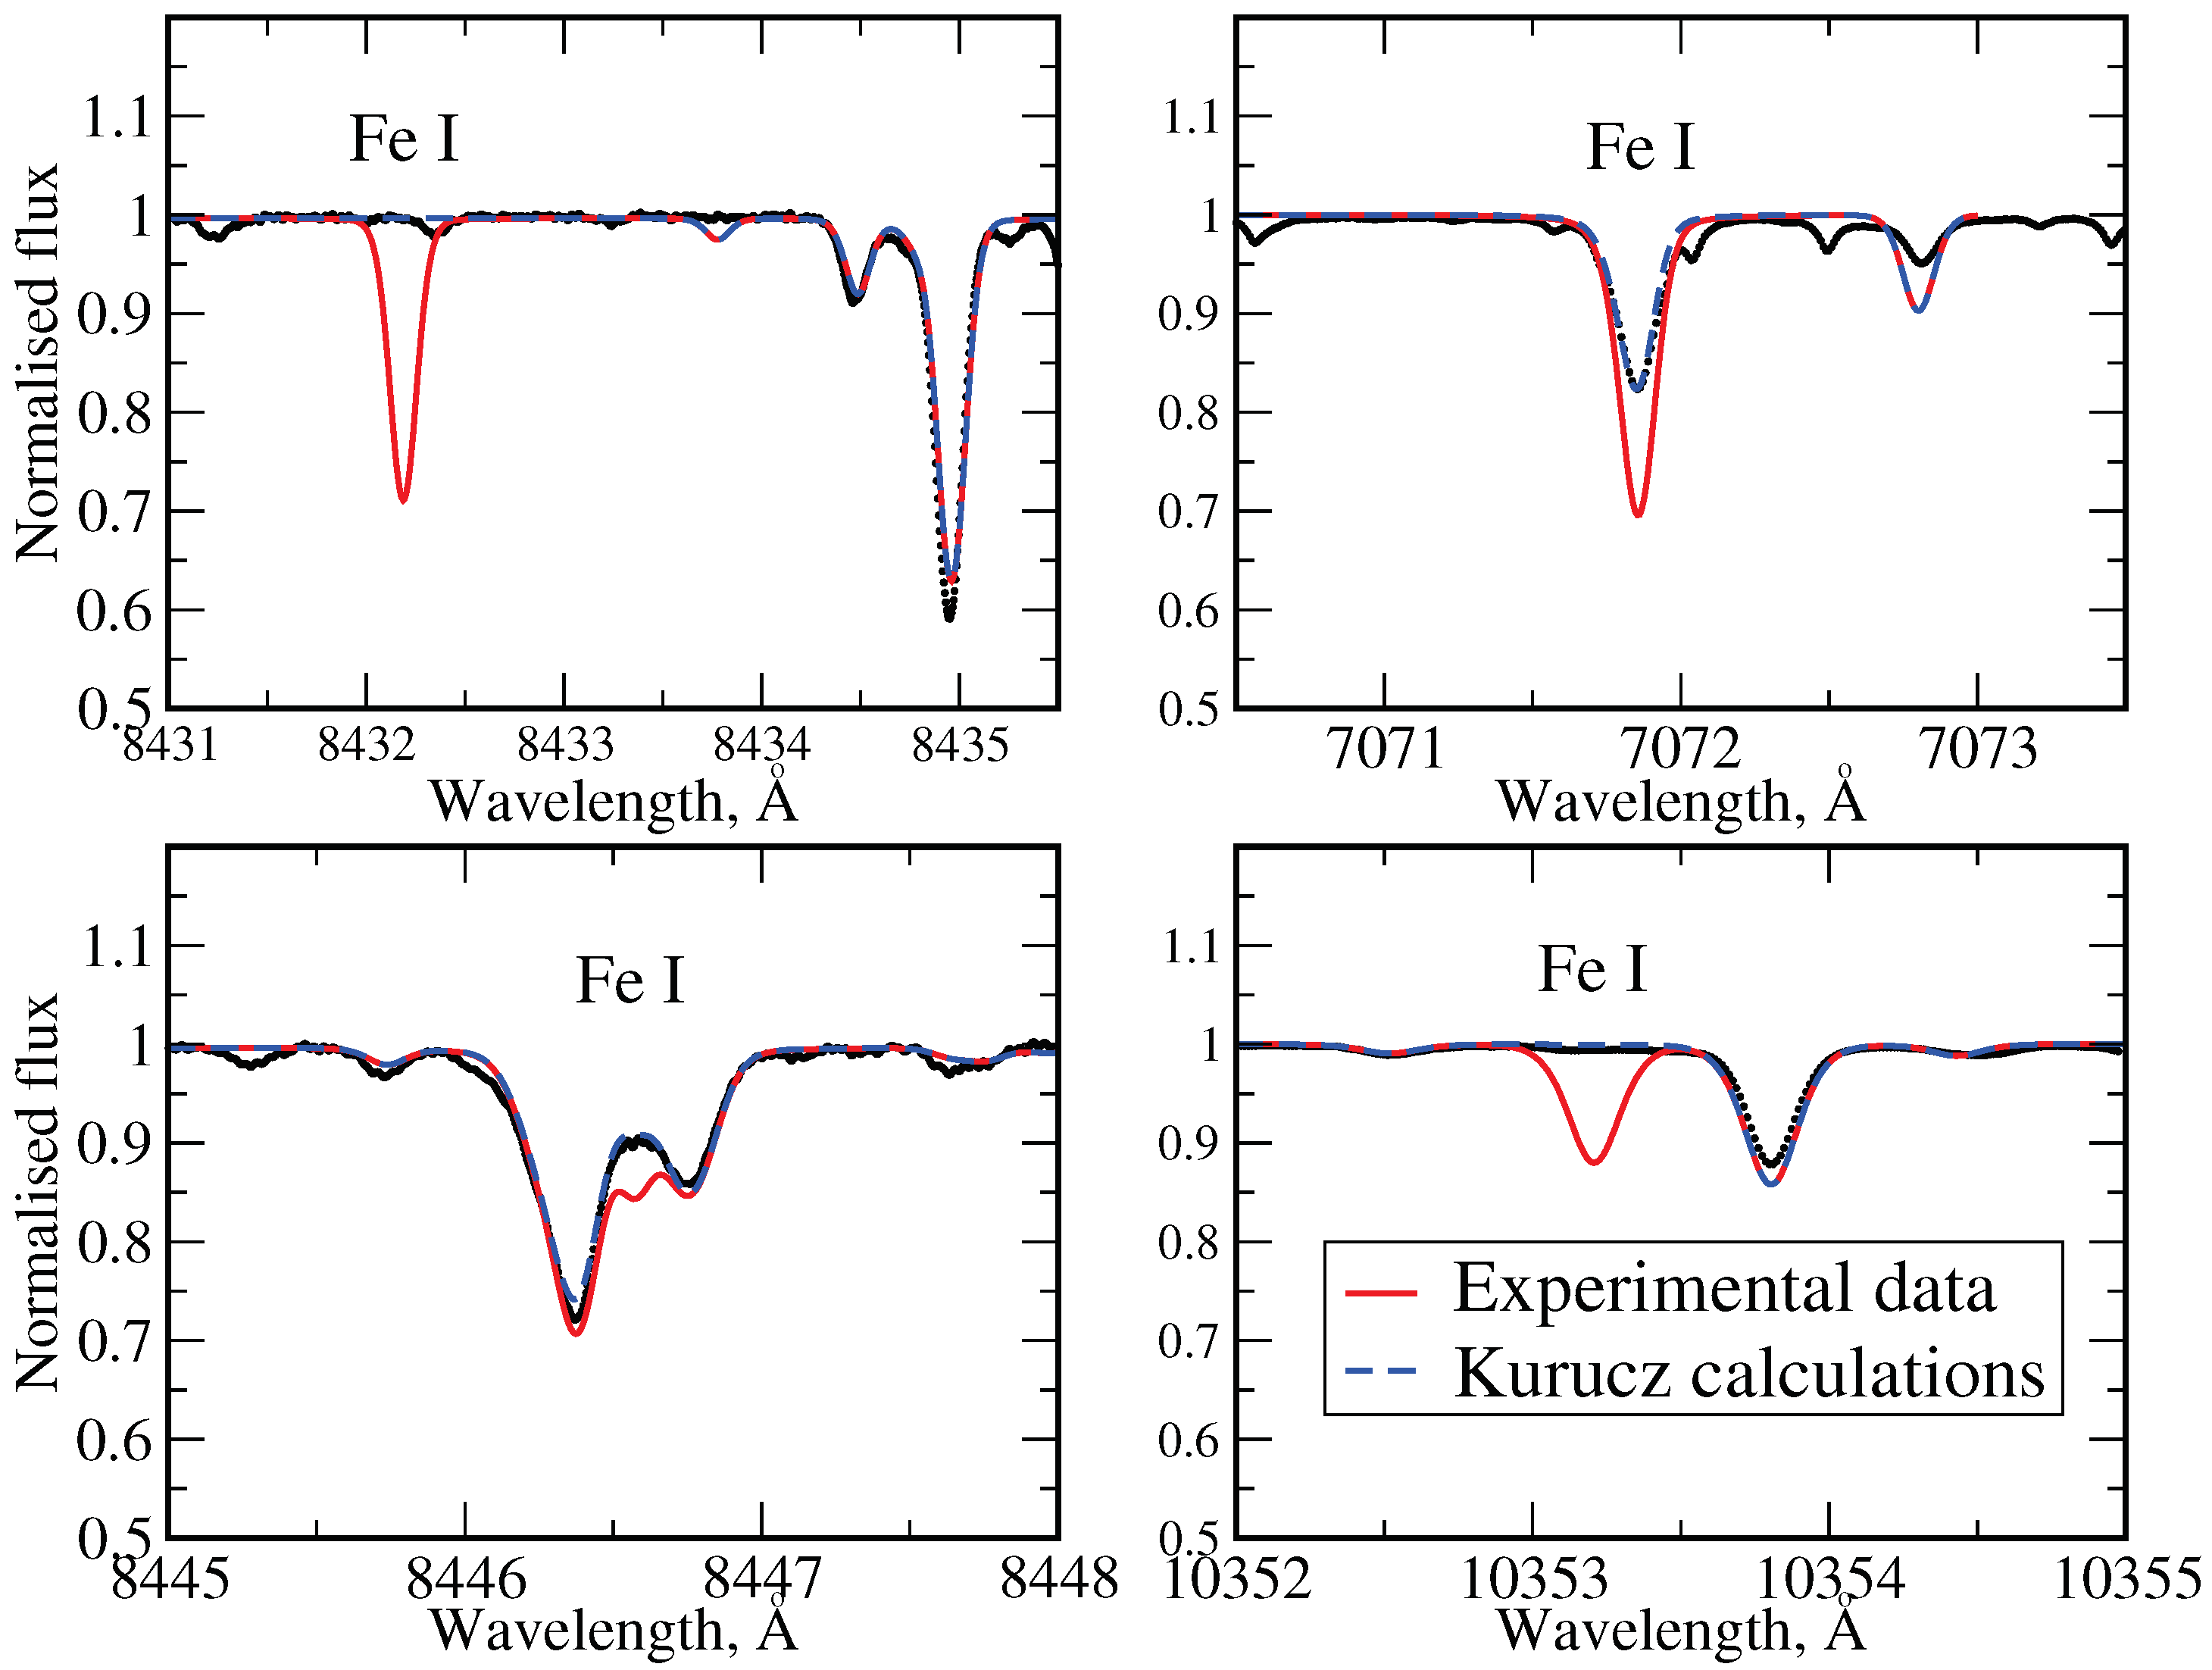
Figure 4 shows a comparison between experimental (∼500 lines) and theoretical transition probabilities. There are no systematic differences. The absolute scales seem to match, although the dispersion of the theoretical data is rather large. The difference between experimental and theoretical transition probabilities exceeds 2 dex for nine lines (not shown in the plot). Large discrepancy is often an indication of strong configuration mixing. However, laboratory measurements may be erroneous, too, and such comparisons could reveal the errors. In few cases the laboratory data were clearly incorrect and had to be replaced by the theoretical calculations. Four examples are demonstrated in
Figure 5.
All of the examples presented so far illustrated the process of critical data evaluation in VALD.
4. Hyperfine Splitting in VALD
Transition probability defines spectral line intensity. The lines of an element/isotope with an odd mass number are split into components due to multipolar interaction of the nuclear magnetic dipole moment with the magnetic field created by the electron shell. This effect known as hyperfine splitting (hfs) may produce significant change to the line shape and increase line intensity, which has to be taken into account in precision spectral analysis. We created a special SQLite database with data for hfs calculations collected from the literature. These data include species names, energy of levels E, total angular moment J, magnetic moment I, and the hfs constants A and B (see, for more details [
18]). Full hfs-pattern on-the-fly calculations will soon be offered as an option for VALD3 “Extract Stellar” query.
Figure 6 demonstrates the importance of hfs for accurate fitting of spectral features. Atomic data for synthetic calculations with hfs components were extracted from Moscow VALD3 mirror site (
http://vald.inasan.ru/~vald3/php/vald.php) where hfs-extraction is running in a test mode. A and B constants were taken from Dembczyński et al. [
19], Başar et al. [
20] for the Mn I line and from Guthöhrlein and Keller [
21], and Pickering [
22] for Co I lines.
5. Discussion
The consistent development of the VALD data content and software has reached the point where we can reliably model stellar spectra across all spectral types. The flexible extraction tools tune to user requirements have proven to be very popular. In fact, the VALD3 estimate of the central line depth in “Extract Stellar” mode is frequently used in science publications, e.g., when combining many spectral lines in search for binarity or weak magnetic fields. Massive efforts invested in data consistency verification and standardisation of energy level description as part of the VALD3 transition paid off by reducing the amount of erroneous data and development of the robust merging algorithm for overlapping data. It has also opened new possibilities for NLTE calculation etc. The new accurate bibliographic system simplifies the referencing of the original work by data producers making VALD an attractive platform for publishing new data. Large projects working on combination of heterogenous atomic and molecular data (e.g., VAMDC) look at VALD as model for bibliographic system and data evaluation.
6. Conclusions
VALD is an established source of atomic and molecular data for astronomical and particularly stellar spectroscopy. It is the most complete data collection for temperatures encountered in stellar atmospheres and circumstellar medium. Regular updates and critical evaluation of the new data ensures best quality data is delivered to the user. At the same time the flexible referencing system allows the user to trace the original reference of every data entry in the final selection. New features, such as isotopic splitting and hps will soon be available to the users improving the quality of the spectral synthesis. Substantial progress in theoretical atomic and molecular models is bringing the quality of the computed transition probabilities closer to the laboratory measurements further improving the completeness of of our line lists.
Author Contributions
T.R. performed Iron analysis and wrote the main text of the paper; Y.P. provided hfs calculations and made plots; N.P. designed and further developped VALD to its current version, implemented to the text of the paper.
Funding
Current research was supported by the Fundamental Research Program No. 28 of Presidium of the RAS. VALD3 developments were supported by the Swedish Foundation for Research Infrastructure (RFI) grant No.2015-06024.
Acknowledgments
This research used data obtained from the ESO Science Archive Facility and from ESPaDOnS archive via the facilities of the Canadian Astronomy Data Centre operated by the National Research Council of Canada with the support of the Canadian Space Agency. The authors would like to thank VALD data contributors and VALD users for regular updates and critical evaluation of the VALD content. We are also thankful to the VAMDC collaboration (
vamdc.org) for providing tools and motivation for enforcing data standards in VALD.
Conflicts of Interest
The authors declare no conflict of interest.
Abbreviations
The following abbreviations are used in this manuscript:
| NIST | National Institute of Standards and Technology |
| IC | Imperial College |
| VAMDC | Virtual Atomic and Molecular Data Centre |
References
- Piskunov, N.E.; Kupka, F.; Ryabchikova, T.A.; Weiss, W.W.; Jeffery, C.S. VALD: The Vienna Atomic Line Data Base. Astron. Astrophys. Suppl. Ser. 1995, 112, 525. [Google Scholar]
- Kupka, F.; Piskunov, N.; Ryabchikova, T.A.; Stempels, H.C.; Weiss, W.W. VALD-2: Progress of the Vienna Atomic Line Data Base. Astron. Astrophys. Suppl. Ser. 1999, 138, 119–133. [Google Scholar] [CrossRef]
- Ryabchikova, T.; Piskunov, N.; Kurucz, R.L.; Stempels, H.C.; Heiter, U.; Pakhomov, Y.; Barklem, P.S. A major upgrade of the VALD database. Phys. Scr. 2015, 90, 054005. [Google Scholar] [CrossRef]
- Kurucz, R.L.; Furenlid, I.; Brault, J.; Testerman, L. Solar Flux Atlas from 296 to 1300 nm; National Solar Observatory: Sunspot, NM, USA, 1984. [Google Scholar]
- Kramida, A.; Ralchenko, Yu.; Reader, J.; NIST ASD Team. NIST Atomic Spectra Database (Ver. 5.5.6); National Institute of Standards and Technology: Gaithersburg, MD, USA, 2018. Available online: https://physics.nist.gov/asd (accessed on 18 June 2018).
- Blackwell, D.E.; Ibbetson, P.A.; Petford, A.D.; Shallis, M.J. Precision measurement of relative oscillator strengths. IV–Attainment of 0.5 per cent accuracy: Fe I transitions from levels a5 D/0-4/ /0.00-0.12 eV/. Mon. Not. R. Astron. Soc. 1979, 186, 633–650. [Google Scholar] [CrossRef]
- Blackwell, D.E.; Petford, A.D.; Shallis, M.J. Precision measurement of relative oscillator strengths. VI—Measures of Fe I transitions from levels a5 F/1-5/ /0.86-1.01 eV/ with an accuracy of 0.5 per cent. Mon. Not. R. Astron. Soc. 1979, 186, 657–668. [Google Scholar] [CrossRef]
- Blackwell, D.E.; Petford, A.D.; Shallis, M.J.; Simmons, G.J. Precision Measurement of Relative Oscillator Strengths—Part Eight—Measures of Fe I Transitions from Levels A3F2-4/1.49-1.61EV with an Accuracy of 1%. Mon. Not. R. Astron. Soc. 1980, 191, 445. [Google Scholar] [CrossRef]
- Blackwell, D.E.; Petford, A.D.; Shallis, M.J.; Simmons, G.J. Precision measurement of relative oscillator strengths. IX—Measures of Fe I transitions from levels a5 P1-3 /2.18-2.28 eV/, a3 P2 /2.28 eV/, a3 P0,1 /2.49-2.42 eV/, z7 D1-5 0 /2.48-2.40 eV/ and a3 H4-6 /2.45-2.40 eV/. Mon. Not. R. Astron. Soc. 1982, 199, 43–51. [Google Scholar] [CrossRef]
- Blackwell, D.E.; Booth, A.J.; Haddock, D.J.; Petford, A.D.; Leggett, S.K. Measurement of the oscillator strengths of very weak 1 eV Fe I lines. Mon. Not. R. Astron. Soc. 1986, 220, 549–553. [Google Scholar] [CrossRef]
- Bard, A.; Kock, A.; Kock, M. Fe I oscillator strengths of lines of astrophysical interest. Astron. Astrophys. 1991, 248, 315–322. [Google Scholar]
- Bard, A.; Kock, M. Fe I oscillator strengths for lines with excitation energies between 3 and 7eV. Astron. Astrophys. 1994, 282, 1014–1020. [Google Scholar]
- Ruffoni, M.P.; Den Hartog, E.A.; Lawler, J.E.; Brewer, N.R.; Lind, K.; Nave, G.; Pickering, J.C. Fe I oscillator strengths for the Gaia-ESO survey. Mon. Not. R. Astron. Soc. 2014, 441, 3127–3136. [Google Scholar] [CrossRef]
- Den Hartog, E.A.; Ruffoni, M.P.; Lawler, J.E.; Pickering, J.C.; Lind, K.; Brewer, N.R. Fe I Oscillator Strengths for Transitions from High-lying Even-parity Levels. Astrophys. J. Suppl. Ser. 2014, 215, 23. [Google Scholar] [CrossRef]
- Belmonte, M.T.; Pickering, J.C.; Ruffoni, M.P.; Den Hartog, E.A.; Lawler, J.E.; Guzman, A.; Heiter, U. Fe I Oscillator Strengths for Transitions from High-lying Odd-parity Levels. Astrophys. J. Suppl. Ser. 2017, 848, 125. [Google Scholar] [CrossRef]
- Peterson, R.C.; Kurucz, R.L. New Fe I Level Energies and Line Identifications from Stellar Spectra. Astrophys. J. Suppl. Ser. 2015, 216, 1. [Google Scholar] [CrossRef]
- Peterson, R.C.; Kurucz, R.L.; Ayres, T.R. New Fe I Level Energies and Line Identifications from Stellar Spectra. II. Initial Results from New Ultraviolet Spectra of Metal-poor Stars. Astrophys. J. Suppl. Ser. 2017, 229, 23. [Google Scholar] [CrossRef]
- Pakhomov, Y.; Piskunov, N.; Ryabchikova, T. VALD3: Current Developments. In Stars: From Collapse to Collapse; Balega, Y.Y., Kudryavtsev, D.O., Romanyuk, I.I., Yakunin, I.A., Eds.; Astronomical Society of the Pacific Conference Series; Astronomical Society of the Pacific: San Francisco, CA, USA, 2017; Volume 510, p. 518. [Google Scholar]
- Dembczyński, J.; Ertmer, W.; Johann, U.; Penselin, S.; Stinner, P. Laser-Rf double-resonance studies of the hyperfine structure of metastable atomic states of 55Mn. Z. Phys. Hadrons Nucl. 1979, 291, 207–218. [Google Scholar] [CrossRef]
- Başar, G.; Başar, G.; Acar, G.; Öztürk, I.K.; Kröger, S. Hyperfine Structure Investigations of Mn I. Part I: Experimental and Theoretical Studies of the Hyperfine Structure in the Even Configurations. Phys. Scr. 2003, 67, 476. [Google Scholar] [CrossRef]
- Guthöhrlein, G.H.; Keller, H.P. Doppler-free laserspectroscopic investigations of hyperfine structure in the atomic cobalt spectrum. Z. Phys. D Atoms Mol. Clust. 1990, 17, 181–193. [Google Scholar] [CrossRef]
- Pickering, J.C. Measurements of the Hyperfine Structure of Atomic Energy Levels in Co I. Astrophys. J. Suppl. Ser. 1996, 107, 811. [Google Scholar] [CrossRef]
© 2018 by the authors. Licensee MDPI, Basel, Switzerland. This article is an open access article distributed under the terms and conditions of the Creative Commons Attribution (CC BY) license (http://creativecommons.org/licenses/by/4.0/).


