
Assembly Pathways and the Growth of Massive Early-Type Galaxies

Abstract
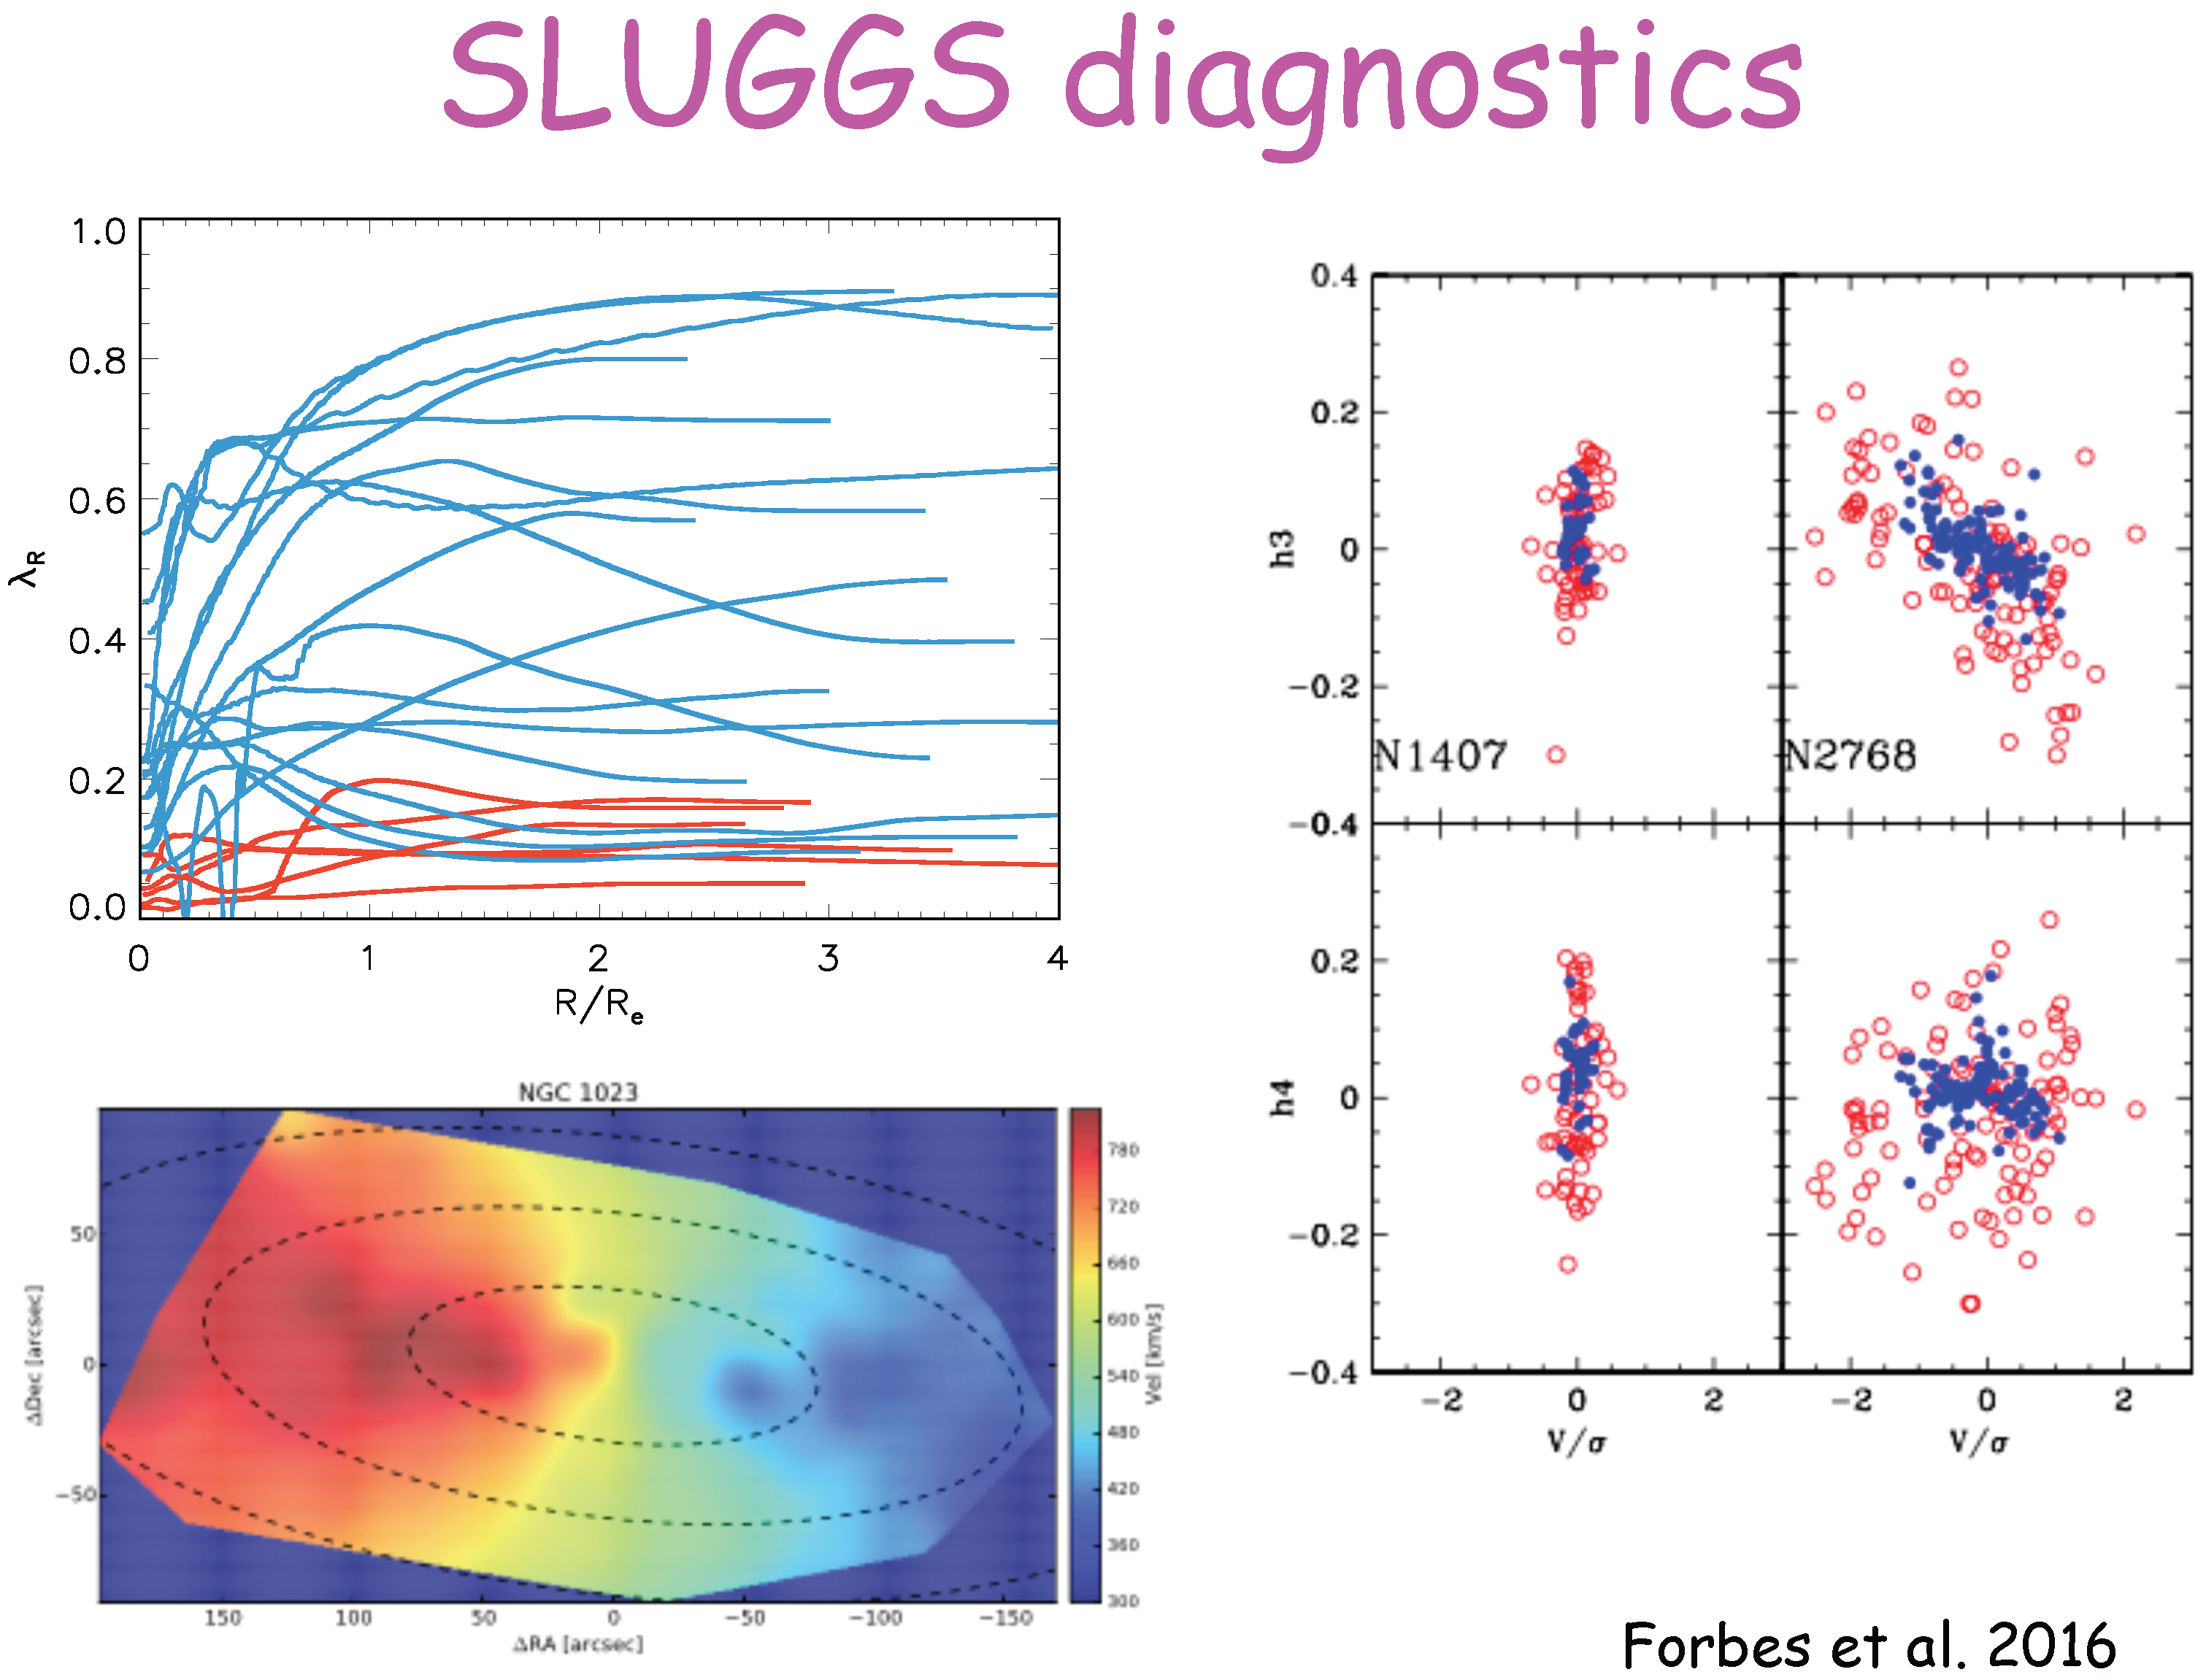
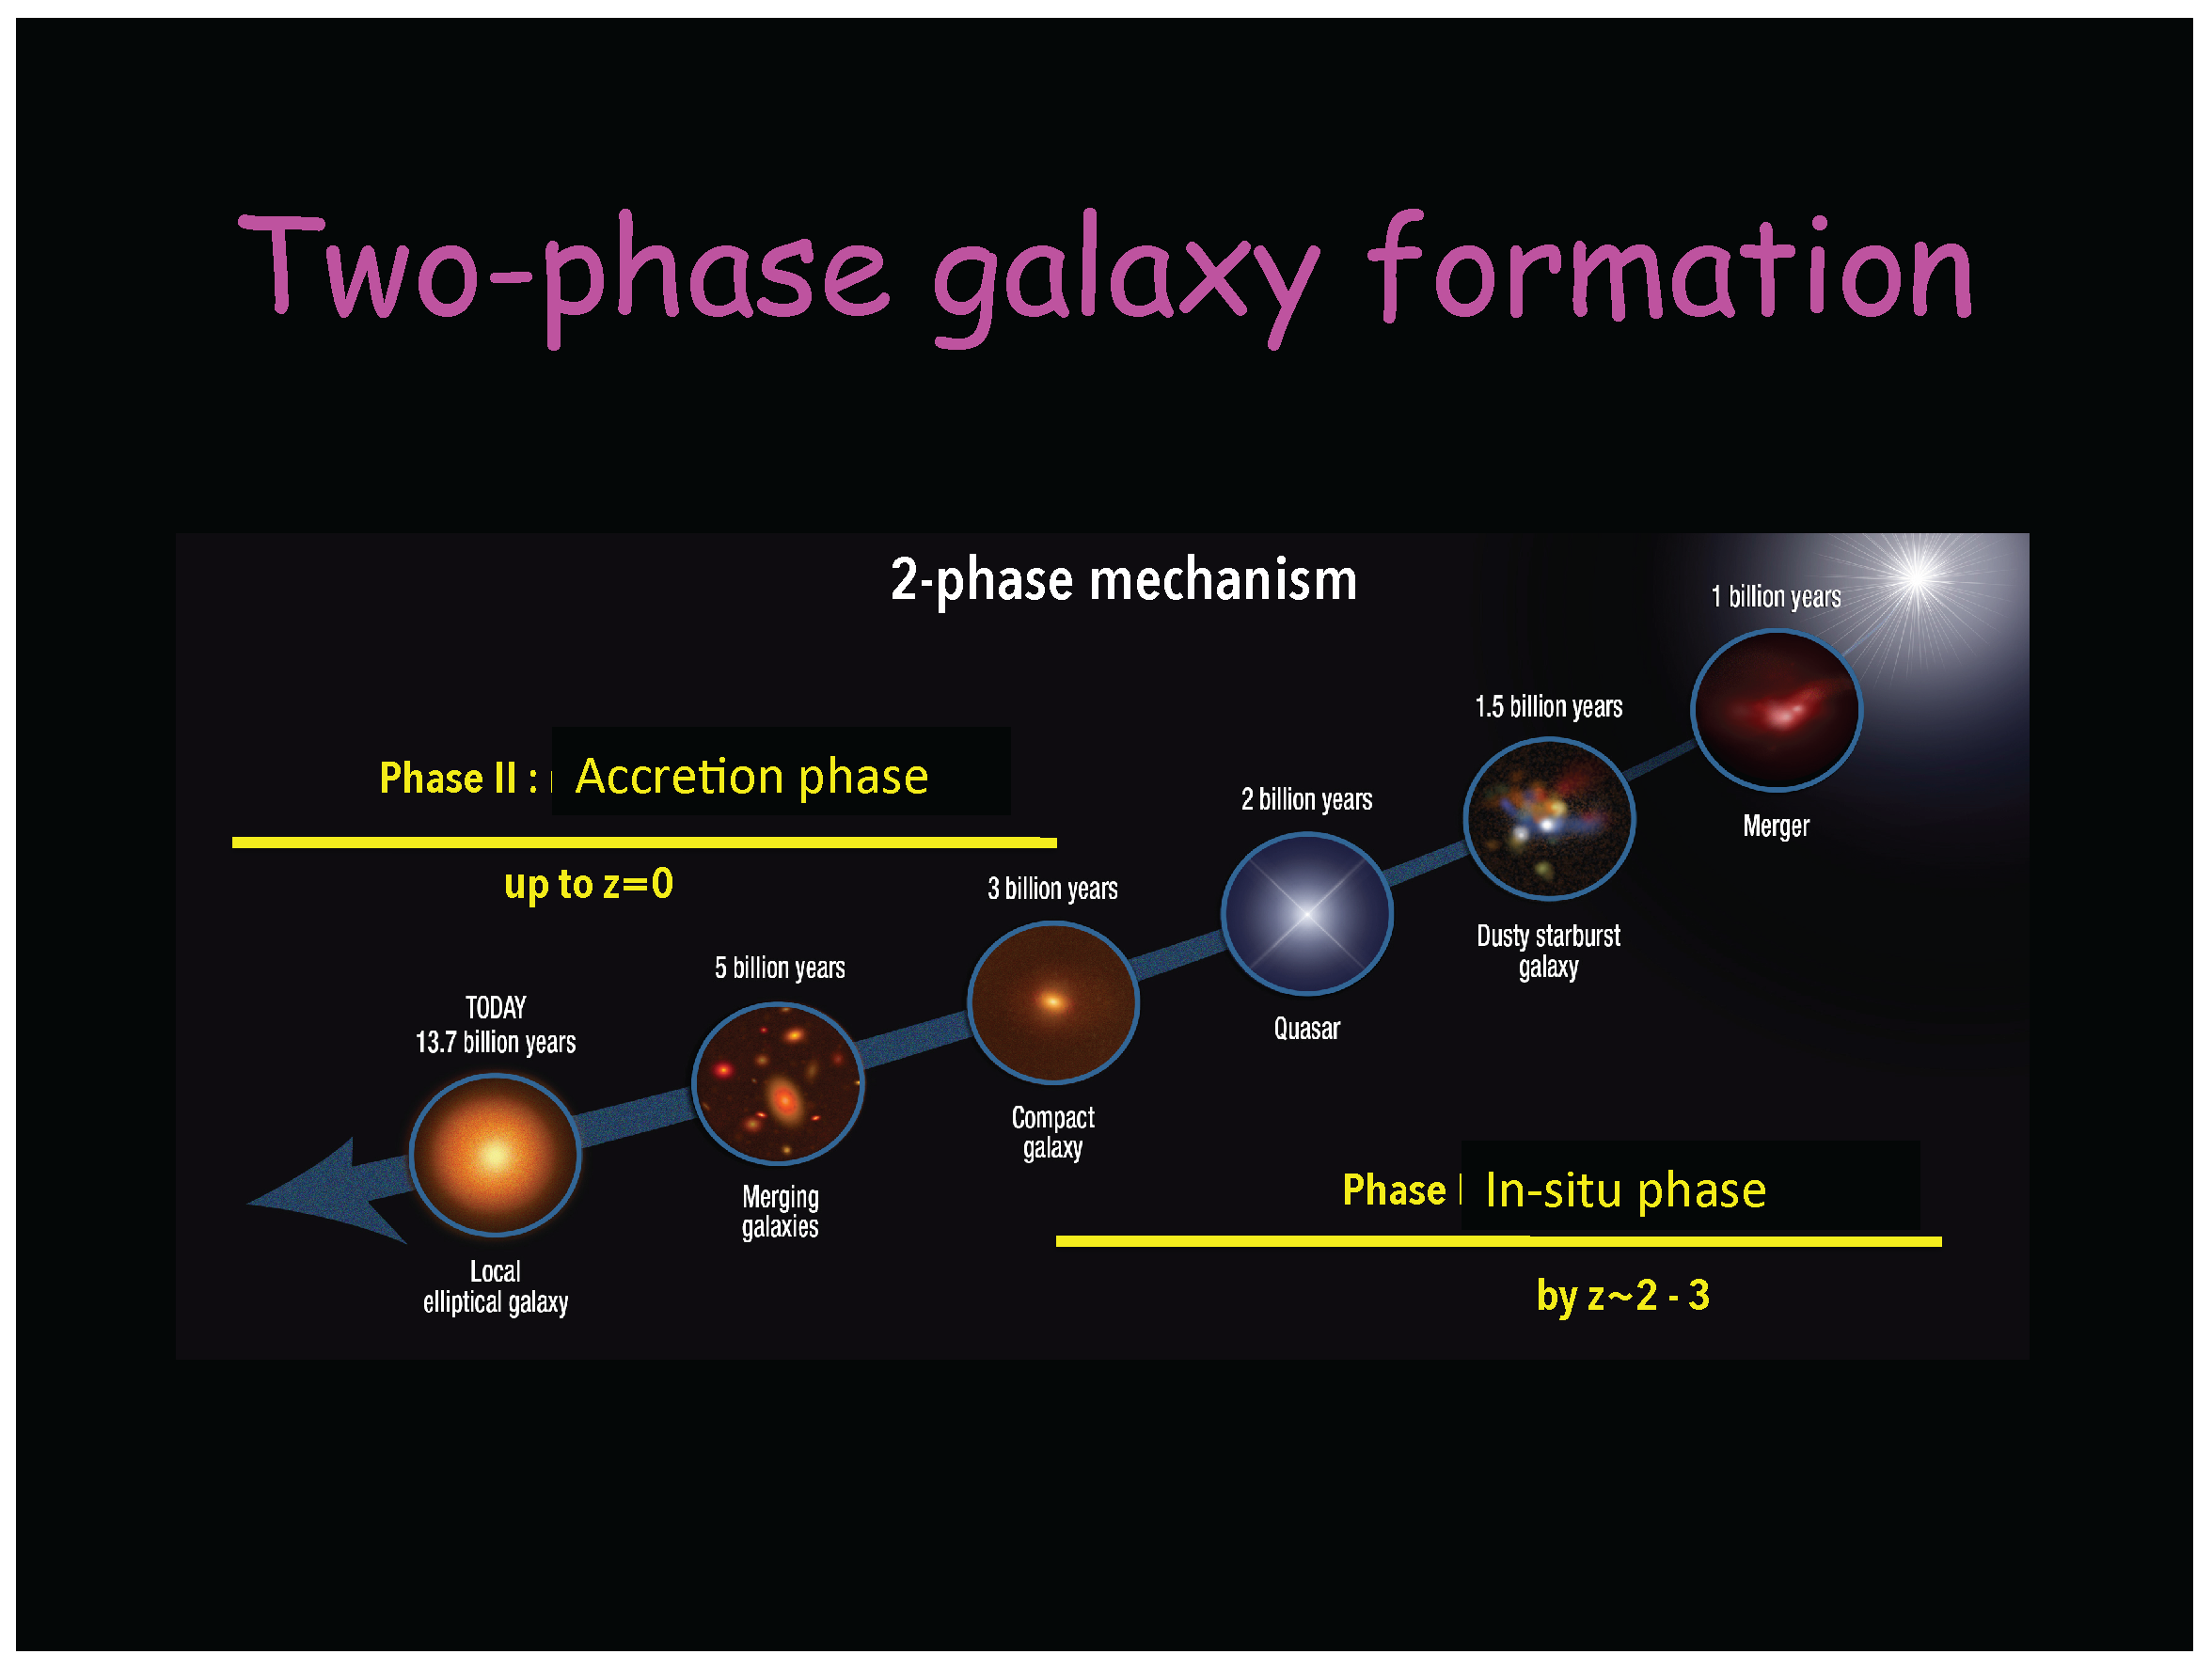
:1. Assembly Pathways
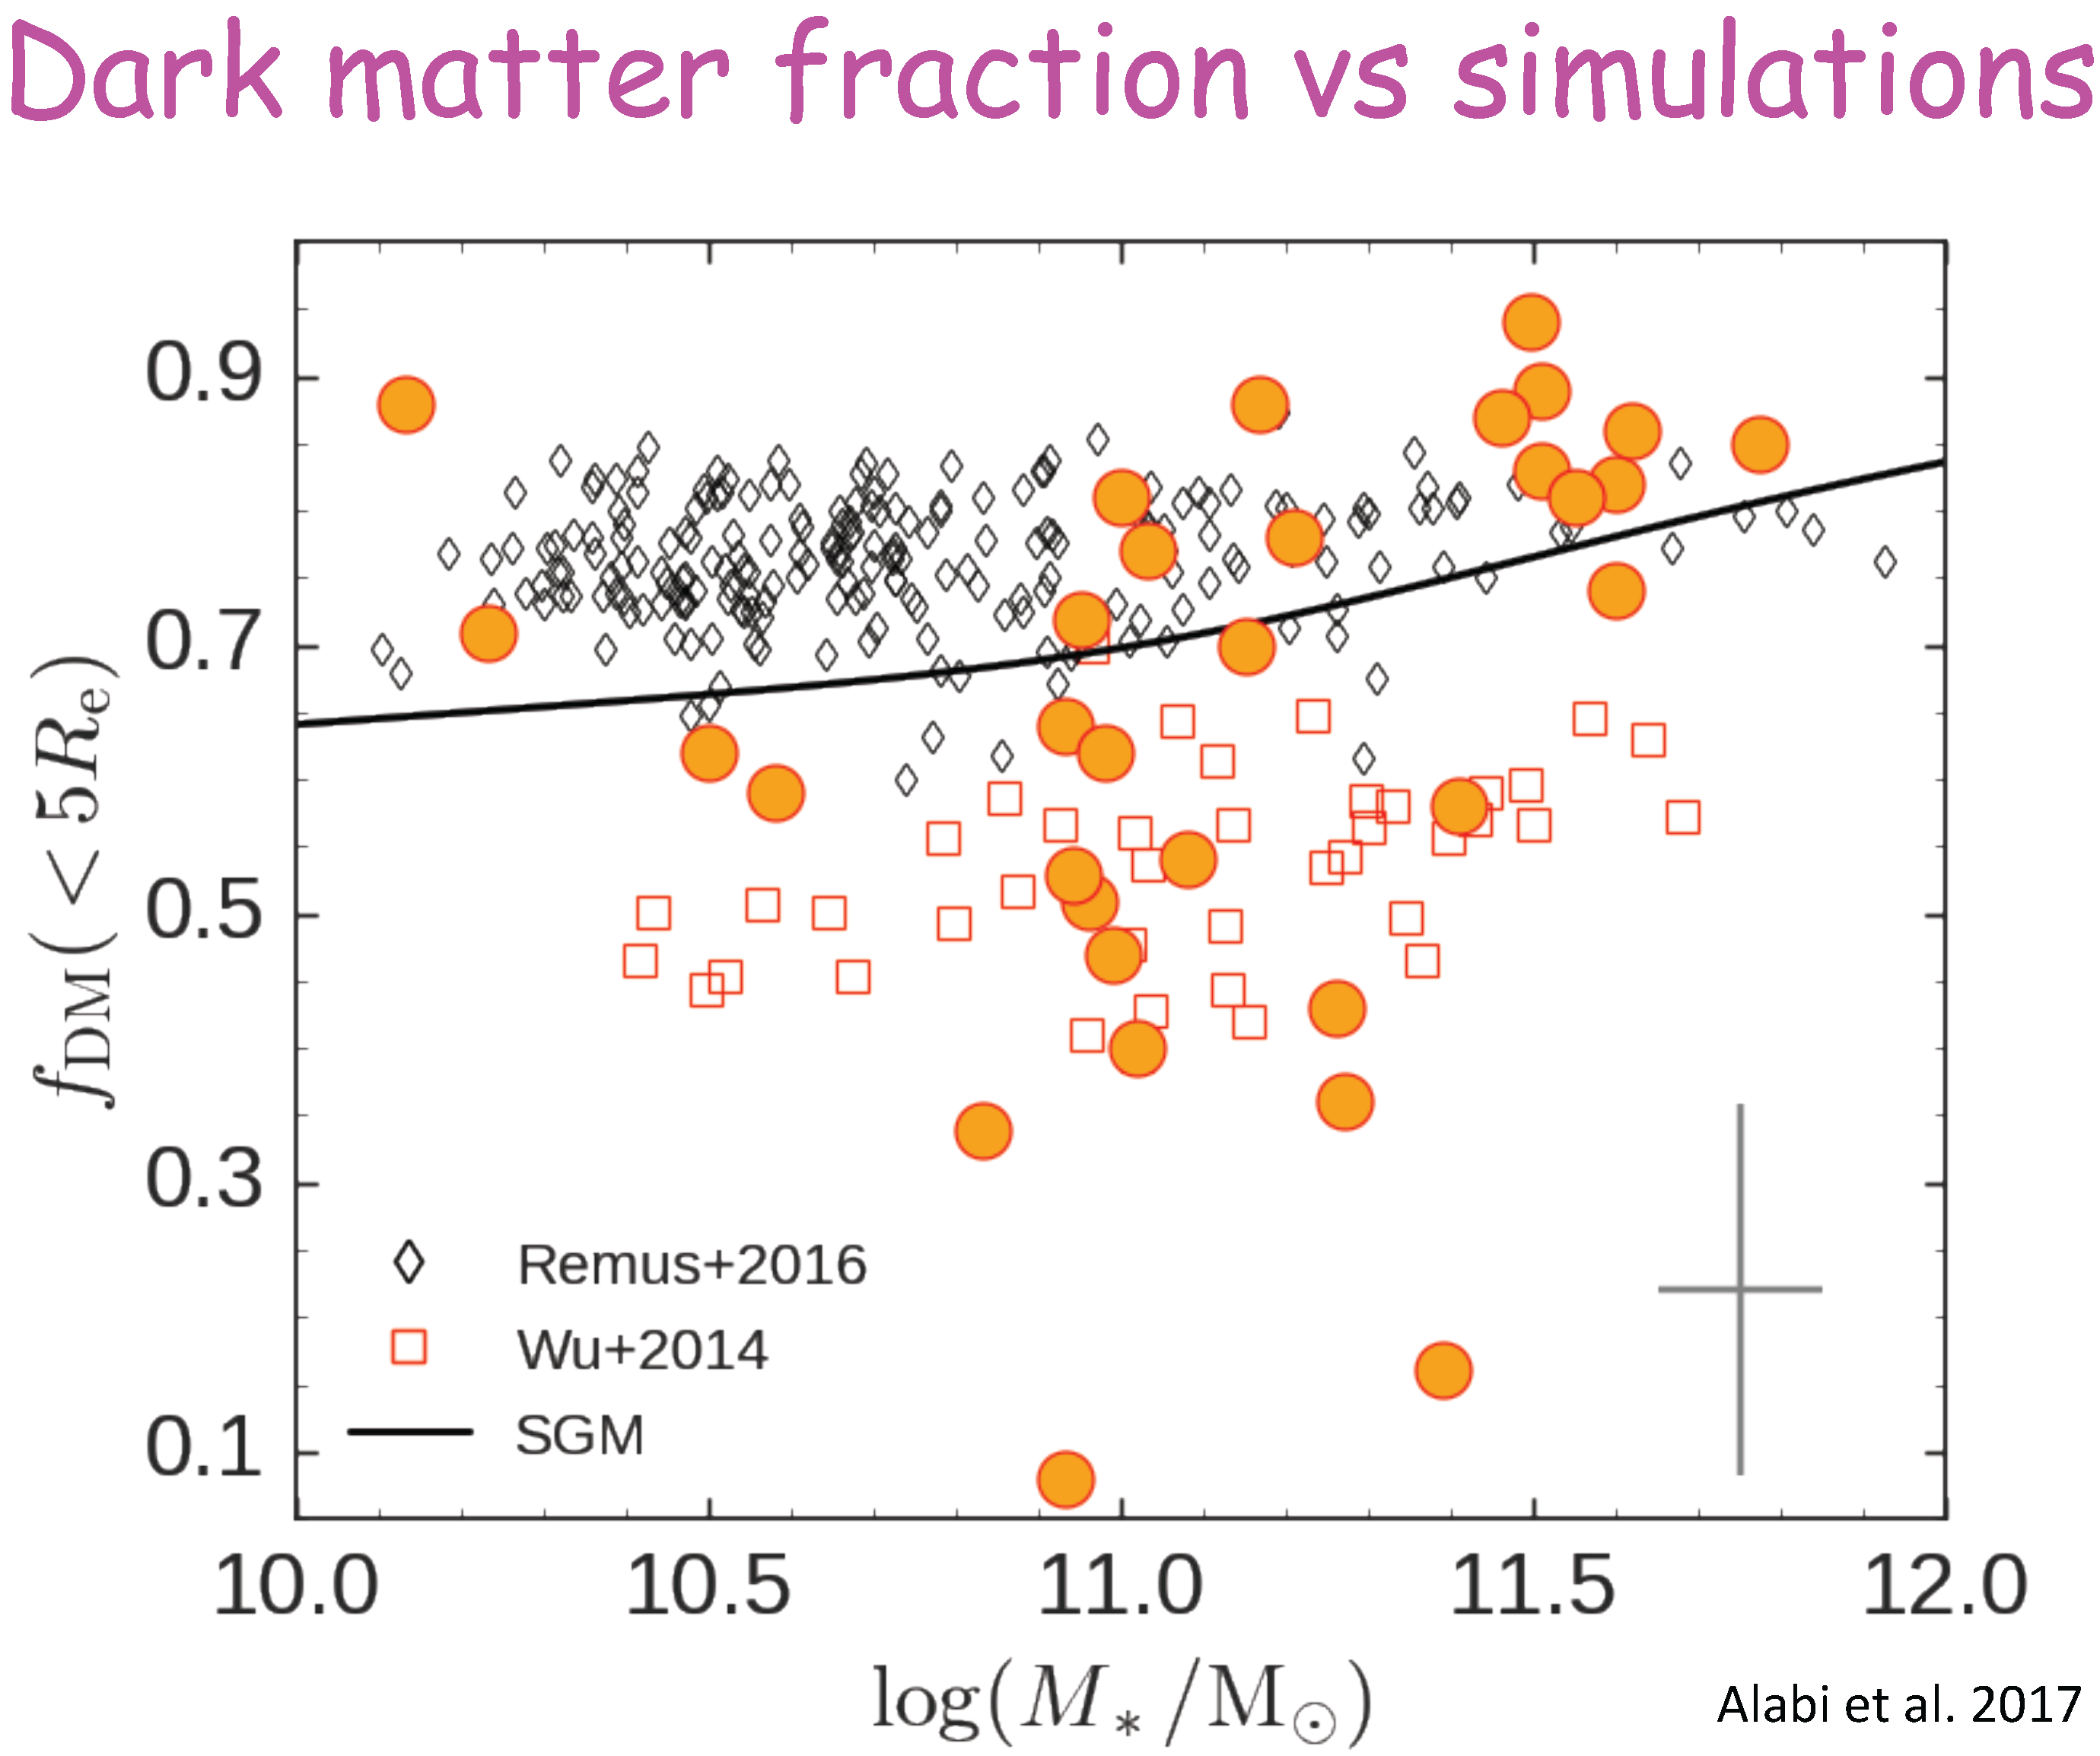
2. Dark Matter Content
- Mass-anisotropy degeneracy: There is a well-known degeneracy between the mass and orbits of the tracers. We have rederived the mass for both radial and tangential orbits, finding that although it makes a small 20% difference at high and low galaxy masses, the difference at log M ∼ 11 is negligible.
- Stellar IMF: We assumed a standard Kroupa IMF. Although there is evidence that the IMF gets steeper in higher mass galaxies (van Dokkum & Conroy 2012) [11], this would be expected to increase the baryonic mass within 5 R and hence drive down the DM fractions of the most massive galaxies—which is not seen in Figure 3.
- Peculiar effective radii: If the very low DM fraction galaxies have effective radii that deviate strongly from the standard size-mass relation this may explain their low DM fractions. This may be a partial answer to explaining the properties of some of the galaxies.
- Baryonic feedback/halo expansion: Feedback from an AGN may lead to adiabatic expansion pushing the DM from central regions to the outer halo regions. In principle, this would lower DM fractions. This effect, like that of a steeper IMF, should be most strong for the highest mass galaxies and is not seen.
- Environment: Halos that collapse early in a dense environment may be expected to have higher DM fractions. Of our very low DM galaxies, 2 are in the field and 3 are in groups—none are in clusters. More data are warranted to explore this possible environmental trend.
- Morphology: Lenticular galaxies may behave more like spiral galaxies than ellipticals, with different DM fractions. Of our very low DM galaxies, 2 are S0, 2 are clear elliptical and the other has an intermediate classification of E/S0. Like environment, more galaxies are needed to decide if morphology is a factor in low DM fractions.
- Self-interacting DM: Self-interacting DM (SIDM) is thought to lead to galaxies that are stellar dominated in their central regions. Unfortunately few models exist. Recently, Di Cintio et al. (2017) [12] modelled two log M ≤ 11 galaxies involving SIDM (see Figure 3). These galaxies have DM fractions of ∼55%, so lower than the Remus et al. cold DM models (and similar to the Wu et al. models) but still somewhat higher than our very low DM fraction galaxies. SIDM remains a possible/partial answer which requires further investigation.
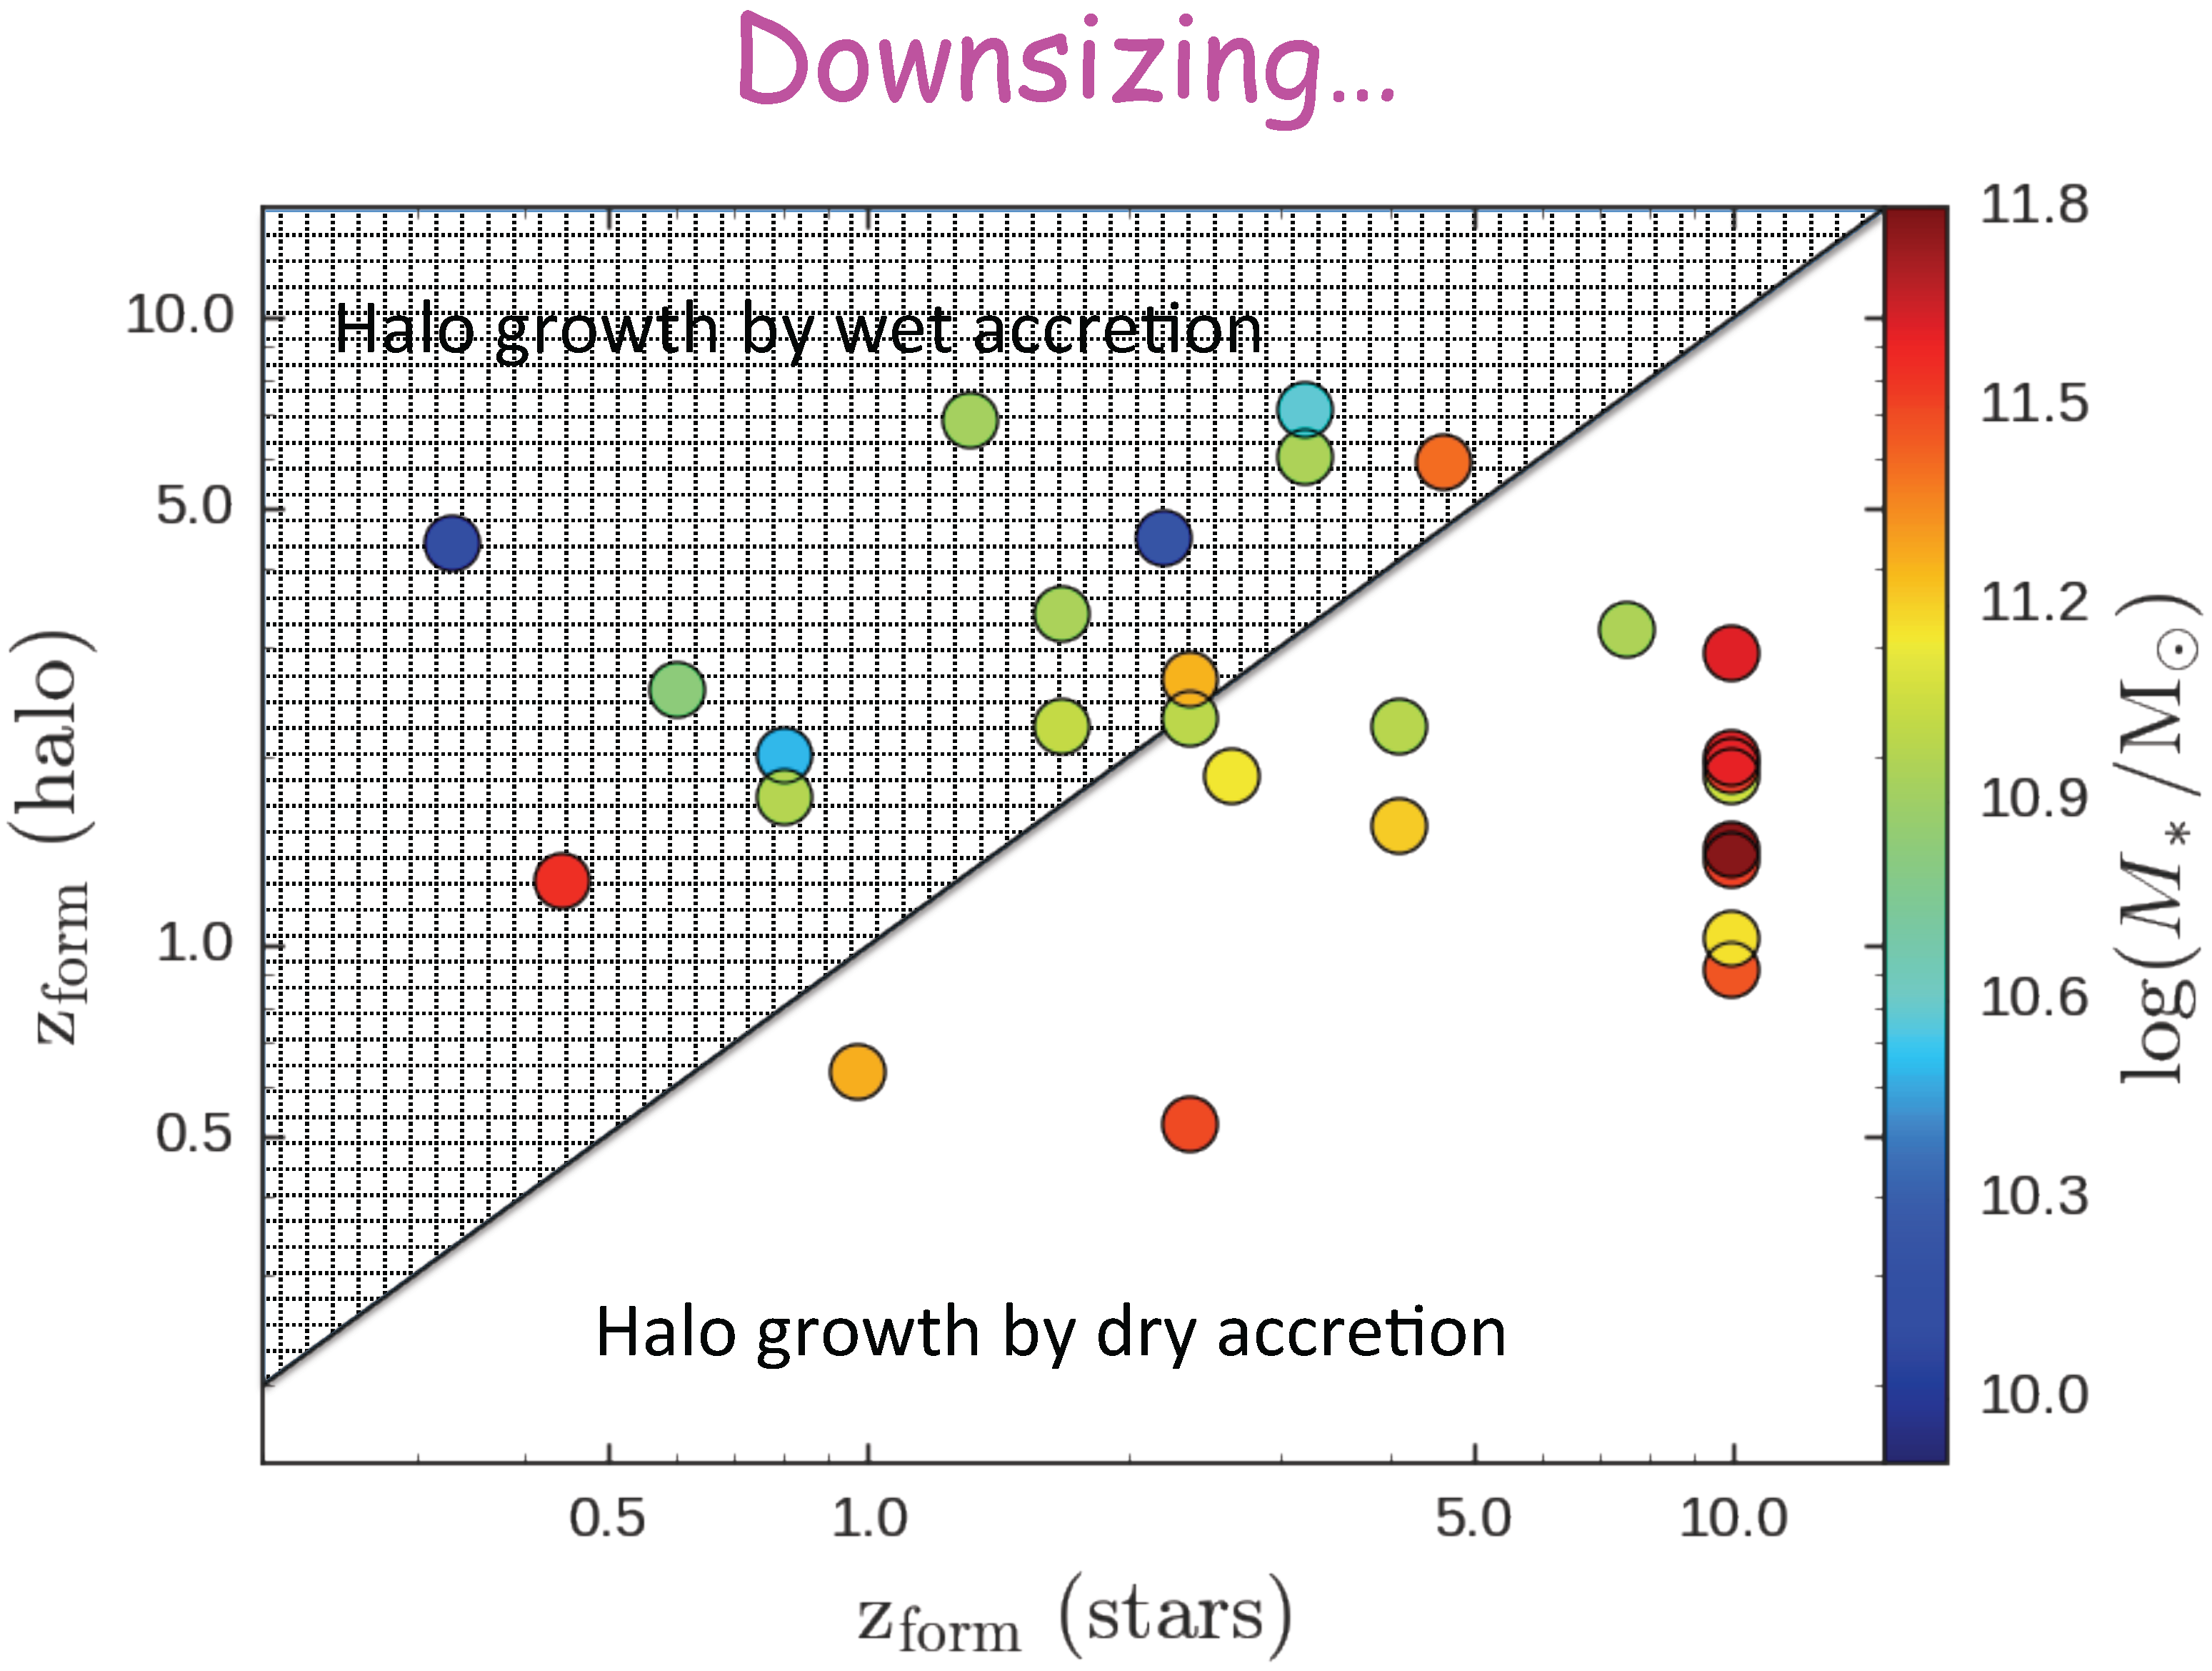
3. Halo Growth
4. Conclusions
Acknowledgments
Conflicts of Interest
References
- Brodie, J.P.; Romanowsky, A.J.; Strader, J.; Forbes, D.A.; Foster, C.; Jennings, Z.G.; Pastorello, N.; Pota, V.; Usher, C.; Blom, C.; et al. The SAGES Legacy Unifying Globulars and GalaxieS Survey (SLUGGS): Sample Definition, Methods, and Initial Results. Astrophys. J. 2014, 796. [Google Scholar] [CrossRef]
- Naab, T.; Oser, L.; Emsellem, E.; Cappellari, M.; Krajnović, D.; McDermid, R.M.; Alatalo, K.; Bayet, E.; Blitz, L.; Bois, M.; et al. The ATLAS3D project—XXV. Two-dimensional kinematic analysis of simulated galaxies and the cosmological origin of fast and slow rotators. Mon. Not. R. Astron. Soc. 2014, 444, 3357–3387. [Google Scholar] [CrossRef]
- Forbes, D.A.; Romanowsky, A.J.; Pastorello, N.; Foster, C.; Brodie, J.P.; Strader, J.; Usher, C.; Pota, V. The SLUGGS survey: The assembly histories of individual early-type galaxies. Mon. Not. R. Astron. Soc. 2016, 457, 1242–1256. [Google Scholar] [CrossRef]
- Forbes, D.A.; Alabi, A.; Brodie, J.P.; Romanowsky, A.J.; Strader, J.; Foster, C.; Usher, C.; Spitler, L.; Bellstedt, S.; Pastorello, N.; et al. The SLUGGS Survey: A Catalog of Over 4000 Globular Cluster Radial Velocities in 27 Nearby Early-type Galaxies. Astron. J. 2017, 153, 114. [Google Scholar] [CrossRef]
- Watkins, L.L.; Evans, N.W.; An, J.H. The masses of the Milky Way and Andromeda galaxies. Mon. Not. R. Astron. Soc. 2010, 406, 264–278. [Google Scholar] [CrossRef]
- Alabi, A.; Forbes, D.A.; Romanowsky, A.J.; Brodie, J.P.; Strader, J.; Janz, J.; Pota, V.; Pastorello, N.; Usher, C.; Spitler, L.R.; et al. The SLUGGS survey: The mass distribution in early-type galaxies within five effective radii and beyond. Mon. Not. R. Astron. Soc. 2016, 460, 3838–3860. [Google Scholar] [CrossRef]
- Alabi, A.; Forbes, D.A.; Romanowsky, A.J.; Brodie, J.P.; Strader, J.; Janz, J.; Usher, C.; Spitler, L.R.; Bellstedt, S.; Ferré-Mateu, A. The SLUGGS Survey: Dark matter fractions at large radii and assembly epochs of early-type galaxies from globular cluster kinematics. Mon. Not. R. Astron. Soc. 2017, in press. [Google Scholar] [CrossRef]
- Remus, R.-S.; Dolag, K.; Naab, T.; Burkert, A.; Hirschmann, M.; Hoffmann, T.L.; Johansson, P.H. The co-evolution of total density profiles and central dark matter fractions in simulated early-type galaxies. Mon. Not. R. Astron. Soc. 2017, 464, 3742–3756. [Google Scholar] [CrossRef]
- Wu, X.; Gerhard, O.; Naab, T.; Oser, L.; Martinez-Valpuesta, I.; Hilz, M.; Churazov, E.; Lyskova, N. The mass and angular momentum distribution of simulated massive early-type galaxies to large radii. Mon. Not. R. Astron. Soc. 2014, 438, 2701–2715. [Google Scholar] [CrossRef]
- Cappellari, M.; Scott, N.; Alatalo, K.; Blitz, L.; Bois, M.; Bournaud, F.; Bureau, M.; Crocker, A.F.; Davies, R.L.; Davis, T.A.; et al. The ATLAS3D projec—XV. Benchmark for early-type galaxies scaling relations from 260 dynamical models: mass-to-light ratio, dark matter, Fundamental Plane and Mass Plane. Mon. Not. R. Astron. Soc. 2013, 432, 1709–1741. [Google Scholar] [CrossRef]
- Dokkum, P.G.; Conroy, C. The Stellar Initial Mass Function in Early-type Galaxies from Absorption Line Spectroscopy. I. Data and Empirical Trends. Astrophys. J. 2012, 760, 70. [Google Scholar] [CrossRef]
- Di Cintio, A.; Tremmel, M.; Governato, F.; Pontzen, A.; Zavala, J.; Bastidas Fry, A.; Brooks, A.; Vogelsberger, M. A rumble in the dark: Signatures of self-interacting dark matter in Super-Massive Black Hole dynamics and galaxy density profiles. Mon. Not. R. Astron. Soc. 2017, submitted. [Google Scholar] [CrossRef]


© 2017 by the author. Licensee MDPI, Basel, Switzerland. This article is an open access article distributed under the terms and conditions of the Creative Commons Attribution (CC BY) license (http://creativecommons.org/licenses/by/4.0/).
Share and Cite
Forbes, D. Assembly Pathways and the Growth of Massive Early-Type Galaxies. Galaxies 2017, 5, 27. https://doi.org/10.3390/galaxies5020027
Forbes D. Assembly Pathways and the Growth of Massive Early-Type Galaxies. Galaxies. 2017; 5(2):27. https://doi.org/10.3390/galaxies5020027
Chicago/Turabian StyleForbes, Duncan. 2017. "Assembly Pathways and the Growth of Massive Early-Type Galaxies" Galaxies 5, no. 2: 27. https://doi.org/10.3390/galaxies5020027
APA StyleForbes, D. (2017). Assembly Pathways and the Growth of Massive Early-Type Galaxies. Galaxies, 5(2), 27. https://doi.org/10.3390/galaxies5020027