Article

Assembly Pathways and the Growth of Massive Early-Type Galaxies

Centre for Astrophysics & Supercomputing, Swinburne University, Hawthorn VIC 3122, Australia
Galaxies 2017, 5(2), 27; https://doi.org/10.3390/galaxies5020027
Submission received: 20 April 2017 / Revised: 26 May 2017 / Accepted: 1 June 2017 / Published: 7 June 2017
(This article belongs to the Special Issue On the Origin (and Evolution) of Baryonic Galaxy Halos)

Abstract

:
Based on data from the SAGES Legacy Unifying Globulars and GalaxieS (SLUGGS) survey, I present results on the assembly pathways, dark matter content and halo growth of massive early-type galaxies. Using galaxy starlight information we find that such galaxies had an early dissipative phase followed by a second phase of halo growth from largely minor mergers (and in rare cases major mergers). Thus our result fits in well with the two-phase scenario of galaxy formation. We also used globular cluster radial velocities to measure the enclosed mass within 5 effective radii. The resulting dark matter fractions reveal a few galaxies with very low dark matter fractions that are not captured in the latest cosmological models. Multiple solutions are possible, but none yet is convincing. Translating dark matter fractions into epochs of halo assembly, we show that low mass galaxies tend to grow via gas-rich accretion, while high mass galaxies grow via gas-poor mergers.

1. Assembly Pathways

The SAGES Legacy Unifying Globulars and GalaxieS (SLUGGS) survey (Brodie et al. 2014) [1] is studying 25 nearby, massive (log stellar mass ∼11), early-type galaxies. The survey uses the DEIMOS multi-slit instrument on the Keck II telescope to obtain spectra of both the underlying starlight and surrounding globular clusters (GCs). The data have the advantage of reaching out to ∼3 R e (effective radii) for starlight and ∼10 R e for GCs. From this data, we can probe the dark matter content, assembly pathways and halo growth of these galaxies.
A key aim of near-field cosmology is to determine the assembly history of an individual galaxy. The hydro-zoom cosmological simulations of Naab et al. (2014) [2] showed that the assembly histories of massive galaxies are preserved in the 2D kinematics of present day galaxies. In the Naab et al. simulations massive galaxies form in two phases—the first in-situ phase at high redshift results in a compact, massive object (a red nugget); the second phase after redshift 2 is dominated by accretion of ex-situ stars i.e., formed in external galaxies. In this picture low mass galaxies have a high in-situ formed fraction, whereas high mass galaxies are largely built by accretion. A schematic of this two-phase galaxy formation is given in Figure 1.
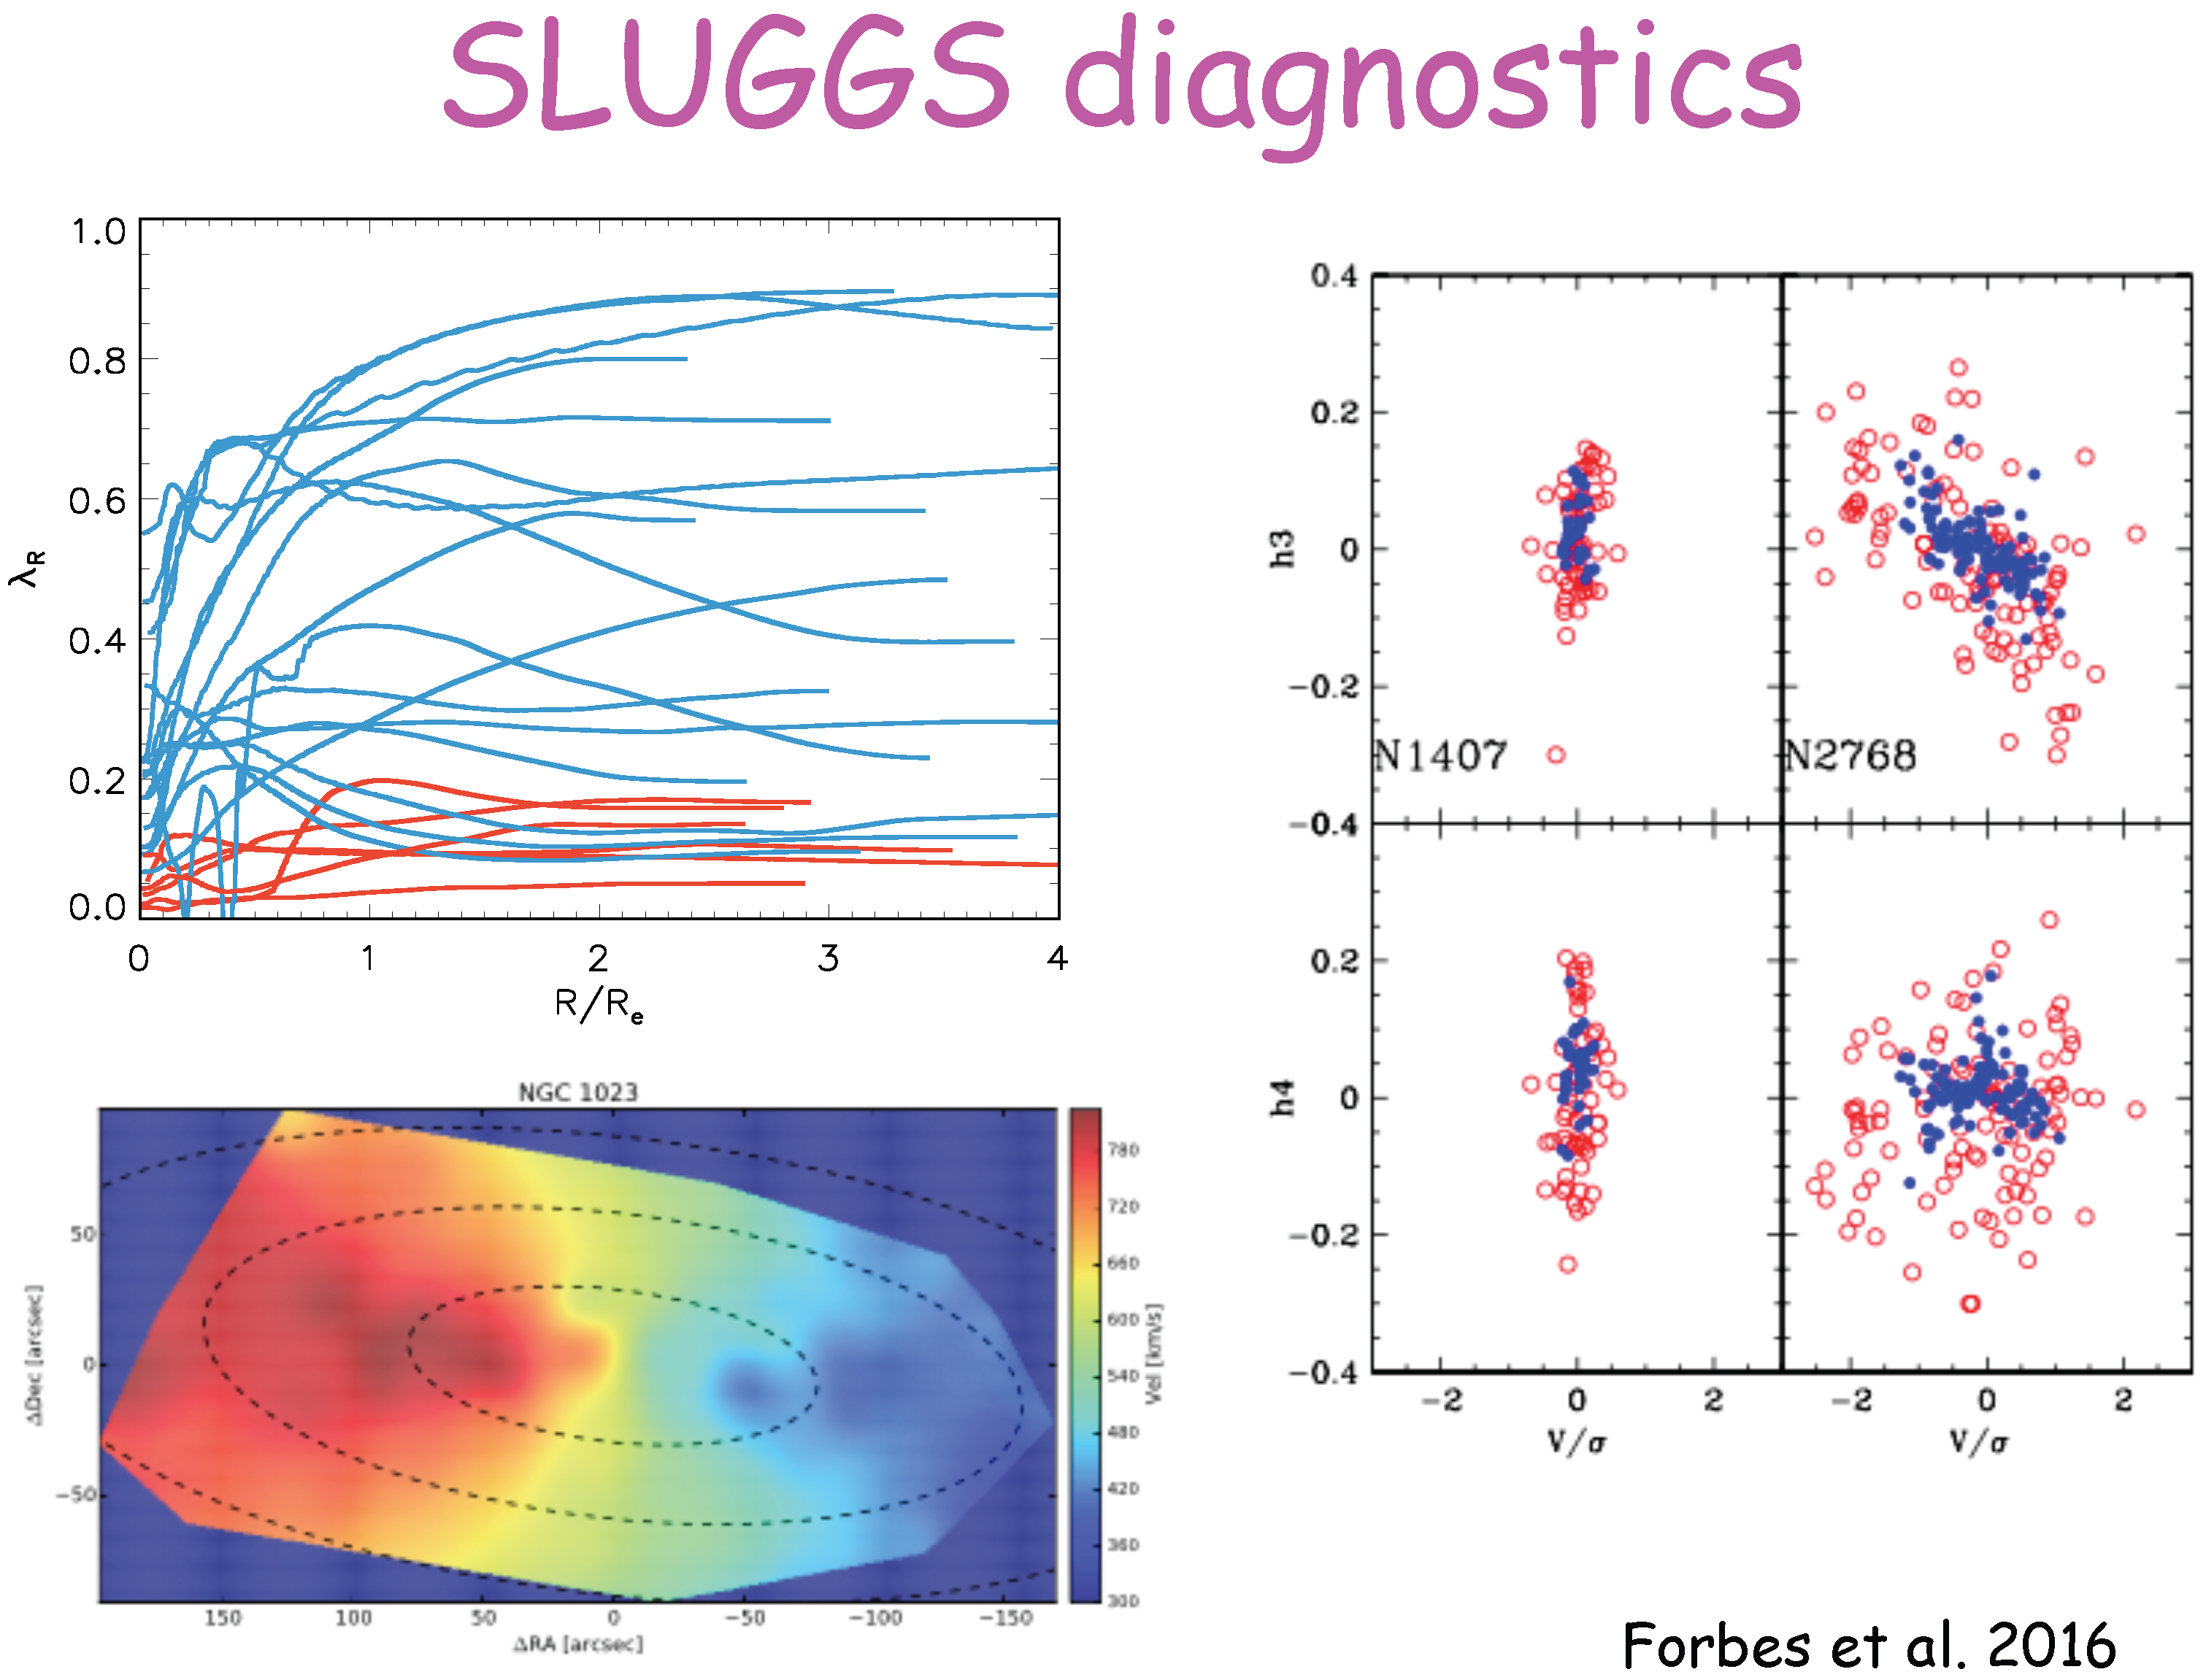
Naab et al. used 3 kinematic diagnostics to classify galaxies into one of six assembly pathways. The SLUGGS starlight data provides similar diagnostics out to 3 R e . They are radial lambda (spin) profiles, 2D kinematic maps and higher order velocity moments h3 and h4 vs V/ σ . Using these 3 diagnostics (see Figure 2 for examples) we have classified each galaxy into a Nabb et al. assembly class. We find the most common pathway (14/24) to be class A—these reveal disk-like kinematics with slowly rotating stellar halos whose mass growth is due to minor mergers. Three galaxies are classified as class E which show disturbed kinematics, including rolling, double sigma profile and a decoupled core. Galaxies with high accretion fractions tend to be old with shallow metallicity gradients. For further details see Forbes et al. (2016) [3].

2. Dark Matter Content

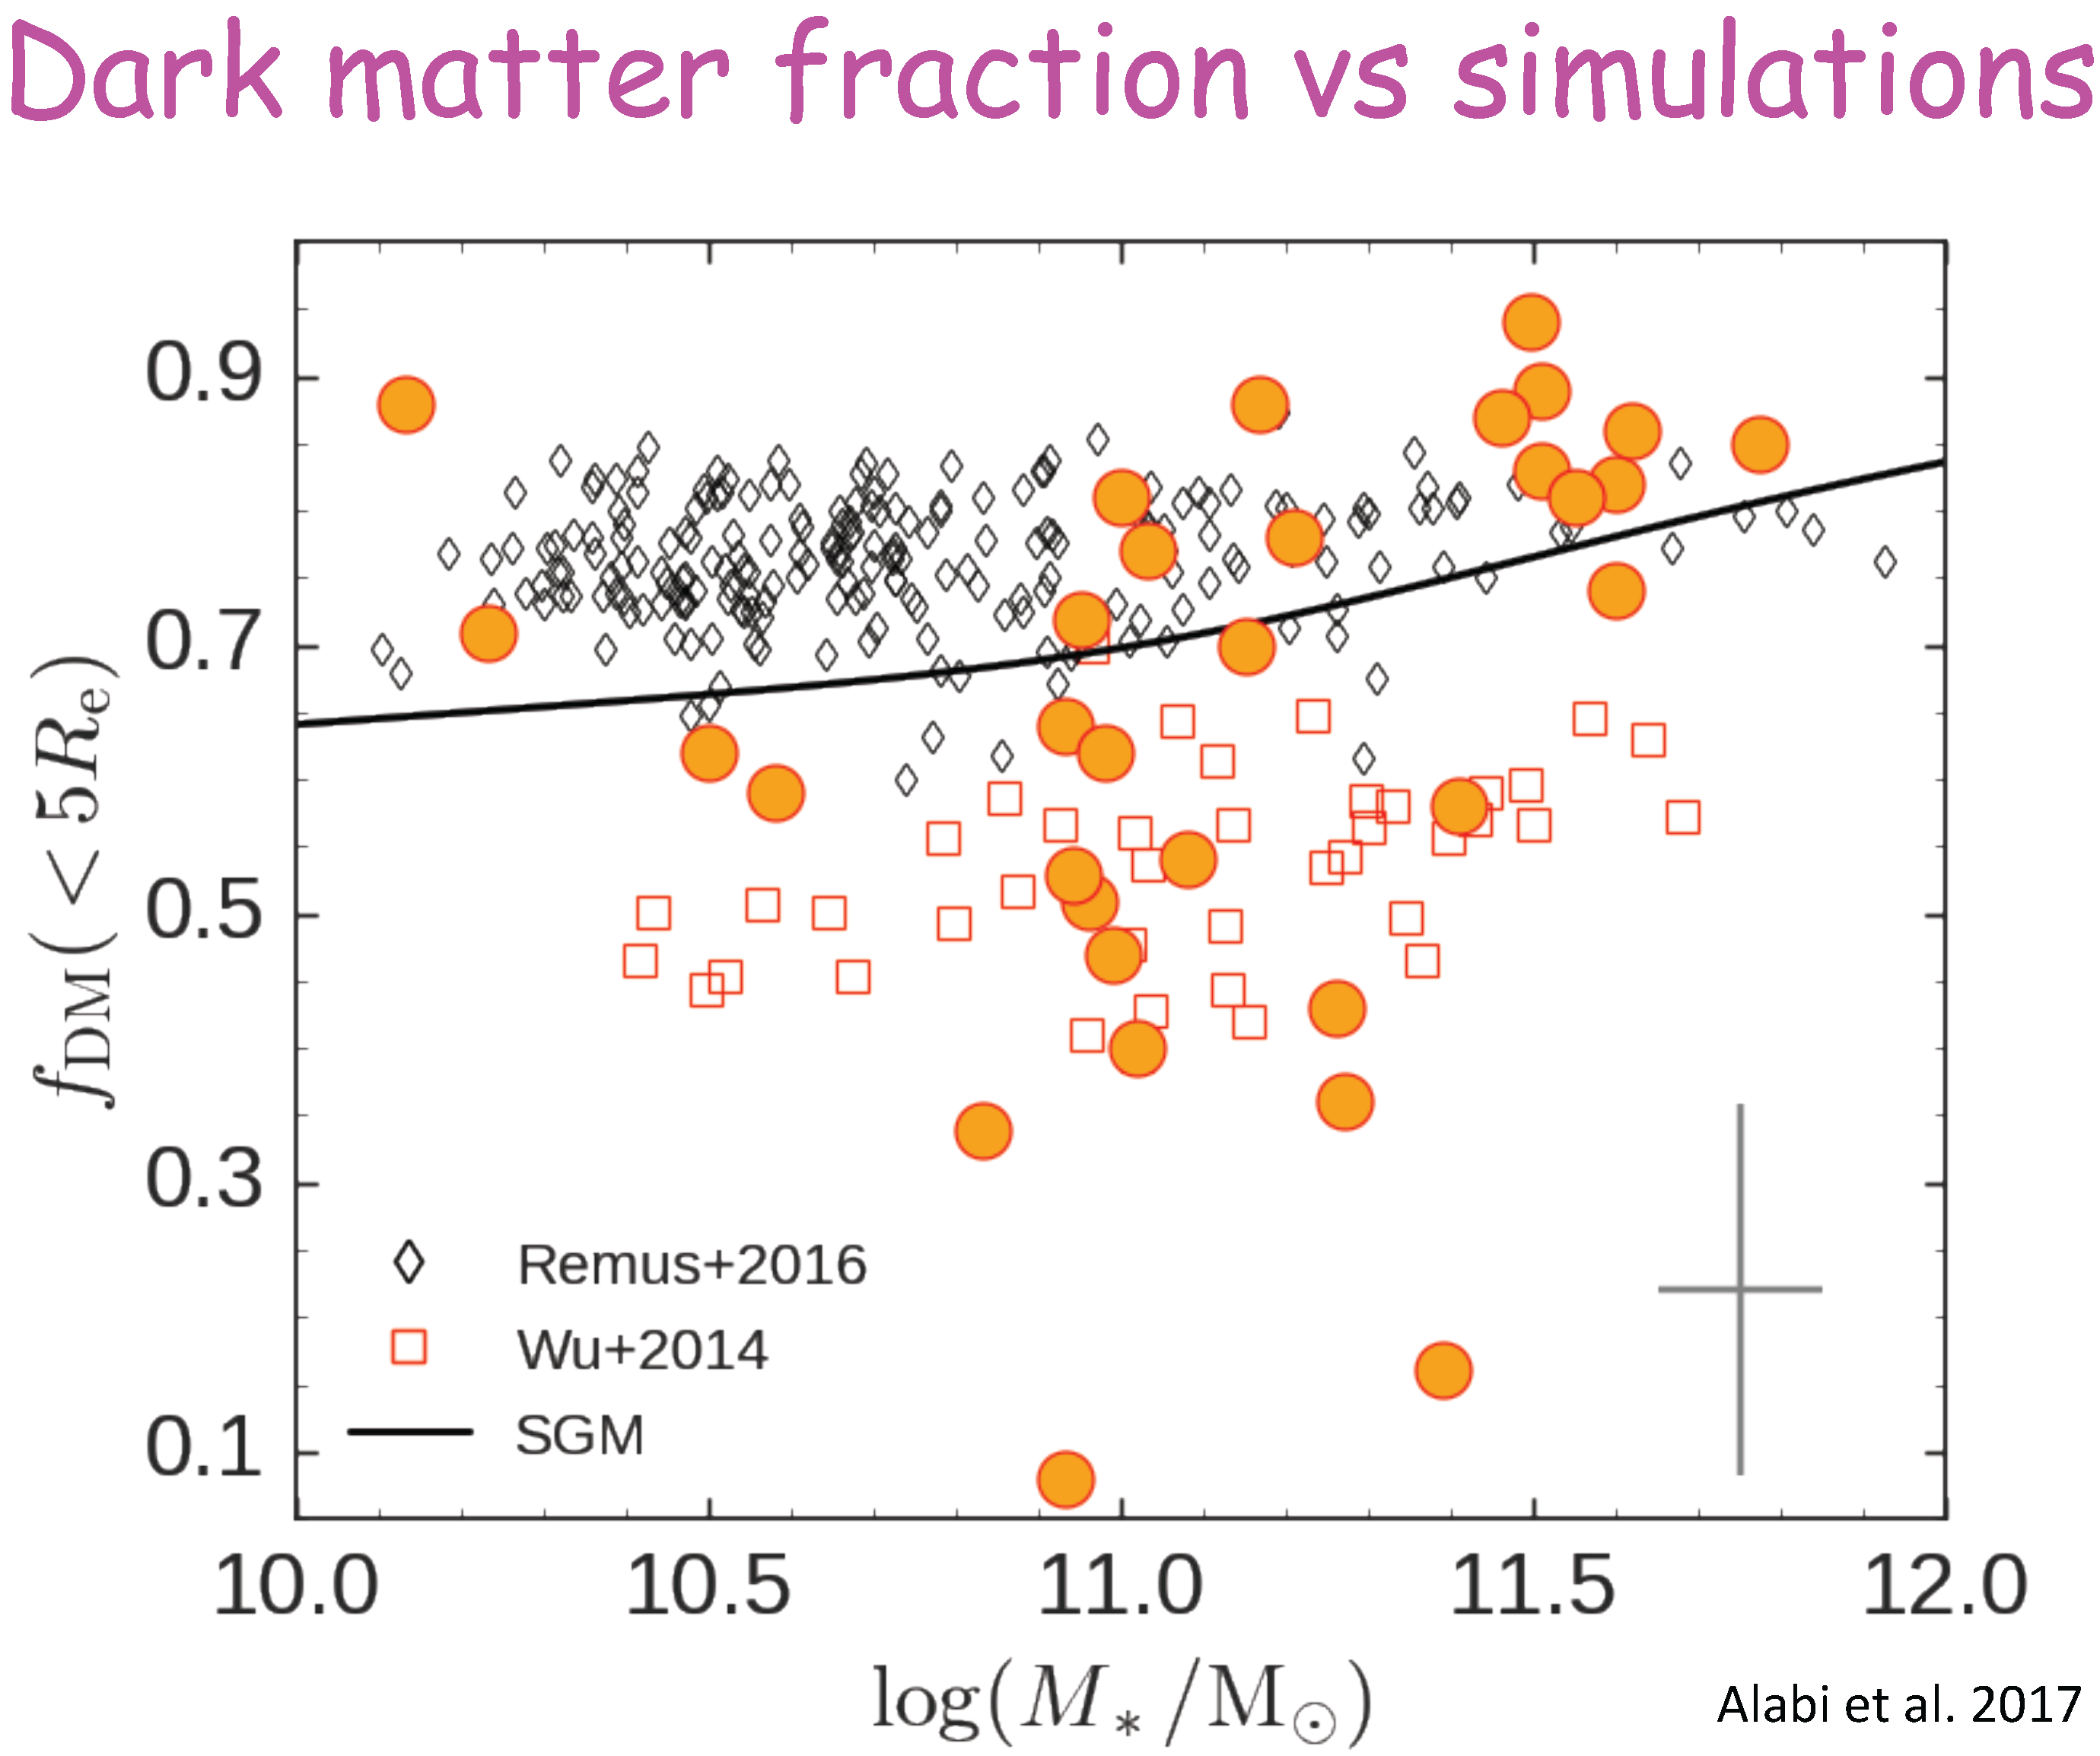
The SLUGGS survey has now produced over 4000 high quality GC radial velocities out to ∼10 R e (Forbes et al. 2017) [4]. Using these as discrete tracers of the galaxy halo, we employ the Tracer Mass Estimator (TME) of Watkins et al. (2010) [5] to estimate the enclosed mass within 5 R e for the SLUGGS galaxies and a few early-type galaxies using literature GC velocities. We correct the mass estimates for bulk rotation of the GC system, and make assumptions for the galaxy potential, tracer density slope and anisotropy (here we assume isotropic orbits). Further details can be found in Alabi et al. (2016, 2017) [6,7]. We find good agreement with other mass tracers such as planetary nebulae and X-ray emission (Alabi et al. 2016) [6]. From the enclosed total mass within 5 R e we subtract the stellar mass (assuming a Kroupa IMF) to calculate the dark matter fraction within 5 R e . In Figure 3 we show the derived dark matter fractions within 5 R e vs galaxy stellar mass from our analysis (Alabi et al. 2017) [7] and two sets of cosmological simulations. The simulations are with (Remus et al. 2017) [8] and without (Wu et al. 2014) [9] AGN feedback. The plot also shows a simple galaxy model based on galaxy scaling relations and an NFW dark matter halo. This model lies between the two simulations. Although some galaxies are consistent with the model predictions, we find a large range to dark matter fractions that is not captured by the models. A similar trend for low dark matter fractions in galaxies with stellar masses just below log M = 11 was seen in the ATLAS3D data within ∼1 R e by Cappellari et al. (2013) [10].
A number of possible solutions to explain the very low dark matter fractions we observe include:
  • Mass-anisotropy degeneracy: There is a well-known degeneracy between the mass and orbits of the tracers. We have rederived the mass for both radial and tangential orbits, finding that although it makes a small 20% difference at high and low galaxy masses, the difference at log M ∼ 11 is negligible.
  • Stellar IMF: We assumed a standard Kroupa IMF. Although there is evidence that the IMF gets steeper in higher mass galaxies (van Dokkum & Conroy 2012) [11], this would be expected to increase the baryonic mass within 5 R e and hence drive down the DM fractions of the most massive galaxies—which is not seen in Figure 3.
  • Peculiar effective radii: If the very low DM fraction galaxies have effective radii that deviate strongly from the standard size-mass relation this may explain their low DM fractions. This may be a partial answer to explaining the properties of some of the galaxies.
  • Baryonic feedback/halo expansion: Feedback from an AGN may lead to adiabatic expansion pushing the DM from central regions to the outer halo regions. In principle, this would lower DM fractions. This effect, like that of a steeper IMF, should be most strong for the highest mass galaxies and is not seen.
  • Environment: Halos that collapse early in a dense environment may be expected to have higher DM fractions. Of our very low DM galaxies, 2 are in the field and 3 are in groups—none are in clusters. More data are warranted to explore this possible environmental trend.
  • Morphology: Lenticular galaxies may behave more like spiral galaxies than ellipticals, with different DM fractions. Of our very low DM galaxies, 2 are S0, 2 are clear elliptical and the other has an intermediate classification of E/S0. Like environment, more galaxies are needed to decide if morphology is a factor in low DM fractions.
  • Self-interacting DM: Self-interacting DM (SIDM) is thought to lead to galaxies that are stellar dominated in their central regions. Unfortunately few models exist. Recently, Di Cintio et al. (2017) [12] modelled two log M ≤ 11 galaxies involving SIDM (see Figure 3). These galaxies have DM fractions of ∼55%, so lower than the Remus et al. cold DM models (and similar to the Wu et al. models) but still somewhat higher than our very low DM fraction galaxies. SIDM remains a possible/partial answer which requires further investigation.
To summarise, a non-standard IMF and AGN driven feedback are unlikely causes of low DM fractions in log M ≤ 11 galaxies as they should have a stronger influence on more massive galaxies. Variations in the galaxy size-mass relation may be a partial solution. A larger sample will however allow us to better test for trends with environment and morphology, which are unclear currently due to small sample size in the key mass range. A larger sample will also allow us to better define the stellar mass associated with the minimum DM fraction and to constrain future SIDM models (which remain as a possible solution to the problem).

3. Halo Growth

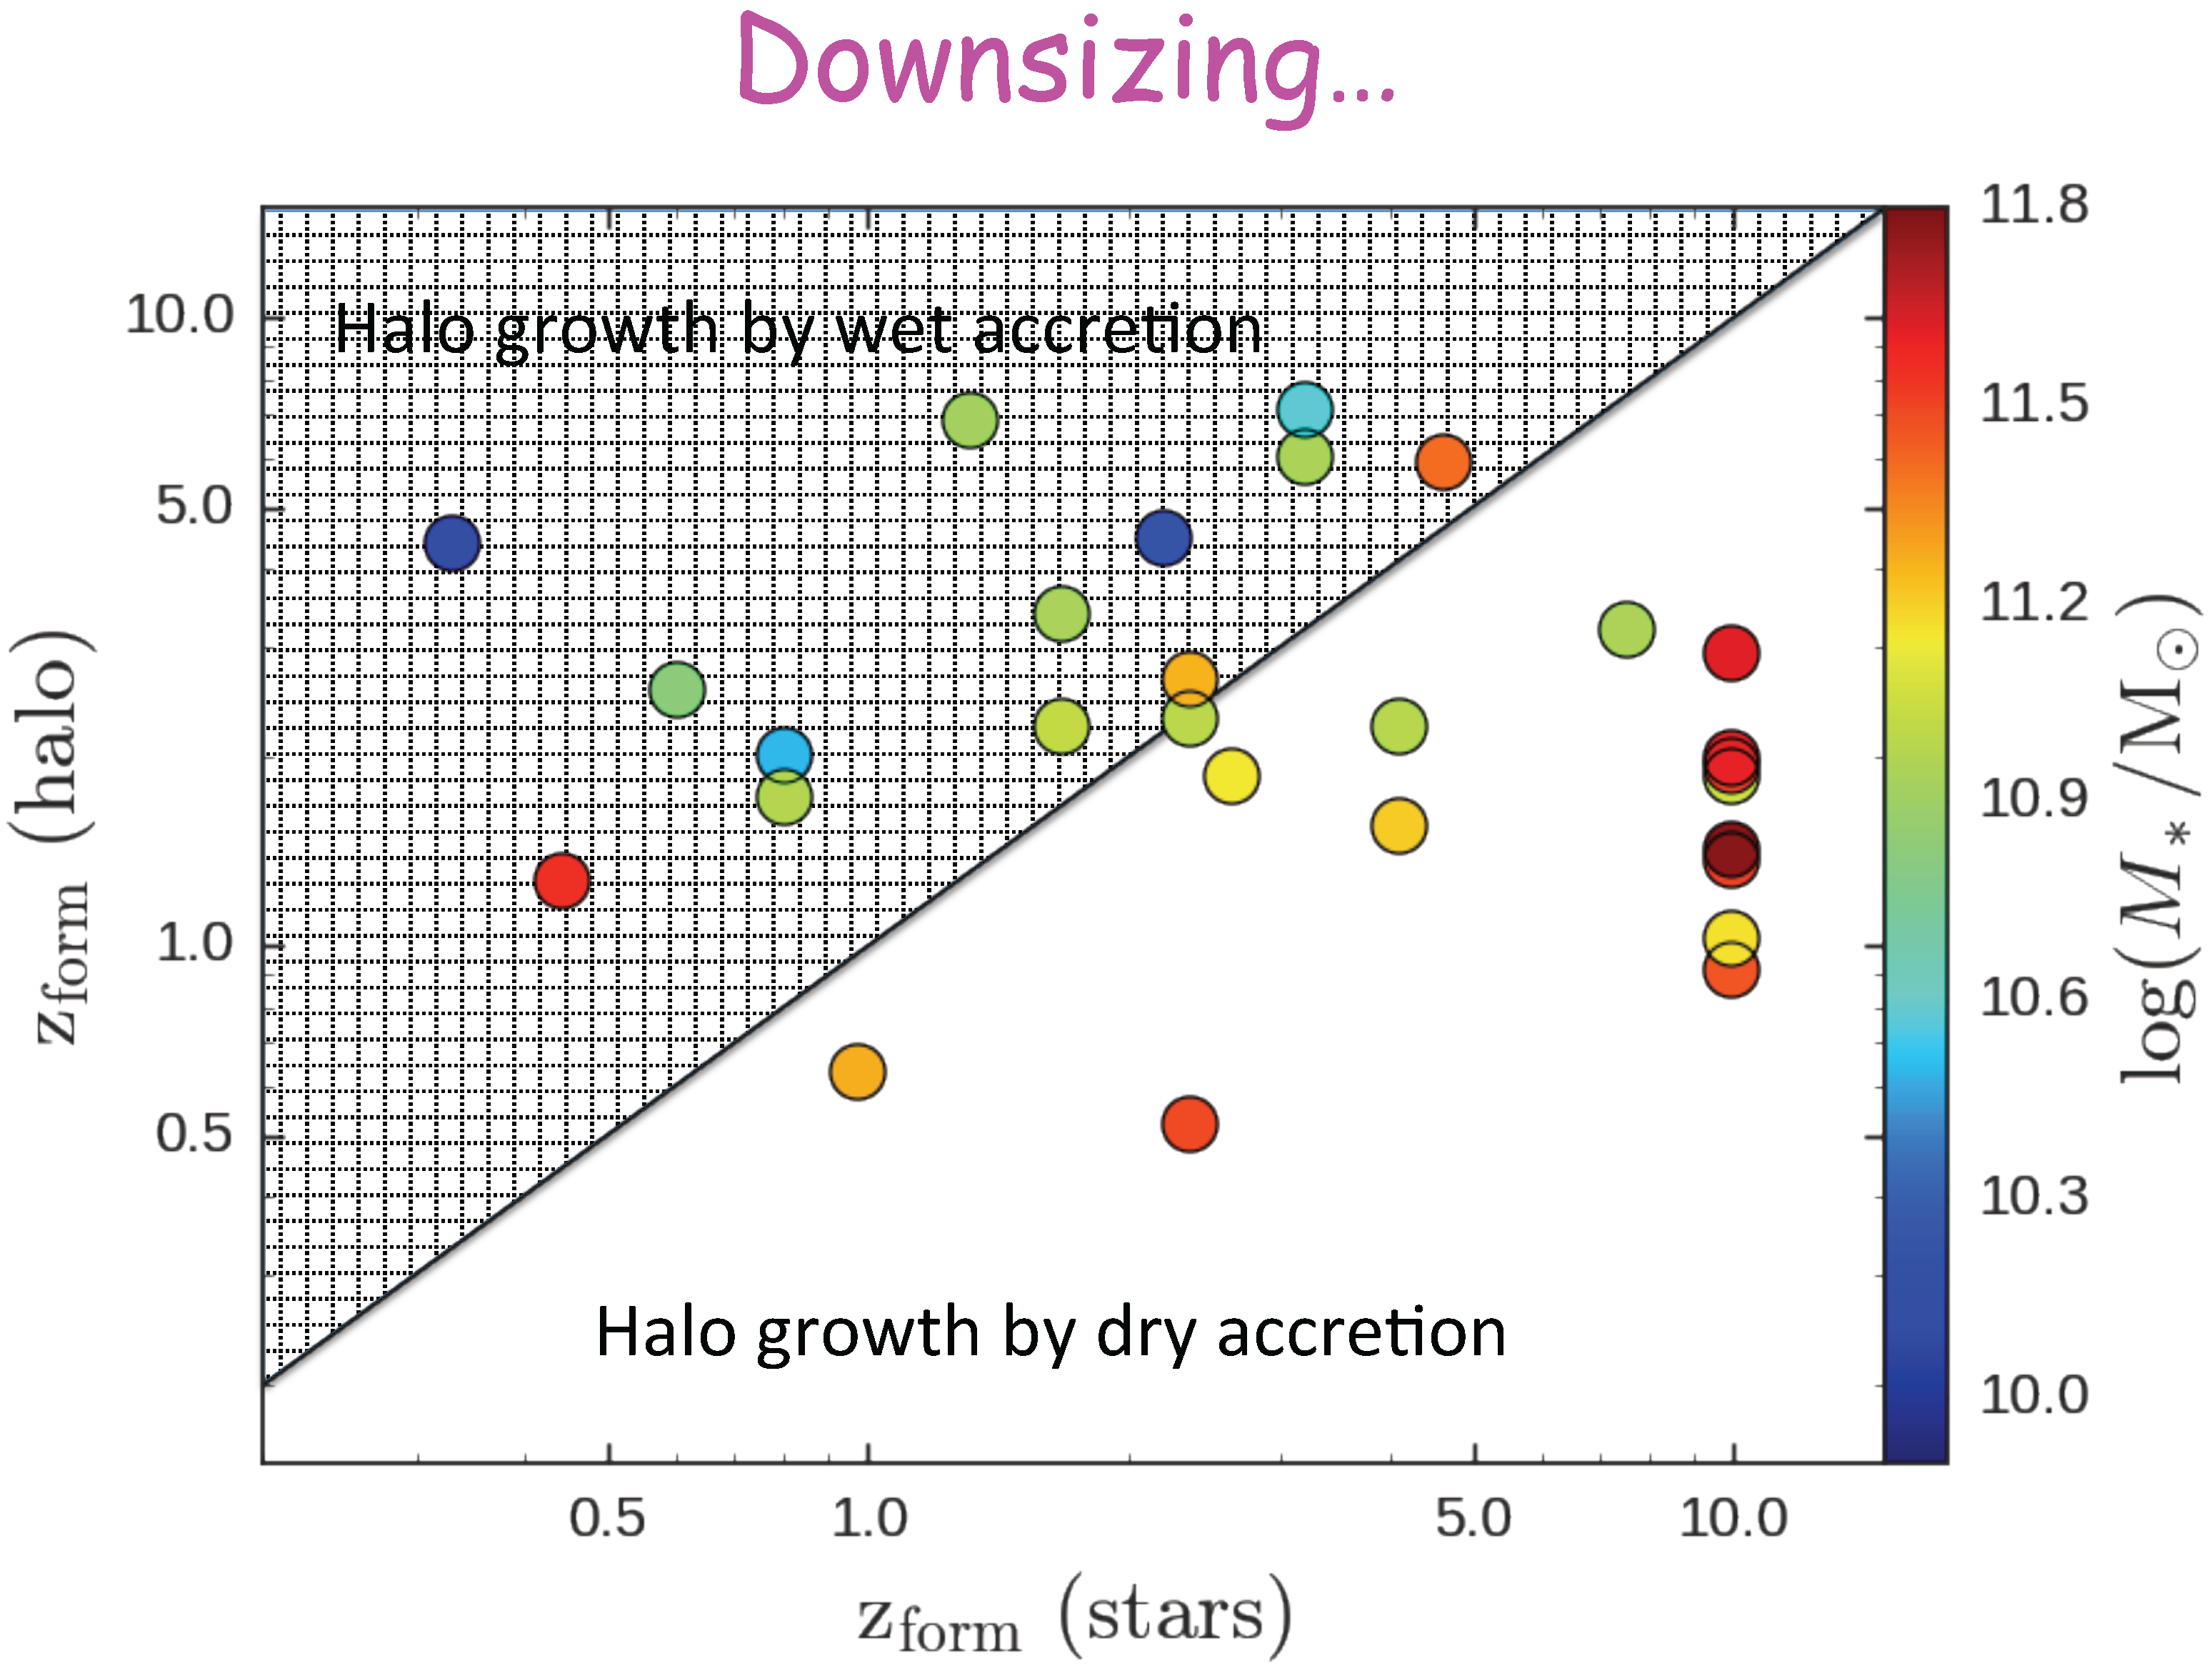
Our measurements also allow us to estimate the dark matter volume density within 5 R e . The density of galaxy halos is in turn related to the epoch of halo assembly. In Figure 4 we show the inferred epoch of halo assembly vs the luminosity-weighted mean age of the stars in each SLUGGS galaxy. The plot is coded by stellar mass. The upper left of the diagram shows those galaxies for which the halo assembled, on average, before most star formation occurred, i.e., halo growth continued via gas-rich accretion that led to star formation. Galaxies in this part of the diagram tend to be of low mass. In the lower right part of the diagram, halos continue to be assembled after the main epoch of star formation, i.e., growth is dominated by gas-poor accretion. High mass galaxies tend to be located in this part of the diagram.

4. Conclusions

Here we have used starlight and globular cluster data from the SLUGGS survey to probe the dark matter content, assembly history and halo growth of massive early-type galaxies. By comparing kinematic diagnostics of SLUGGS galaxies with the cosmological simulations of Naab et al. (2014) [2], we classified galaxies into six different assembly pathways. We find that massive galaxies had an early dissipative phase and a second phase of halo growth from largely minor mergers (and in rare cases major mergers). See Forbes et al. (2016) [3] for further details. This result fits in well with the two-phase scenario of galaxy formation.
We also used globular cluster radial velocities to measure the enclosed mass within 5 effective radii. Calculating dark matter fractions within this radius revealed that a few galaxies with log stellar mass ∼11 have very low dark matter fractions indicating diffuse halos, and that this behaviour is not captured in the latest cosmological models. Multiple solutions are possible, but none yet is convincing. See Alabi et al. (2017) [7] for further details. Converting dark matter fractions into halo densities and hence epochs of halo assembly, we show that low mass galaxies tend to grow via gas-rich accretion, while high mass galaxies grow via gas-poor mergers.

Acknowledgments

I thank the SLUGGS survey team for their contribution to the research presented here, especially Busola Alabi. This work was supported by ARC grant DP130100388.

Conflicts of Interest

The author declares no conflict of interest.

References

  1. Brodie, J.P.; Romanowsky, A.J.; Strader, J.; Forbes, D.A.; Foster, C.; Jennings, Z.G.; Pastorello, N.; Pota, V.; Usher, C.; Blom, C.; et al. The SAGES Legacy Unifying Globulars and GalaxieS Survey (SLUGGS): Sample Definition, Methods, and Initial Results. Astrophys. J. 2014, 796. [Google Scholar] [CrossRef]
  2. Naab, T.; Oser, L.; Emsellem, E.; Cappellari, M.; Krajnović, D.; McDermid, R.M.; Alatalo, K.; Bayet, E.; Blitz, L.; Bois, M.; et al. The ATLAS3D project—XXV. Two-dimensional kinematic analysis of simulated galaxies and the cosmological origin of fast and slow rotators. Mon. Not. R. Astron. Soc. 2014, 444, 3357–3387. [Google Scholar] [CrossRef]
  3. Forbes, D.A.; Romanowsky, A.J.; Pastorello, N.; Foster, C.; Brodie, J.P.; Strader, J.; Usher, C.; Pota, V. The SLUGGS survey: The assembly histories of individual early-type galaxies. Mon. Not. R. Astron. Soc. 2016, 457, 1242–1256. [Google Scholar] [CrossRef]
  4. Forbes, D.A.; Alabi, A.; Brodie, J.P.; Romanowsky, A.J.; Strader, J.; Foster, C.; Usher, C.; Spitler, L.; Bellstedt, S.; Pastorello, N.; et al. The SLUGGS Survey: A Catalog of Over 4000 Globular Cluster Radial Velocities in 27 Nearby Early-type Galaxies. Astron. J. 2017, 153, 114. [Google Scholar] [CrossRef]
  5. Watkins, L.L.; Evans, N.W.; An, J.H. The masses of the Milky Way and Andromeda galaxies. Mon. Not. R. Astron. Soc. 2010, 406, 264–278. [Google Scholar] [CrossRef]
  6. Alabi, A.; Forbes, D.A.; Romanowsky, A.J.; Brodie, J.P.; Strader, J.; Janz, J.; Pota, V.; Pastorello, N.; Usher, C.; Spitler, L.R.; et al. The SLUGGS survey: The mass distribution in early-type galaxies within five effective radii and beyond. Mon. Not. R. Astron. Soc. 2016, 460, 3838–3860. [Google Scholar] [CrossRef]
  7. Alabi, A.; Forbes, D.A.; Romanowsky, A.J.; Brodie, J.P.; Strader, J.; Janz, J.; Usher, C.; Spitler, L.R.; Bellstedt, S.; Ferré-Mateu, A. The SLUGGS Survey: Dark matter fractions at large radii and assembly epochs of early-type galaxies from globular cluster kinematics. Mon. Not. R. Astron. Soc. 2017, in press. [Google Scholar] [CrossRef]
  8. Remus, R.-S.; Dolag, K.; Naab, T.; Burkert, A.; Hirschmann, M.; Hoffmann, T.L.; Johansson, P.H. The co-evolution of total density profiles and central dark matter fractions in simulated early-type galaxies. Mon. Not. R. Astron. Soc. 2017, 464, 3742–3756. [Google Scholar] [CrossRef]
  9. Wu, X.; Gerhard, O.; Naab, T.; Oser, L.; Martinez-Valpuesta, I.; Hilz, M.; Churazov, E.; Lyskova, N. The mass and angular momentum distribution of simulated massive early-type galaxies to large radii. Mon. Not. R. Astron. Soc. 2014, 438, 2701–2715. [Google Scholar] [CrossRef]
  10. Cappellari, M.; Scott, N.; Alatalo, K.; Blitz, L.; Bois, M.; Bournaud, F.; Bureau, M.; Crocker, A.F.; Davies, R.L.; Davis, T.A.; et al. The ATLAS3D projec—XV. Benchmark for early-type galaxies scaling relations from 260 dynamical models: mass-to-light ratio, dark matter, Fundamental Plane and Mass Plane. Mon. Not. R. Astron. Soc. 2013, 432, 1709–1741. [Google Scholar] [CrossRef]
  11. Dokkum, P.G.; Conroy, C. The Stellar Initial Mass Function in Early-type Galaxies from Absorption Line Spectroscopy. I. Data and Empirical Trends. Astrophys. J. 2012, 760, 70. [Google Scholar] [CrossRef]
  12. Di Cintio, A.; Tremmel, M.; Governato, F.; Pontzen, A.; Zavala, J.; Bastidas Fry, A.; Brooks, A.; Vogelsberger, M. A rumble in the dark: Signatures of self-interacting dark matter in Super-Massive Black Hole dynamics and galaxy density profiles. Mon. Not. R. Astron. Soc. 2017, submitted. [Google Scholar] [CrossRef]
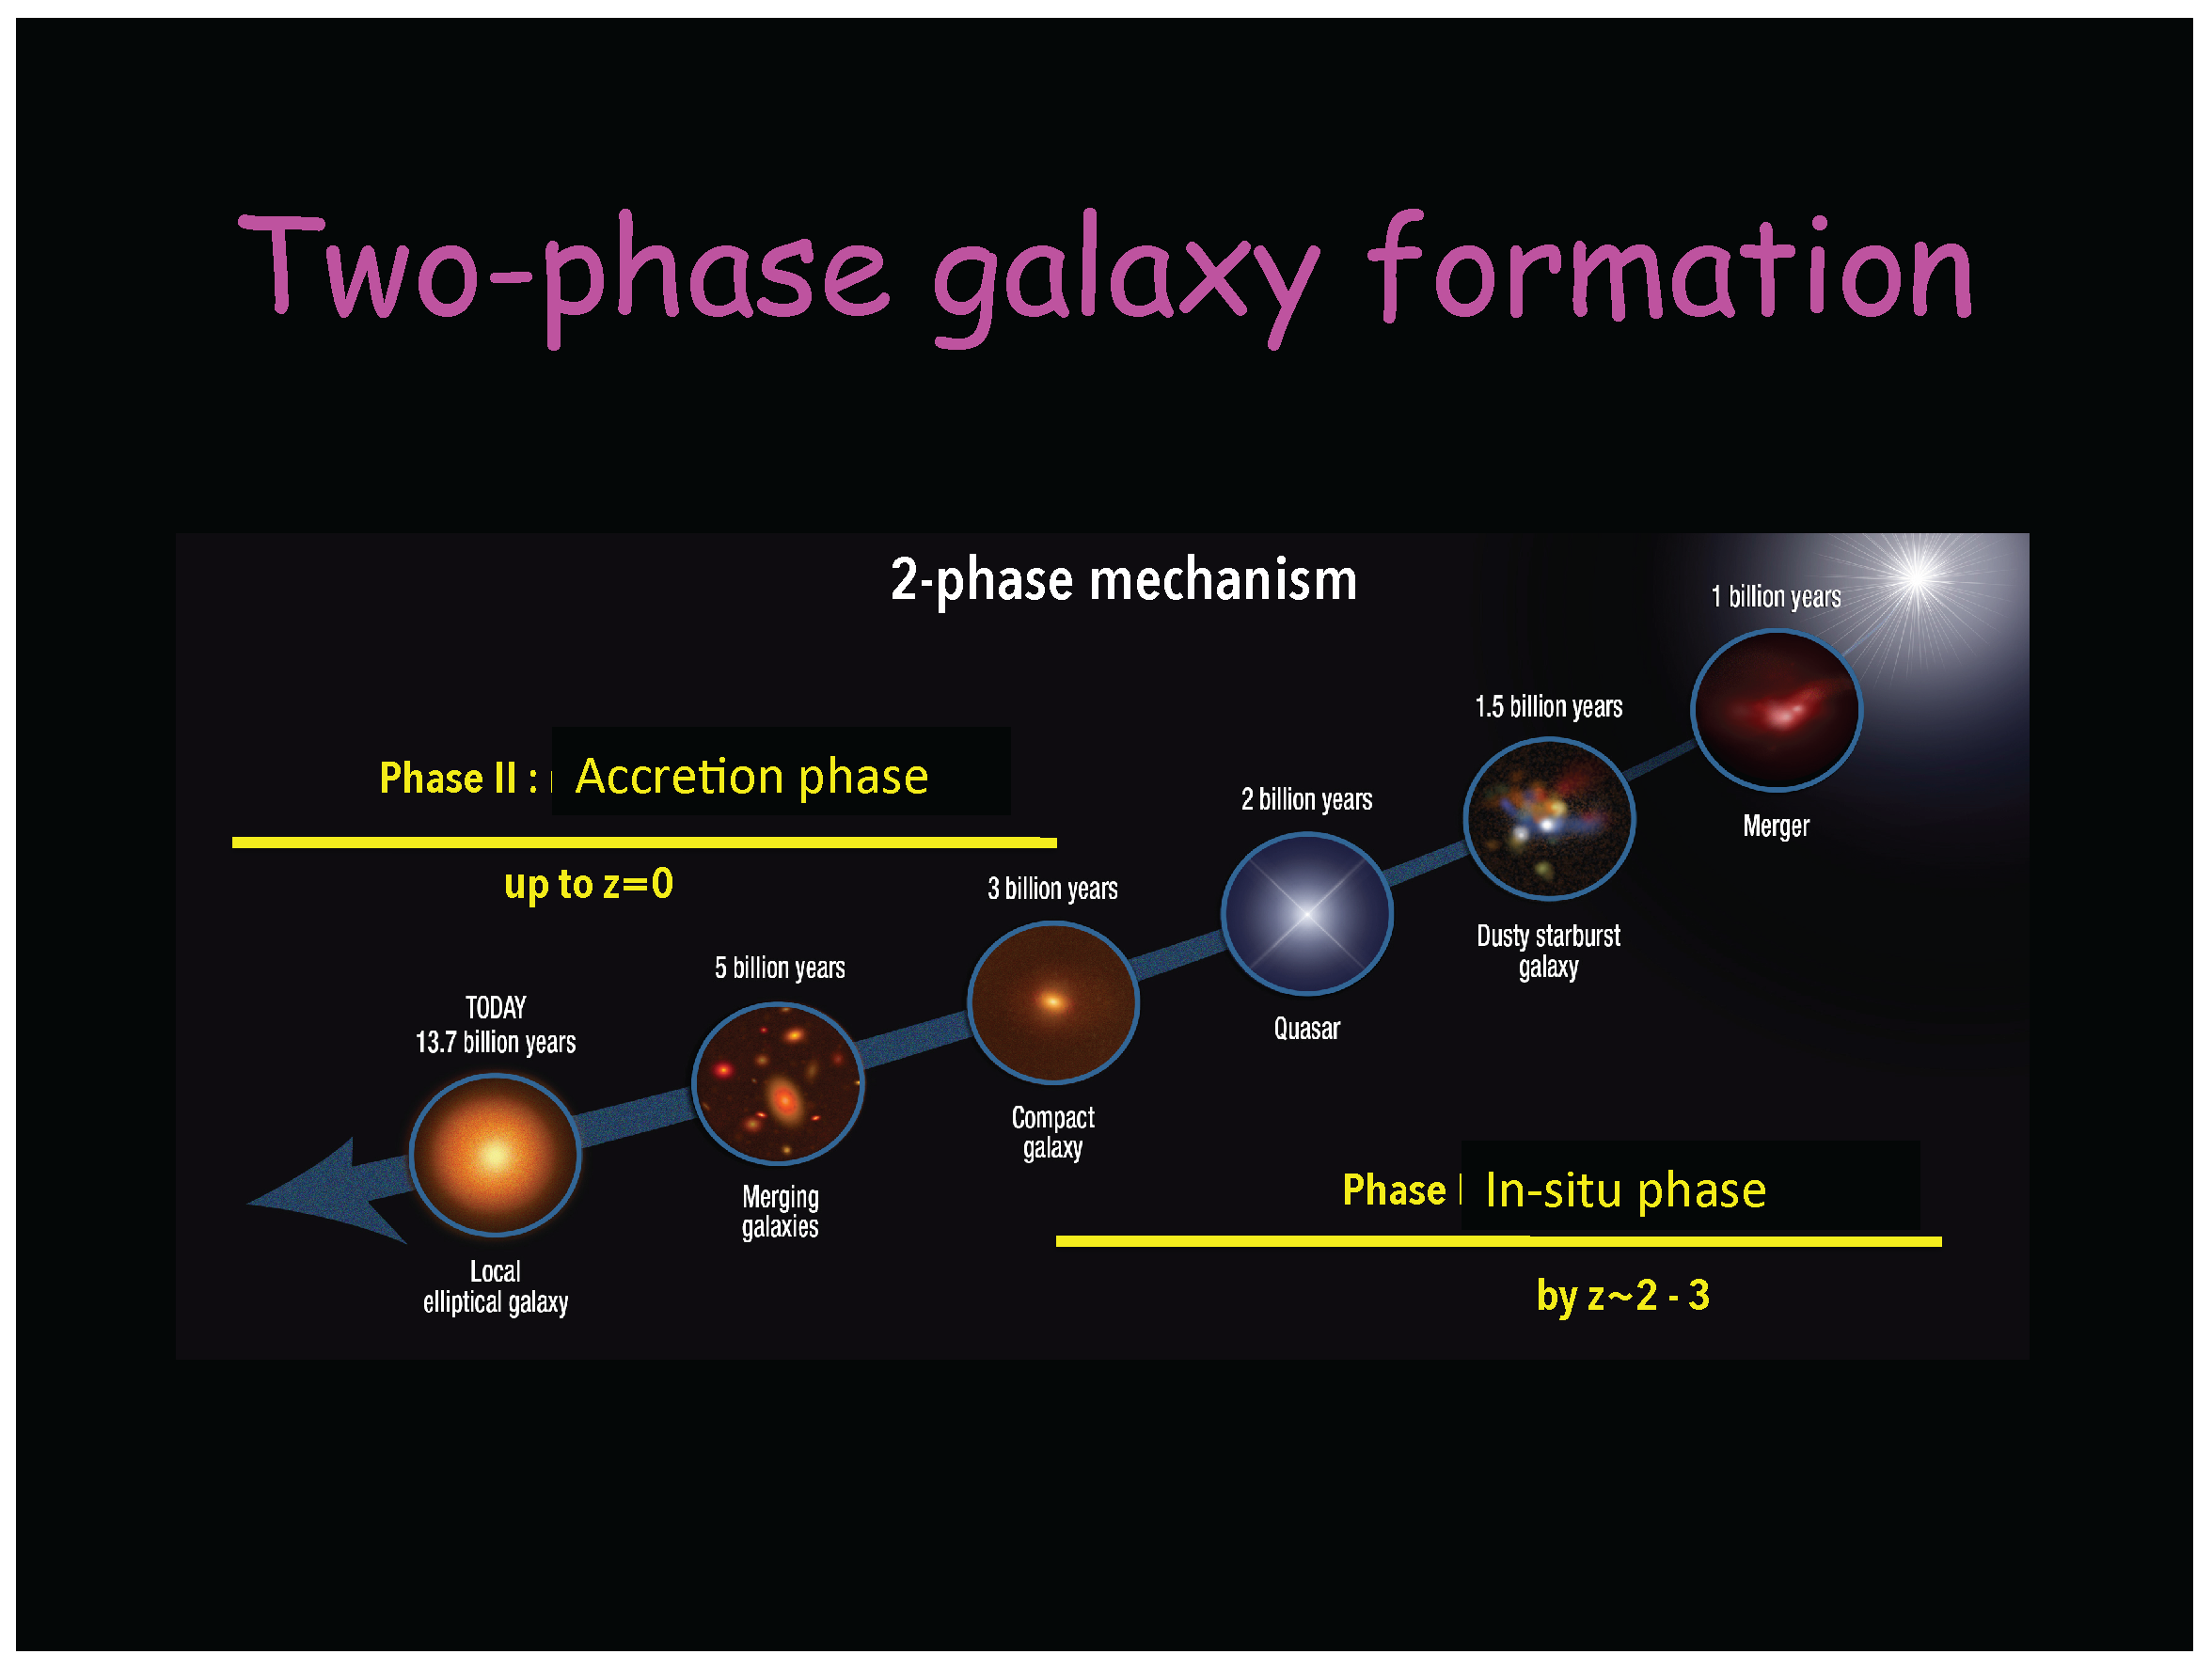
Figure 1. Two-phase galaxy formation. This schematic illustrates the two-phase galaxy formation scenario as described by the cosmological simulations of Naab et al. (2014) [2]. The first phase, at high redshift, is a dissipative one that results in the in-situ formation of a compact, massive core (red nugget) and perhaps an AGN. In he second phase, after redshift z ∼2, growth is dominated by accretion from minor or major mergers which leads to the formation of the galaxy halo. Credit: NASA, ESA, S. Toft, A. Feild.
Galaxies 05 00027 g001
Figure 2. SLUGGS diagnostics. The kinematic diagnostics used to place each SLUGGS galaxy in one of six Naab et al. (2014) [2] assembly history classes are: radial lambda (spin) profiles (top left), 2D kinematic maps (lower left) and higher order velocity moments vs. V/ σ (right). In the spin profiles, blue lines are centrally fast rotators and red lines are for centrally slow rotators. In the higher order moments, blue symbols are data within 1 R e , and red symbols for data outside 1 R e .
Galaxies 05 00027 g002
Figure 3. Dark matter fraction vs simulations. The dark matter fraction within 5 effective radii is shown against stellar mass. The SLUGGS data from Alabi et al. (2017) [7] are shown by filled orange circles, with a typical error bar at the lower right. The black and red open symbols are the cosmological simulations of Remus et al. (2017) [8] and Wu et al. (2014) [9] respectively. The solid black line shows a simple galaxy model based on scaling relations and a NFW dark matter halo. The data show some agreement with the model galaxies, but reveal a considerable range in dark matter fractions for log stellar masses of ∼11 that is not captured in the models.
Galaxies 05 00027 g003
Figure 4. Downsizing—the early formation and completion of star formation in massive galaxies. The assembly epoch of galaxy halos, derived from the dark matter density within 5 effective radii, is shown vs the luminosity-weighted mean age of the stars in each SLUGGS galaxy. Symbols are colour-coded by their stellar mass. Galaxies in the upper left tend to be of low stellar mass for which halo growth continues via gas-rich accretion. Whereas, for high mass galaxies growth is dominated by gas-poor mergers.
Galaxies 05 00027 g004