1. Introduction
Recently, Klypin and Prada [
1] presented an analysis of galaxy observations of the Sloan Digital Sky Survey (SDSS [
2]) to test gravity and dark matter in the peripheral parts of galaxies at distances 50–400 kpc from the centers of galaxies. This field of extragalactic astronomy provides one of the main arguments for the presence of dark matter [
3,
4].
The analysis of Klypin and Prada [
1] begins with identifying candidate host galaxies and candidate satellite galaxies based on their relative positions in the sky, relative velocities, and relative luminosities. After a candidate population of hosts and satellites has been identified, an
ad-hoc mathematical model is used to separate the (presumed constant) background of interlopers from actual satellites. This mathematical model yields a velocity dispersion profile for the presumed satellites that is then checked against theory.
In the present work we propose an alternative approach that altogether avoids the difficult issue of identifying satellites versus interlopers. Rather than attempting to subtract the interloper population from the data in order to construct a dataset that is then hoped to represent the satellite population correctly, we endeavor to model the actual data instead, by adding an interloper population to the velocity dispersions predicted by various gravity theories. Crudely put, we extend the theory to model the data correctly, rather than massaging the data to fit within the constraints of a limited model.
In the first section of our paper, we offer a detailed description of our data analysis. In the second part, we model the data using three gravity theories. In addition to Newtonian gravity without exotic dark matter and Modified Newtonian Dynamics (MOND, [
5]), of particular interest to us is our Modified Gravity Theory (MOG, [
6,
7]), which has been used successfully in the past to explain galaxy rotation curves [
8], galaxy cluster mass profiles [
9], cosmological observations [
10], and gravitational lensing in the Bullet Cluster [
11] without assuming the presence of nonbaryonic dark matter. In the third section, we combine our satellite velocity dispersion predictions with the observed interloper background, and contrast the resulting predictions as well as the cold dark matter (CDM) prediction of Klypin and Prada [
1] with the SDSS data. Our conclusion is that the SDSS galaxy data cannot be used to exclude any of these gravitational theories, not unless an independent, nonstatistical method is found that can be used reliably to identify individual interlopers.
2. Data Analysis
The SDSS [
2] Data Release 6 (DR6) provides imaging data over 9500 deg
in five photometric bands. Galaxy spectra are determined by charge-coupled device (CCD) imaging and the SDSS 2.5 m telescope on Apache Point, New Mexico [
12]. Over half a million galaxies brighter than Petrosian
r-magnitude 17.77 over 7400 deg
are included in the SDSS data with a redshift accuracy better than 30 km/s.
Due to the complications of calculating modified gravity for non-spherical objects, Klypin and Prada [
1] restricted their analysis only to red galaxies, the vast majority of which are either elliptical galaxies or are dominated by bulges. We followed a similar strategy, restricting our selection of candidate host galaxies to isolated red galaxies. We also restricted our selection to galaxies with a recession velocity between 3000 km/s and 25,000 km/s, which yielded approximately 234,000 galaxies in total.
We began our analysis by obtaining a dataset from the SDSS. We obtained sky positions, spectra, and extinction-corrected magnitudes for 687,423 galaxies. We adjusted the dataset by accounting for the motion of the solar system. We then processed the result using a C-language program that selected, as candidate hosts, isolated red galaxies with no other galaxy within a projected distance of 1 Mpc and a luminosity more than 25% that of the candidate host. We then identified as candidate satellites galaxies that were within 1 Mpc of projected distance from the candidate host, and had a line-of-sight redshift velocity of less than 1500 km/s relative to the candidate host. These candidate satellites were binned by distance. The computation yielded 3589 hosts with 8156 satellites. Of these, 121 satellites (or about 1.5% of the total) were assigned to multiple hosts; no attempt was made to eliminate these duplicates.
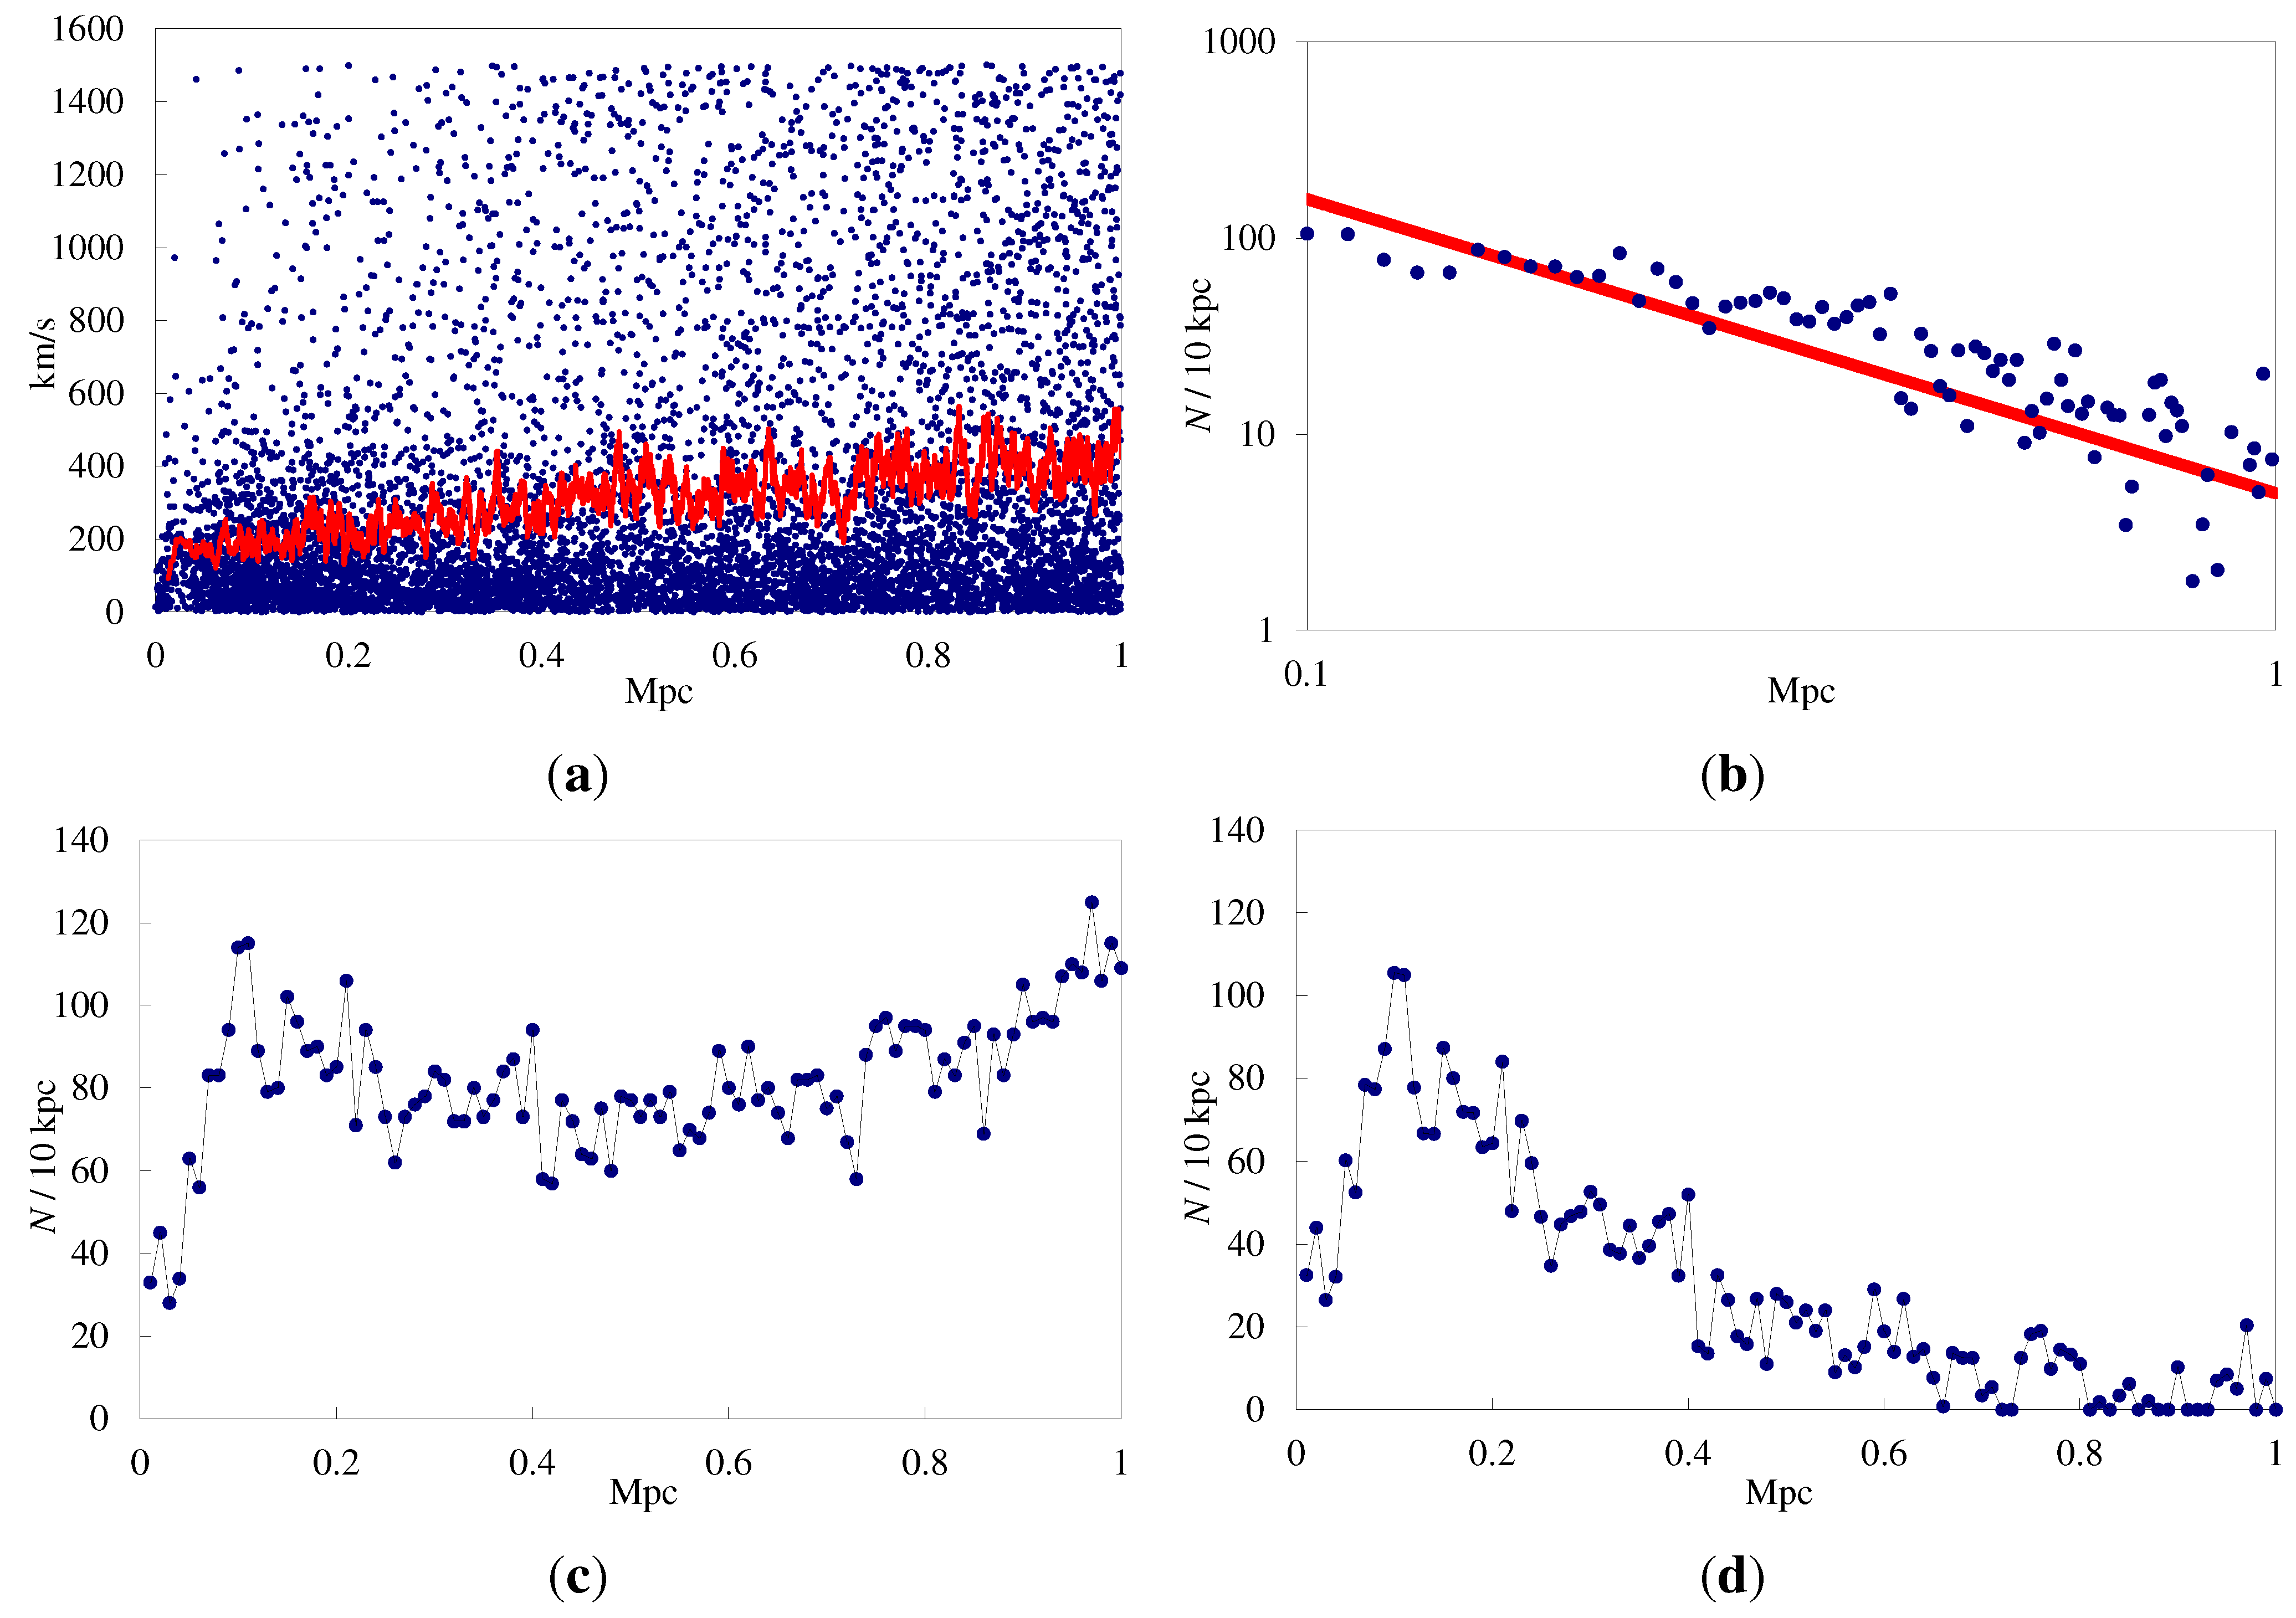
The radial number density of the candidate satellites (
Figure 1c) suggests that many of these galaxies are not, in fact, satellites. Indeed, if dim galaxies were distributed completely randomly, with no relation to the candidate host, we would expect a number density that increases linearly with projected radius. The actual number density plot appears to be a distribution with a peak at ∼100 kpc, superimposed on just such a linear density profile. Subtracting the linear density profile yields the plot in
Figure 1d, which is a power law profile with exponent
, as shown in
Figure 1b. (This corresponds to a parameter of
in the Jeans equation, discussed below).
Figure 1.
Line-of-sight velocities (a) and radial number densities (b) of candidate satellite galaxies (full sample) as a function of projected distance from the candidate host. After removal of candidate interlopers, the radial number density (c) follows a power law profile with an exponent of (d).
3. Satellite Galaxy Velocity Dispersion
Predictions for modified gravity can be made by solving the Jeans equation, which gives the radial velocity dispersion
as a function of radial distance. Klypin and Prada [
1] find that neither the Newtonian gravity without nonbaryonic dark matter nor the Modified Newtonian Dynamics (MOND) is compatible with observations. Angus
et al. [
13], however, demonstrated that a suitably chosen anisotropic model and appropriately chosen galaxy masses can be used to achieve a good fit for MOND.
Radial velocity dispersions in a spherically symmetric gravitational field can be computed using the Jeans equation [
14]:
where
ν is the spatial number density of particles,
is the radial velocity,
is the velocity anisotropy,
is the gravitational potential, and we are using spherical coordinates
r,
θ,
ϕ. We can write Equation (
1) in the form:
where
is the gravitational acceleration. Here, we have:
where
.
If we assume that the velocity distribution of satellite galaxies is isotropic, . In general, β needs to be neither zero nor constant. The number density of candidate satellites favors a value of , corresponding to the observed power law radial density with exponent .
The observed velocity dispersion is along the observer’s line-of-sight, seen as a function of the projected distance from the host galaxy. Therefore, it is necessary to integrate velocities along the line-of-sight:
where
ν is the spatial number density of satellite galaxies as a function of distance from the host galaxy, and
y is related to the projected distance
R and 3-dimensional distance
r by:
Changing integration variables to eliminate
y, we can express the observed line-of-sight velocity dispersion as a function of projected distance as:
From the field equations derived from the MOG action, we obtain the modified Newtonian acceleration law for weak gravitational fields [
6,
7] of a point source with mass
M:
where
is the Newtonian gravitational constant, while the MOG parameters
α and
μ determine the coupling strength of the “fifth force” vector
to baryon matter and the range of the force, respectively.
In recent work [
7], we have been able to develop formulae that predict the values of the
α and
μ parameters from the source mass, in the form:
where the universal parameters:
are determined from galaxy rotation curves and cosmological observations [
7].
The MOND acceleration
is given by the solution of the non-linear equation:
where
M is the mass of only baryons and
m/s
2. The form of the function
originally proposed by Milgrom [
5] is given by
; however, better fits and better asymptotic behavior are achieved using
[
1].
Following in the footsteps of Klypin and Prada [
1], we grouped satellite galaxy velocities for host galaxies into two luminosity ranges:
, and
. The corresponding masses for the host galaxies, calculated by Klypin and Prada [
1] on the basis of the work of Bell and de Jong [
15], are:
We used these values to obtain two sets of predictions for each theory, using , .
4. The Interloper Background
Having obtained the velocity dispersion for satellite galaxies around a host galaxy, we now turn our attention to the interloper population.
The actual data consist of host galaxies, satellites, and an effectively random interloper background. When satellites and interlopers are binned by projected distance from host galaxies, the result can be modeled symbolically as:
where
is the number of galaxies in the bin at projected radius
R,
and
are the number of satellites and interlopers, respectively, in that same bin, and
δ is used to represent the sampling error.
This is not the approach taken by Klypin and Prada [
1], however. Instead, they elected to subtract a modeled interloper background from the observed number density of satellites, and then compare that to a model representing only satellite galaxies. In effect, they used:
Assuming that the sampling error of satellites and interlopers are independent, we have:
leading to potentially misleading conclusions about the extent to which the galaxy sample can be used to constrain alternate gravity models. It was this realization that led us to repeat some of the analysis performed by Klypin and Prada [
1].
For this reason, in our analysis we endeavor to model the actual observation, by estimating both satellite galaxy velocity dispersions in accordance with the previous section and the velocity dispersion of the interloper background. We assume a constant (i.e., independent of distance or sky position) interloper background.
In terms of the polar coordinate
R in the sky plane and the line-of-sight velocity
v, we find that the likelihood of finding a satellite between
R and
, with line-of-sight velocity between
v and
, will be proportional to:
subject to the normalization given by
, to ensure that the probability of finding a particular satellite somewhere within the observational range (
Mpc,
km/s) is unity. On the other hand, the likelihood of finding an interloper from a uniformly distributed background, between
R and
, is:
again subject to normalization in the form
. If we assume that the proportion of interlopers is
κ (
), the combined probability of finding a galaxy (satellite or interloper) at
, is:
We can use this value of
p to develop the likelihood function,
for the two candidate satellite populations given by Equation (14), choosing the value of
κ to obtain the maximum likelihood.
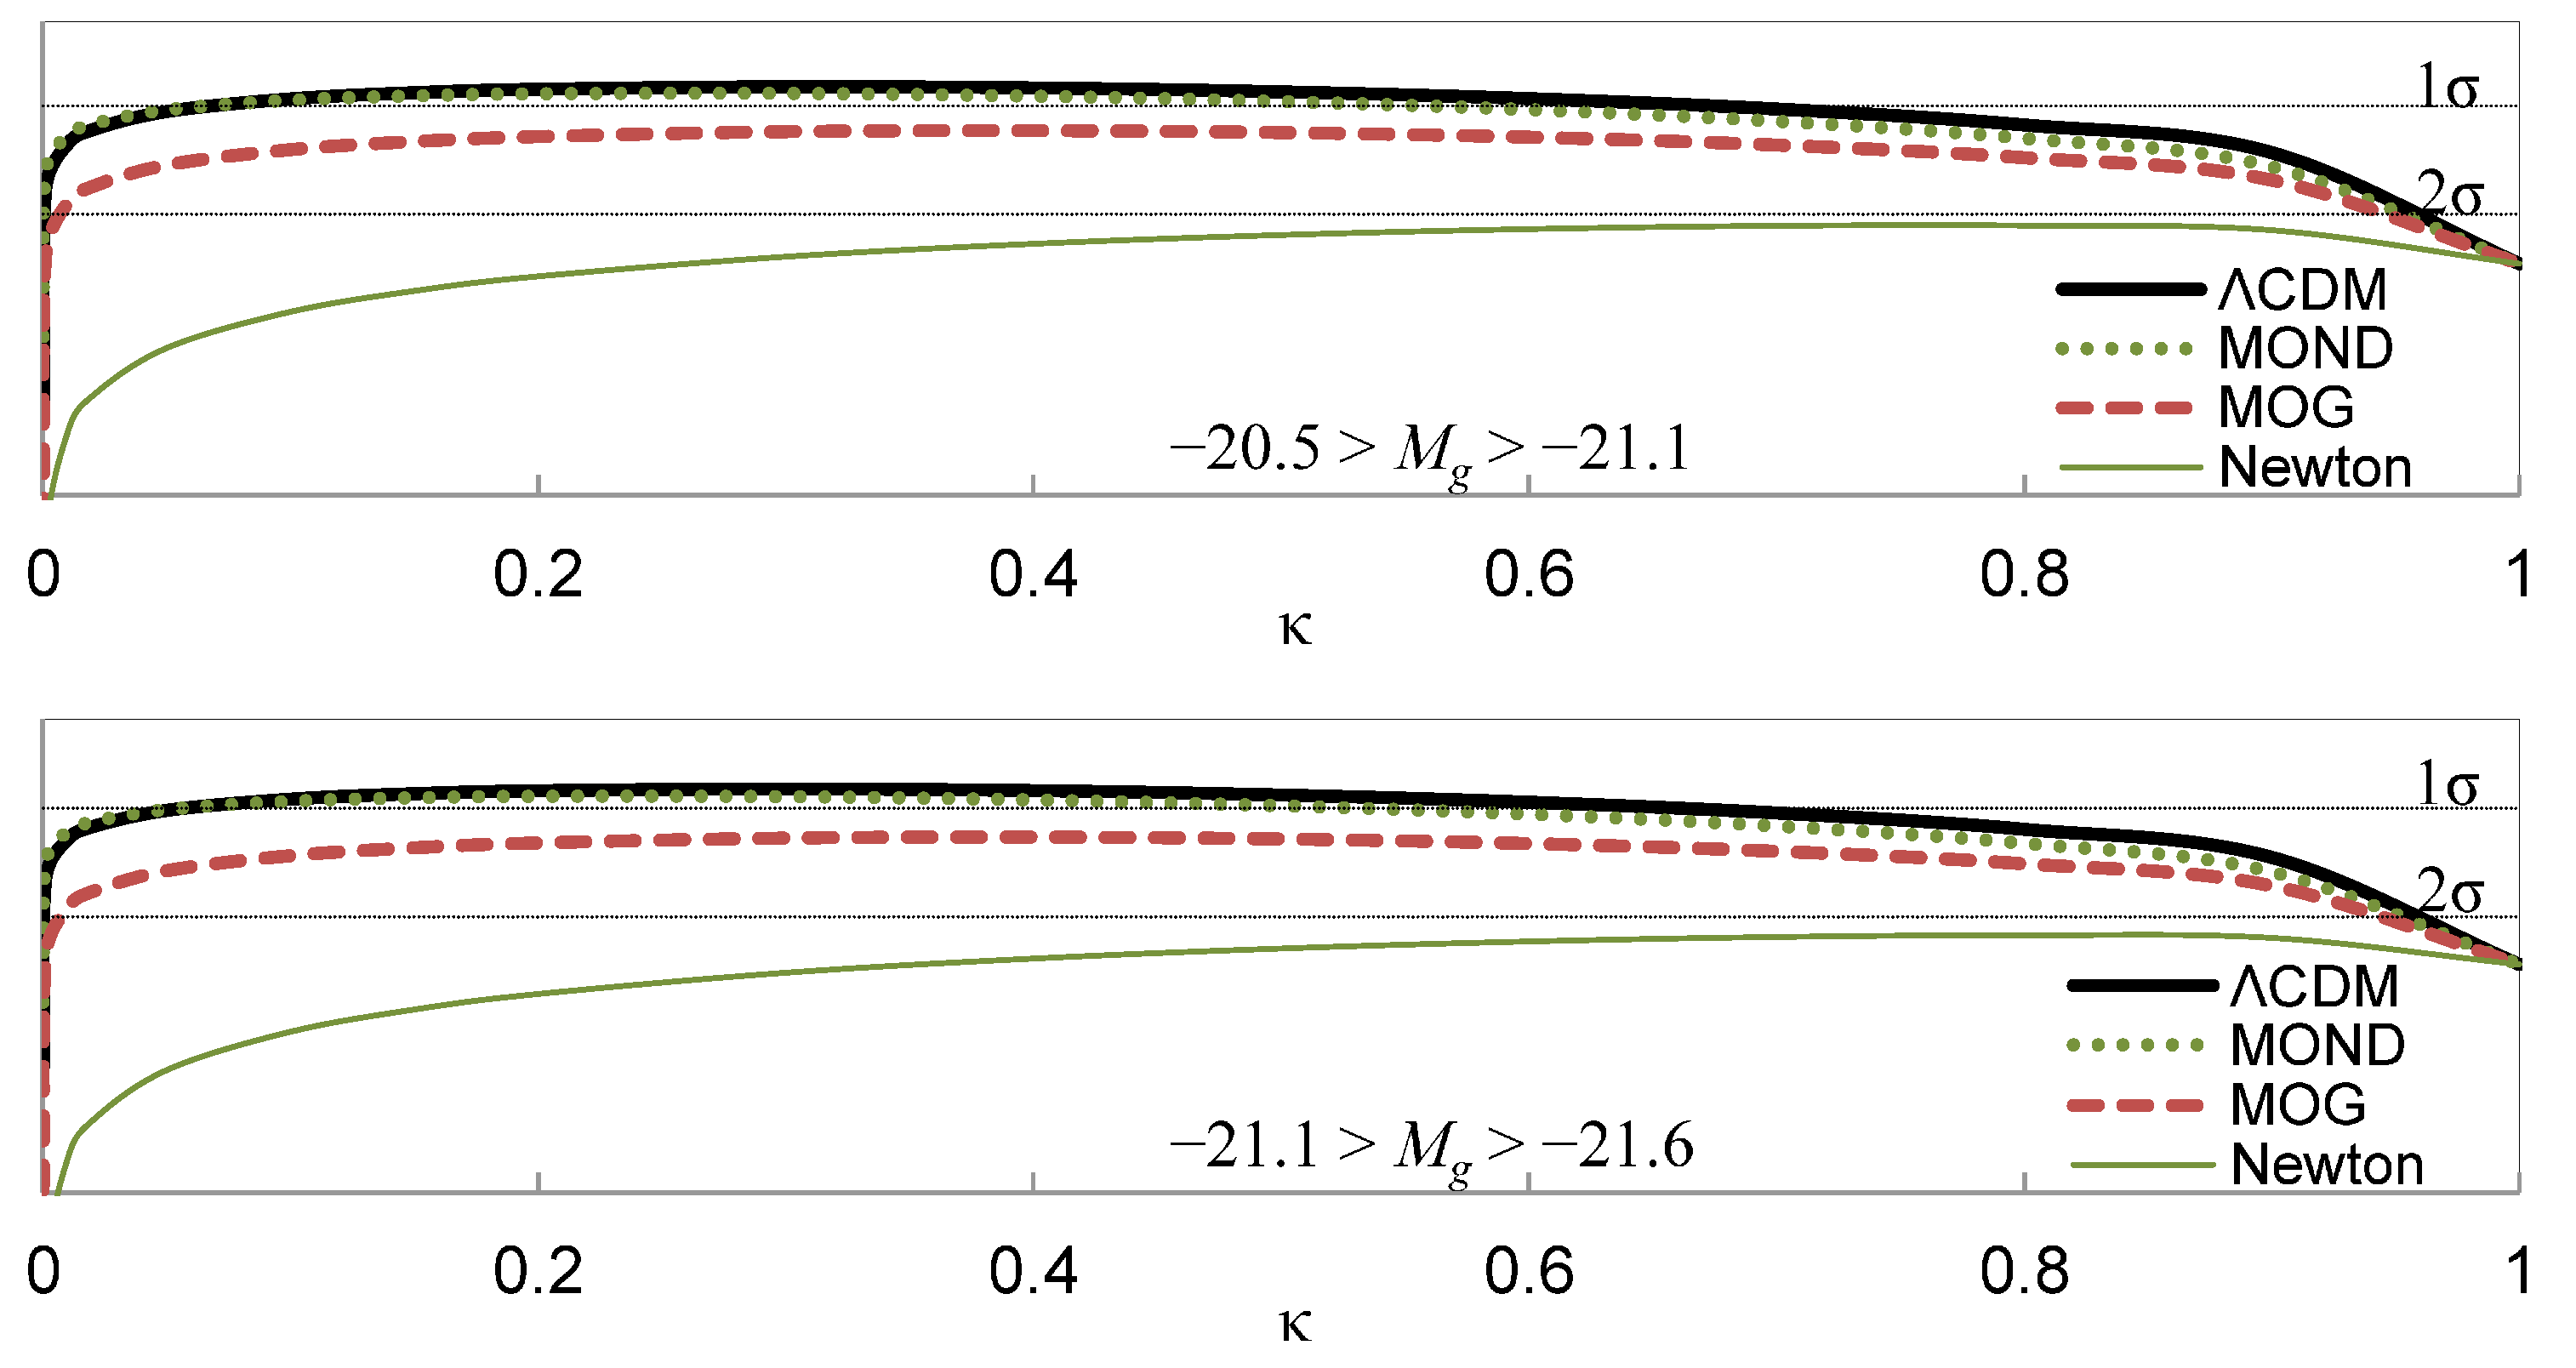
Using this likelihood function, we find that ΛCDM is the best performing model, marginally outperforming MOND and MOG, with maximum likelihood obtained at
and
, respectively, for the two candidate satellite populations. The ΛCDM and MOND models are effectively indistinguishable (see
Figure 2). They both outperform MOG, but the difference is not statistically significant: comparison with a
t-statistic yields a probability of 24.2% (for
) and 23.0% (for
) that the difference between MOG and ΛCDM is due to chance. Only the Newtonian prediction without nonbaryonic dark matter can be excluded with a
significance.
For this reason, it seems futile to use this type of statistical analysis of satellite galaxies to distinguish between CDM models on the one hand, and various gravitational theories on the other, due to the presence of the interloper population.
Figure 2.
Likelihood of ΛCDM, Modified Newtonian Dynamics (MOND), Modified Gravity Theory (MOG), and the Newtonian model without exotic dark matter, as a function of the
κ parameter as defined in Equation (
20) (
top:
,
bottom:
). Horizontal lines indicate the 1
σ and 2
σ levels relative to the maximum likelihood of the best performing model (ΛCDM).


