Review

Timing Analysis of Black Hole X-Ray Binaries with Insight-HXMT

Department of Astronomy, School of Physics and Technology, Wuhan University, Wuhan 430072, China
*
Author to whom correspondence should be addressed.
Galaxies 2025, 13(5), 111; https://doi.org/10.3390/galaxies13050111
Submission received: 30 August 2025 / Revised: 13 September 2025 / Accepted: 16 September 2025 / Published: 19 September 2025

Abstract

The Hard X-ray Modulation Telescope (HXMT), China’s first X-ray astronomy satellite, has significantly contributed to the study of fast variability in black hole X-ray binaries through its broad energy coverage (1–250 keV), high timing resolution, and sensitivity to hard X-rays. This review presents a comprehensive overview of timing analysis techniques applied to black hole X-ray binaries using Insight-HXMT data. We introduce the application and comparative strengths of several time-frequency analysis methods, including traditional Fourier analysis, wavelet transform, bicoherence analysis, and Hilbert-Huang transform. These methods offer complementary insights into the non-stationary and nonlinear variability patterns observed in black hole X-ray binaries, particularly during spectral state transitions and quasi-periodic oscillations. We discuss how each technique has been employed in recent Insight-HXMT studies to characterize timing features such as low-frequency QPOs, phase lags, and power spectrum evolution across different energy bands. Moreover, we present novel phenomena revealed by Insight-HXMT observations, including the detection of high-energy QPOs, spectral parameter modulation with QPO phase, and a new classification scheme for QPO types. The integration of multiple analysis methods enables a more nuanced understanding of the accretion dynamics and the geometry of the inner accretion flow, shedding light on fundamental physical processes in relativistic environments.

1. Introduction

Black hole X-ray binaries (BHXRBs), comprising a stellar-mass black hole accreting matter from a companion star, serve as natural laboratories for studying accretion physics and relativistic effects in strong-gravity regimes. Based on their X-ray activity, BHXRBs are broadly classified into persistent and transient sources. Persistent systems exhibit relatively stable X-ray emission, while the majority are transients, spending most of their lifetimes in quiescence with extremely low X-ray luminosities. Their X-ray emission becomes prominent only during episodic outbursts, typically triggered by thermal-viscous instabilities within the accretion disk [1].
Outbursts are believed to begin when mass accumulation in the disk leads to hydrogen ionization in the outer regions, resulting in enhanced accretion onto the black hole. This process causes a dramatic increase in X-ray luminosity and drives a sequence of spectral and timing state transitions [2]. A typical outburst traces a characteristic “q”-shaped path in the hardness–intensity diagram (HID) [3]. Initially, the system resides in the low-hard state (LHS), marked by a hard power-law X-ray spectrum (photon index Γ 1.4 –2.1) produced by inverse Compton scattering in a hot, optically thin corona [4]. This emission often exhibits a high-energy cutoff around 100 keV. As the accretion rate increases, the system undergoes a transition to the high-soft state (HSS), where thermal emission from a geometrically thin, optically thick accretion disk dominates, and the power-law component becomes significantly weaker [5].
Between these states, BHXRBs pass through intermediate states (IMS), which show hybrid spectral properties and are further divided into the hard-intermediate state (HIMS) and soft-intermediate state (SIMS), each characterized by distinct timing and spectral features. Toward the end of an outburst, the declining accretion rate leads to a rapid drop in X-ray luminosity—often by several orders of magnitude—and the system returns to the LHS [6].
Quasi-periodic oscillations (QPOs) are among the most prominent timing signatures observed during BHXRB outbursts [7]. These features are typically classified into low-frequency QPOs (LFQPOs; ∼0.1–30 Hz) and high-frequency QPOs (HFQPOs; ≳40 Hz). LFQPOs are further subdivided into type-A, type-B, and type-C, based on spectral and timing characteristics such as quality factor ( Q = ν / Δ ν ), fractional root-mean-square (rms) variability, associated broadband noise, and phase lags across energy bands [8,9,10,11]. Type-C QPOs are predominantly detected in the LHS and HIMS, while type-B and type-A QPOs are typically observed during the SIMS. LFQPOs, particularly type-C, are frequently detected and serve as valuable diagnostics of the inner accretion flow geometry and dynamics. Despite their prevalence, their physical origin remains unresolved.
Among various models, the relativistic precession model provides a plausible explanation for type-C QPOs, attributing them to Lense–Thirring precession of the inner accretion flow caused by the frame-dragging effect of a spinning black hole [12,13,14]. A refined version of this model proposes that it is not a single test particle, but a finite, geometrically thick inner flow that precesses coherently. This modification yields precession frequencies more consistent with observations and naturally accounts for the increase in QPO frequency during the rising phase of an outburst as the truncation radius decreases [15,16].
Nevertheless, this model—like other proposed frameworks—encounters both theoretical and observational difficulties, and the physical mechanism underlying type-C QPOs remains unresolved (see Ingram and Motta [11] for a comprehensive review). While power density spectrum (PDS) analysis has long served as the standard tool for QPO studies, its limited sensitivity makes it inadequate for capturing the transient, nonlinear, and evolving character of these oscillations. To address these limitations, it is essential to adopt advanced time–frequency methods that can reveal subtler dynamical features. Recent developments, including wavelet analysis, the Hilbert–Huang Transform (HHT), and bicoherence, have demonstrated particular promise in identifying time-dependent spectral signatures and nonlinear interactions in black hole X-ray binaries, thereby providing insights inaccessible to Fourier-based techniques.
Wavelet analysis provides a joint time–frequency representation, making it particularly well-suited for signals whose spectral properties evolve on short timescales [17]. Applying this technique to the Neutron Star Interior Composition Explorer (NICER) Gendreau et al. [18] observations of MAXI J1535-571, Chen and Wang [19] identified significant differences in spectral and timing properties between light curve segments above and below the wavelet confidence threshold. To quantify the coherence of these oscillations, they introduced the S-factor ( S = τ eff / τ sel ), where τ eff denotes the effective duration of the oscillation signal and τ sel is the total selected time interval, which proved effective in distinguishing type-C from type-B QPOs—especially in cases where traditional PDS metrics yield ambiguous results.
Complementing wavelet analysis, the HHT [20,21] provides a fully adaptive, data-driven framework well suited for detecting QPO behaviors. Through empirical mode decomposition (EMD), signals are separated into intrinsic mode functions (IMFs), and subsequent Hilbert spectral analysis yields instantaneous frequencies with high resolution [22]. Applying HHT, Su et al. [23] investigated a 4 Hz LFQPO in XTE J1550–564 and demonstrated that the signal consists of intermittent oscillatory segments between 3–5 Hz. The broadened QPO peak in the power spectrum was attributed to the aggregation of these short-lived oscillations. Moreover, the detection of distinct amplitude-dependent duration distributions and a positive rms–flux relation provided compelling evidence for the transient, nonstationary nature of LFQPOs, likely associated with Lense–Thirring precession.
To further probe the nonlinear dynamics of QPO production, bicoherence analysis provides a complementary perspective by probing phase relationships among Fourier components [24,25,26]. Unlike second-order statistics such as the power spectrum, bicoherence—a normalized measure of the bispectrum—can identify quadratic phase coupling between frequencies f 1 , f 2 , and their sum f 1 + f 2 , thereby revealing nonlinear interactions and mode coupling that would otherwise remain hidden. This makes it an effective tool for diagnosing the underlying physics of accretion-driven variability, particularly in complex, multi-component systems such as BHXRBs.
Taken together, these advanced time–frequency techniques provide a more comprehensive and physically meaningful view of QPO variability. By jointly capturing transient and nonlinear behaviors that escape traditional approaches, they offer powerful diagnostic tools and place stringent constraints on theoretical models of accretion and the origin of QPOs.
In addition to QPOs, another important feature in the PDS of BHXRBs is broadband noise. Based on the quality factor Q, these components are classified as QPOs when Q > 2 , and as broadband noise when Q < 2 . This classification is widely used in the LHS and IMS [8,27]. Broadband noise is generally attributed to fluctuations in the mass accretion rate, generated on viscous timescales in the outer regions of the accretion flow. These fluctuations propagate inward through the hot flow and influence variability in the innermost regions near the black hole [28,29,30]. Such broadband components are typically observed to break at the local viscous frequency and often appear as Lorentzian features in the PDS. Although perturbations can occur at all radii, those from the outer regions can modulate the inner flow due to the inward propagation of accretion rate fluctuations [31,32].
The Hard X-ray Modulation Telescope (Insight-HXMT) has provided unprecedented high-energy observations that significantly advanced our understanding of BHXRBs. These advances span topics from accretion geometry to black hole spin evolution, as outlined below. Through broadband spectral coverage and high time resolution, Insight-HXMT has enabled key discoveries across multiple domains. These include the detection of magnetic arrested disk (MAD) formation in MAXI J1820+070 [33], the identification of unusual outburst behaviors in systems like SLX 1746–331 [34,35] and MAXI J0637–430 [36] potentially hosting low-mass black holes within the “mass gap,” and detailed constraints on black hole spins via both reflection and continuum-fitting methods. With long-term monitoring of bright transients such as MAXI J1348-630 [37,38] and 4U 1543-47 [39,40], Insight-HXMT has helped to resolve discrepancies between different spin estimation methods and revealed the limitations of the standard thin-disk assumptions, motivating the adoption of slim disk models under near- or super-Eddington accretion regimes. Notably, Insight-HXMT has expanded QPO studies into the >100 keV regime and, through the use of advanced techniques such as HHT, has allowed phase-resolved analyses that reveal the evolving geometry of the corona and jet [41]. In combination with coordinated multi-wavelength and polarimetric observations [42], these results have not only deepened our insight into accretion physics and disk–corona–jet interactions, but also offered critical observational tests for theoretical models of QPO origin and black hole evolution.
In this paper, we summarize the key achievements in timing analysis of BHXRBs obtained since the launch of Insight-HXMT. The structure of the paper is organized as follows: Section 2 introduces the instruments and observational capabilities of Insight-HXMT. Section 3 presents results from traditional timing analyses. Section 4 discusses findings based on wavelet analysis. Section 5 describes the application of the Hilbert–Huang Transform (HHT) and its contributions to timing studies. Section 6 outlines the use of bicoherence analysis in exploring signal coupling. Finally, Section 7 offers a summary and discusses future prospects.

2. Instrument and Performance

Insight-HXMT, China’s first X-ray astronomy satellite, was successfully launched on 15 June 2017, from the Jiuquan Satellite Launch Center in northwestern China. Its Chinese name, ‘Huiyan’, was given in honor of Ze-Hui He. Insight-HXMT operates in a low-Earth orbit with an altitude of 550 kilometers and an inclination of 43° [43]. The satellite’s primary scientific objectives include: searching for new transient sources along the Galactic plane and monitoring known variable sources; observing X-ray binaries to study the dynamics and radiation mechanisms in strong gravitational or magnetic fields; and monitoring and investigating gamma-ray bursts (GRBs) and electromagnetic counterparts of gravitational wave events [44].
The Insight-HXMT satellite is equipped with three X-ray instruments for different energy bands: the High Energy X-ray telescope (HE), the Medium Energy X-ray telescope (ME), and the Low Energy X-ray telescope (LE). We present a schematic diagram of the satellite structure in Figure 1.
HE is designed for observations in the 20–250 keV band and comprises 18 NaI/CsI phoswich scintillation detectors, with a total geometrical area of approximately 5000 cm2. Each cylindrical detector has a diameter of 19 cm, with a 3.5 mm thick NaI crystal as the main detector and a 40 mm CsI layer for active shielding. A 5-inch photomultiplier tube (PMT) collects scintillation photons from both layers. The collimators define three field-of-view (FOV) configurations: fifteen detectors with 1.1° × 5.7°, two with 5.7° × 5.7°, and one blind detector for background measurement. These FOVs are arranged in three groups, separated by 60°. To suppress background noise, HE uses both active and passive shielding: in addition to the CsI(Na), a set of 18 plastic scintillators veto charged particle events in coincidence with detector triggers [45].
ME operates in the 5–30 keV energy range and utilizes 1728 Si-PIN detector pixels organized into three detector boxes, each with three units. Each unit comprises six modules, with 32 pixels per module, read out by VA32TA2 ASICs. The modular design enhances both system reliability and ease of integration. The total geometrical area of ME is 952 cm2 [46].
LE covers the soft X-ray band from 1 to 15 keV using swept charge devices (SCDs) for high time-resolution measurements. LE includes three detector boxes, each equipped with a sun buffer that also functions as a thermal radiator. Each detector box contains two modules, and each module integrates 16 SCD chips. Four CCDs share one collimator, resulting in a total effective area of 384 cm2 (64 cm2 per module) [47].
Insight-HXMT operates in three distinct observational modes: pointing, scanning, and gamma-ray burst (GRB) mode [44]. The pointing mode allows the telescope to observe a fixed target continuously for durations ranging from a single orbit (about 96 min) up to 20 days, making it ideal for detailed spectral and timing studies. In scanning mode, the telescope performs a small-area survey of the Galactic plane. The entire plane is divided into 22 regions, each measuring 20° × 20°. Depending on the scan parameters, the observation of a single patch can last from 2 h to 5 days.
The GRB mode [44,48], implemented specifically for the HE telescope before launch, is designed to capture transient gamma-ray bursts. In this mode, the high voltage applied to the photomultiplier tube (PMT) is reduced, extending the energy sensitivity of the CsI detectors to the 0.2–3 MeV range. This configuration enables the HE instrument to function as a wide-field gamma ray telescope, with a nearly all-sky FOV, a large effective area (>1000 cm2), and microsecond-level time resolution, making it uniquely suited for detecting and studying high-energy transients.
Since its launch, Insight-HXMT has undergone continuous in-orbit calibration. Approximately 5% of the total exposure time is allocated annually for calibration purposes, including regular observations of the Crab and cross-calibration campaigns with other contemporary space-based X-ray missions. These efforts aim to ensure accurate timing and instrumental response performance [49]. Recently, the timing performance of the three Insight-HXMT payloads, HE, ME, and LE, has been calibrated using Crab pulsar observations. A correction method was developed to account for temperature-dependent variations and long-term drift of the onboard oscillator, which is particularly crucial for ME. In addition, subtle corrections for detector dead time were implemented, leading to a moderate improvement in the detection significance of QPOs [50].
The Insight-HXMT background models, are constructed through frequent blank sky observations and the use of blind detectors for instantaneous particle background measurement. They achieve typical precisions of 2.1%, 1.6%, and 4.6% for HE, ME, and LE respectively, with blank-sky observations accounting for approximately 7% of the annual exposure time [43,44,51]. For the HE telescope, the background model is developed from two years of blank sky data using a grid-based method to capture long-term geographical variations, while the data from the blind detector are used to correct for short-term fluctuations [52]. The background of the ME telescope is mainly caused by charged environmental particles and is modulated by the geomagnetic field and geographic location [53]. The background of the LE telescope consists of two main components: a dominant particle background above 7 keV and a diffuse X-ray background below 7 keV, both restricted by the use of more than 150 high-latitude blank sky observations [54]. Liao et al. [55] presented the five-year in-orbit background evolution of Insight-HXMT, demonstrating that the background characteristics, such as spectral shape, intensity variation, and geographic distribution, remain stable over time, and the existing models continue to perform reliably for current spectral and timing analyses.

3. Traditional Timing Analysis

3.1. QPO Analysis

Traditional analysis methods typically involve performing a Fourier transform on the observed light curves and fitting their frequency-domain features with multiple Lorentzian functions. This allows for the extraction and study of key QPO parameters such as frequency, width, rms amplitude, and phase lag. Following the discovery of MAXI J1535-571 by MAXI [56] and Swift [57], Insight-HXMT initiated Target of Opportunity observations, which were carried out from 6–23 September 2017. To study the variability, the PDS were generated from 64 s data intervals with a time resolution of 1/128 s for each observation [58]. After subtracting the Poisson noise, the PDS were normalized following the method of Miyamoto et al. [59] and fitted with a combination of Lorentzian components [27]. Cross-spectra were computed from 16-s segments between the 1–3 keV and 3–7 keV light curves obtained by Insight-HXMT LE band. For each observation, the average cross-spectrum was calculated based on the complex Fourier coefficients of the two energy bands. The phase lag at each frequency was then derived from the argument of the averaged cross-spectrum, with its uncertainty estimated from the variance in both the real and imaginary components. In the resulting phase-lag spectra, positive values indicate that hard photons lag behind soft photons. To quantify the phase-lag behavior of the QPOs, the phase lags were measured within a frequency range centered on the QPO centroid and spanning its width.
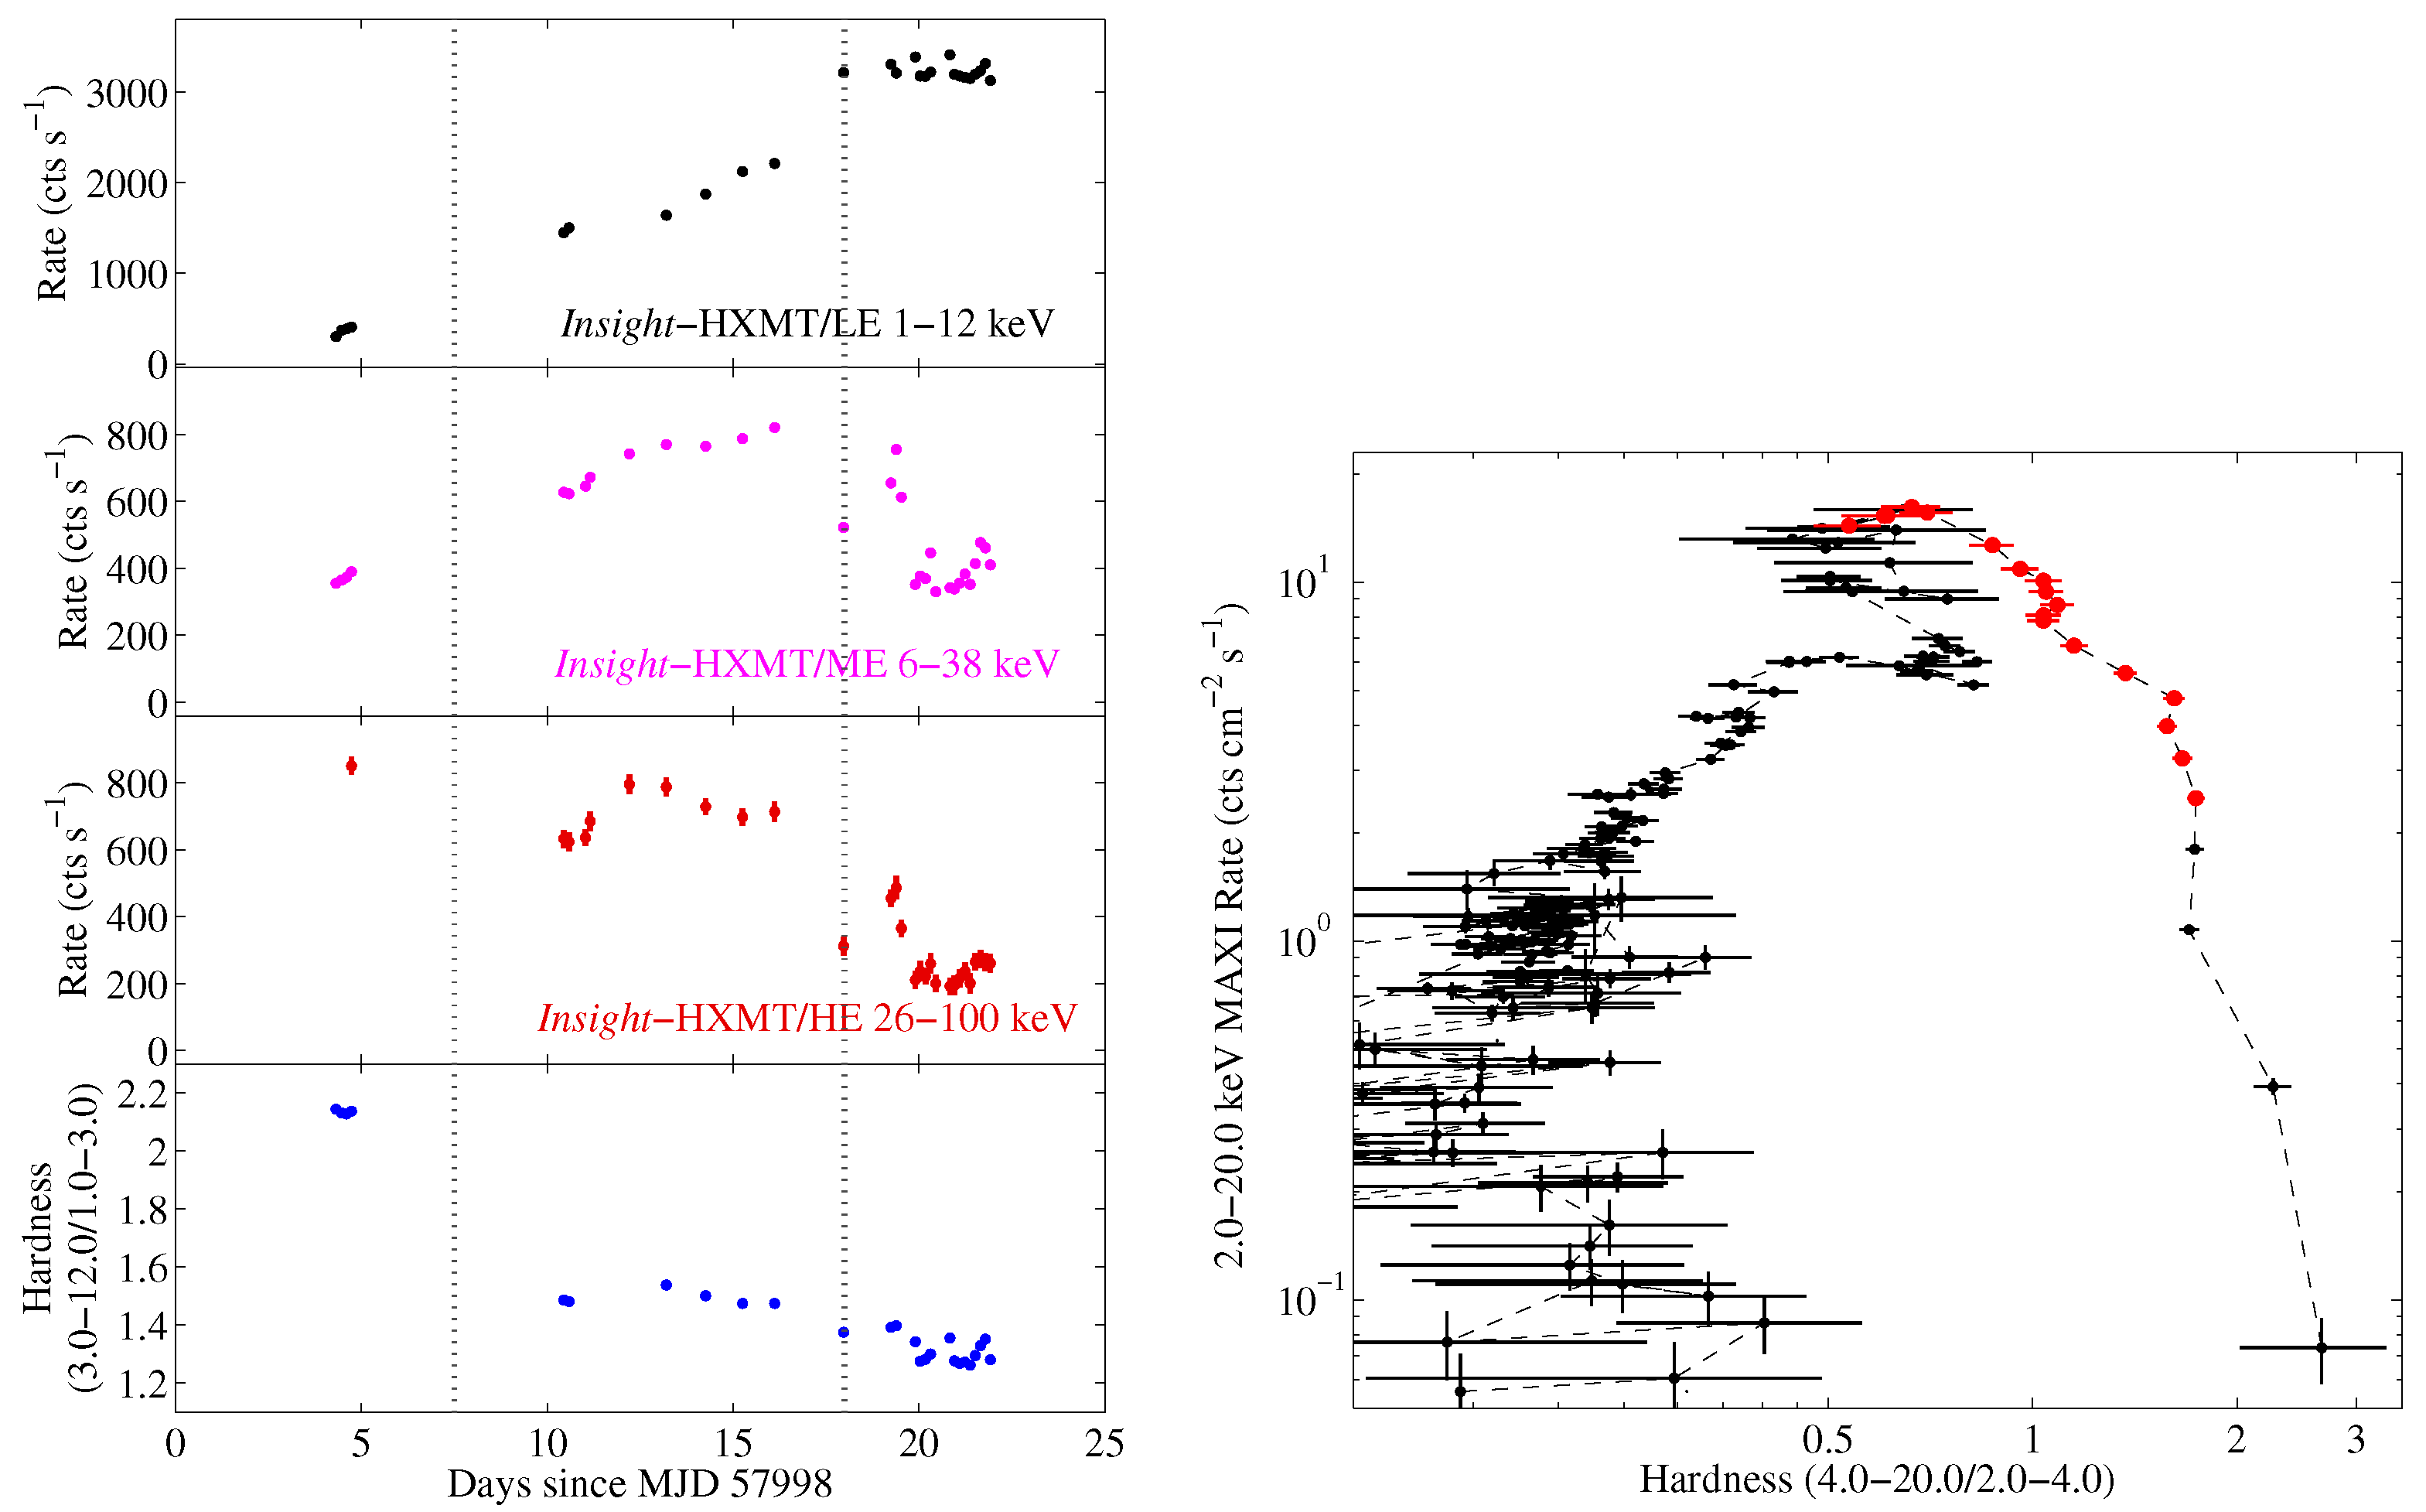
As reported in Huang et al. [58], the background-subtracted light curves of MAXI J1535-571 observed by Insight-HXMT and hardness evolution are shown in Figure 2. The light curves showed a gradual rise and fluctuations across energy bands, while the spectral hardness decreased significantly during the early stages. The hardness, defined as the ratio of count rates in the 3–12 keV and 1–3 keV bands, remained steady at ∼2.1 during the early exposures around MJD 58002, but dropped abruptly to ∼1.5 near MJD 58008 and subsequently declined more gradually. A relatively complete pattern is described by MAXI data in the right panel of Figure 2, with Insight-HXMT observations marked with red points. The outburst starts at the lower right of the figure, corresponding to the LHS, where the fractional rms remains at ∼26%. When the intensity increases, the source on the HID starts moving to the upper left, and the fractional rms drops to ∼15% on MJD 58008.
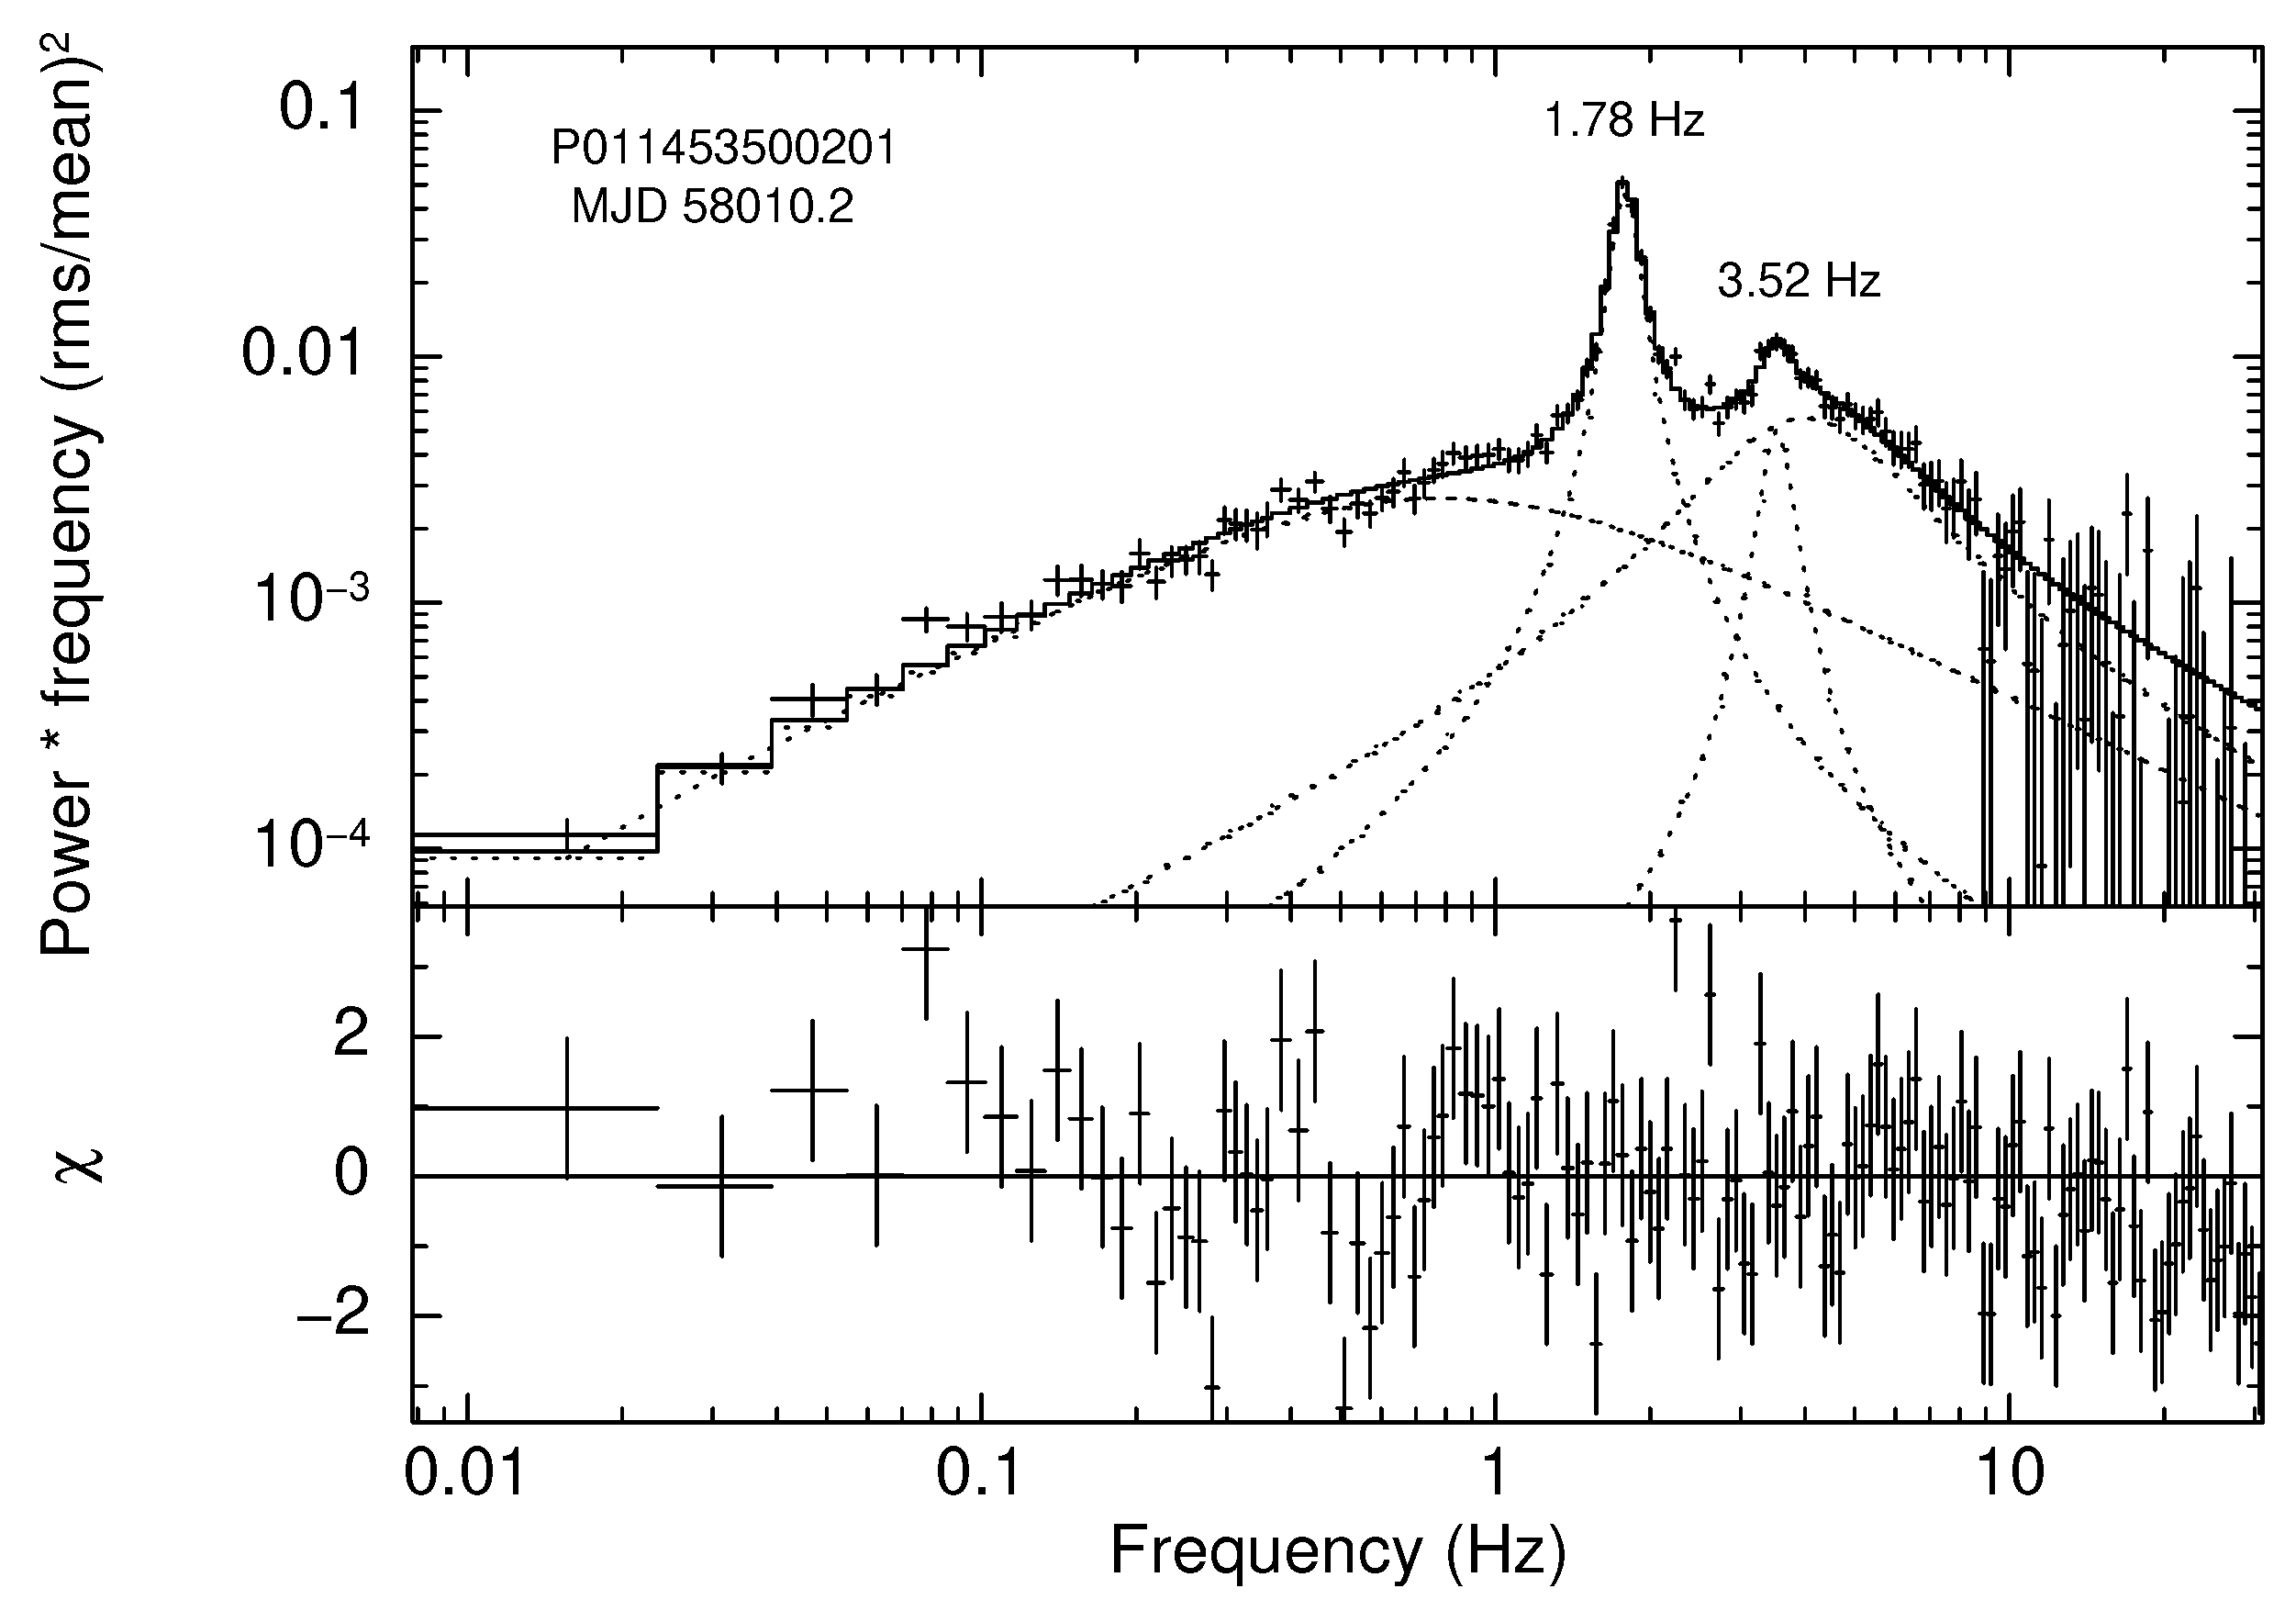
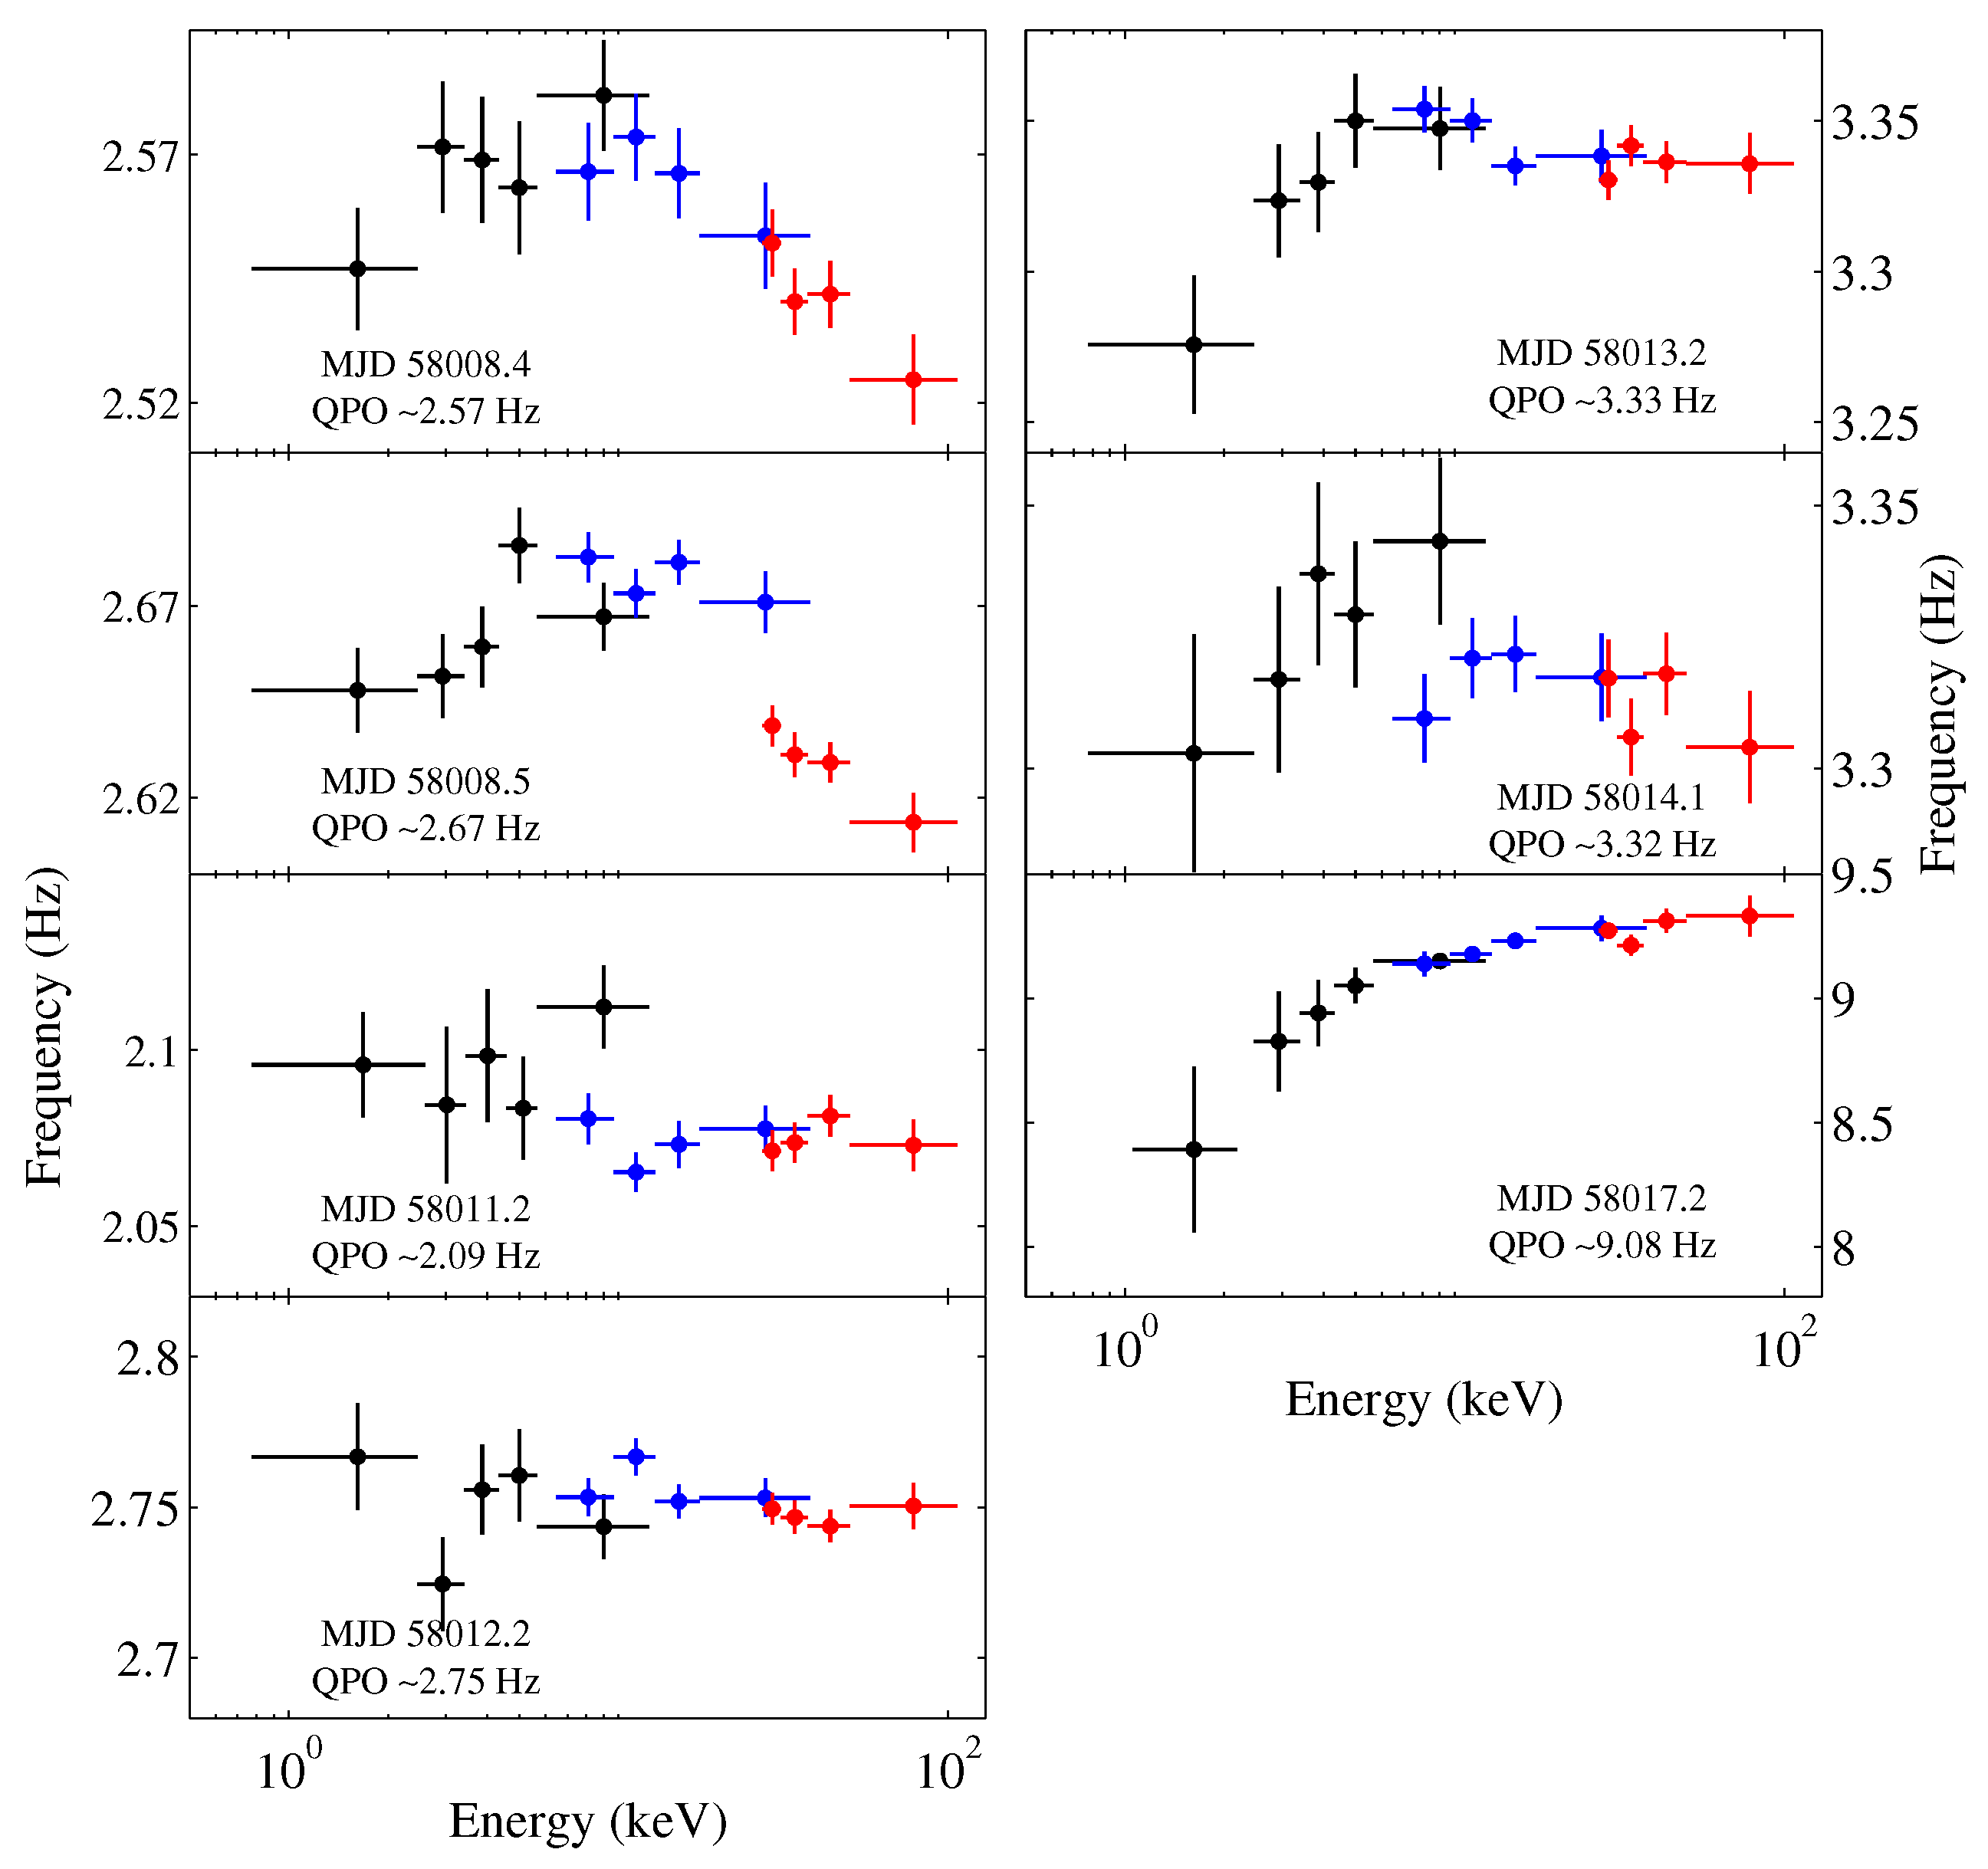
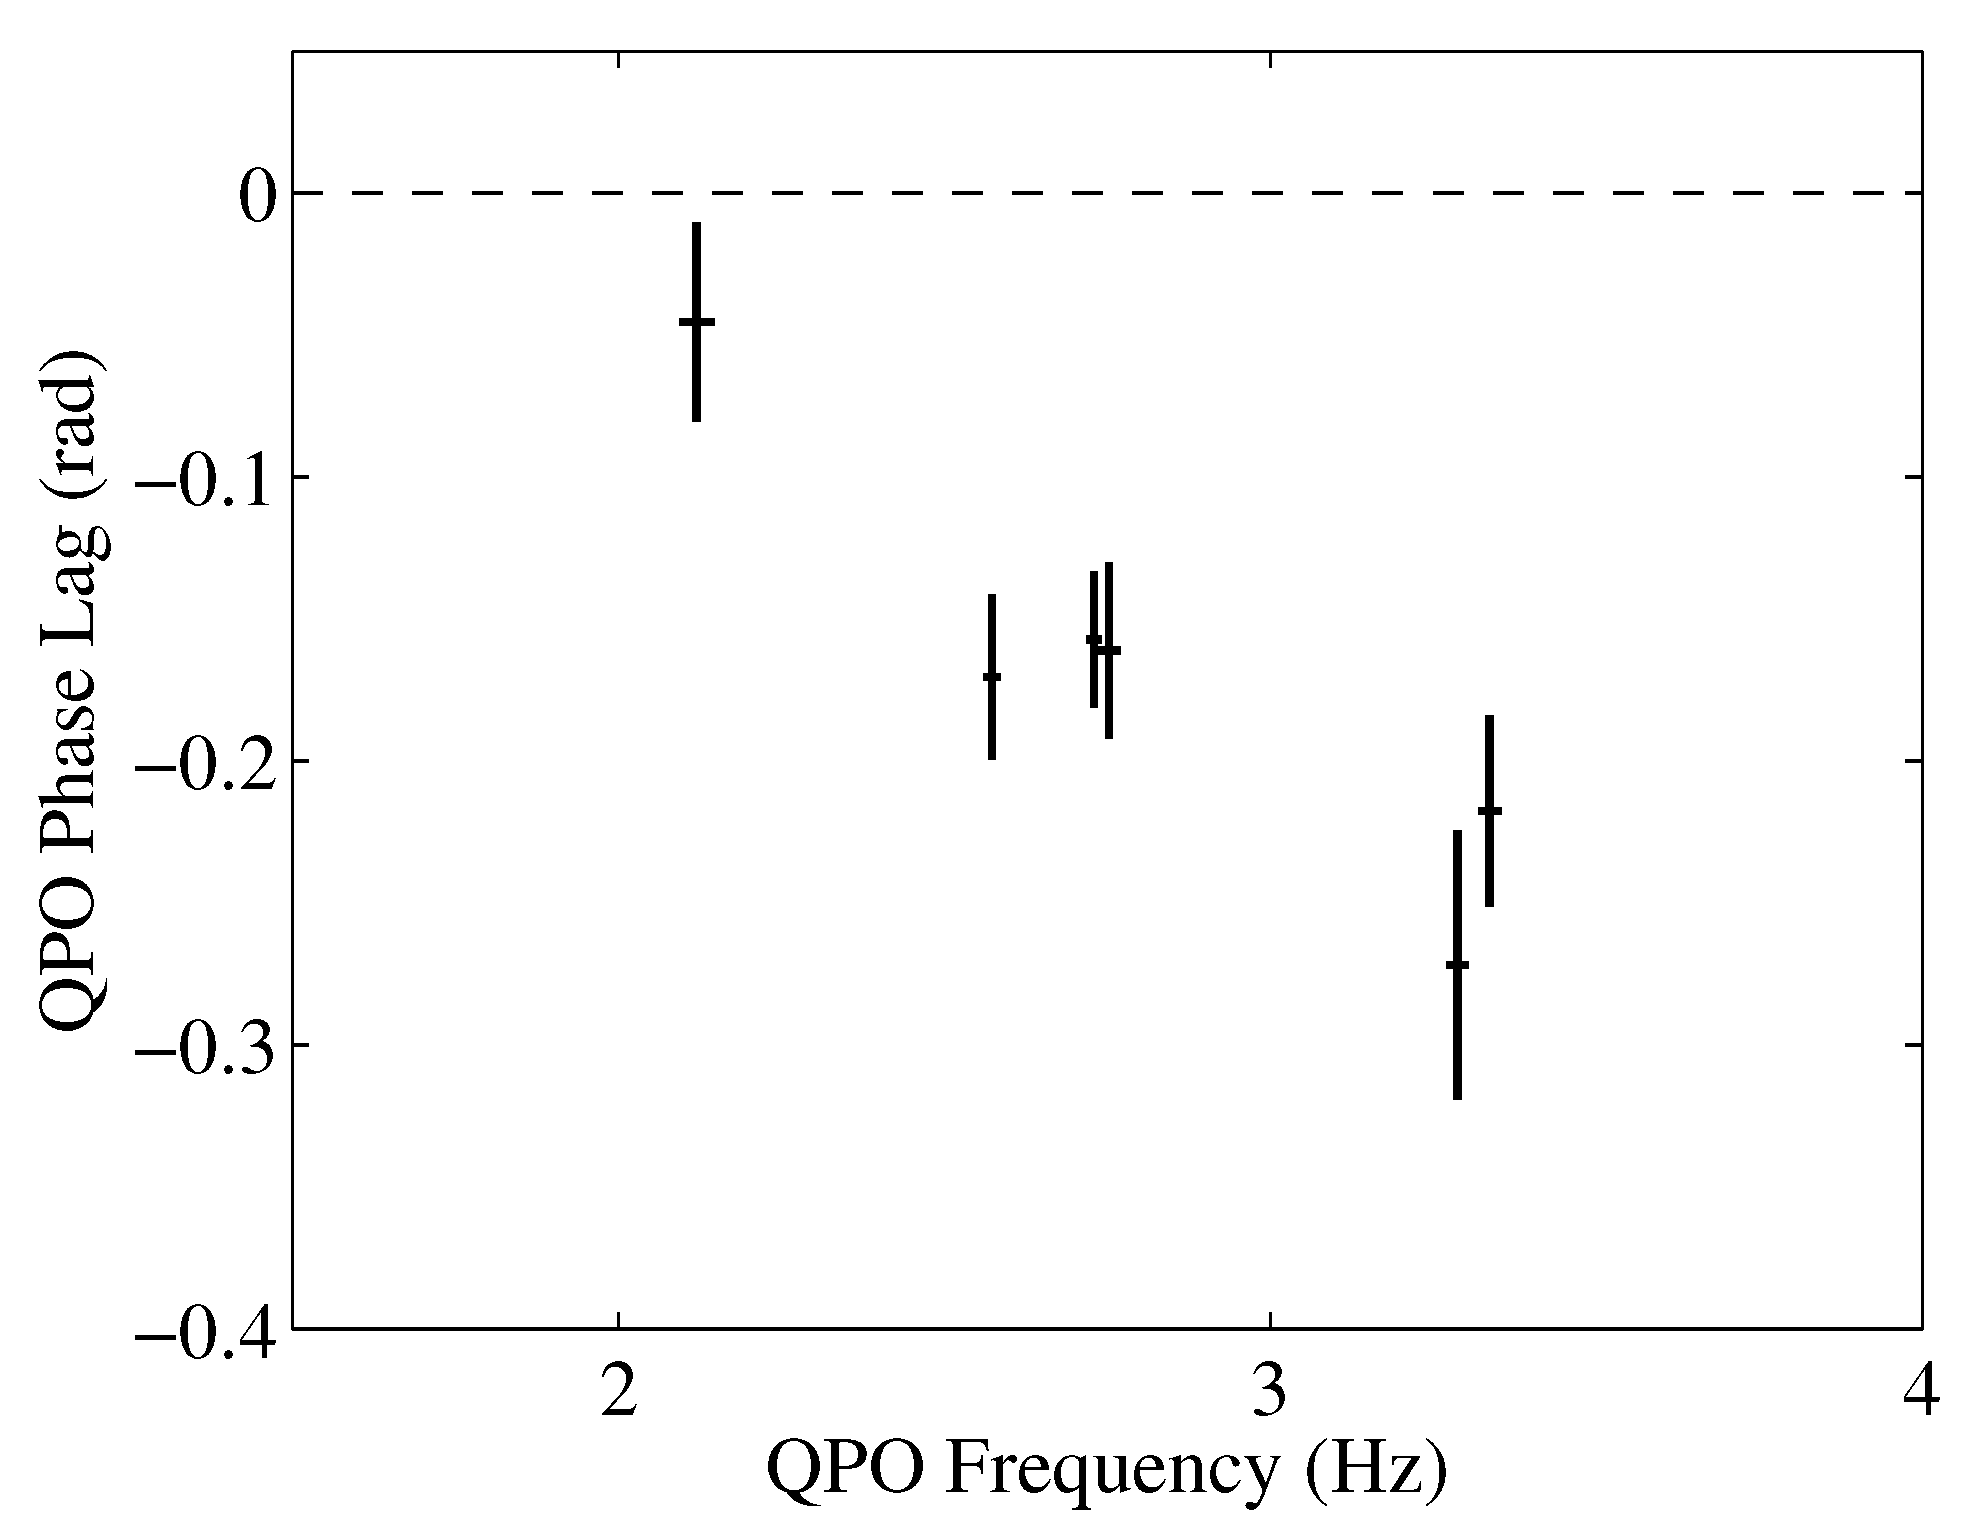
A typical PDS and its corresponding fit obtained using the conventional method are shown in Figure 3. The energy dependence of the QPOs can be derived from the fitting results across different energy bands, as shown in Figure 4 and Figure 5. Phase lags serve as an important diagnostic of both the physical and geometric properties of black hole X-ray binaries. Figure 6 presented the phase lag spectra during the hard-intermediate state (HIMS).
Huang et al. [58] presented the first study of the fractional rms amplitude and centroid frequency of type-C QPOs as functions of photon energy up to 100 keV. The rms increases with energy up to about 20 keV and then stays nearly constant. Similar energy-dependent rms patterns have been seen in other black hole binaries like GRS 1915+105, H1743-322, XTE J1859+226, and XTE J1550-564, supporting a corona origin of type-C QPOs. The Lense-Thirring precession model predicts that rms flattens above 10 keV for systems seen at high inclination, consistent with this results.
The relation between QPO frequency and photon energy shows three shapes: flat, positive, and arch-like. In some sources, this relation changes from negative to positive correlation as QPO frequency rises, explained by differential precession of inner and outer accretion flows. In MAXI J1535-571, the turnover at energies above 10 keV may be caused by reflection of X-rays from the outer flow, which precesses more slowly.
The phase lag exhibits a strong correlation with the QPO centroid frequency, decreasing as the frequency increases. Van den Eijnden et al. [60] demonstrated that the phase lags of type-C QPOs depend sensitively on the system’s inclination angle, showing evolution in both magnitude and sign as a function of QPO frequency. At low frequencies, all sources exhibit slightly hard lags; however, at higher frequencies, sources with high inclination angles develop soft lags, whereas those with low inclination angles display increasingly hard lags. These findings provide strong support for geometric origin of type-C QPOs. MAXI J1535-571 is consistent with the trend observed in high-inclination sources. Furthermore, spectral analysis [61] indicate inclination angles in the range of approximately 57° to 75°, in agreement with the inclination inferred from the phase lag behavior.
Using a similar data analysis method, Wang et al. [62] analyzed the temporal evolution of MAXI J1820+070 during its 2018 hard-state outburst (MJD 58,190–58,289) using Insight-HXMT data (1–150 keV). They found changes in hardness ratio, fractional rms, and time lags around MJD 58,257, suggesting a transition. Low-frequency (2–10 mHz) time lags showed both soft and hard lags on timescales of tens of seconds, while high-frequency (1–10 Hz) lags were hard and varied on millisecond timescales, increasing before MJD 58,257 and decreasing after. High-frequency lags correlated with the photon index from NICER spectra, consistent with Comptonization in a jet.
Subsequently, Timing analysis of multiple sources were performed using observations from the Insight-HXMT. Liu et al. [63] presented a detailed timing analysis of the black hole candidate EXO 1846-031 during its 2019 outburst using data from Insight-HXMT, NICER, and MAXI. The outburst was classified into four spectral states, with type-C QPOs detected by NICER (about 0.1–6 Hz) and Insight-HXMT (about 0.7–8 Hz). The study revealed a break in the QPO rms-frequency relation around 2 Hz in the 1–10 keV band. This feature may be inclination-dependent, suggesting a high inclination for EXO 1846-031. Correlations between QPO frequency and other parameters—including QPO rms, spectral hardness, total fractional rms, and count rate—support a non-thermal origin for type-C QPOs, consistent with trends seen in other transient black hole systems. Jin et al. [64] used Insight-HXMT data from February to March 2021 to study the X-ray timing of a new outburst of GX 339-4. They found the source changed from a LHS to a HIMS. During this change, low-frequency type-C QPOs appeared with frequencies increasing from 0.1–0.6 Hz in LHS to 1–3 Hz in HIMS. For the first time, QPOs above 50 keV were detected in this system. The QPO strength stayed steady over time but got weaker at energies above about 10 keV. The phase lag of the QPO was near zero at first but became positive later, showing a hard lag of about 0.6–1.2 radians between 50 and 100 keV.
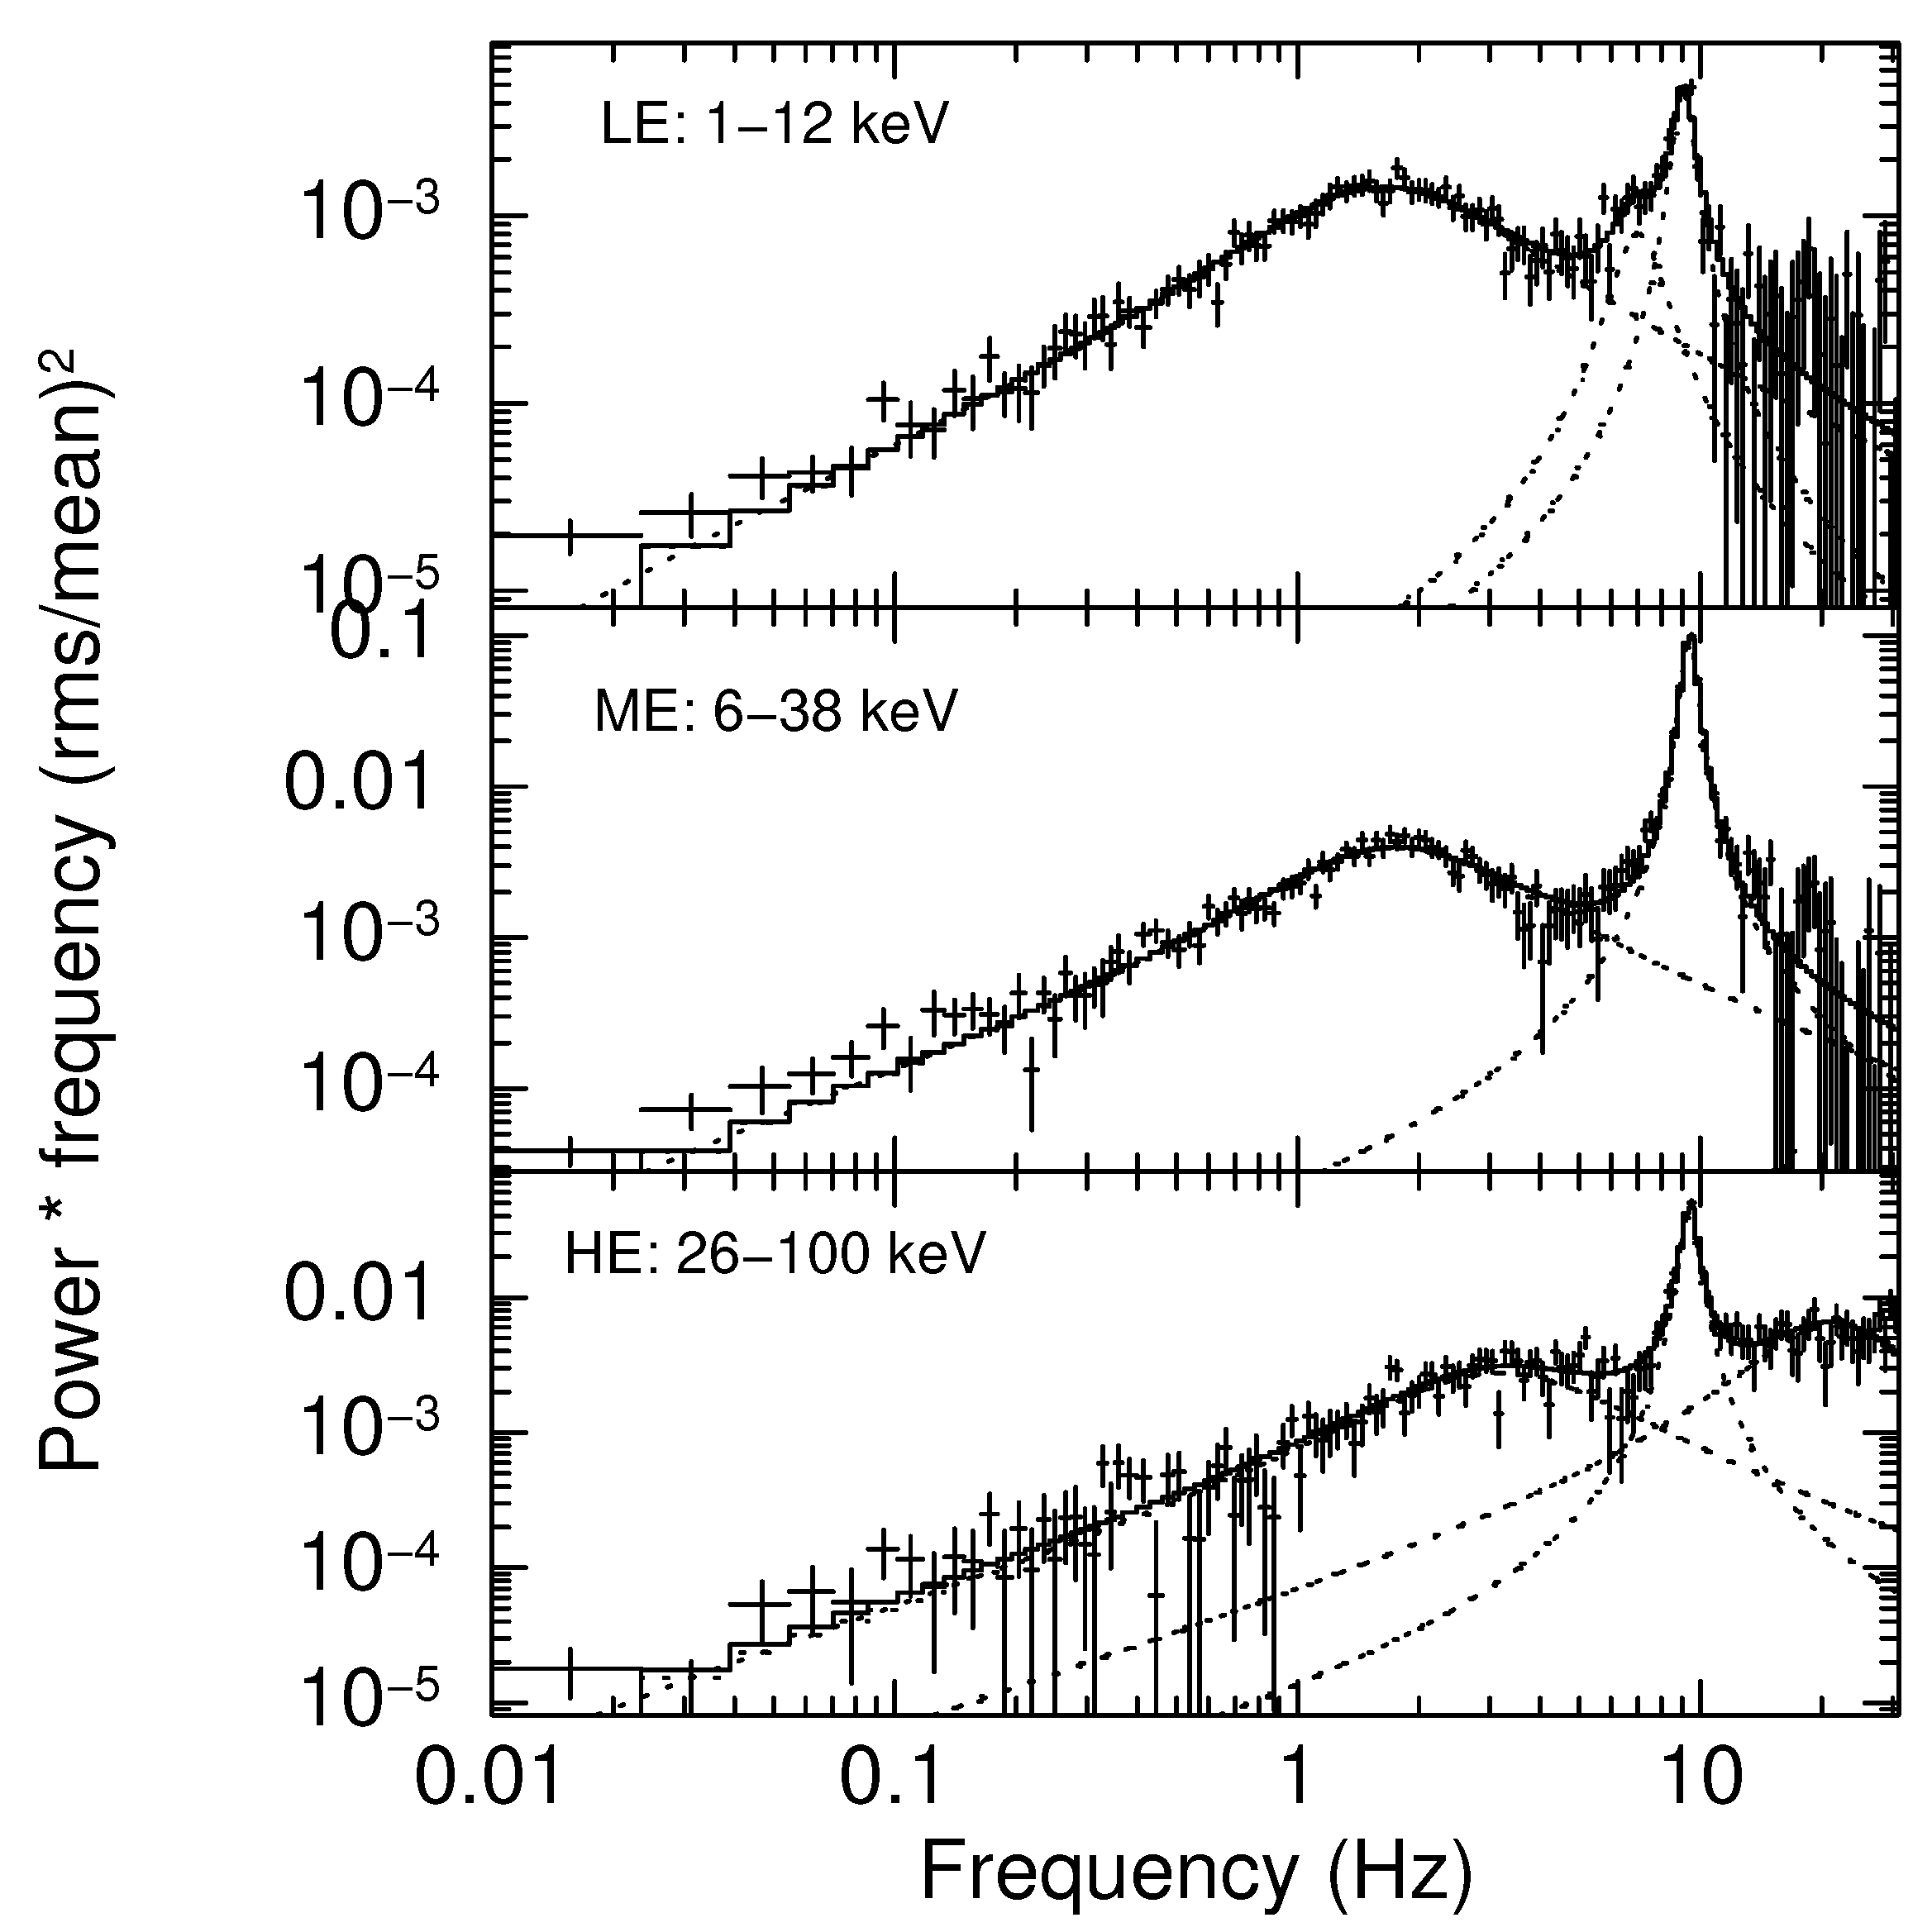
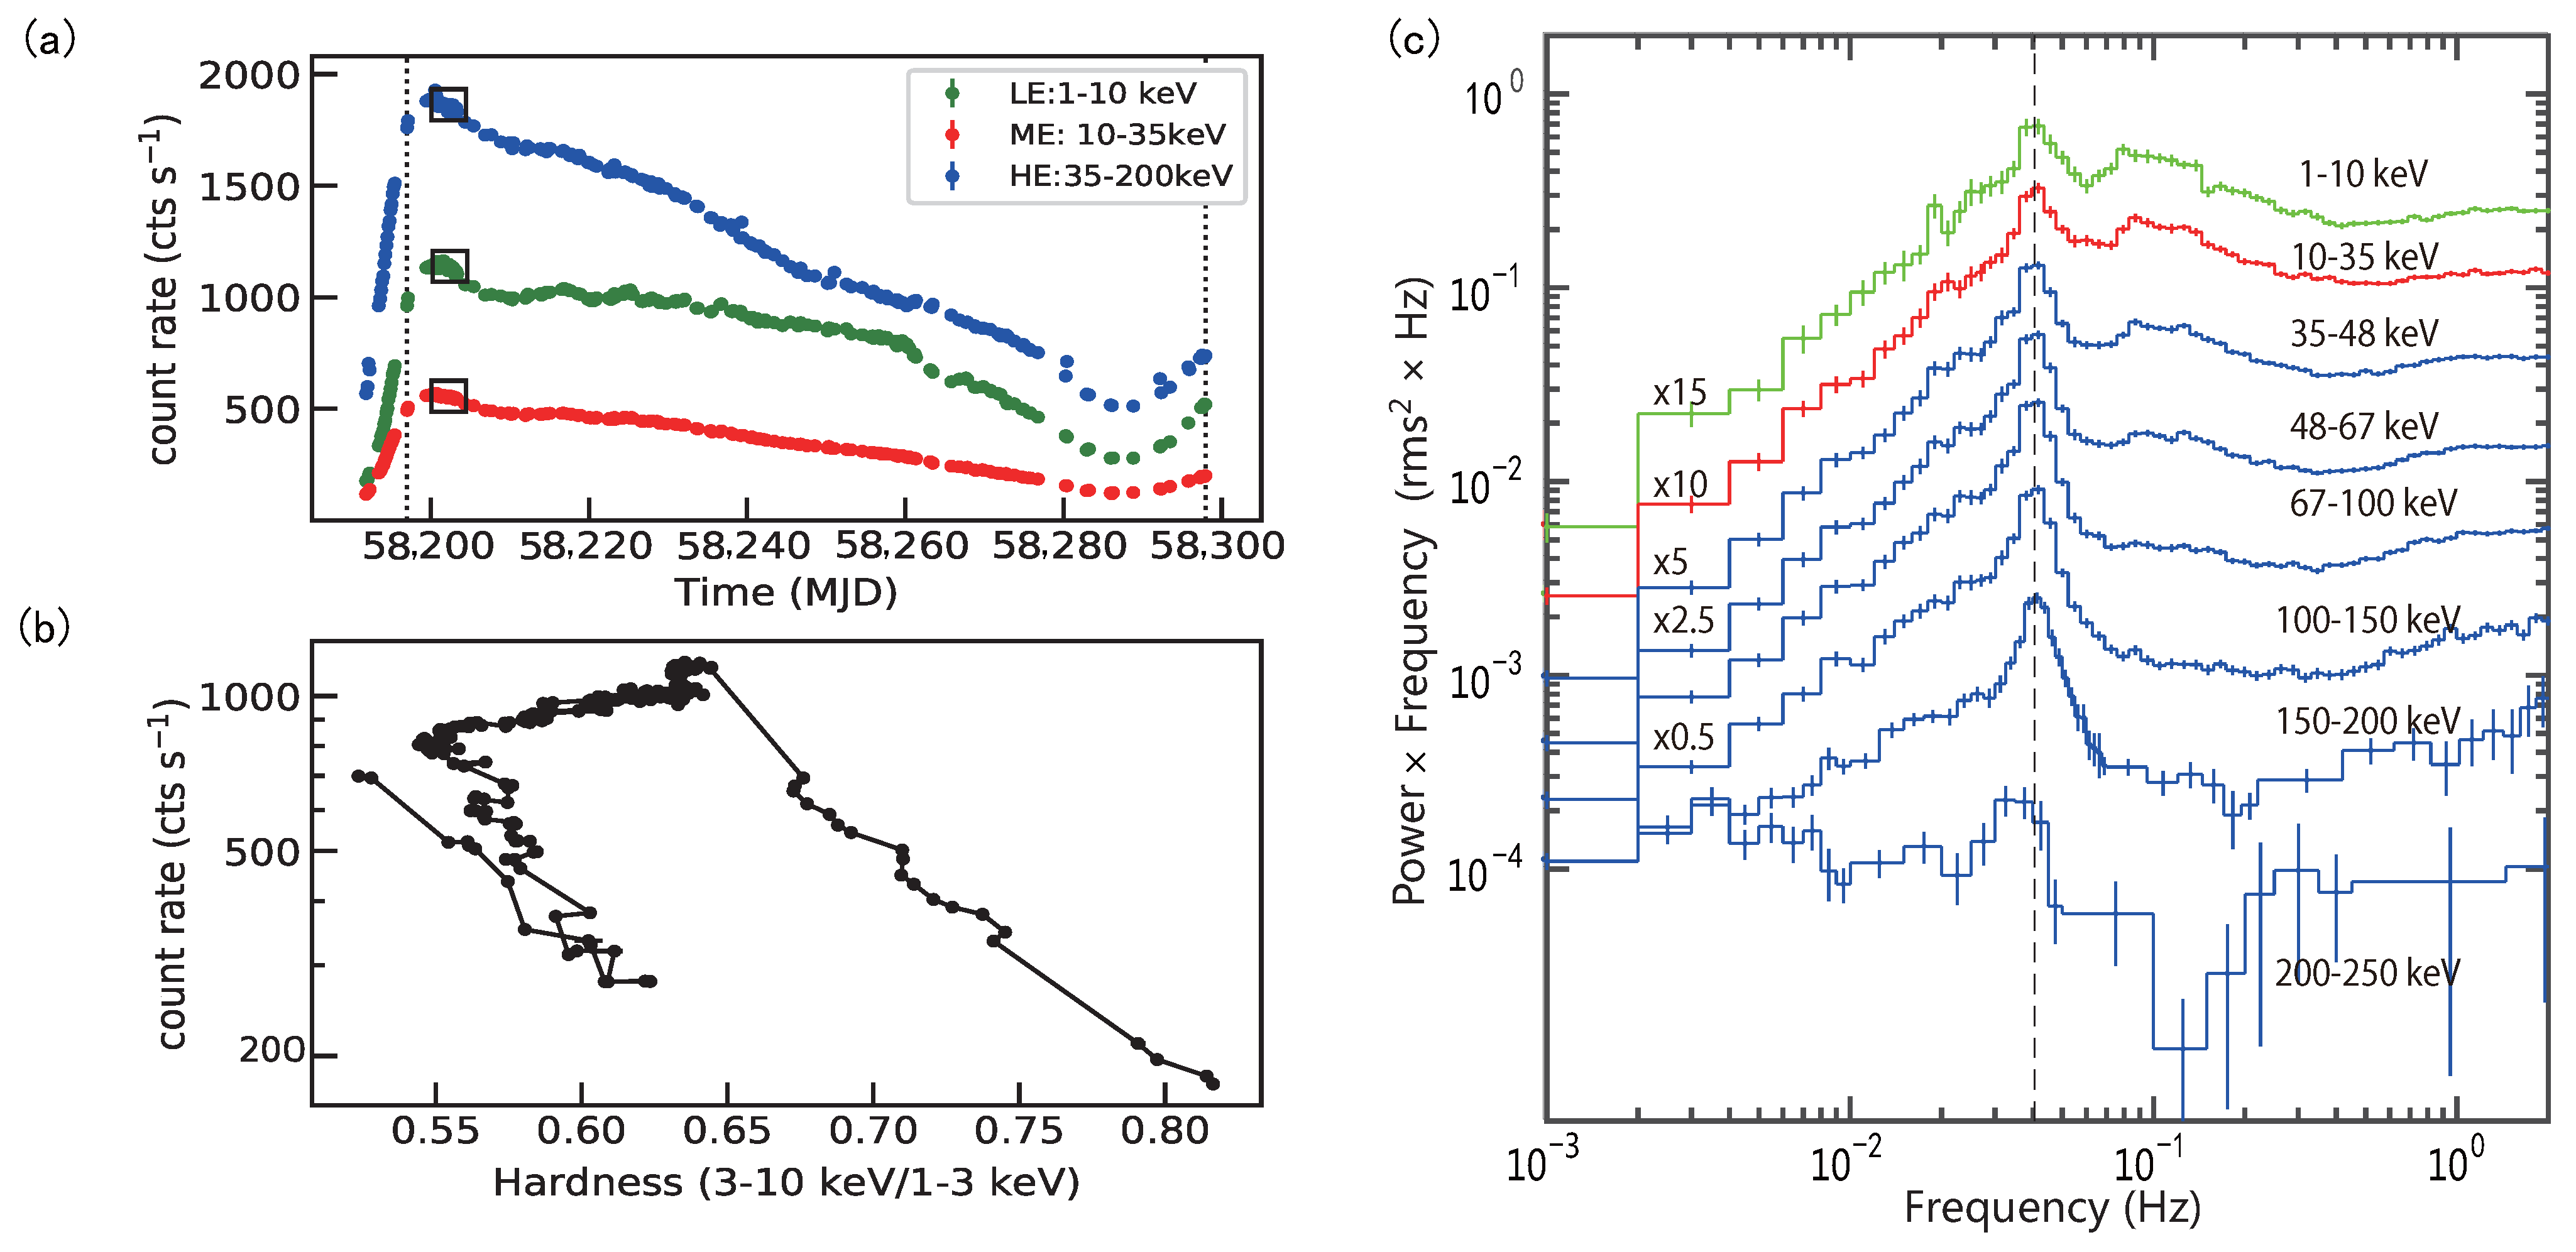
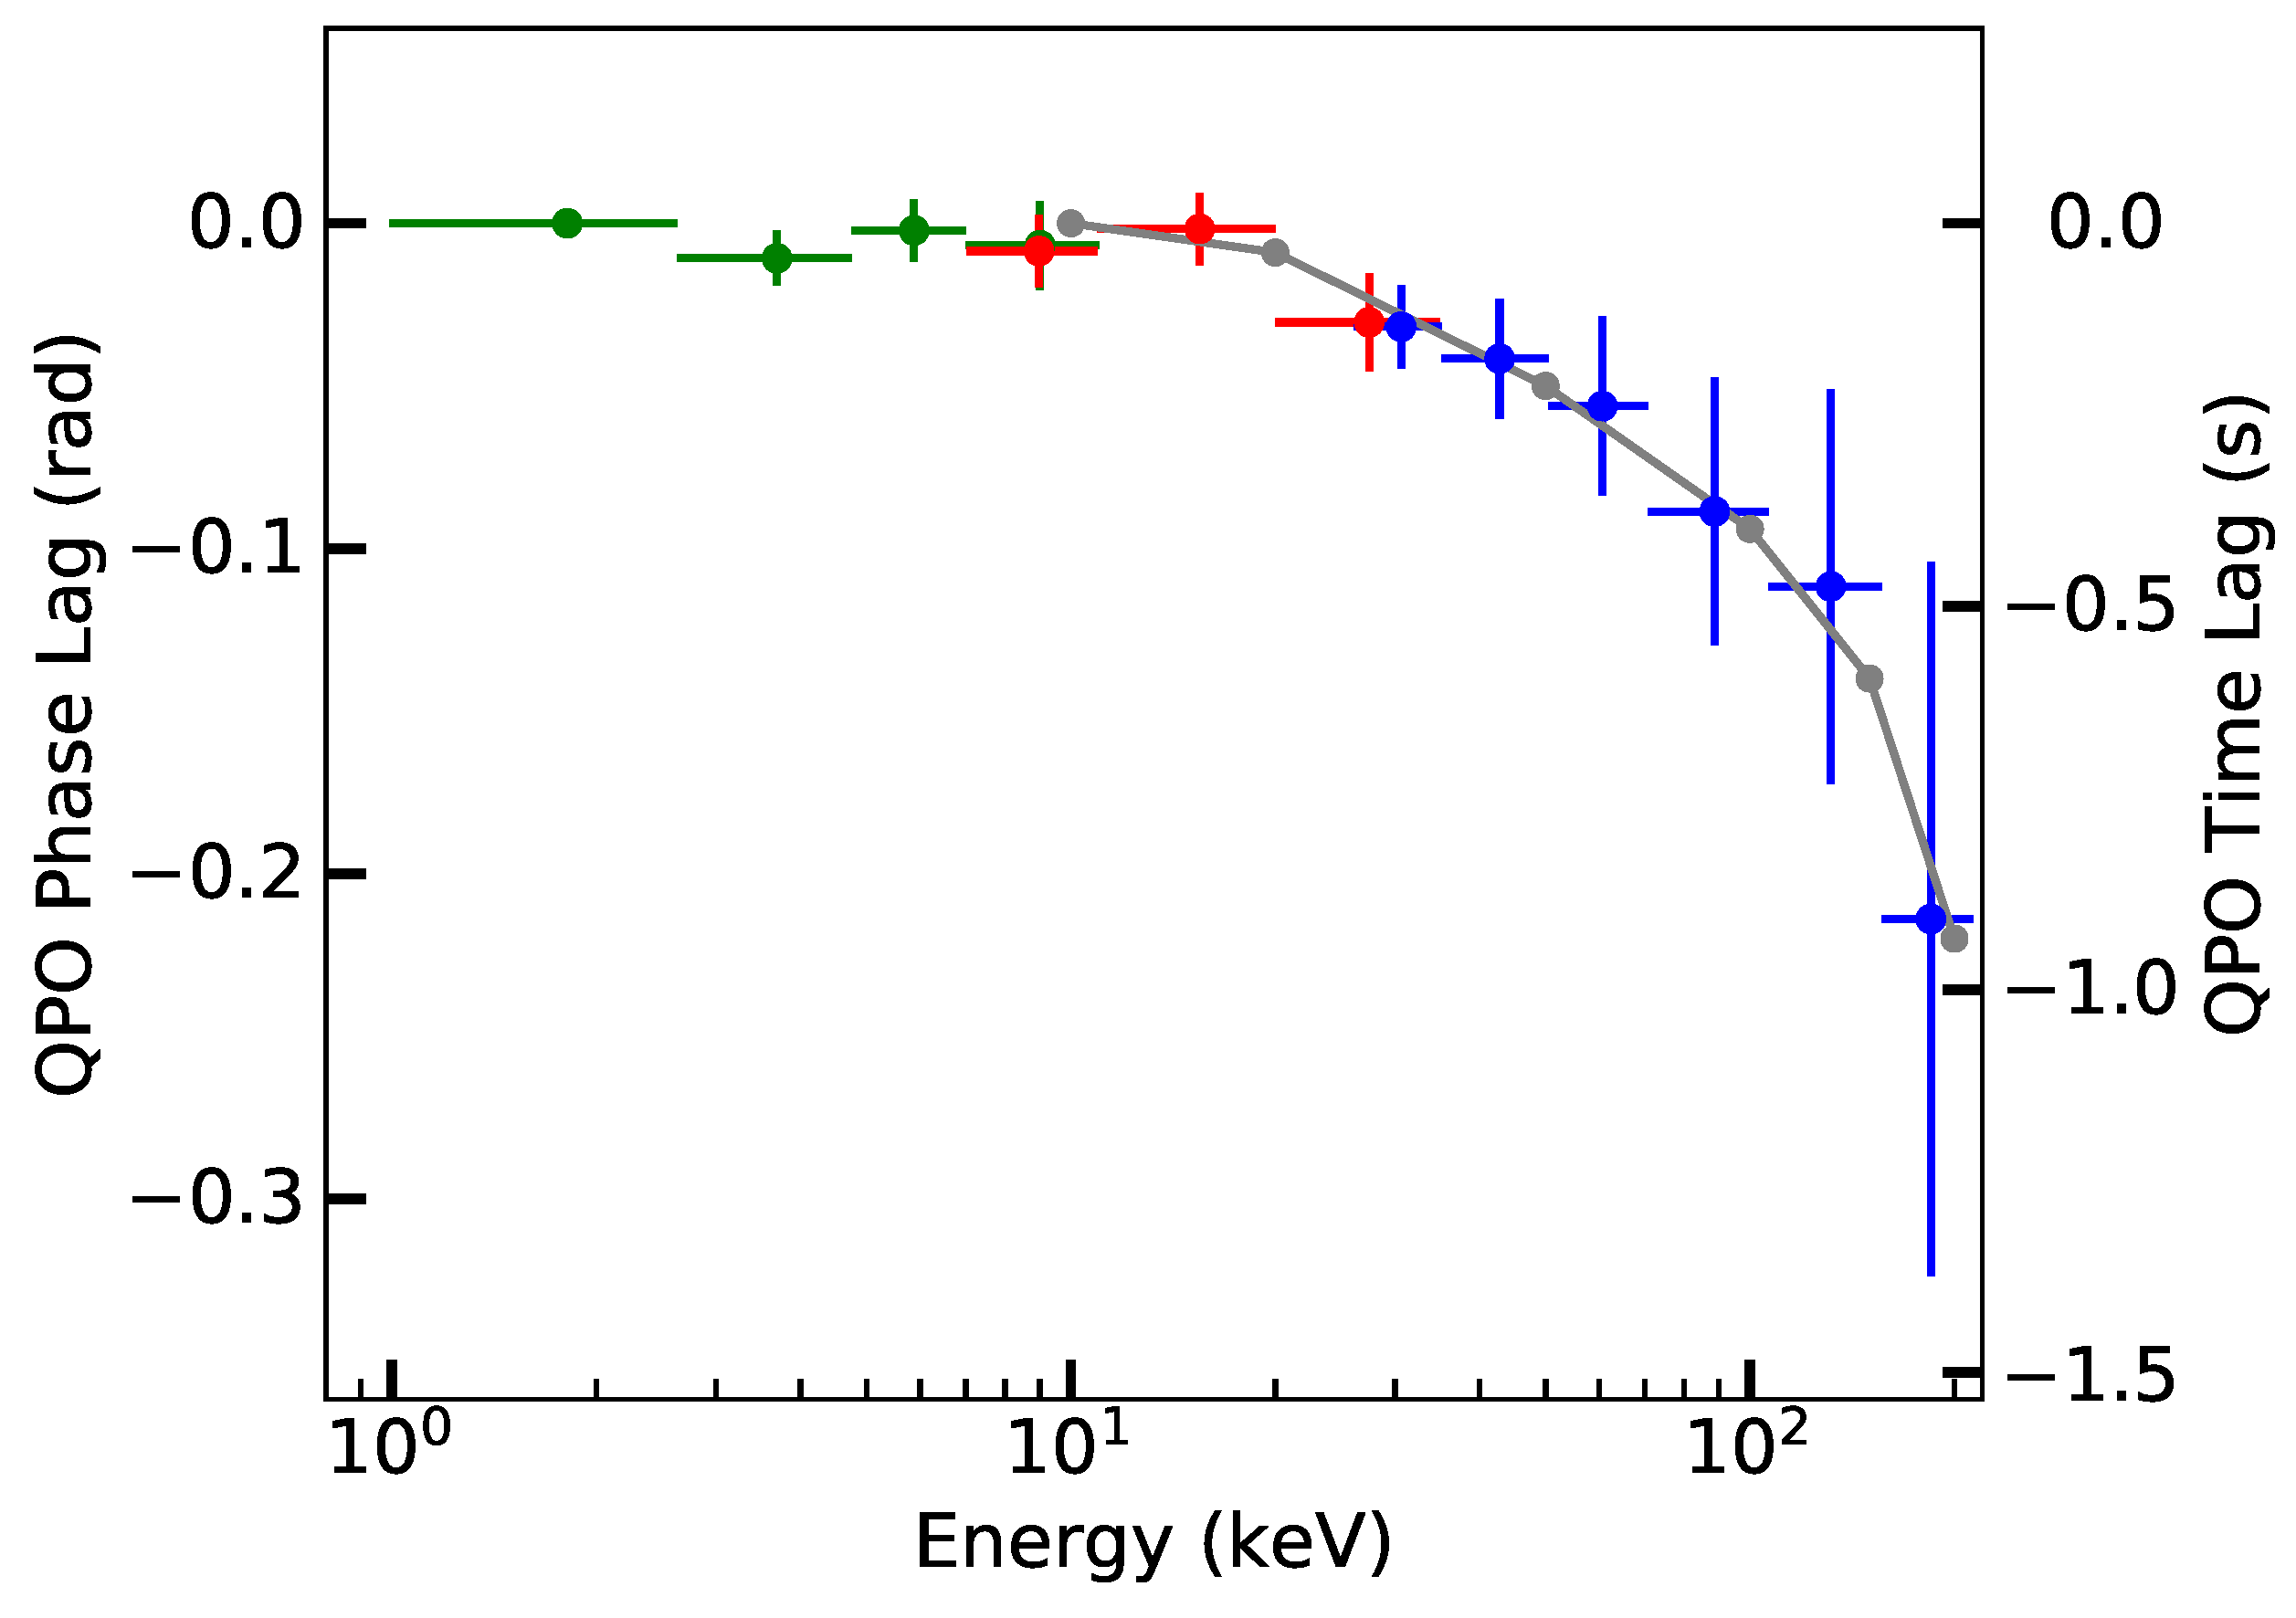
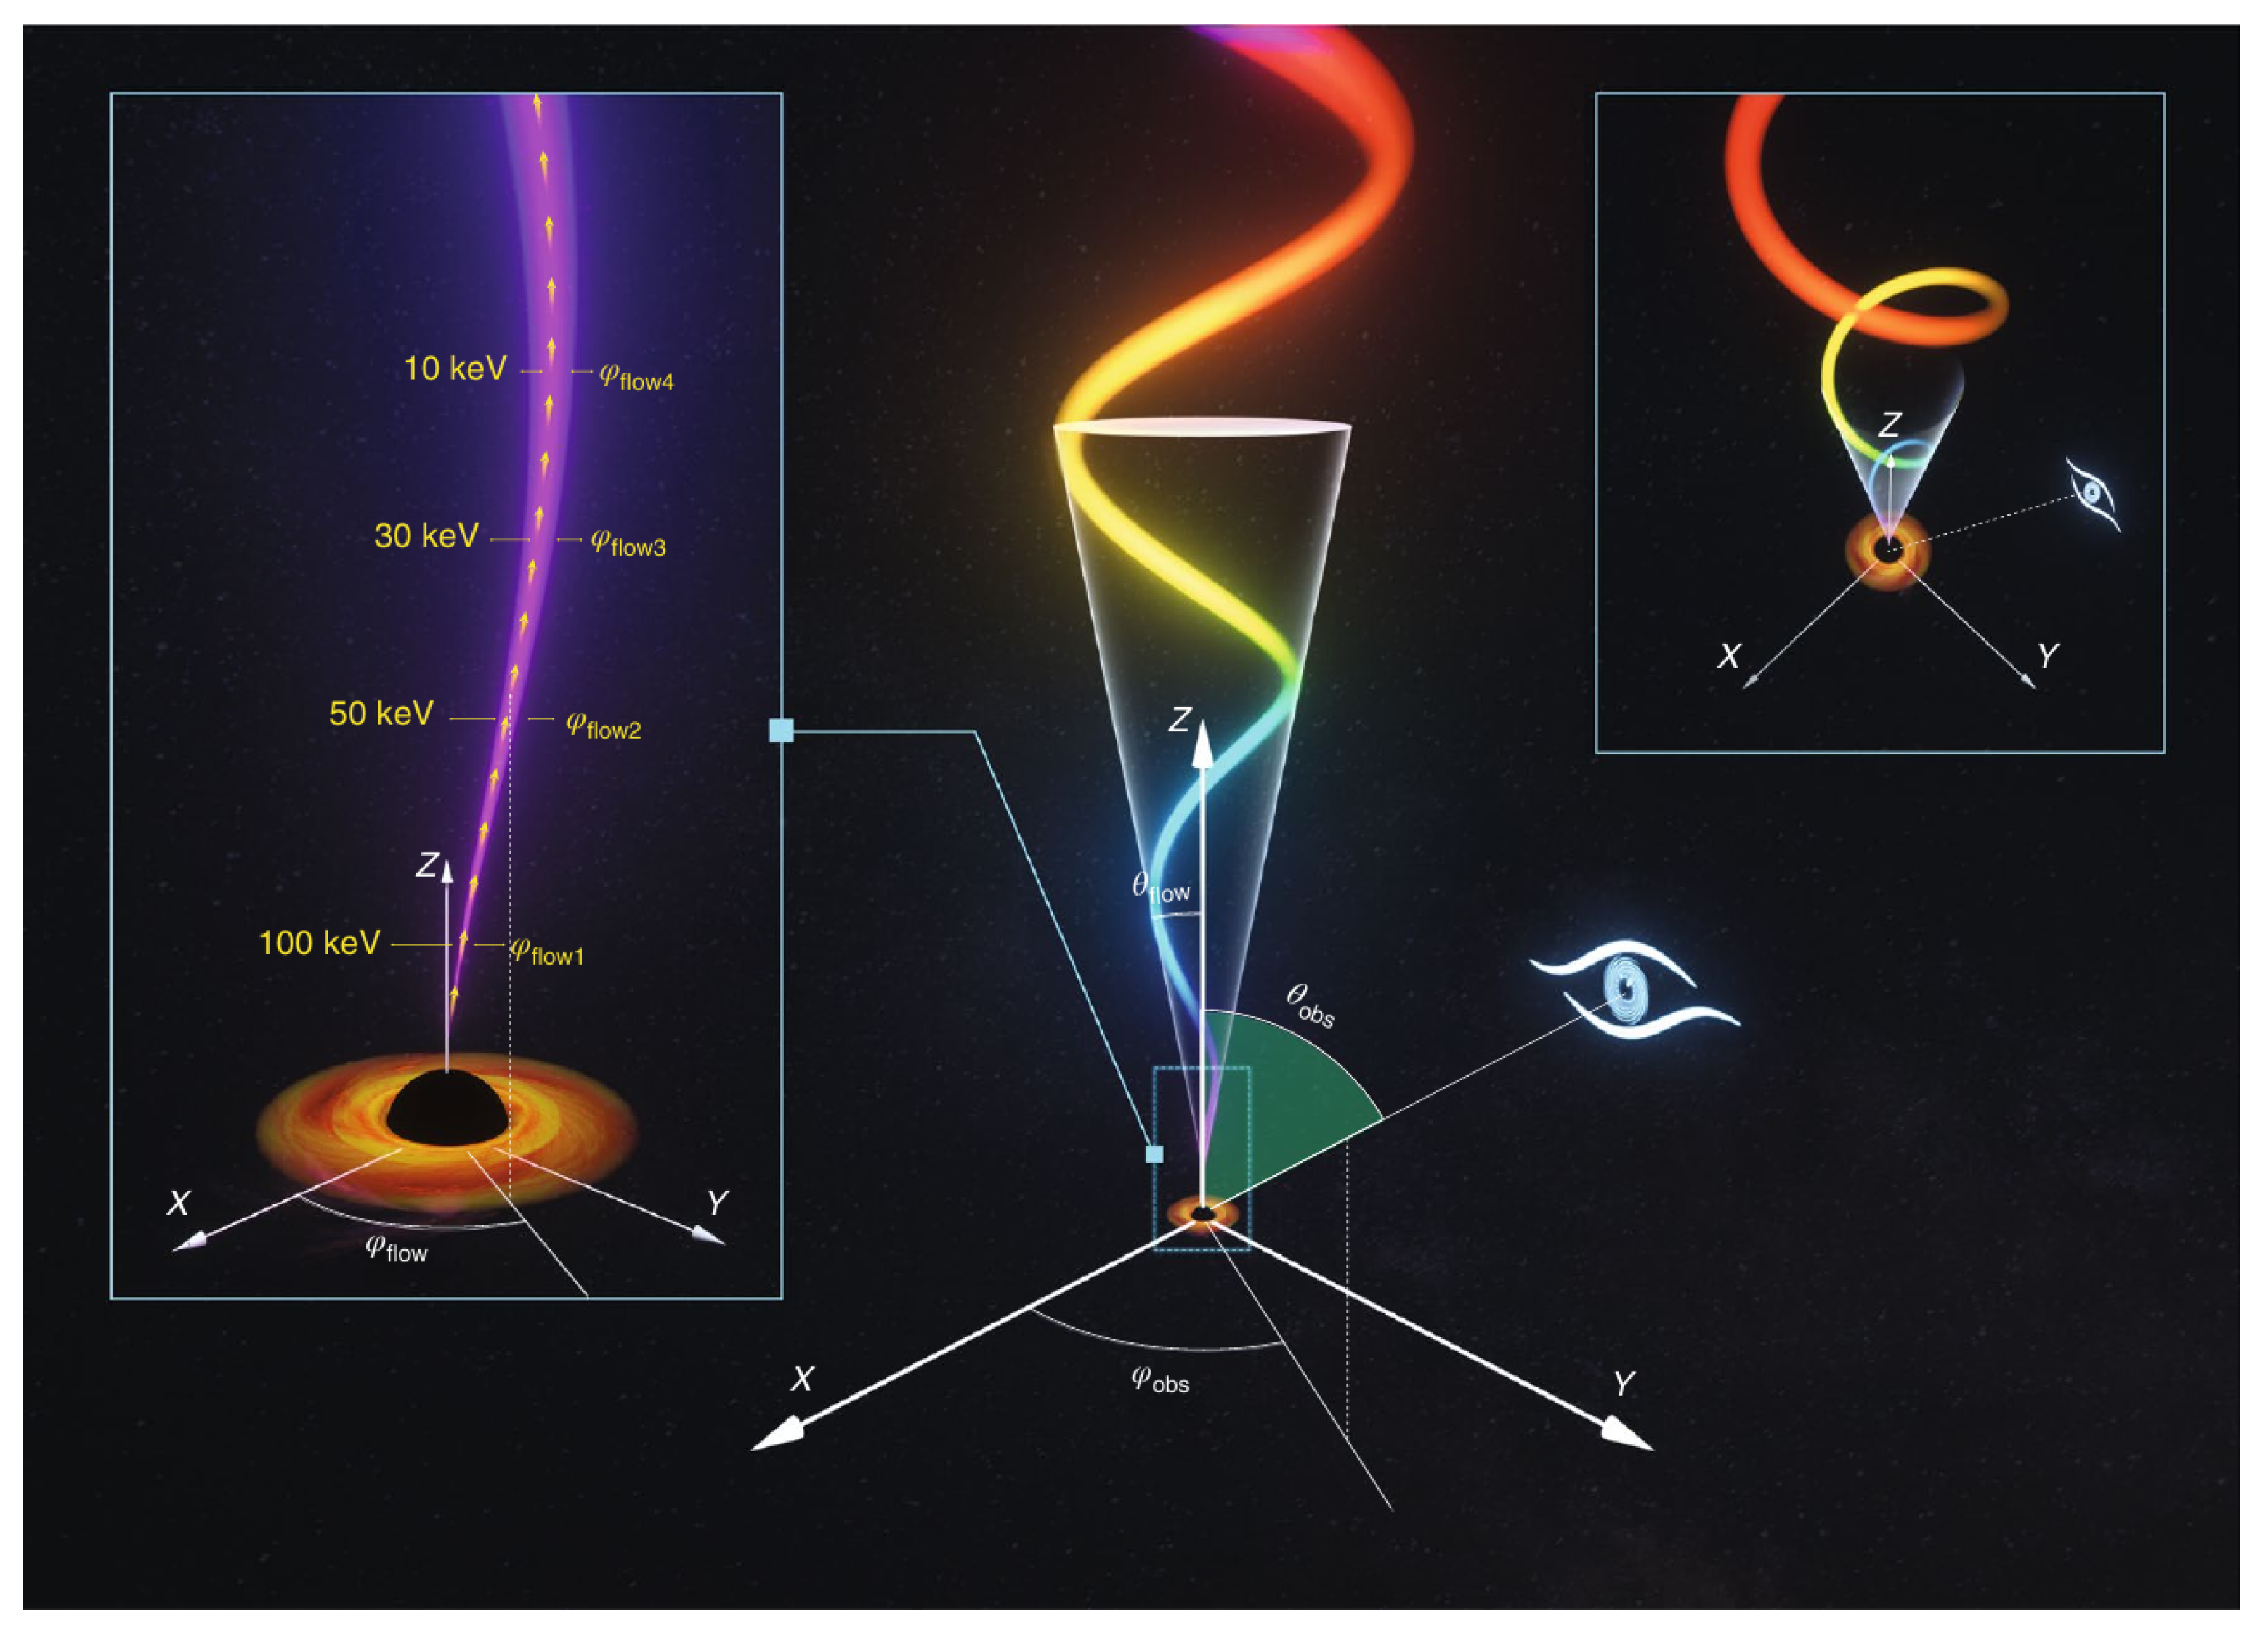
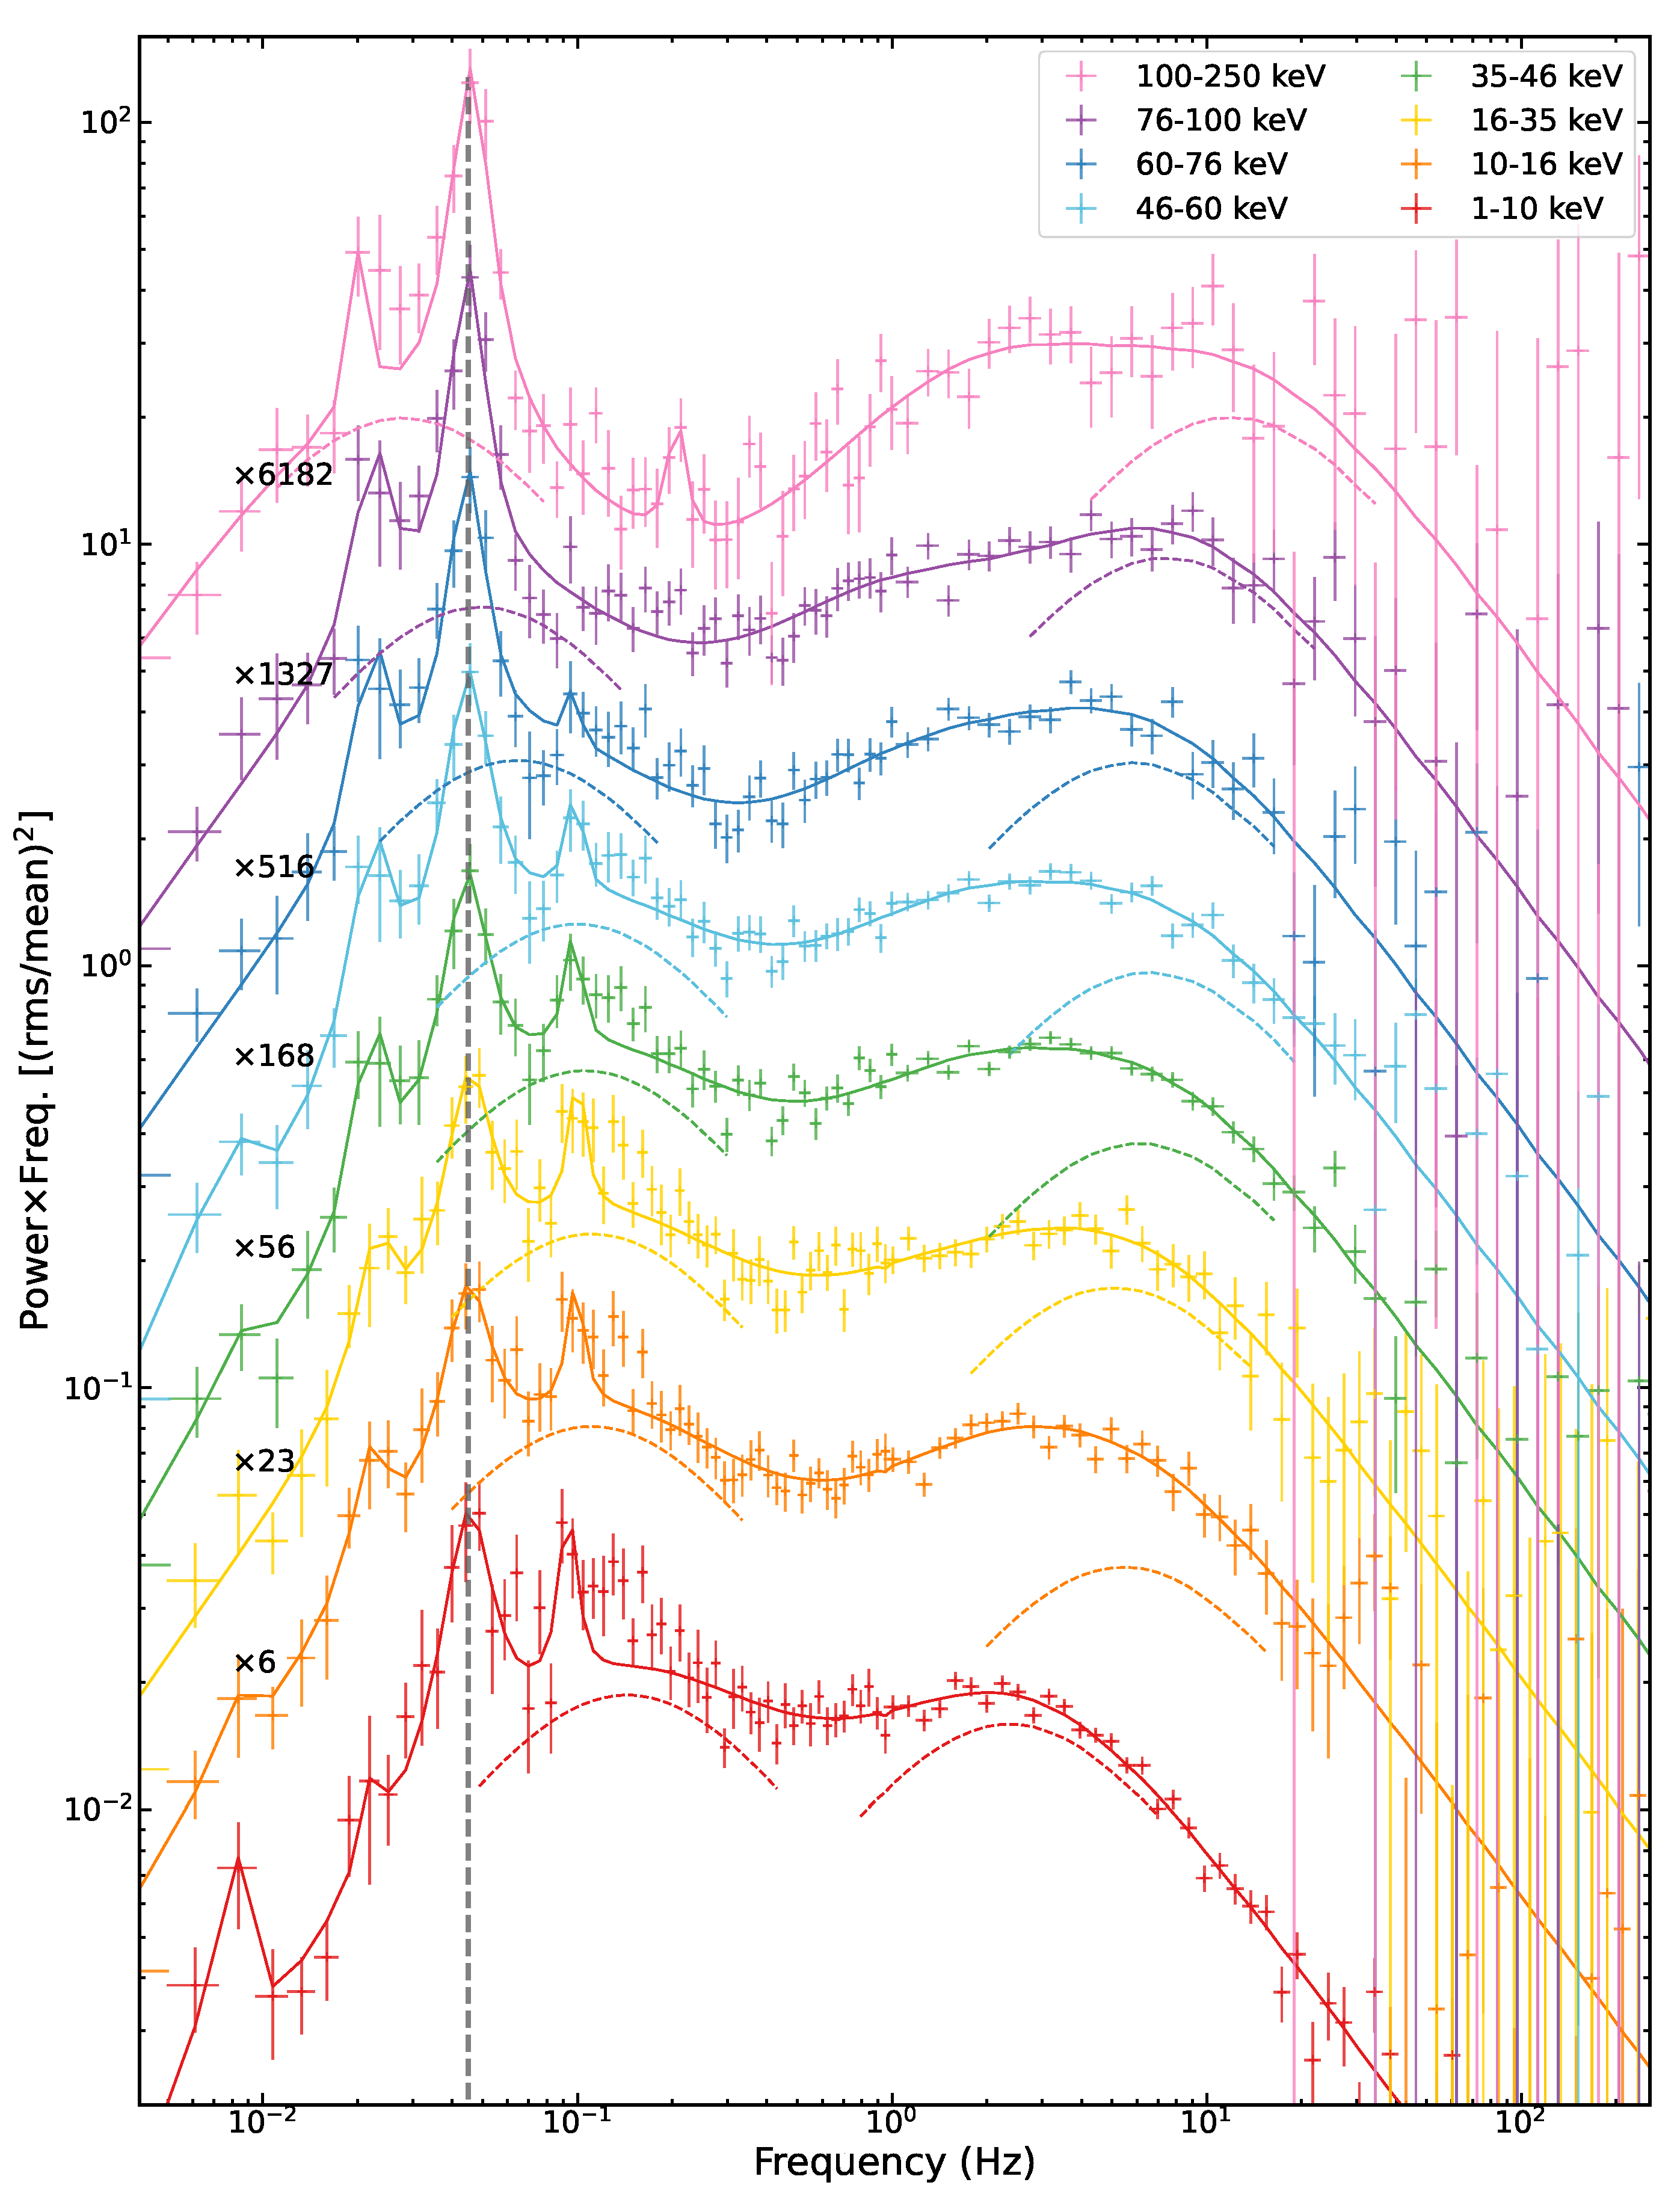
Another important achievement in timing analysis of Insight-HXMT is the discovery of high-energy (∼200 keV) QPOs [65,66]. Figure 7 and Figure 8 present the Insight-HXMT observations of MAXI J1820+070, including light curves, hardness ratios, PDS, and phase lags. The LFQPOs detected in different energy bands exhibit similar centroid frequencies and are accompanied by prominent flat-top noise dominating the low-frequency range. In the longest exposure observation, the LFQPO is detected with a significance of ∼4 σ in the 200–250 keV band, increasing to 9.4 σ in the 150–200 keV range. This constitutes the highest-energy detection of LFQPOs reported to date in X-ray binary systems. Below 30 keV, the phase lag remains close to zero, consistent with typical BHB behavior. However, above 30 keV, the lag becomes a soft lag—where high-energy photons lead low-energy ones—and increases markedly with energy, reaching up to ∼0.9 s in the 150–200 keV band. These characteristics are difficult to reconcile with traditional LFQPO models but can be naturally explained by a small-scale jet precession scenario. Figure 9 presented a schematic diagram of the jet precession model. The black hole is located at the center, with the jet (colored ribbon) precessing around the spin axis. The jet follows a conical surface with a constant angle to the spin axis. Higher-energy photons are emitted near the base of the jet, while lower-energy photons come from higher regions. The precession is simulated by changing the azimuthal angle along the jet, producing the observed QPO signals.
Recently, Zhu et al. [67] conducted a timing analysis of the black hole candidate MAXI J1803-298 during its 2021 outburst using data from Insight-HXMT and NICER. The source underwent a spectral state transition from the low hard state to the high soft state, passing through the hard and soft intermediate states. Numerous type-C QPOs were observed in the hard state, with centroid frequencies increasing from approximately 0.16 to 2.6 Hz. The rms-frequency relation exhibited a turnover, and the frequency- and energy-dependent phase-lag behavior indicated a high inclination angle, consistent with prior studies. These features support a geometric origin for type-C QPOs, such as the Lense-Thirring precession model, though alternative interpretations remain viable. Building on this, Xu et al. [68] performed a comprehensive timing and spectral analysis of the same outburst using Insight-HXMT observations. They identified a broader range of type-C QPOs with centroid frequencies spanning ∼0.16 to 6.3 Hz, which correlated with both the hardness ratio and the photon index of the Comptonized component. QPO phase lags were hard below ∼2 Hz and became soft above ∼4 Hz. Spectral fitting revealed standard black hole X-ray binary components, including a multi-color disk blackbody and a Comptonized continuum. Notably, an anomalous increase in the fitted inner disk radius during the low hard state suggests condensation of the corona onto the disk. Additionally, two significant flux drops during the soft intermediate state may indicate rapid structural changes in the corona, jet, or accretion disk.
The newly black hole X-ray binary Swift J1727.8-1613 exhibited exceptionally high luminosity, becoming the brightest X-ray source in the southern sky during its outburst [69,70,71,72,73,74]. This remarkable brightness drew significant attention and prompted extensive observational and theoretical studies [42,75,76,77,78]. Yu et al. [79] carried out a detailed timing analysis using Insight-HXMT observations, reporting strong type-C QPOs throughout the outburst. Leveraging the broad energy coverage of Insight-HXMT, they examined the energy dependence of key QPO properties, such as centroid frequency, fractional rms, and phase lags, which exhibit patterns consistent with high-inclination systems. Additionally, a peaked noise component was detected in the early phase of the outburst, with a frequency closely tracking the QPO frequency and following the established Psaltis-Belloni-van der Klis (PBK) relation [80] (as shown in Figure 10) . If interpreted as arising from disk precession, this feature provides a potential constraint on the black hole spin, suggesting that the system may harbor a rapidly spinning compact object.
Subsequently, Zhu and Wang [81] analyzed the evolution of type-C QPOs during the 2023 outburst of the new black hole candidate Swift J1727.8-1613 using data from Insight-HXMT. The study revealed a rapid increase in QPO frequency during two flare events. An energy dependence of the QPO frequency was identified: below ∼3 Hz, the frequency showed little change with energy, while above ∼3 Hz, clear variations emerged, with a notable drop in the variation rate once the frequency exceeded ∼8 Hz (as shown in Figure 11). This pattern, consistent with several other sources, points to a possible shared physical mechanism. The observed QPO rms-frequency relation aligns well with predictions from the Lense-Thirring precession model. Furthermore, the frequency dependence of rms and phase lags supports the classification of Swift J1727.8-1613 as a high-inclination system.
Peng et al. [78] performed a joint spectral analysis of Swift J1727.8-1613 using simultaneous observations from Insight-HXMT, NICER, and NuSTAR, revealing an additional high-energy spectral component beyond the standard Comptonized and reflection features commonly observed in black hole X-ray binaries. Incorporating this component into spectral models yields estimates of a high black hole spin and a relatively large inclination angle, consistent with previous NICER findings. However, due to degeneracies in the spectral modeling, the precise origin of this additional emission remains uncertain, with plausible explanations including emission from a relativistic jet or the base of a corona located near or within a jet structure. Yang et al. [82] further identified that the fractional rms amplitude of the QPO above 40 keV is significantly higher than that below 20 keV. This constitutes the first report of a high-energy (HE) rms excess in the rms spectrum of a black hole X-ray binary. Alongside the standard thermal Comptonization component, an additional hard spectral component is observed in the high-energy band. The QPO HE rms excess correlates not only with disk parameters and the photon index of the standard Comptonization component but also shows a moderate positive correlation with the flux of the extra hard component. Notably, no corresponding features are detected in the QPO phase-lag spectra associated with this additional component. Based on these findings, the authors propose that the extra hard component arises from jet emission, and the associated QPO HE rms excess can be explained by precession of the jet base.

3.2. Broadband Noise Analysis

Before the launch of Insight-HXMT, studies of broadband noise were mostly limited to relatively narrow energy bands. Stiele and Yu [83] investigated the properties of broadband noise during the low-hard state in a sample of black hole X-ray binaries, focusing on its characteristic frequency, amplitude, and covariance spectra. For observations with a Broadband noise component above 1 Hz in the hard energy band (4–8 keV), a corresponding component was found at lower frequencies in the soft band (1–2 keV). This frequency shift suggests that while both soft and hard photons contribute to the same variability process—likely mass accretion rate modulation—the soft photons originate at larger radii, farther from the black hole. These soft photons thus have lower energies and frequencies, and are likely associated with lower optical depth in the outer corona, or reflect a radial temperature gradient. The observed energy dependence supports a scenario where up-scattered photons from the outer corona contribute significantly to soft-band emission, providing insight into the radial structure of the Comptonizing region. However, due to the detector energy band limit, only the energy band below 10 keV was implemented. In addition to the energy dependence of the characteristic frequency, the noise in the LHS is also slightly stronger at lower energies. The fractional rms of the noise is generally flat or decreases slightly (by a few percent) from 2 to 20 keV [84]. Previous studies [85,86] also explored the energy dependence of power spectra, but their analyses were limited to relatively narrow energy ranges.
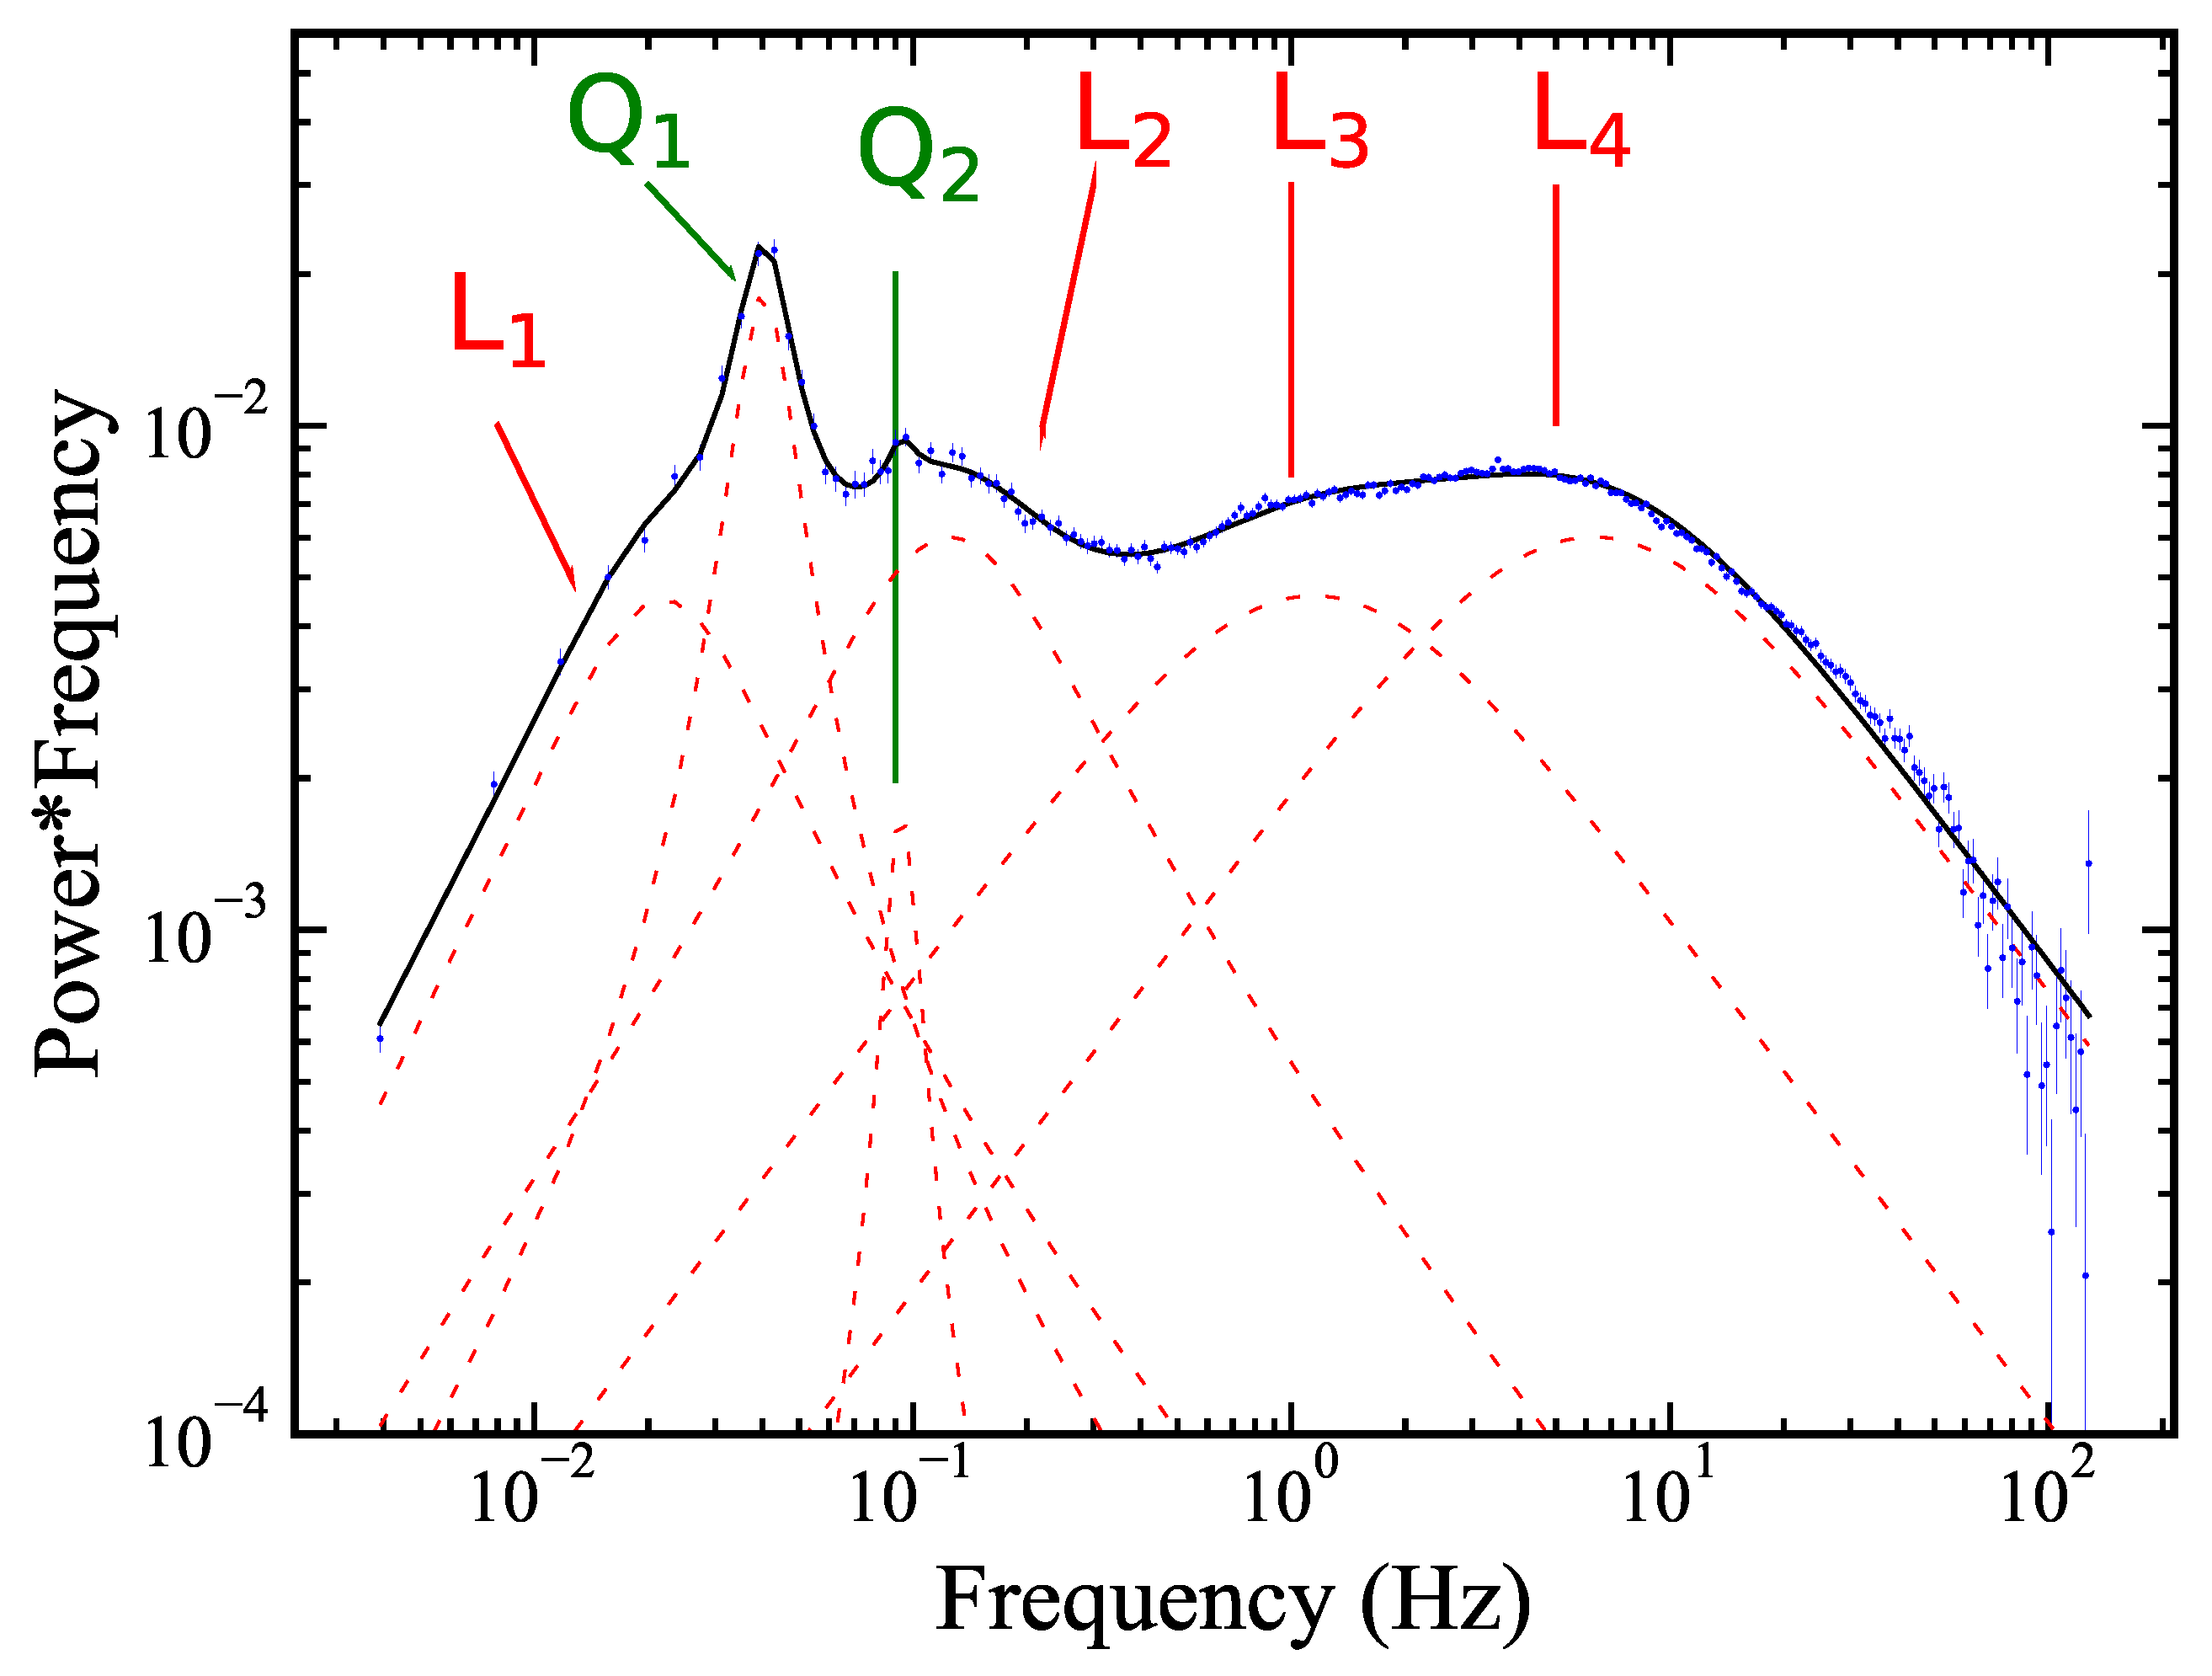
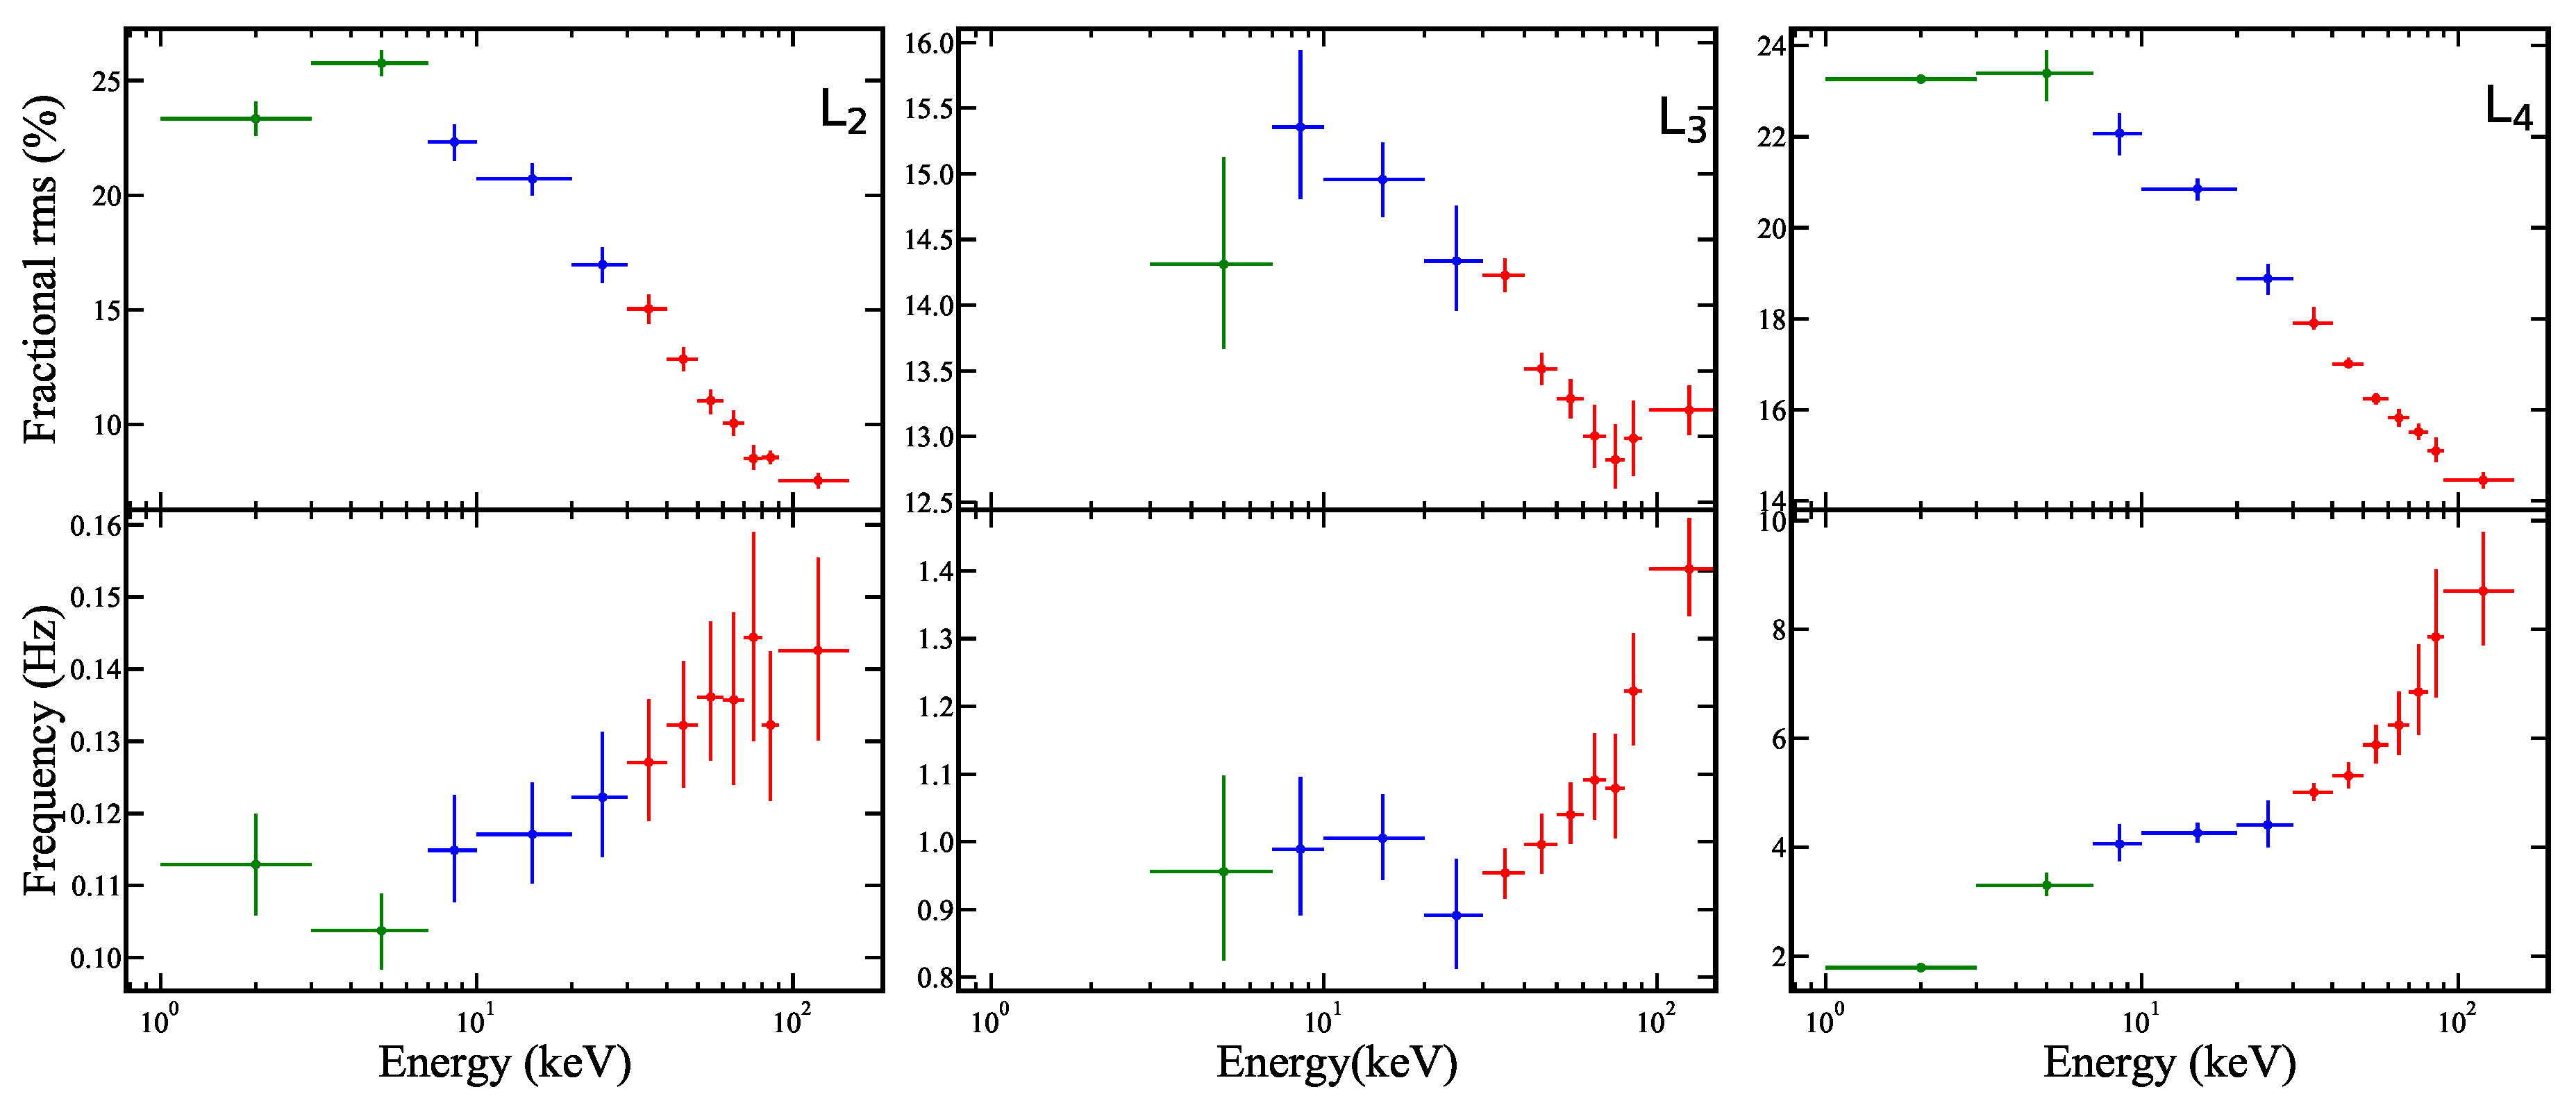
Taking advantage of the broad energy coverage of Insight-HXMT, Yang et al. [87] presented a detailed study of the broadband noise in the pds of the black hole X-ray binary MAXI J1820+070 during the hard state of its 2018 outburst. The broadband noise exhibits a two-humped shape and is well described by four Lorentzians: very low-frequency noise (L1), low-frequency noise (L2), and two high-frequency components (L3 and L4) (see Figure 12). The two main humps may correspond to variability from a fluctuating accretion disk and two distinct Comptonization regions. These humps were modeled using multiple Lorentzian functions, and their energy-dependent properties were studied, along with their evolution during spectral changes. The lowest-frequency component, likely the subharmonic of the QPO, exhibits a distinct energy dependence compared to other broadband noise components(see Figure 13 and Figure 14). While the fractional rms of all components generally decreases with energy, the shapes of their rms spectra differ. Notably, above ∼20–30 keV, the characteristic frequencies increase sharply with energy, indicating that high-energy components vary more rapidly. These results suggest that the hot inner flow in MAXI J1820+070 is inhomogeneous, and are consistent with a geometry involving a truncated disk and two Comptonization regions.
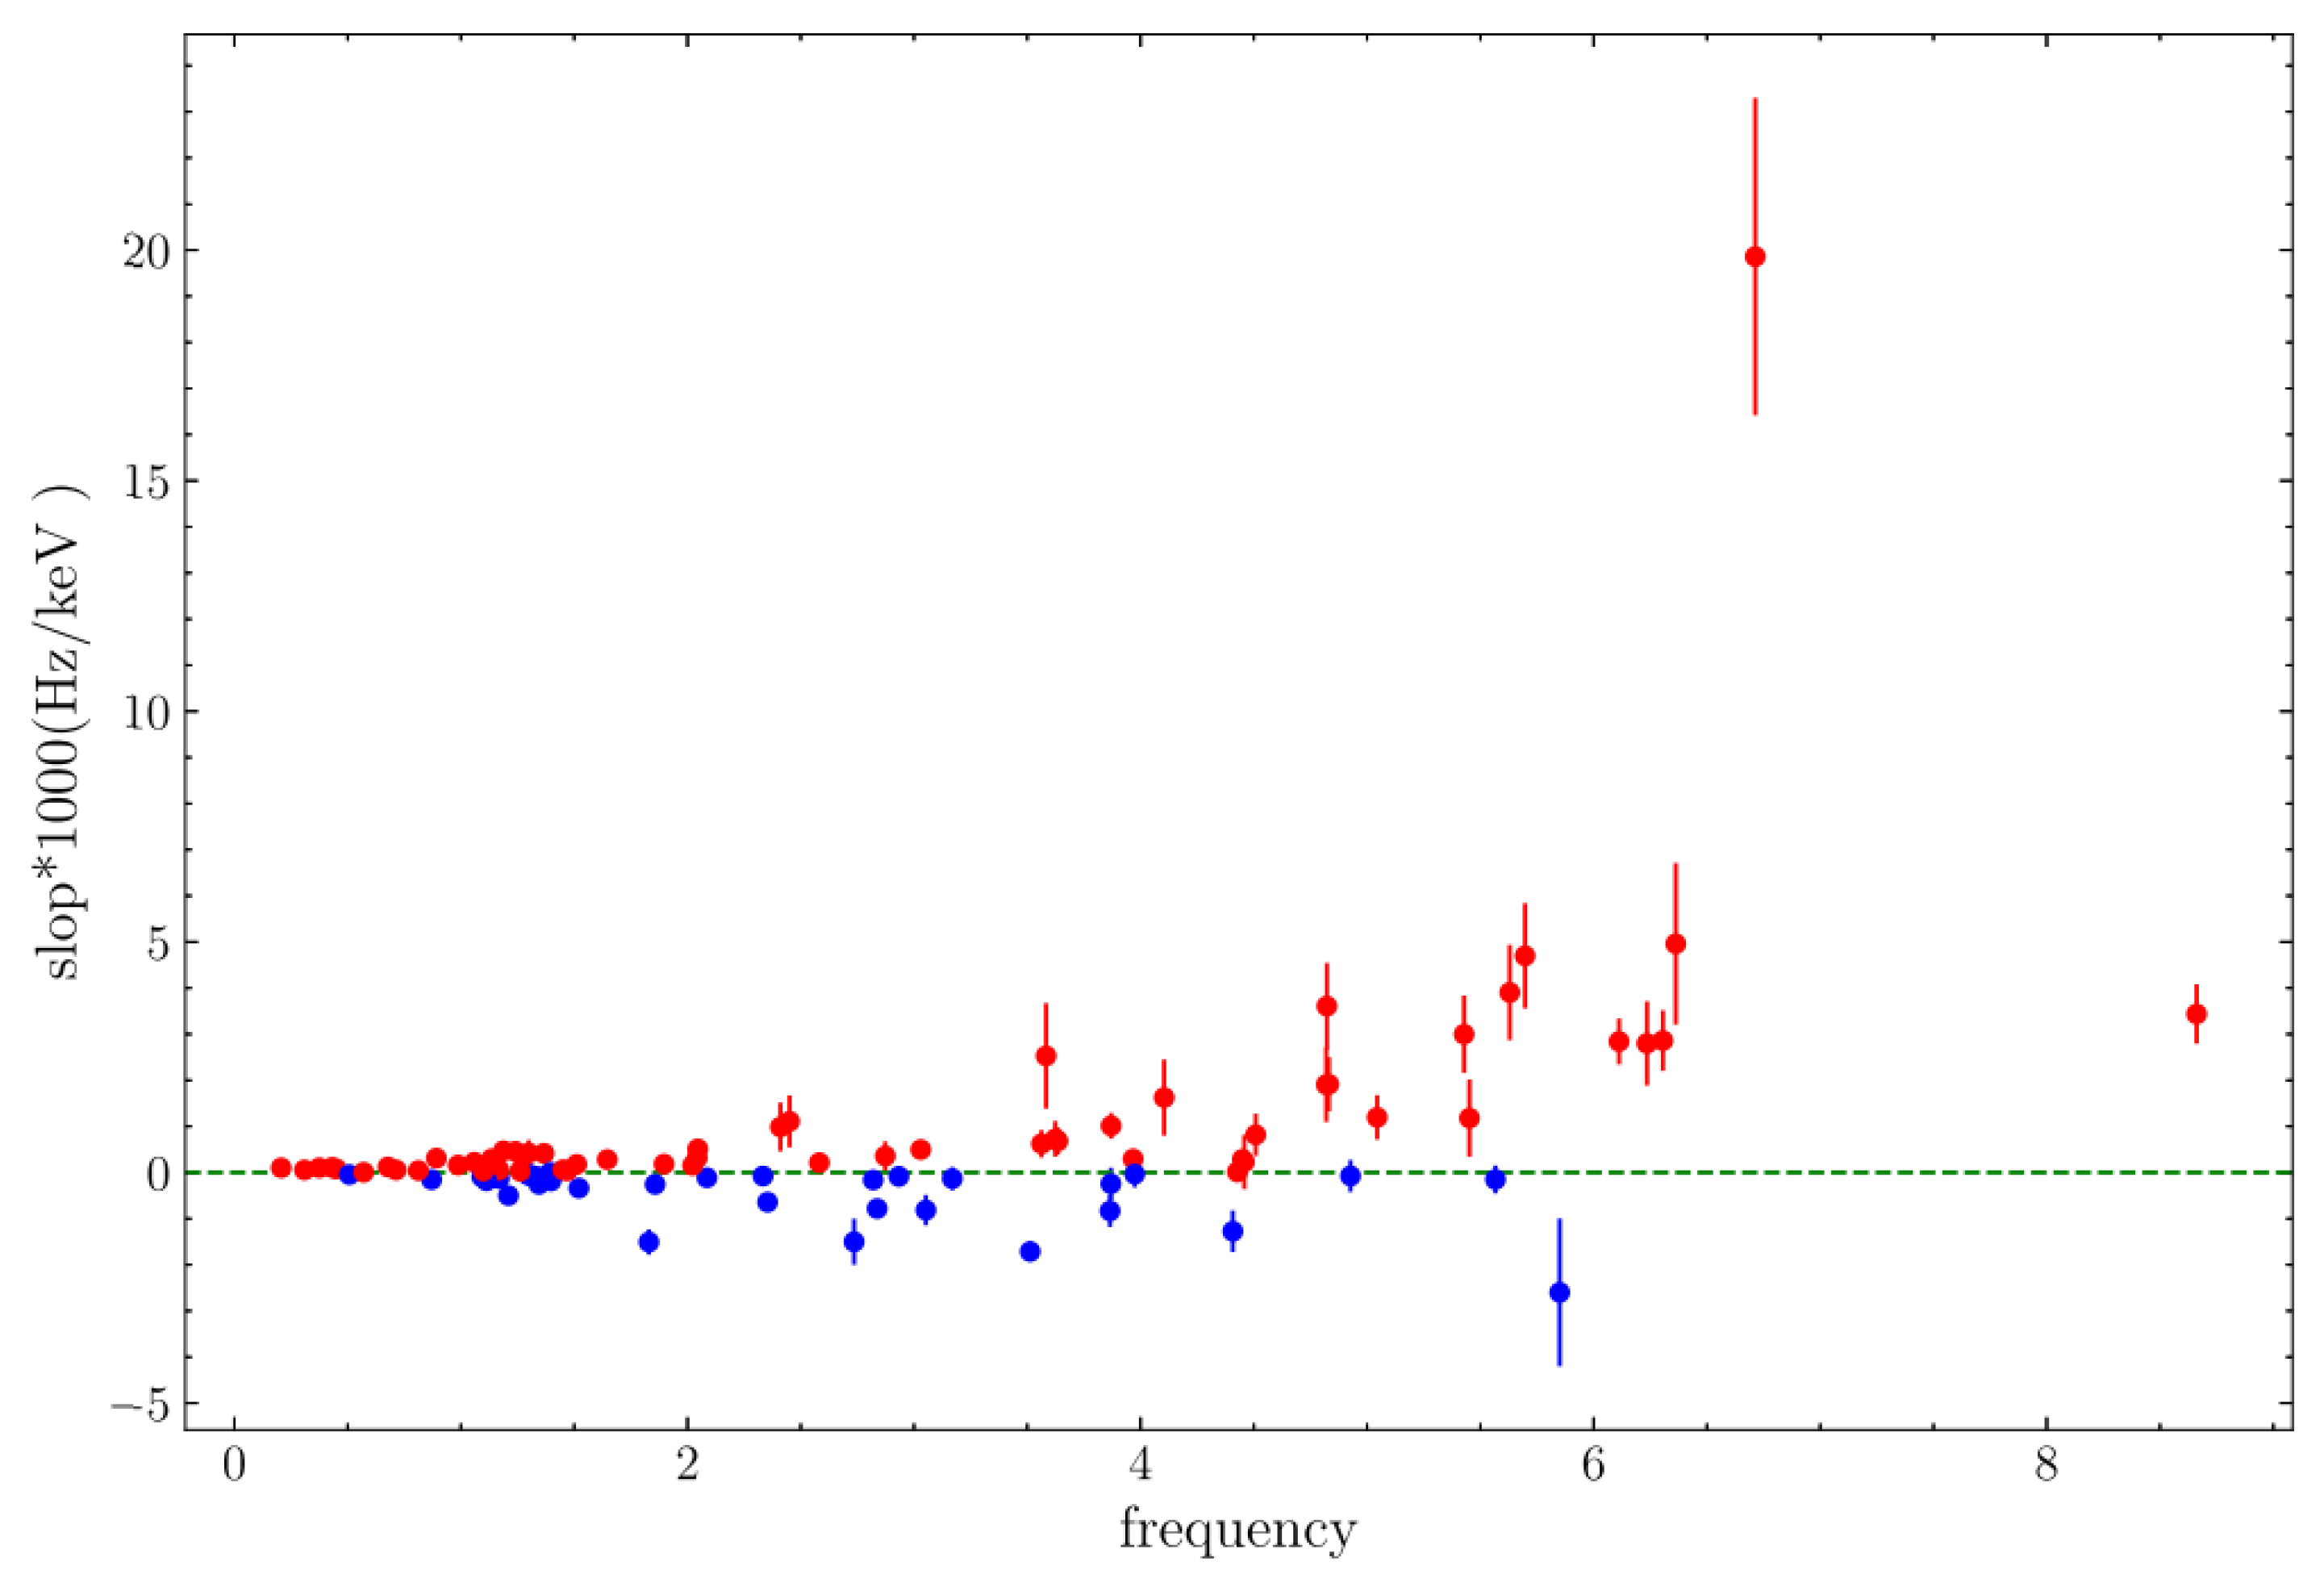
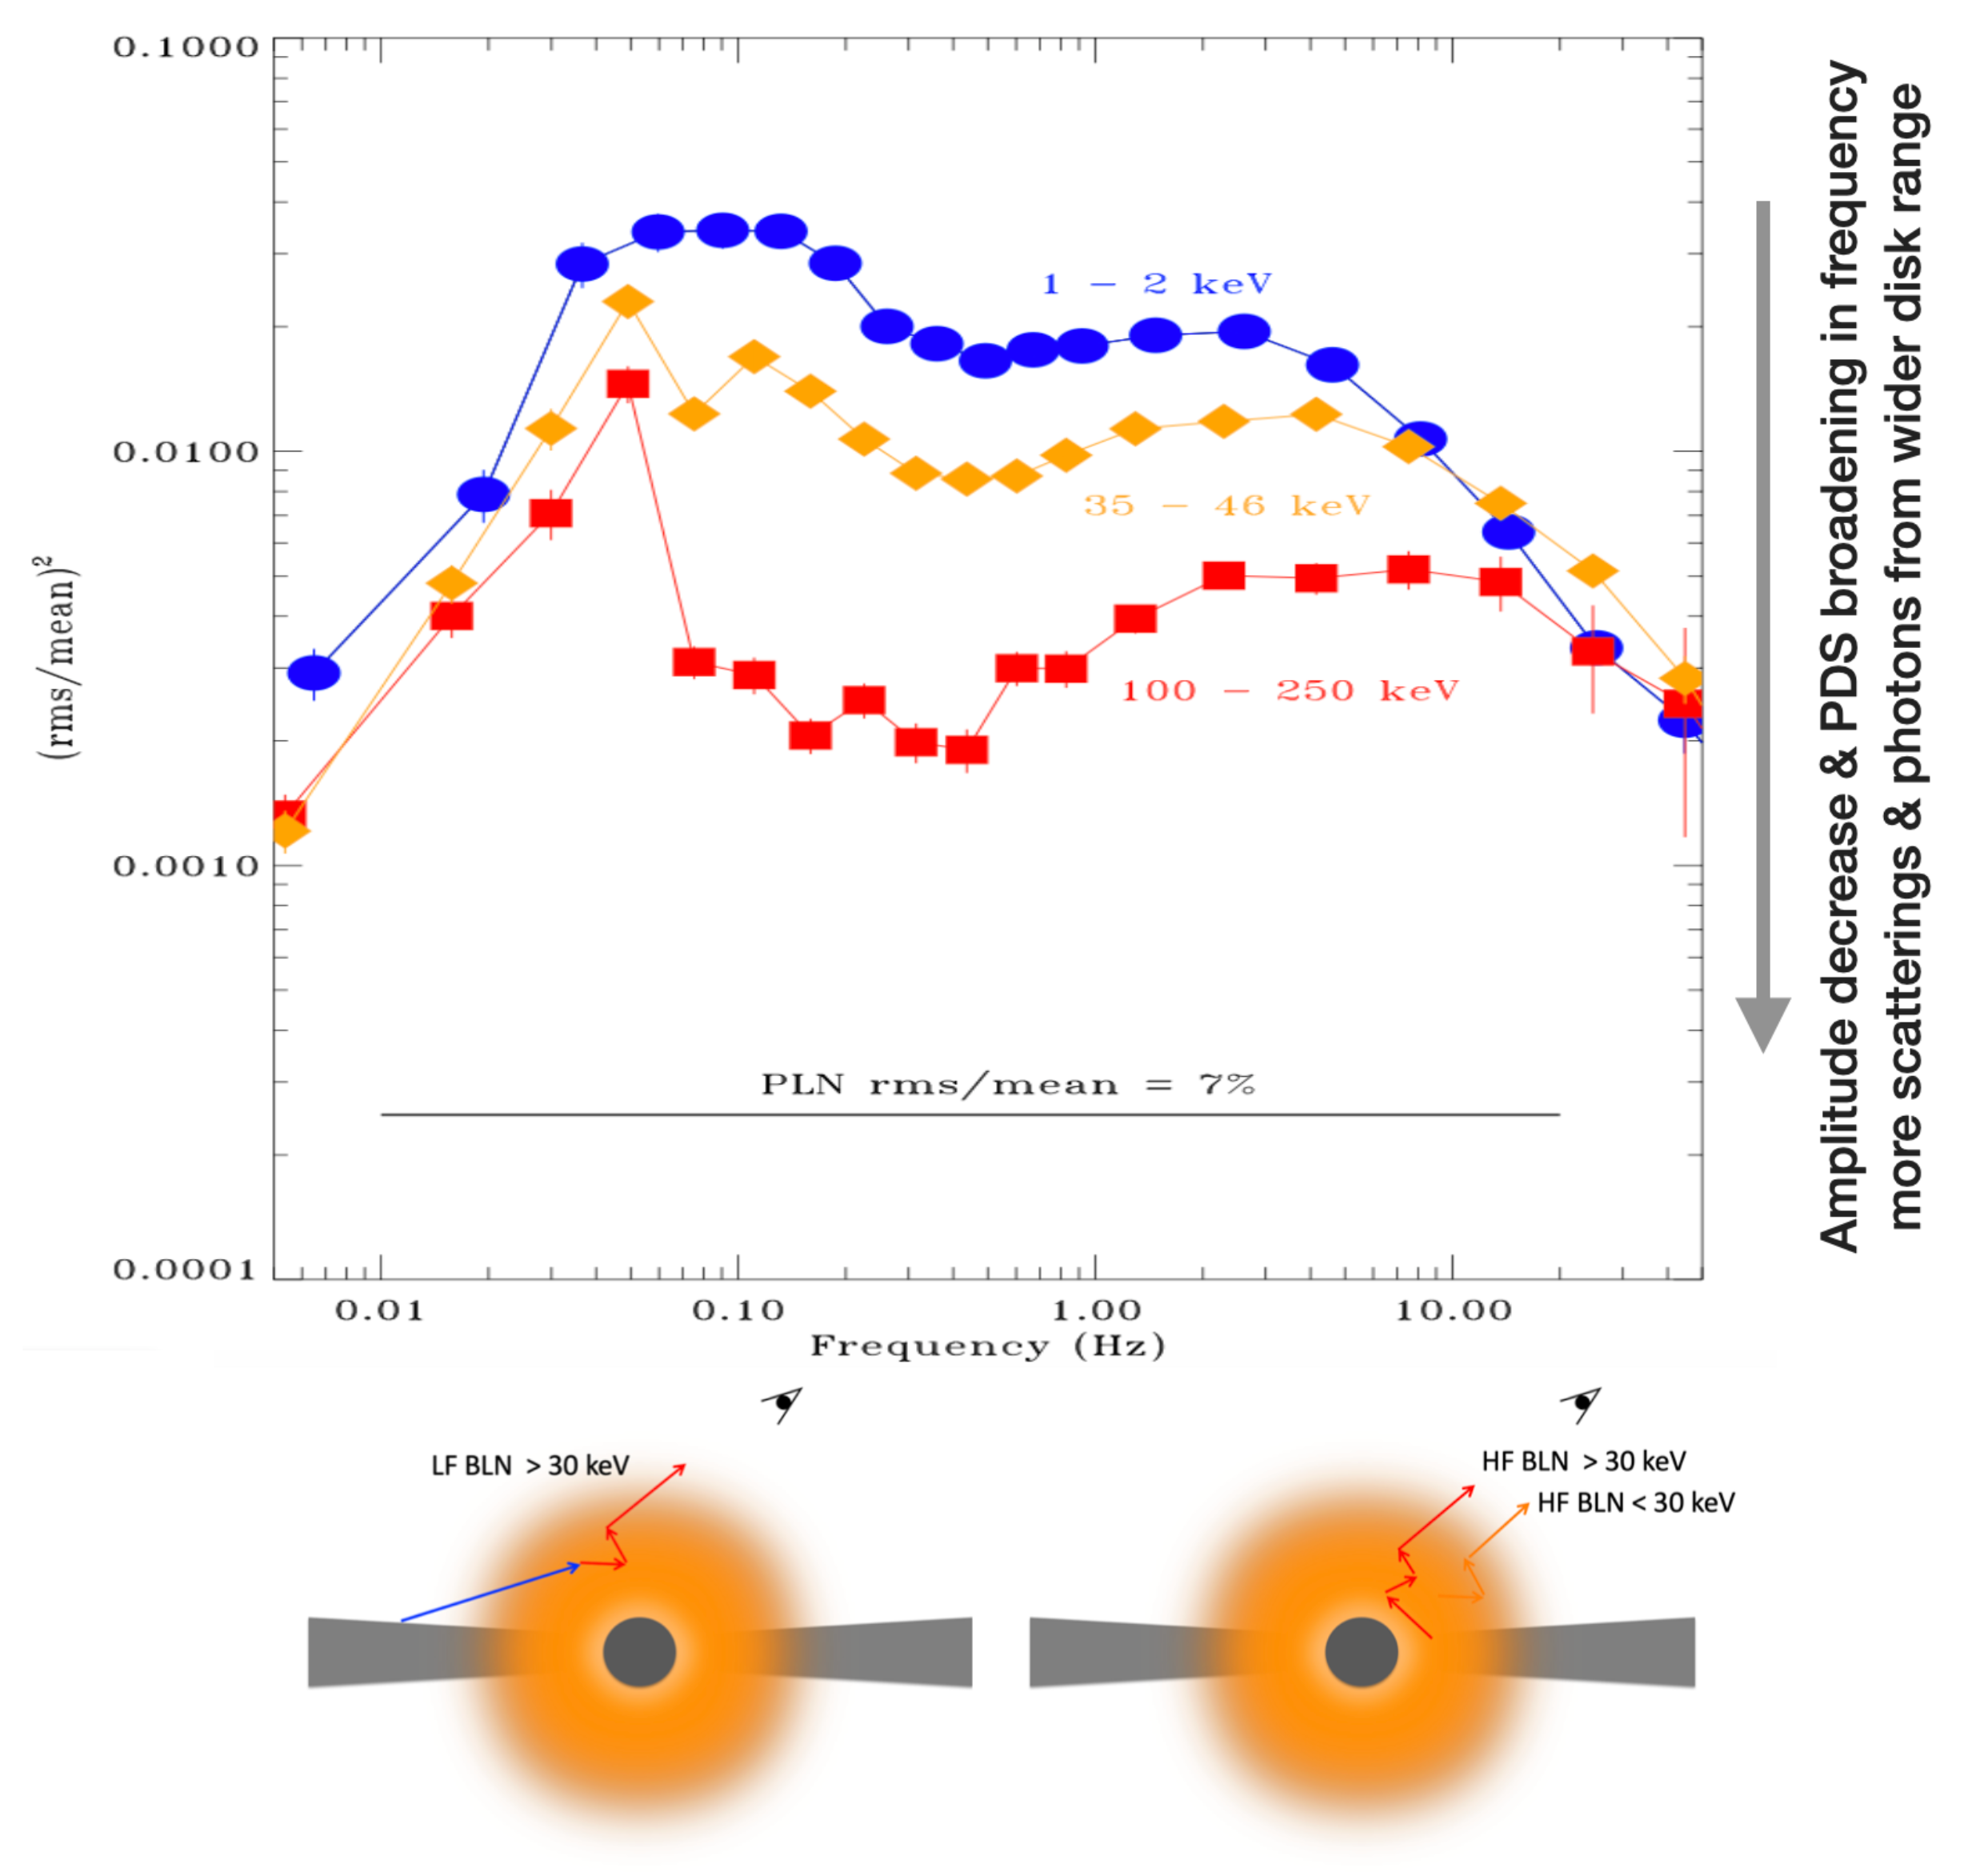
Using Insight-HXMT observations, Gao et al. [88,89] studied QPO and broadband noise for MAXI J1820+070, i dentifying distinct energy-dependent trends in broadband noise components at different frequencies. Specifically, the characteristic frequency of low-frequency broadband noise components (<0.1 Hz) decreases with increasing photon energy, whereas that of high-frequency components (>10 Hz) increases as shown in Figure 15.
The energy-dependent broadening or separation of the broadband noise components leads to an extension of the power spectral plateau toward higher frequencies as photon energy increases. This behavior suggests that the seed photons up-scattered to high energies (e.g., >30 keV) originate from a broader radial extent of the accretion disk. The distinct energy-dependent trends of the two broadband noise components can be interpreted as resulting from seed photons emitted at different disk locations: one originating in the innermost disk region, likely embedded within a dense, spherical corona, and the other from the outer disk regions not covered by the central corona. In both cases, the seed photons undergo multiple up-scatterings in the corona, contributing to the high-energy X-ray emission [89]. A schematic illustration of the origins of the low-frequency and high-frequency broadband noise components, linked to the regions producing their respective seed photons, is shown in Figure 16.
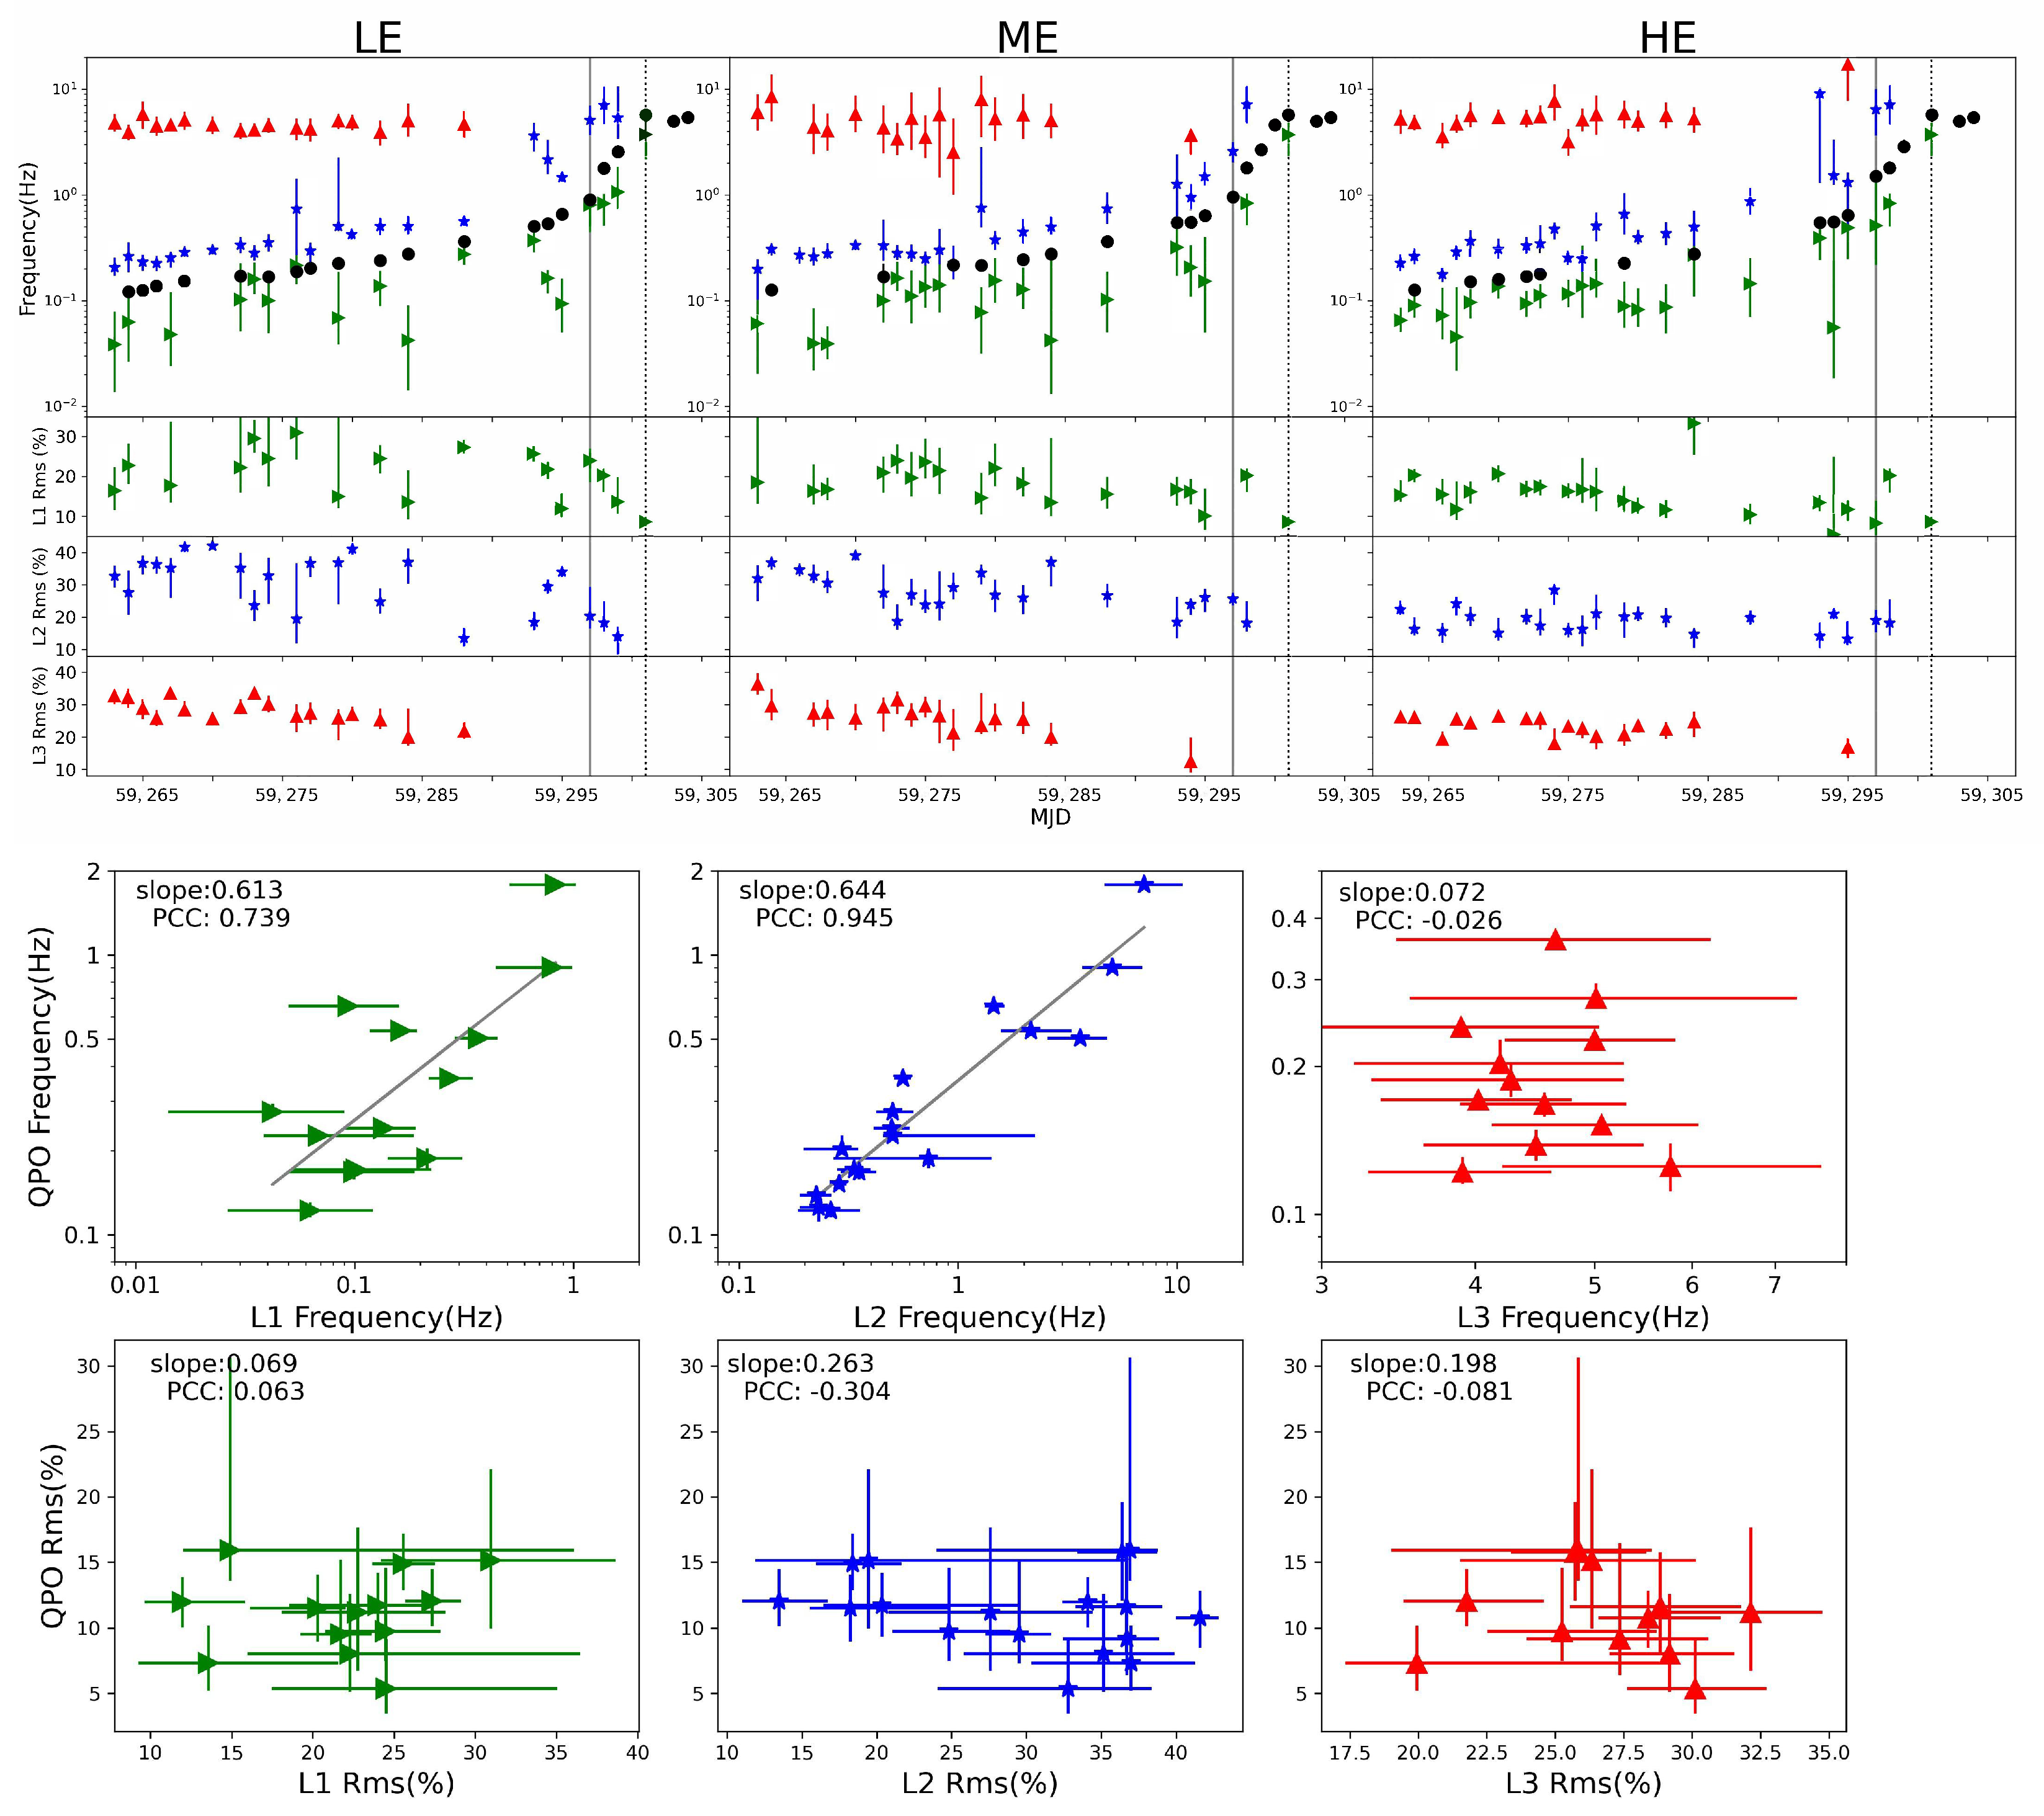
Jin et al. [90] conducted a systematic investigation of the rapid X-ray variability of GX 339-4 during its 2021 outburst, using data from both Insight-HXMT and NICER. Their study focused on the evolution and energy dependence of broad-band noise components, alongside the detection of LFQPOs. The outburst, spanning from February to March, was divided into three spectral states: LHS, HIMS, and SIMS. In the LHS and HIMS, the PDS were well described by three Lorentzian components— L 1 , L 2 , and L 3 —representing low-, mid-, and high-frequency broad-band noise components, respectively. They reported increasing trends in the characteristic frequencies of L 1 and L 2 , as well as a correlation between the QPO frequency and the characteristic frequencies of these broad-band noise components (see Figure 17 for details). Furthermore, their analysis showed that the peak energies and spectral shapes of the fractional rms for L 1 , L 2 , and L 3 differ significantly, suggesting that each broad-band noise component dominates in a distinct energy range.
In the framework of the fluctuation propagation model, the low-frequency break in the broad-band variability—representing the slowest fluctuations—is typically associated with the viscous timescale at the outer radius of the hot accretion flow. However, the high-frequency break does not necessarily correspond directly to the viscous timescale at the inner edge of the hot flow [91]. Based on the observed dip in the power spectrum between components L 2 and L 3 , Jin et al. [90] proposed that the characteristic frequency of L 1 traces the viscous timescale at the outer radius of the variable disc. In contrast, the L 2 and L 3 components likely originate from variability arising in the inner regions of the disc and the inner hot flow, respectively.
Jin et al. [90] provided a simple quantitative estimate for the outer and inner radii of the variable disc by adopting the standard α -disc model [87,92,93]. According to the results of the calculations, a schematic diagram illustrating the evolution of the system’s characteristics during the outburst is presented in Figure 18. As the outburst progresses from the LHS to the HIMS, the variable region of the accretion disc gradually moves inward toward the black hole. This inward migration leads to an increase in the characteristic frequencies of the L 1 and L 2 components. The concurrent evolution of the QPO frequency, and its correlation with the characteristic frequencies of these low-frequency broad-band noise components, can be naturally explained by the shrinking outer radius of the variable disc.
In contrast, the nearly constant characteristic frequency of the L 3 component, combined with its decreasing fractional rms amplitude, suggests that the hot inner flow continues to contract while remaining near the innermost stable circular orbit (ISCO). Once the inner region of the variable disc approaches sufficiently close to the black hole, it may merge with the hot flow to form a unified variable flow. This merged structure then continues its inward migration until it reaches the ISCO during the SIMS.

4. Wavelet Analysis

In the past few decades, numerous sources have exhibited the sudden emergence or disappearance of all three types of QPOs, often occurring alongside transitions between different QPO types [58,94,95]. Traditional timing studies of these phenomena have primarily utilized dynamical PDS, which are typically constructed using time intervals on the order of tens of seconds [96,97]. This inherently limits the temporal resolution and may obscure rapid variability. Alternatively, wavelet analysis enables a more precise characterization of signal evolution by providing a high-resolution representation in both time and frequency domains. As such, it is particularly effective in tracking the detailed temporal behavior of periodic or quasi-periodic signals [19,98,99,100,101].
In this method [17,98], a discrete Fourier transform is first applied to the time series (e.g., background-subtracted light curves), followed by the application of a chosen wavelet function—commonly the Morlet wavelet:
Ψ 0 ( η ) = π 1 / 4 e i m η e η 2 / 2 ,
where m is the nondimensional frequency, η is a nondimensional time parameter, and Ψ 0 means the Ψ has not been normalized. The wavelet function is normalized to ensure that the results can be meaningfully compared across different scales and time series. Thus for each wavelet scale s, the normalized wavelet function has unit energy:
Ψ ^ ( s ω k ) = ( 2 π s δ t ) ( 1 / 2 ) Ψ ^ 0 ( s ω k ) ,
where ω k is the angular frequency. Suppose one has N points, then the following relation should be satisfied:
k = 0 N 1 | Ψ ^ ( s ω k ) | 2 = N .
Finally based on the convolution theorem, the wavelet transform at that scale is the inverse Fourier transform of
W n ( s ) = k = 0 N 1 x ^ k Ψ ^ ( s ω k ) e i ω k n δ t ,
here the ∗ means the complex conjugate, and x ^ k is the discrete Fourier transform of the time series x n . As the time index, frequency index, and wavelet scale vary, the wavelet transform produces a smoothed two-dimensional time-frequency representation of the signal. To achieve different analytical goals, various operations are often applied to the wavelet transform results in practical use. A detailed discussion of these techniques can be found in Torrence and Compo [17]
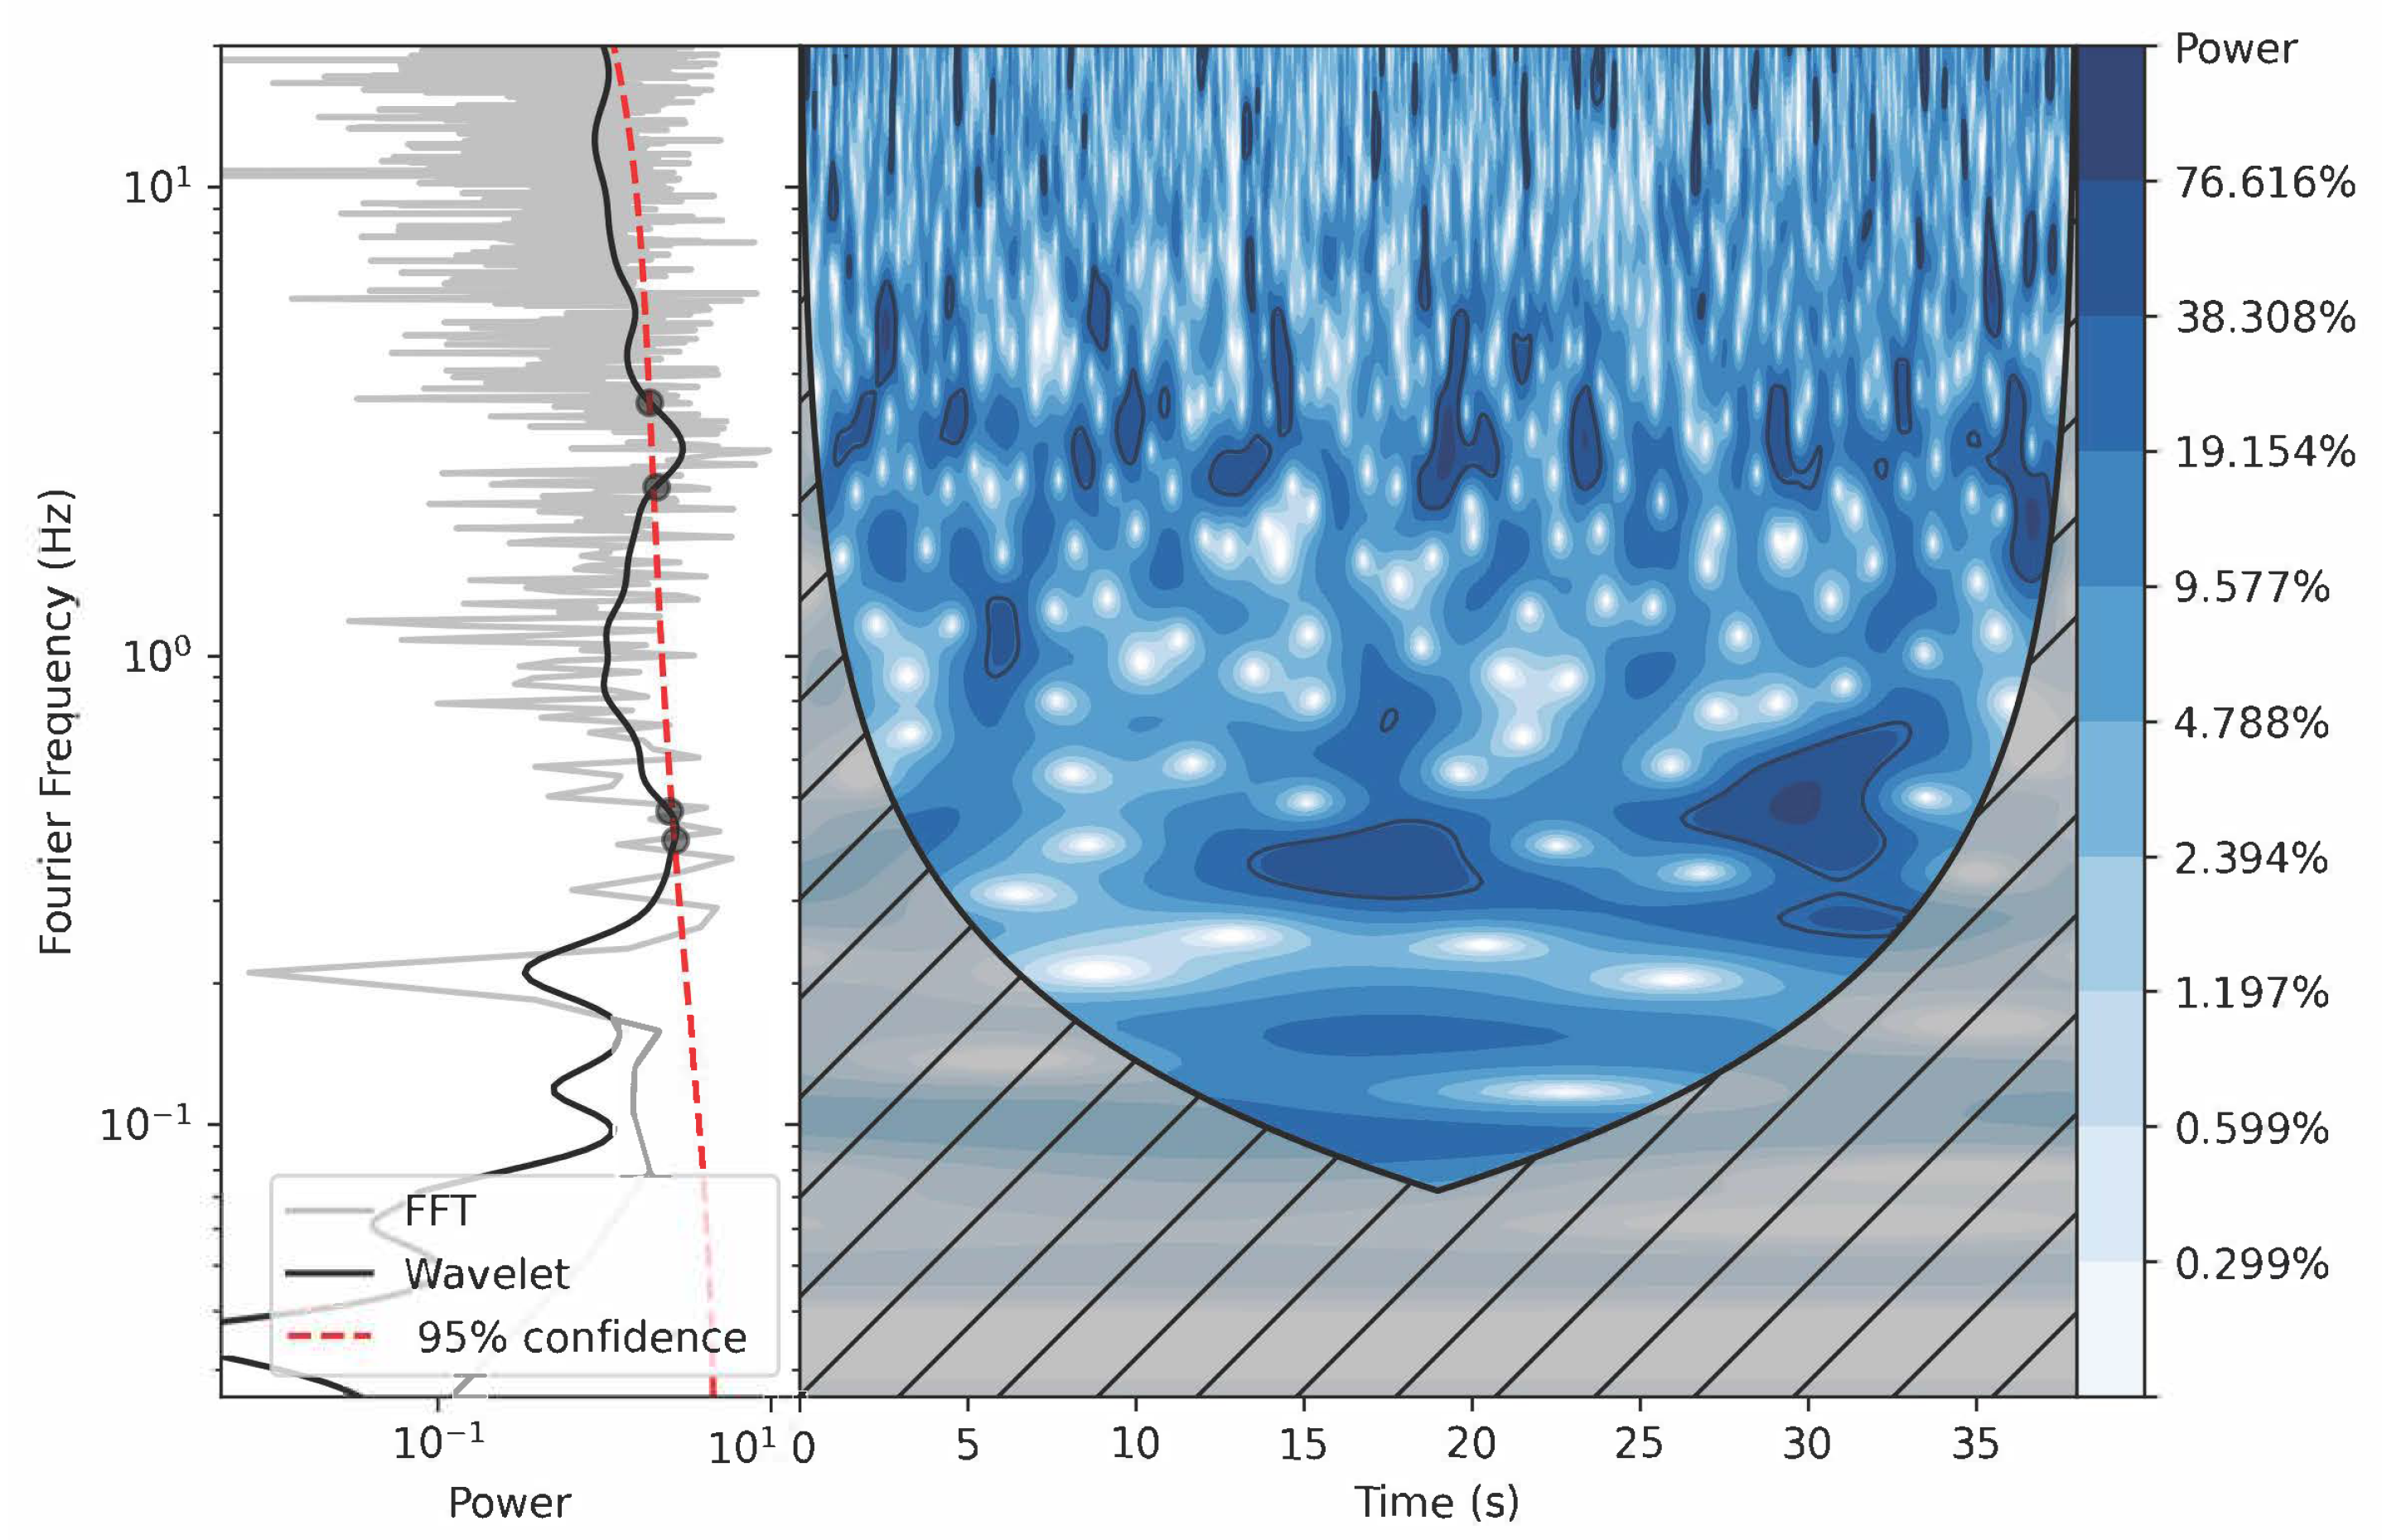
Chen et al. [99] performed a wavelet-based analysis of the light curves of MAXI J1535-571 using Insight-HXMT data (for a detailed methodology, see Section 3 of their paper). Through this approach, they identified QPO signals in nine observations. Based on the wavelet results, the corresponding spectra were further divided into QPO and non-QPO intervals, allowing for a comparative investigation of their spectral properties. Figure 19 illustrates a 40-s segment as an example of the QPO time selection process. Once the peak frequency of the global wavelet power spectrum is identified, its 95% confidence interval is used to define the candidate QPO frequency range. If any point in the local wavelet map within this range exceeds the 95% confidence level, that time segment is marked as a QPO interval. All QPO intervals are extracted to generate a new file, and three spectra are then produced for each observation: time-averaged, QPO-included, and QPO-excluded.
Based on spectral analysis, Chen et al. [99] found that the relationship between the QPO and non-QPO spectra evolves significantly over time during the outburst (an example is presented in Figure 20). This notable difference in spectral behavior suggests that the physical mechanisms responsible for the QPO and non-QPO emissions may not be the same. In the HIMS, the QPO regime exhibits a lower disk temperature, softer spectra, and reduced disk flux compared to the non-QPO regime. Interestingly, these trends reverse during the SIMS. However, the Comptonization flux and total flux in the QPO spectra remain consistently higher than those in the non-QPO spectra, regardless of whether the source is in the HIMS or SIMS (see Figure 20). This reversal between HIMS and SIMS may be linked to the transient appearance of type-B QPOs in MAXI J1535-571, as indicated by the wavelet analysis results. To fully understand the connection and evolution between these two intermediate states, a comprehensive analysis of the QPO transition from type-C to type-B and back to type-C using additional observational data is necessary. Although the current dataset limits definitive conclusions about the physical origins of QPO and non-QPO spectral behaviors, those findings demonstrate that wavelet analysis is a powerful and promising tool for QPO studies, warranting its application in future research.
Subsequently, Chen et al. [101] investigated two transient QPOs in MAXI J1535-571 using both wavelet analysis and PDS based on Insight-HXMT observations. These transient QPOs exhibited centroid frequencies around 10 Hz, with FWHMs of approximately 0.6 Hz and rms amplitudes of about 14%. By separating and analyzing the energy spectra during QPO and non-QPO intervals, they found that the non-QPO spectra appeared softer and exhibited higher cutoff energies ( E cut ) than those during the QPO intervals. Their results suggest that the QPOs detected on MJD 58,016 and 58,017 are consistent with type-C QPOs and that the source remained in the hard-intermediate state (HIMS). Furthermore, the duration of the type-C QPO signals—identified through wavelet analysis—was found to be positively correlated with the mean count rate above 10 keV, indicating that the occurrence of QPOs on different timescales may be closely associated with the corona. The transient behavior of these QPOs may be linked to jet activity or flares, with the authors speculating that partial ejection of the corona could explain the temporary disappearance of the type-C QPOs.
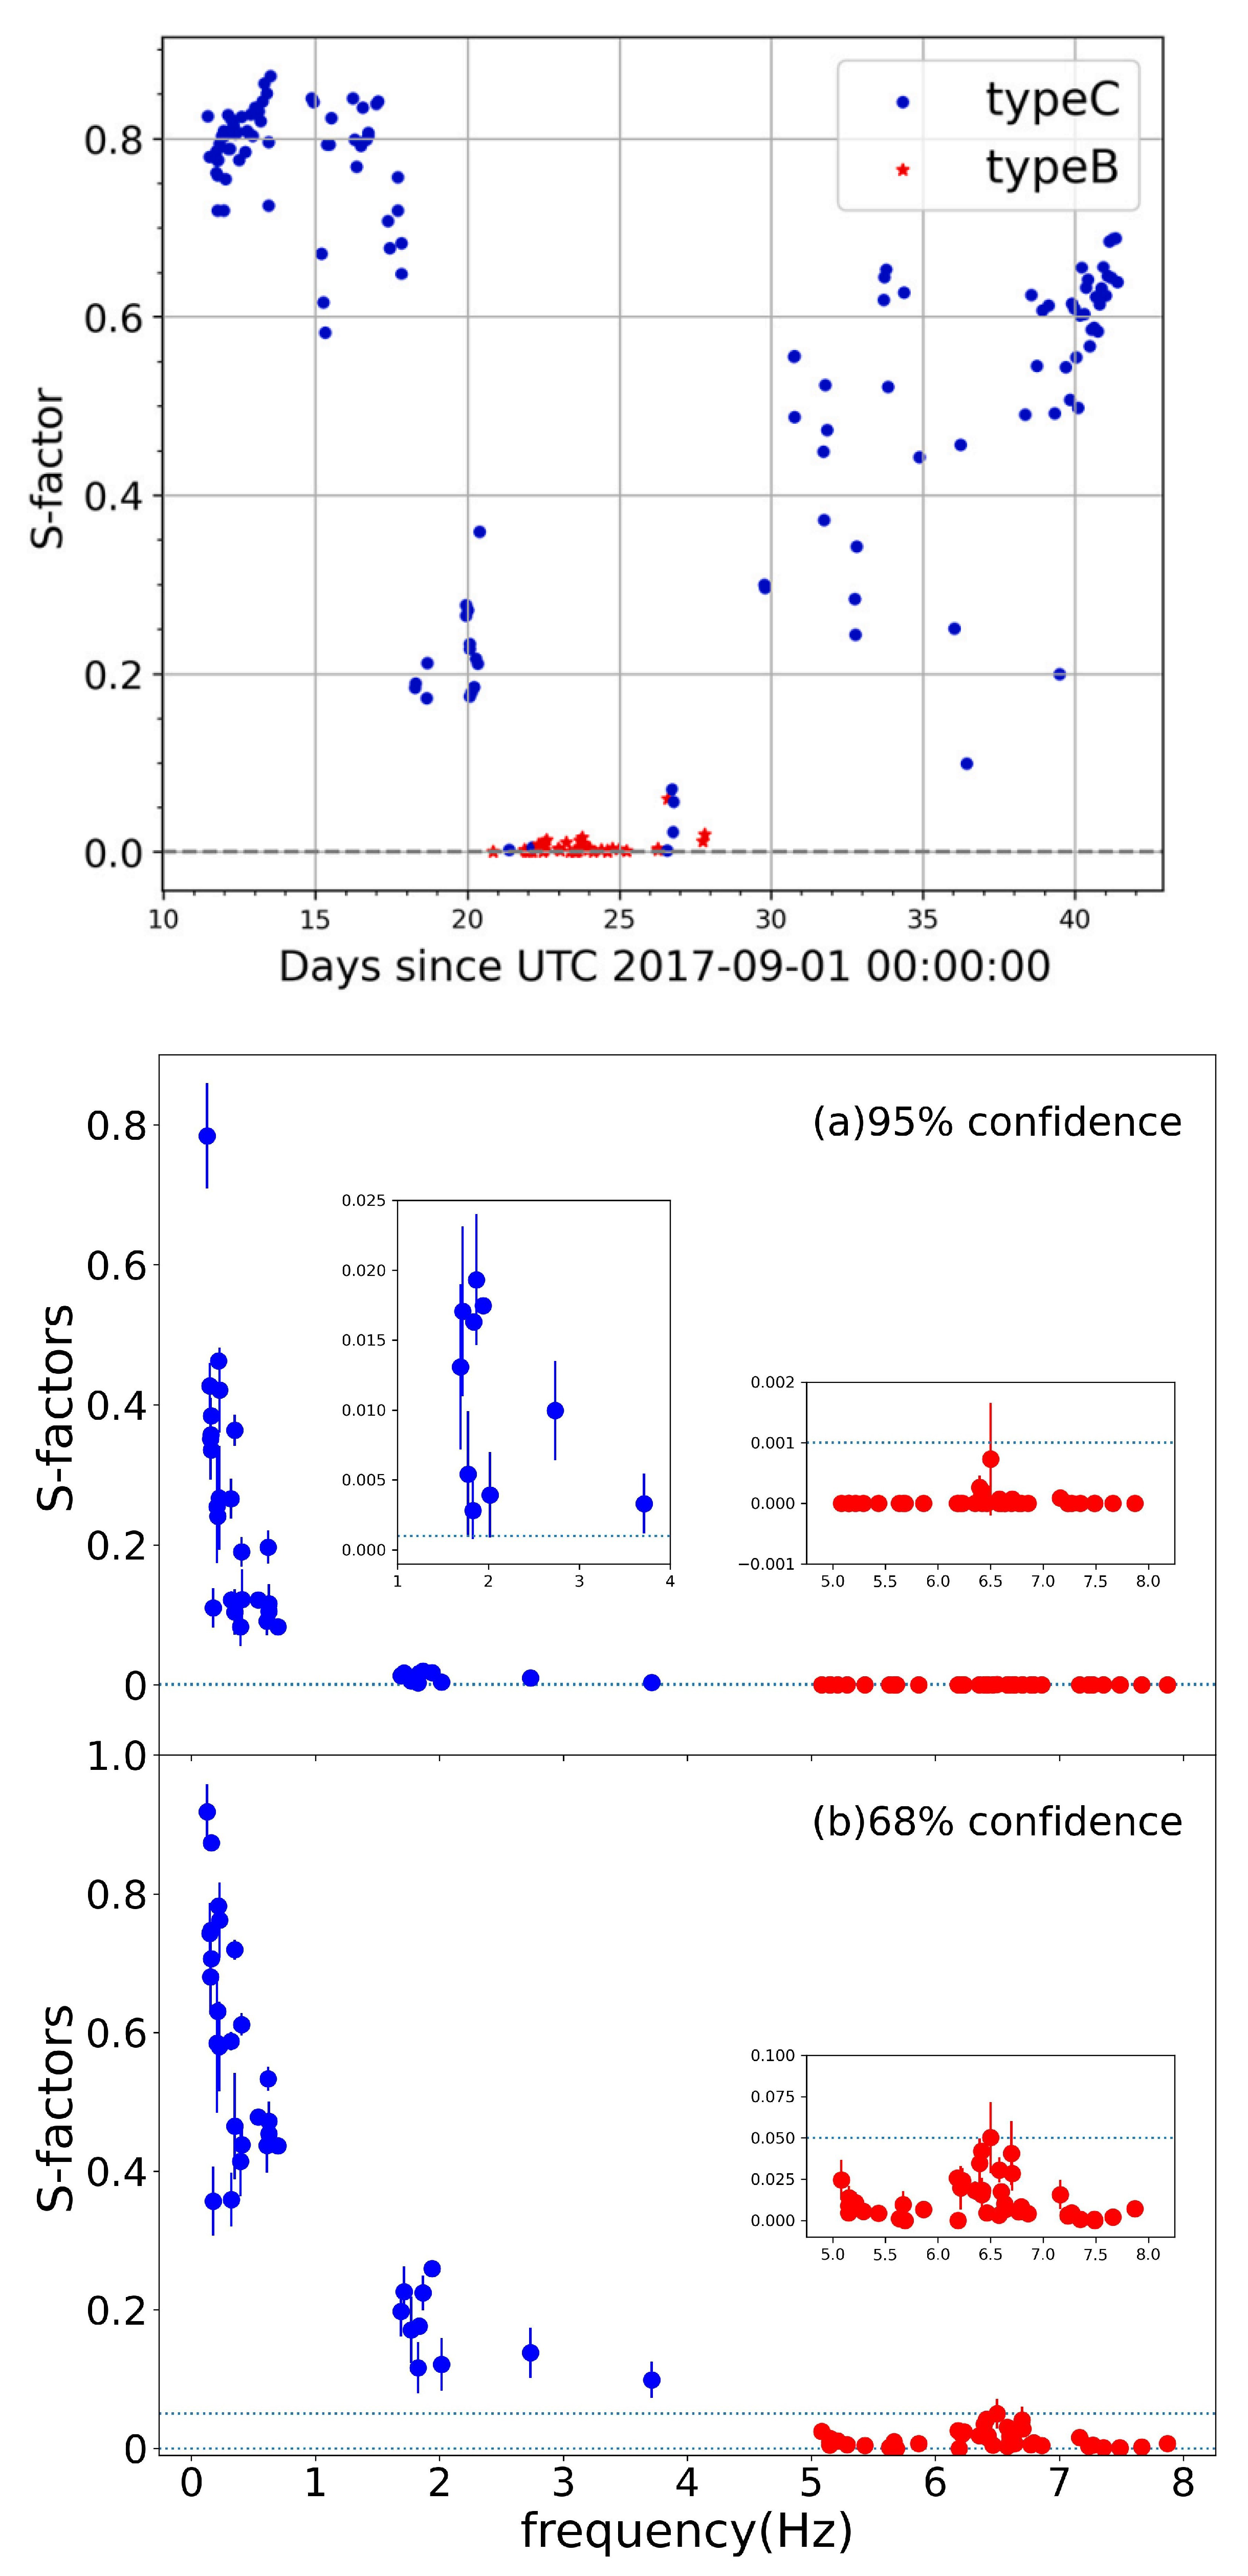
Chen and Wang [19] applied wavelet analysis to NICER observations of the black hole candidate MAXI J1535-571 to investigate its X-ray timing properties and QPOs. By segmenting the light curves according to wavelet confidence levels, the authors reported significant differences in PDS properties, hardness ratios, and mean count rates between intervals above and below the confidence threshold. They further introduced the S-factor, defined as the ratio of the effective oscillation time to the total observation time, to quantify QPO persistence. Their findings show that the S-factor is near zero for type-B QPOs, regardless of whether the confidence level is set at 95% or 68%, while type-C QPOs consistently exhibit significantly higher S-factor values, particularly at the 68% level, and the S-factor decreases with increasing QPO frequency (see Figure 21) . These results suggest that wavelet analysis may serve as a powerful diagnostic tool for distinguishing between type-B and type-C QPOs in black hole X-ray binaries.
Building on the methodology of Chen and Wang [19], Jin et al. [102] utilized observations from the Insight-HXMT and the NICER to investigate QPOs in the black hole candidate MAXI J1803-298 during its 2021 outburst. They identified type-C QPOs in the low-hard state and type-B QPOs in the soft-intermediate state, consistent with the findings of Zhu et al. [67]. After classifying QPOs in the Fourier domain, wavelet analysis was employed to isolate QPO components and segment the light curves into QPO and non-QPO intervals based on significance levels. Furthermore, energy-dependent correlations between the S-factor and count rate were discovered, indicating differing origins for QPOs in the high- and low-energy bands, possibly attributable to a dual-corona structure [67,103,104,105].
Compared with traditional methods, wavelet analysis offers a more detailed way to study signals that change rapidly over short timescales [106]. It can capture the changes in the type of QPOs more effectively, allowing researchers to track when QPOs appear or disappear. This helps in understanding how the physical state of the system changes during these times. Additionally, the S-factor provides a new and useful way to classify QPOs. Using the S-factor, different QPO types can be better distinguished, which sheds light on the different physical mechanisms behind them. Overall, wavelet analysis and the S-factor together provide important new tools for studying QPO behavior and understanding the nature of accretion flows around black holes.

5. Hilbert-Huang Transform

Previously, the HHT has been more widely applied in the field of active galactic nuclei (AGN) or gravitational wave [107,108]. Subsequently, this method has been widely applied in the study of QPOs [23,109,110]. As described by Huang and Wu [111], it involves two key steps: (1) Empirical Mode Decomposition (EMD), which decomposes the original signal into a set of intrinsic mode functions (IMFs) that are locally adaptive and data-driven; (2) Hilbert Transform, applied to each IMF to extract the instantaneous frequency and amplitude of the signal.
EMD is an iterative sifting technique used to extract oscillatory modes from a time series by removing local means [20,111]. The numerical procedure for extracting IMFs typically involves the following steps:
1.
Locate all the local extrema of the data x ( t ) , then construct the upper and lower envelopes by interpolating the local maxima and minima, respectively, using cubic splines.
2.
Calculate the mean function m 1 ( t ) by averaging the upper and lower envelopes, and subtract this mean from the data to obtain the first component: h 1 ( t ) = x ( t ) m 1 ( t ) .
3.
Check whether h 1 ( t ) satisfies the criteria for an IMF. If it does not, treat h 1 ( t ) as the new data and repeat steps (1) and (2) until an IMF is obtained.
4.
Once the first IMF component c 1 ( t ) is identified, define the residual r 1 ( t ) = x ( t ) c 1 ( t ) . Repeat steps (1) to (3) on the residual signal until the residual r n ( t ) becomes monotonic and no further IMFs can be extracted.
According to this procedure, the original signal x ( t ) can be decomposed as the sum of all IMF components and the final residual r n ( t ) :
x ( t ) = i = 1 n c i ( t ) + r n ( t ) .
The second step of the HHT involves applying the Hilbert transform to each IMF obtained from the decomposition step. The Hilbert transform generates the conjugate function y ( t ) , which is defined by the following principal value integral:
y ( t ) = 1 π P x ( t ) t t d t ,
where P is the Cauchy principle value. With this definition, x ( t ) and y ( t ) form the complex conjugate pair. This transformation allows the construction of an analytic signal z ( t ) , consisting of x ( t ) and its Hilbert transform y ( t ) , expressed as
z ( t ) = x ( t ) + i y ( t ) = a ( t ) e i θ ( t ) .
Here, the time-dependent amplitude a ( t ) and phase θ ( t ) are given by:
a ( t ) = x ( t ) 2 + y ( t ) 2 ,
and
θ ( t ) = arctan y ( t ) x ( t ) .
Therefore, the instantaneous frequency ω ( t ) can be defined as
ω ( t ) = d θ ( t ) d t
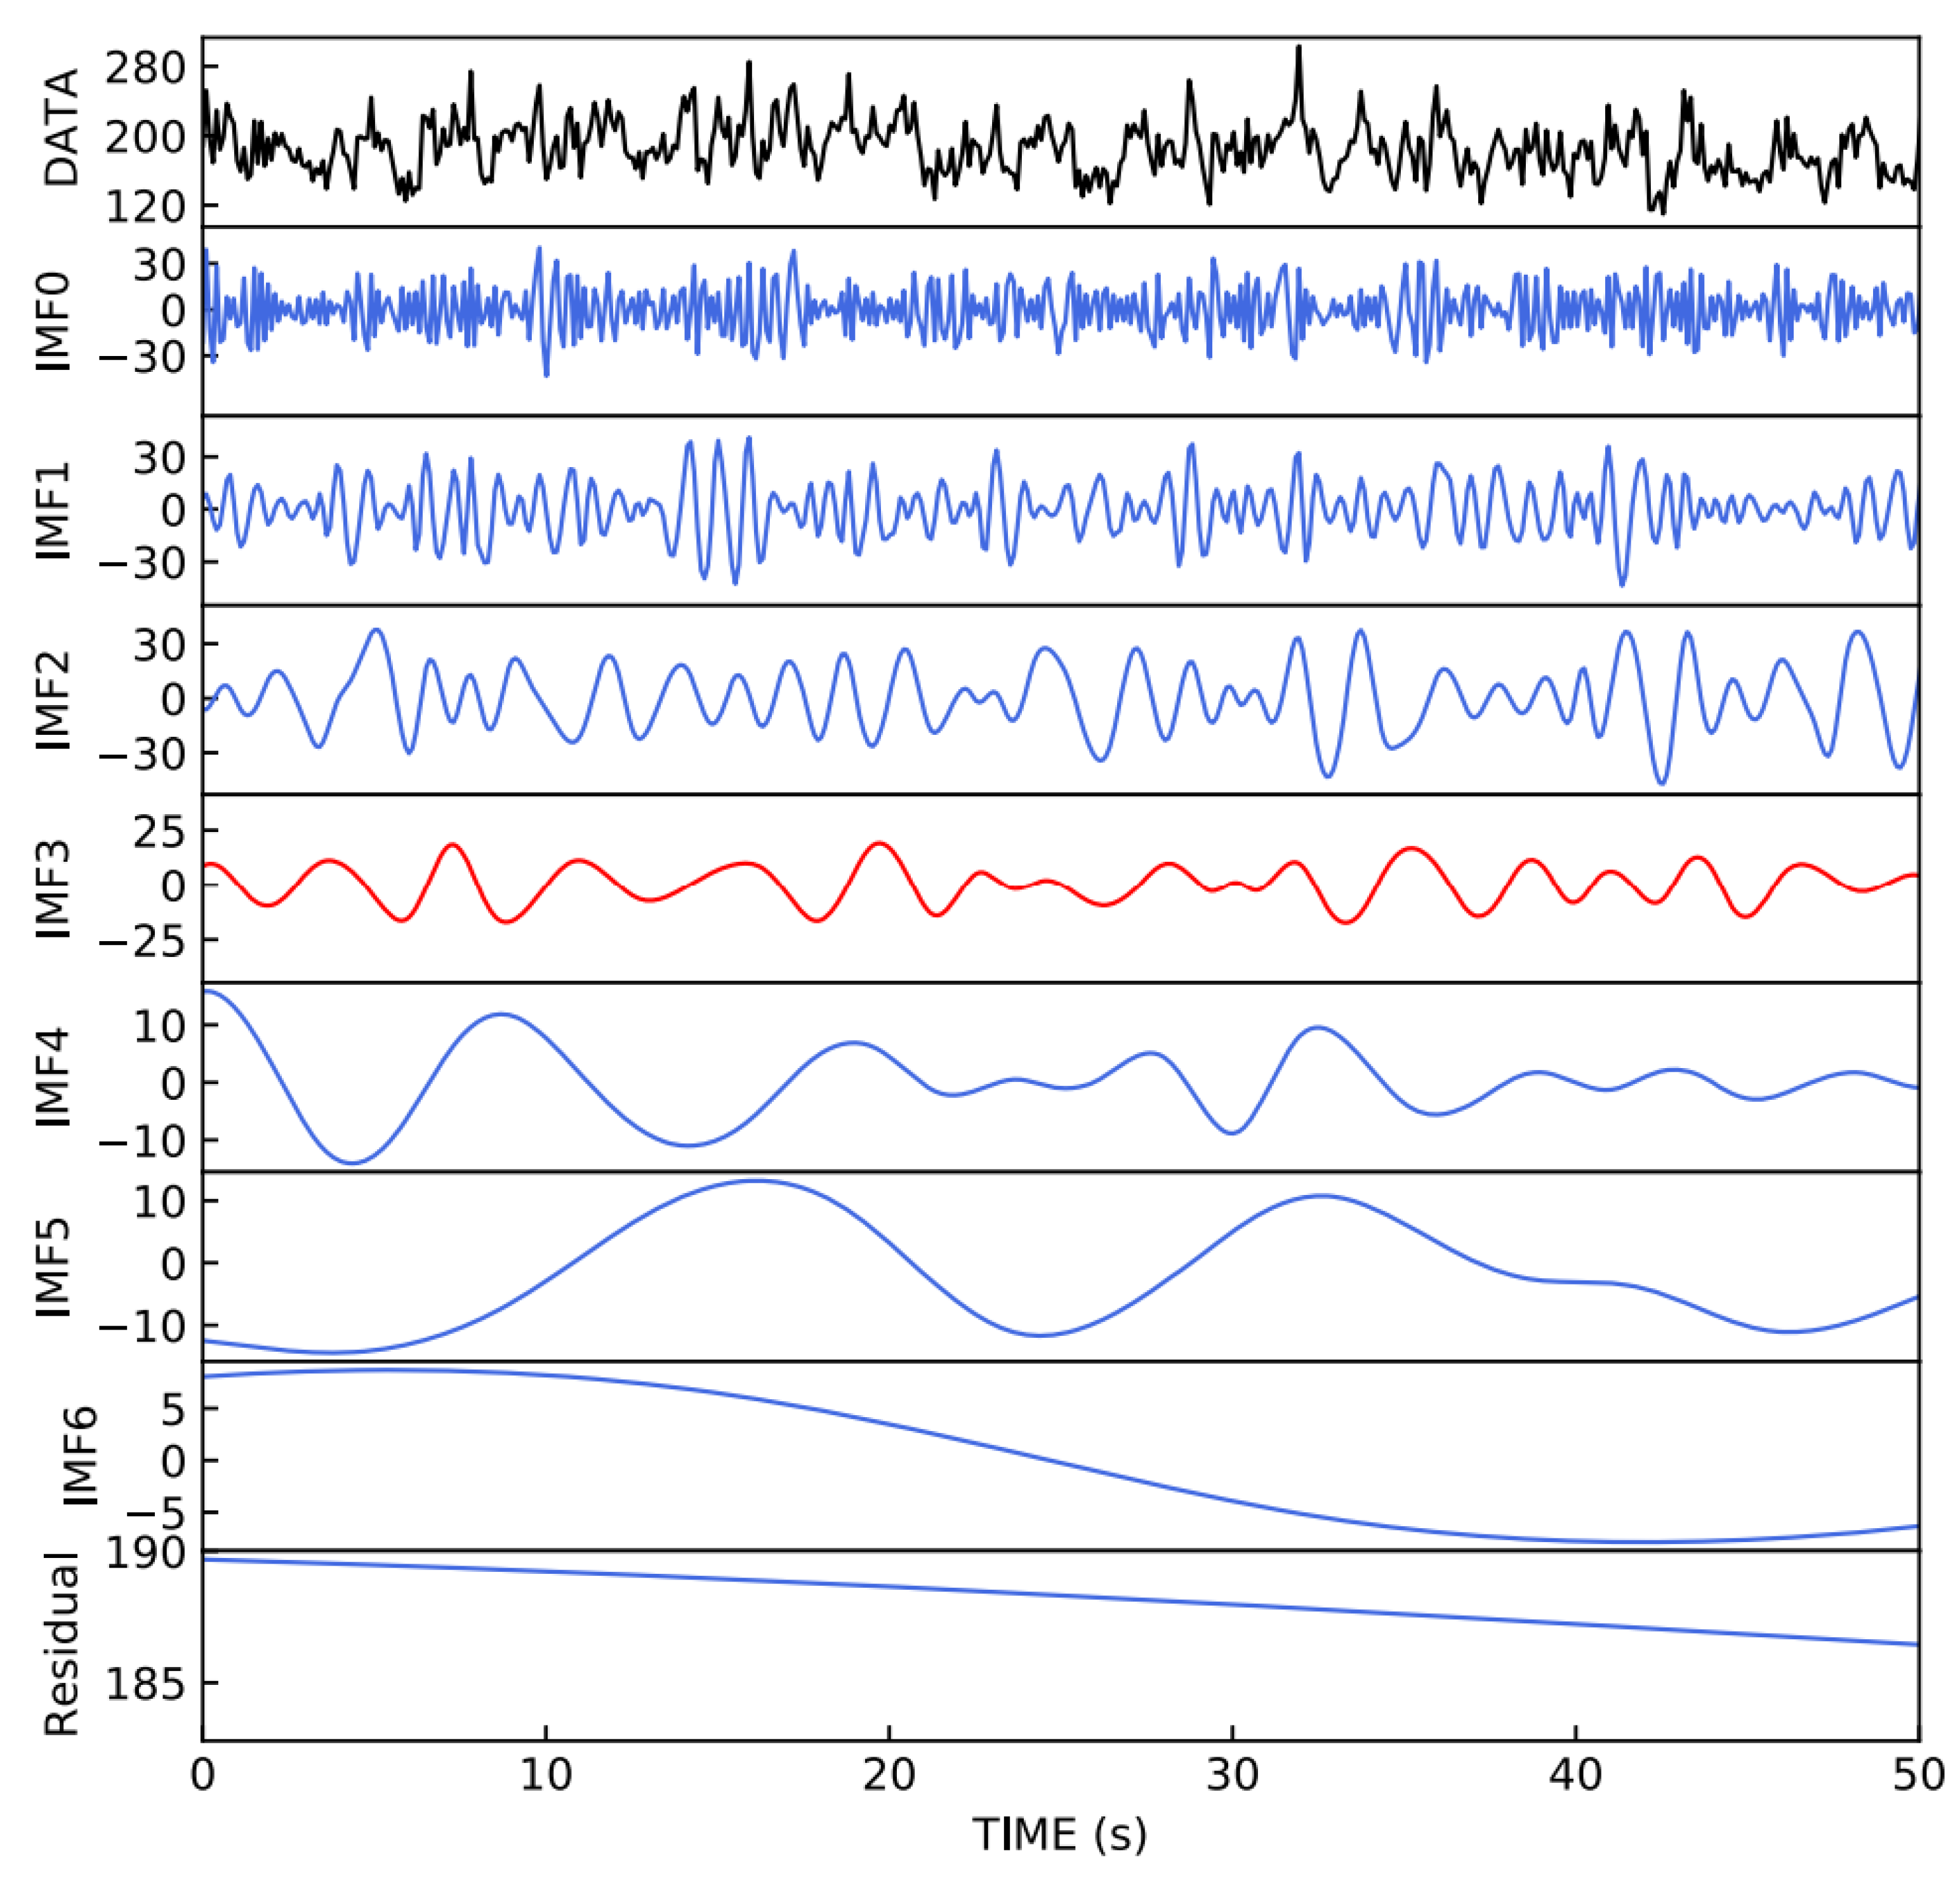
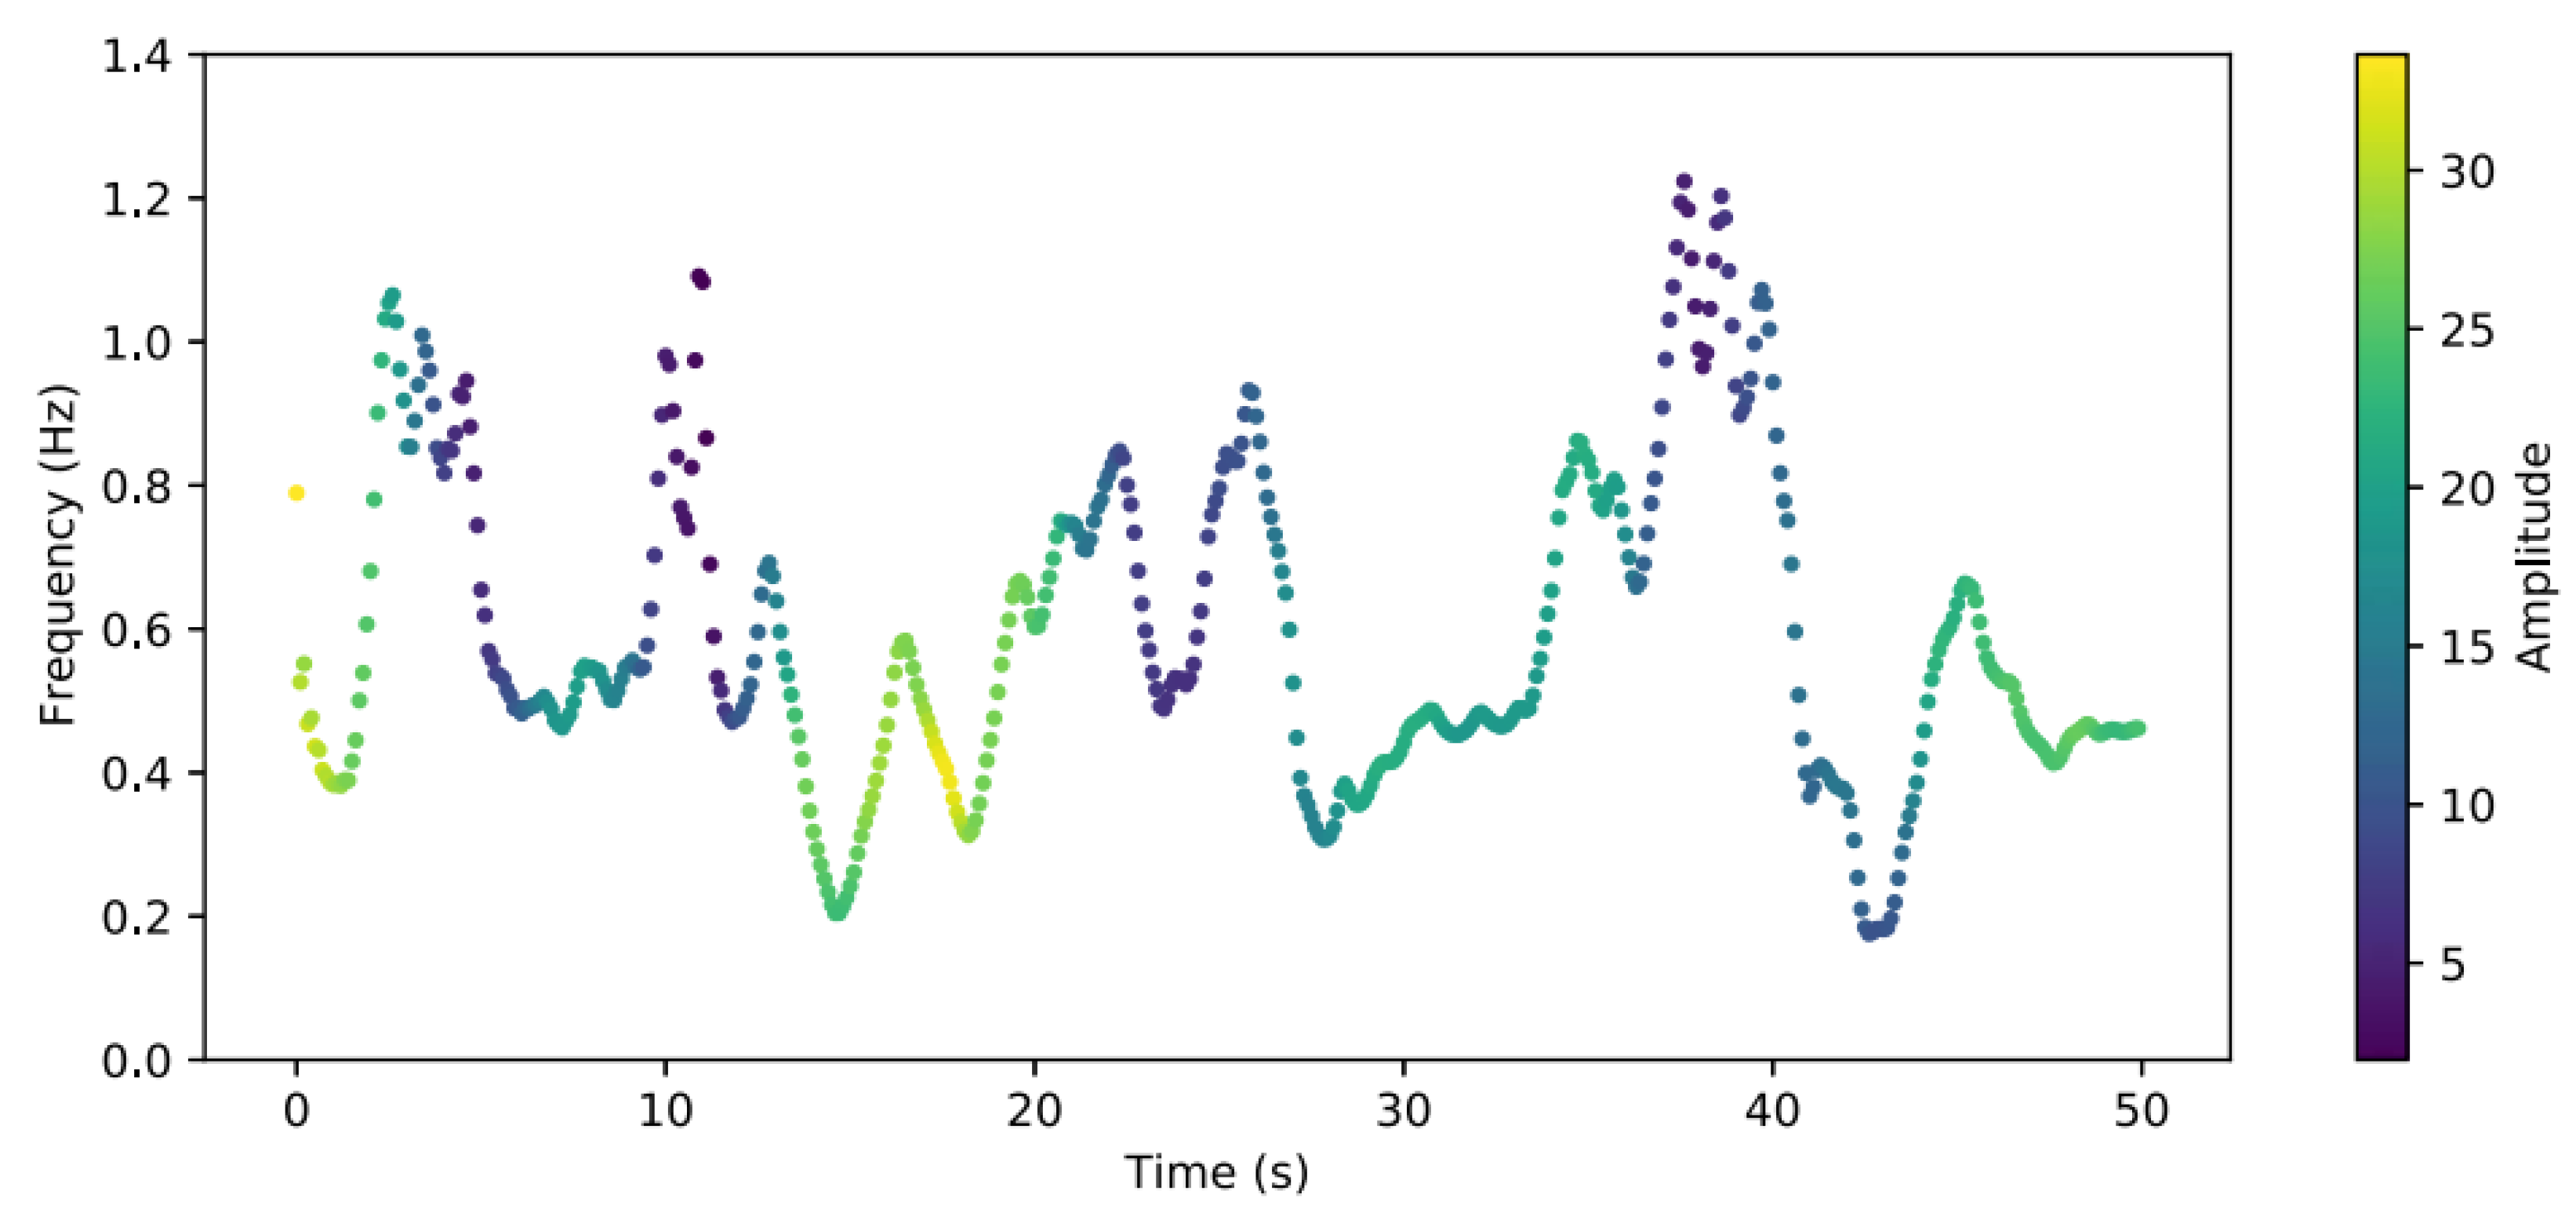
Yu et al. [112] presented a time-frequency analysis based on the HHT of the QPOs observed in the MAXI J1820+070. By employing the empirical mode decomposition method, they isolated the QPO component from the light curve and measured the intrinsic phase lag between photons across different energy bands. Figure 22 presents a 50-s light curve in the 27–150 keV energy range featuring a QPO near 0.4 Hz. Through empirical mode decomposition, seven significant components, called IMFs, were identified. The 0.4 Hz oscillation corresponds to IMF3. The high-frequency noise is represented by IMF0 to IMF2, while IMF4 and higher correspond to low-frequency noise. These components yield meaningful instantaneous frequencies via the Hilbert transform. Since the focus is on the QPO, the noise components are not analyzed in detail. Therefore, the analysis centers on IMF3, the QPO component. Figure 23 displays the average Fourier power spectra of these components.
Applying the HHT to the QPO light curve, they extract its instantaneous frequency and amplitude (see Figure 24). Comparison with traditional Fourier analysis shows that the broadening of the QPO peak is mainly caused by frequency modulation. Further analysis suggests that these modulations share a common physical origin with broadband noise and can be well explained by the internal shock model of the jet [113,114]. In this framework, gas shells are continuously ejected at randomly varying speeds and travel along the jet. At certain points, faster shells catch up with slower ones, causing collisions that produce shocks where electrons are accelerated to relativistic energies. These internal shocks, driven by fluctuations in the outflow velocity, can generate power spectrum features similar to low-frequency broadband noise.
Following Yu et al. [112], Shui et al. [41] performed phase-resolved spectroscopy over a broad energy range for the LFQPOs in MAXI J1820+070 during its 2018 outburst, using observations from Insight-HXMT. The original mode decomposition method, EMD, works directly in the time domain to adaptively break down a signal into several IMFs. However, EMD has some limitations, including a lack of rigorous mathematical foundation and sensitivity to noise and sampling issues. In contrast, Shui et al. [41] employed variational mode decomposition (VMD), a newer signal processing technique that overcomes the limitations of traditional methods. By decomposing the signal into IMFs with analytically determined center frequencies and bandwidths, VMD effectively resolves the problem of mode mixing, providing a more robust and accurate decomposition compared to EMD.
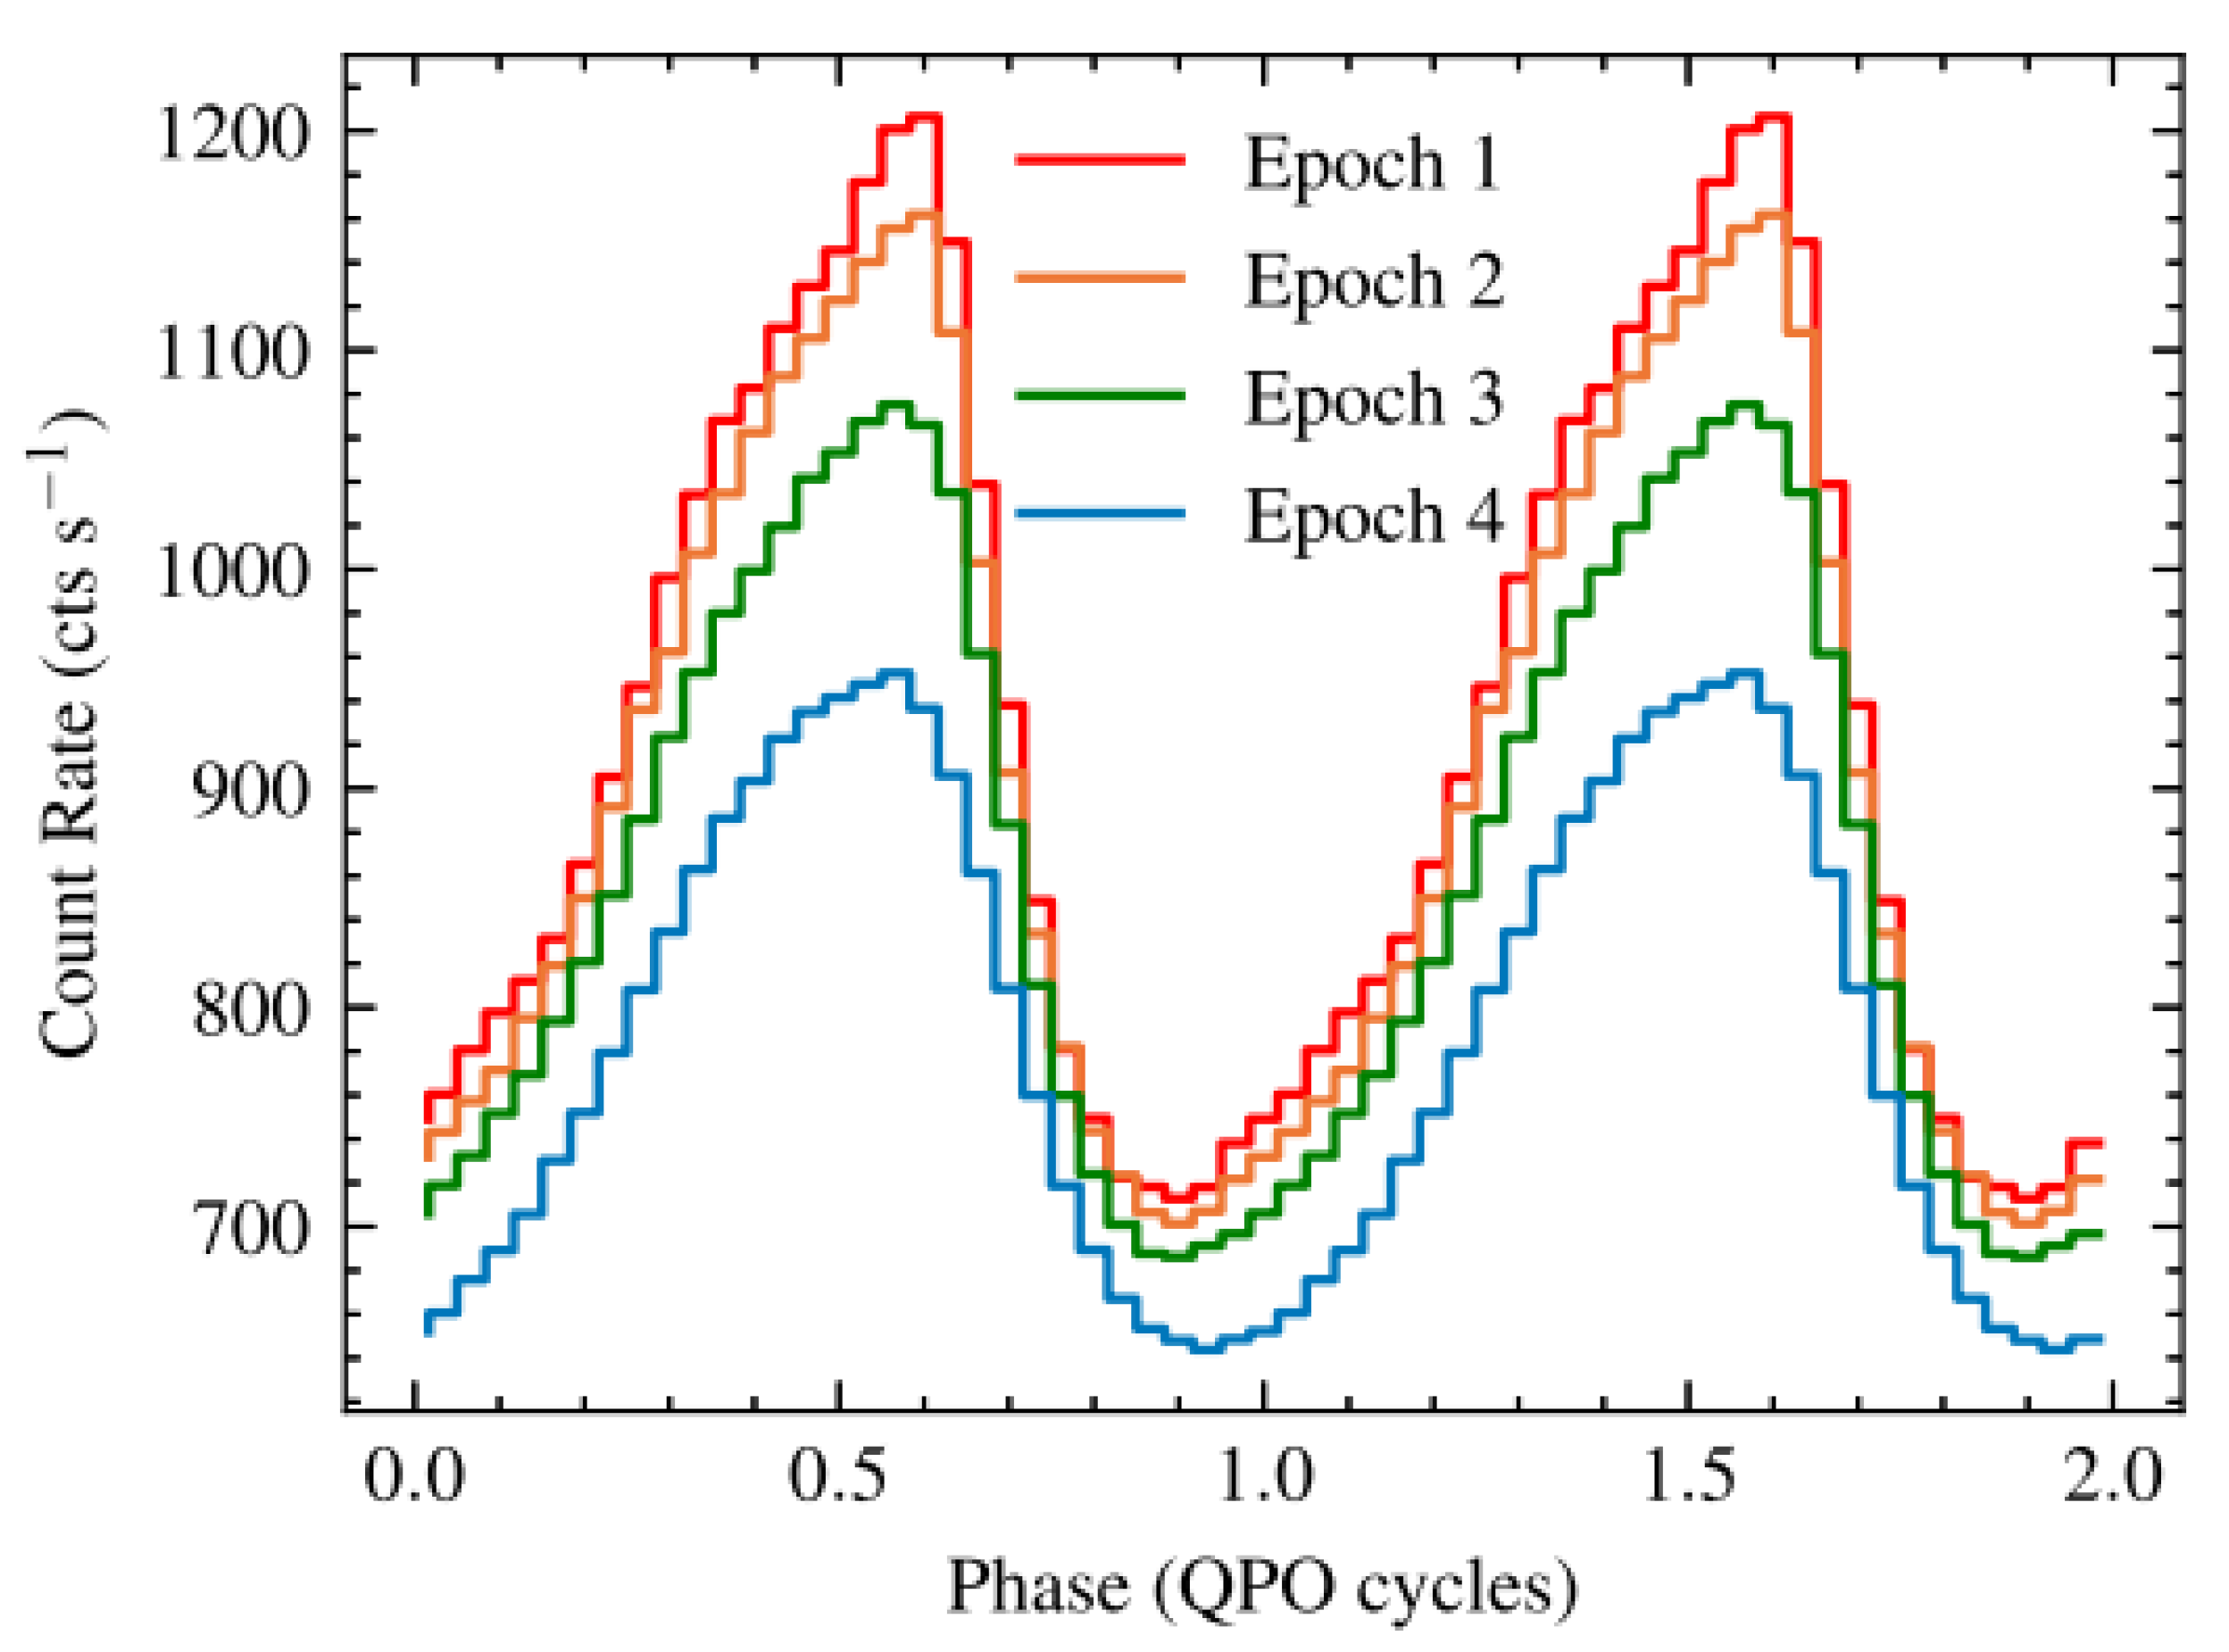
After obtaining each IMF using the VMD method, the Hilbert transform can be applied to extract physically meaningful phase, amplitude, and frequency functions. Once the instantaneous phases of the QPOs are calculated through the Hilbert transform, the QPO waveforms can then be constructed by phase-folding the light curves. Figure 25 presents the results for the four epochs. The QPO waveform displays a distinct non-sinusoidal shape, featuring a slow rise lasting about 0.7 cycles, followed by a rapid decline over approximately 0.3 cycles.
Once the QPO phase is obtained, phase-resolved spectroscopy—commonly used in X-ray pulsar studies [115,116]—can be performed. They used the spectral model1 with c o n s t a n t × T b a b s × ( d i s k b b + r e l x i l l C p + x i l l v e r C p ) , to fit the spectra at different phases. Figure 26 presented the phase dependence of seven free parameters—namely, the inner disk temperature ( T i n ), inner radius ( R i n ), spectral index ( Γ ), electron temperature ( k T e ), reflection fraction ( R f ), and the normalizations of relxillCp (Norm1) and xillverCp (Norm2)—across four epochs. Each panel also includes the QPO waveform repeated twice shown as a gray dashed line.
The phase-resolved spectral analysis reveals no significant modulation in T i n and R i n despite flux variations during the QPO period. However, notable modulations are detected in the spectral index and the normalization of relxillCp throughout all epochs, with these two parameters sharing the same modulation phase as the flux. Significant phase modulations in R f and k T e appear in Epochs 3 and 4 but are absent in Epochs 1 and 2. The normalization of xillverCp shows strong phase modulation in Epochs 1 and 2, which weakens to a marginal level in Epochs 3 and 4. The observed modulation of the spectral index may be interpreted within both the corona and jet precession frameworks, with the jet scenario necessitating efficient particle acceleration. Additionally, significant variations in the reflection fraction are only observed during the later phases of the bright hard state. These results support a geometric origin for LFQPOs and shed light on the evolving accretion geometry throughout the outburst of MAXI J1820+070.
Following this, Shui et al. [117] applied the HHT to perform phase-resolved spectroscopy of QPOs in the newly discovered BHXRB Swift J1727.8-1613, based on observations from NICER, NuSTAR, and Insight-HXMT. Their analysis revealed that both the nonthermal and disk-blackbody components exhibit QPO-phase-dependent variability, with the nonthermal component contributing most significantly. They detected strong modulations in the disk temperature, spectral index, and reflection fraction. Notably, the variation in disk temperature was found to precede the changes in nonthermal and disk flux by approximately 0.4–0.5 QPO cycles, lending further support to the geometric origin scenario for type-C QPOs.
In addition, Shui et al. [118] proposed a novel method based on the HHT to recover high-energy waveforms of QPOs. Applying this technique to Insight-HXMT observations of MAXI J1535-571, they successfully detected significant modulation in the phase-folded light curves above 170 keV, using QPO phases reconstructed from lower-energy data. Comprehensive simulations confirmed that the observed modulation originates from genuine QPO signals. This result significantly extends the energy range for QPO detection beyond the previously reported about 100 keV limit achieved with traditional Fourier-based methods. Further analysis revealed energy-dependent QPO characteristics: in the 30–100 keV range, the phase lag remains roughly constant with a slight increase in amplitude; however, in the 100–200 keV band, the QPOs exhibit soft phase lags and a decreasing amplitude. These findings, coupled with evidence of a hard spectral tail in broad-band spectroscopy, suggest that QPOs above 100 keV are likely associated with a hard-tail component, possibly originating from a relativistic jet. Moreover, the observed correlation between jet- and corona-related QPO signatures supports the scenario of jet-corona coupled precession.
It was worth noting that this method has been applied not only in traditional X-ray observations but also in X-ray polarimetry studies. For instance, Zhao et al. [42] presented the first polarimetric analysis of QPOs in a black hole binary using Imaging X-ray Polarimeter Explorer (IXPE) data. Focusing on Swift J1727.8-1613 during its 2023 outburst, they reported significant QPO signals at a frequency of about 1.34 Hz with a fractional rms of ∼12.3%. A phase-resolved analysis using the HHT reveals strong modulation of the photon index over the QPO phase. However, no significant QPO-phase modulation is detected in the polarization degree (PD) or polarization angle (PA), challenging predictions from the Lense-Thirring precession model.
In summary, HHT has enabled significant progress in understanding the nature of low-frequency quasi-periodic oscillations in black hole X-ray binaries. By combining adaptive mode decomposition methods such as EMD and VMD with phase-resolved spectroscopy, researchers have revealed complex phase-dependent variations in both thermal and nonthermal spectral components. These findings strongly support a geometric origin for type-C QPOs, potentially linked to precession of the inner accretion flow, corona, or jet. Furthermore, the successful recovery of QPO waveforms at energies above 100 keV, as well as the application of these techniques in X-ray polarimetry, extends the observational horizon and places new constraints on theoretical models such as Lense-Thirring precession and jet-corona coupling. Together, these results highlight the power of time-frequency techniques in uncovering the dynamic structure of accretion systems and pave the way for future multiwavelength and polarimetric studies of QPO phenomena.

6. Bicoherence

Uttley et al. [28] discovered the nonlinearity of broadband noise in accreting black hole systems through the linear rms-flux relation and the lognormal distribution of flux. Maccarone and Coppi [26] proposed that bicoherence—a statistic quantifying phase coupling between different Fourier frequencies—is a powerful tool for probing higher-order variability in these systems. The bispectrum is a technique used to investigate phase coupling between Fourier components and to assess the non-linearity of light curves. To compute the bispectrum, the time series is first divided into K segments, and then the bispectrum is calculated for each segment as follows:
B ( k , l ) = 1 K i = 0 K 1 X i ( k ) X i ( l ) X i * ( k + l ) ,
where X i ( f ) is the Fourier transform of the ith intervals of the time-series at frequency f, and X i * ( f ) is the conjugate of X i ( f ) . Since bispectrum is a complex number, it can be denoted by a magnitude with a phase in the complex plane, and this phase is called biphase.
A more commonly used form is the bicoherence, which ranges from 0 to 1 and represents the normalized magnitude of the bispectrum, defined as:
b 2 = | X i ( k ) X i ( l ) X i * ( k + l ) | 2 | X i ( k ) X i ( l ) | 2 | X i ( k + l ) | 2 .
This normalization, introduced by Kim and Powers [24], quantifies the degree of phase coupling among the three frequencies k, l and k + l —a measure known as biphase consistency. A high bicoherence value (close to 1) indicates strong and coherent phase coupling across the segments. Conversely, when the phase coupling is weak or random, the bicoherence value tends toward 0.
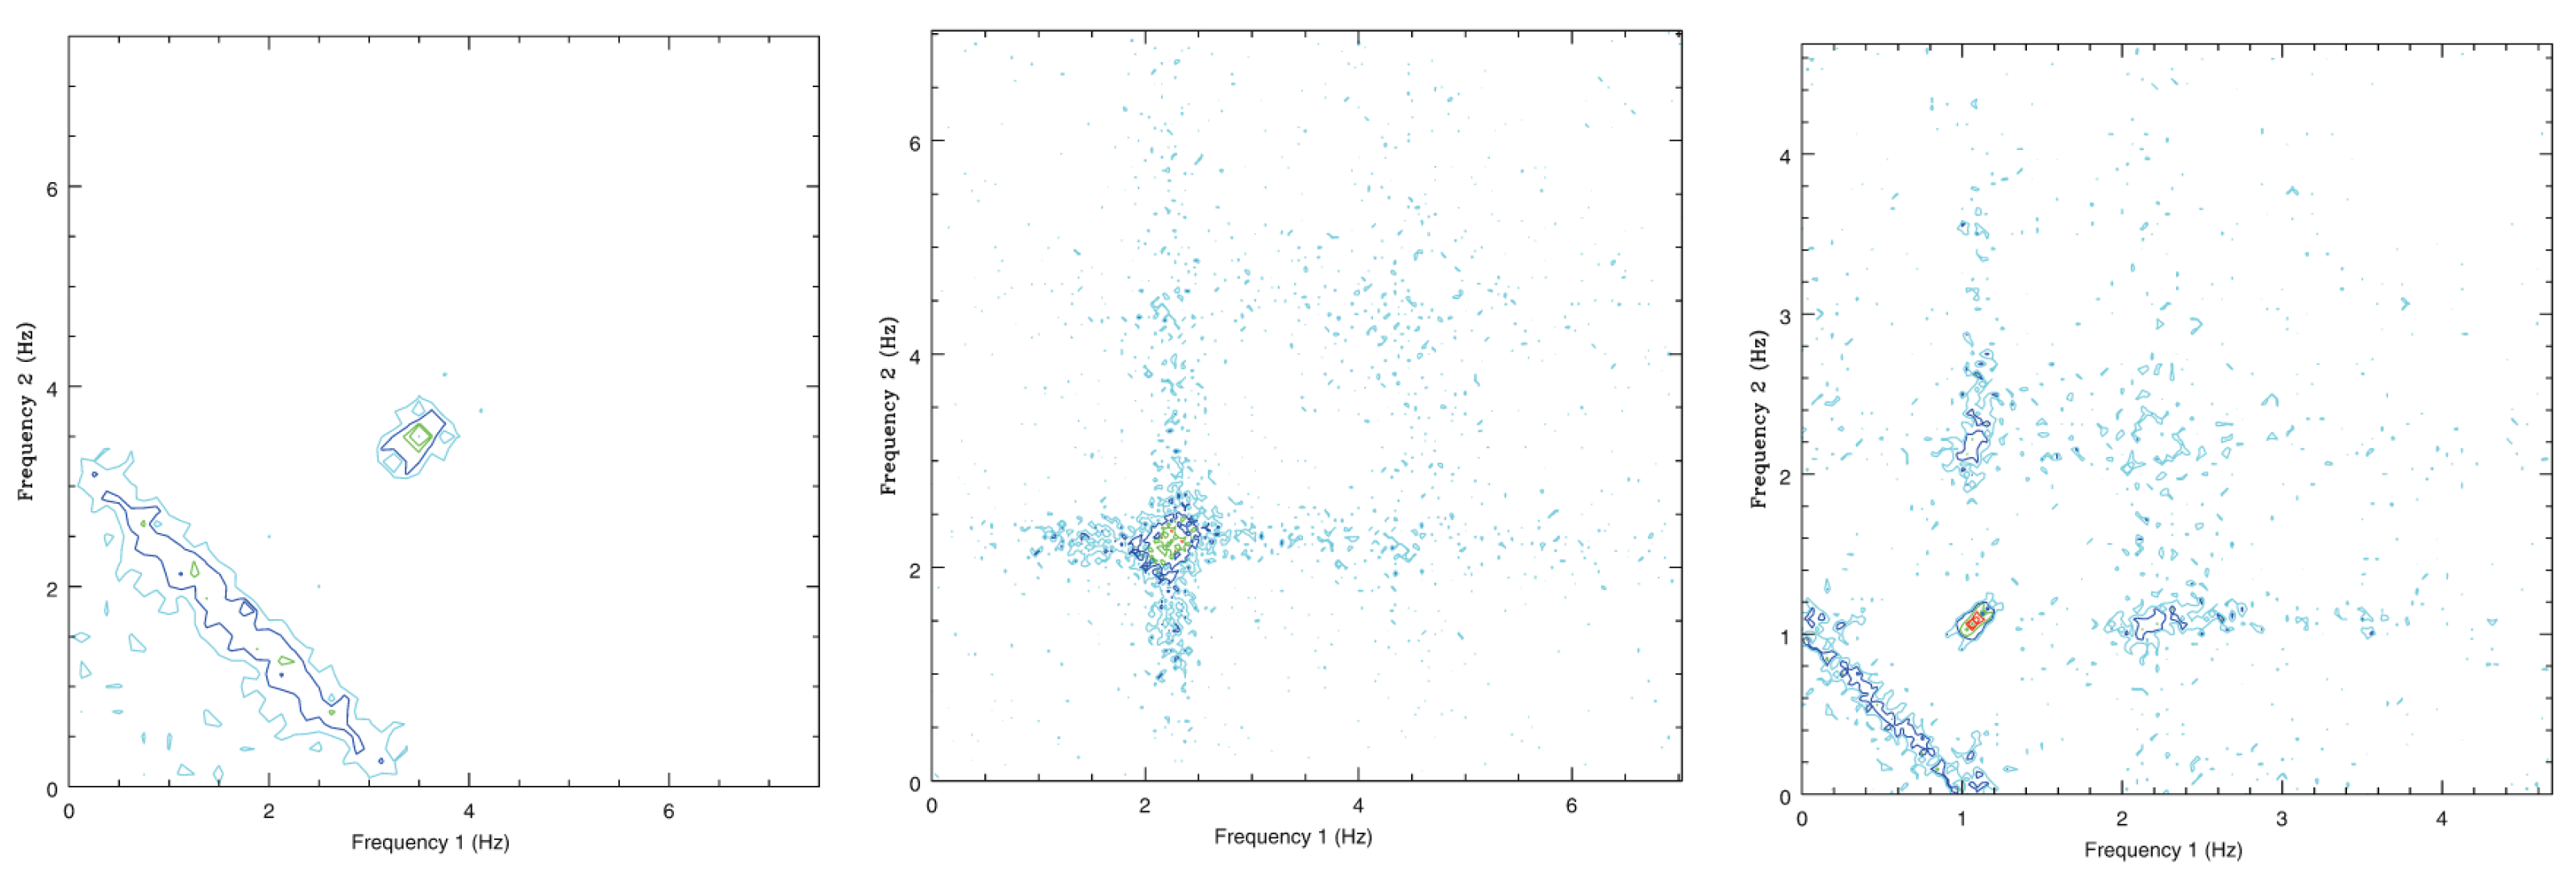
Observations of type-C QPOs typically reveal three distinct bicoherence patterns: the “hypotenuse,” the “cross,” and the “web” [119,120]. The “hypotenuse” pattern emerges along the diagonal where two frequencies ( f 1 and f 2 ) satisfy the relation f 1 + f 2 = f QPO , indicating phase coupling between the QPO fundamental and low-frequency broadband noise. In the “cross” pattern, strong bicoherence is observed when one of the frequencies equals f QPO , while the other spans a broad range. The “web” pattern combines features of both the hypotenuse and cross types. Schematic illustrations of these patterns are shown in Figure 27.
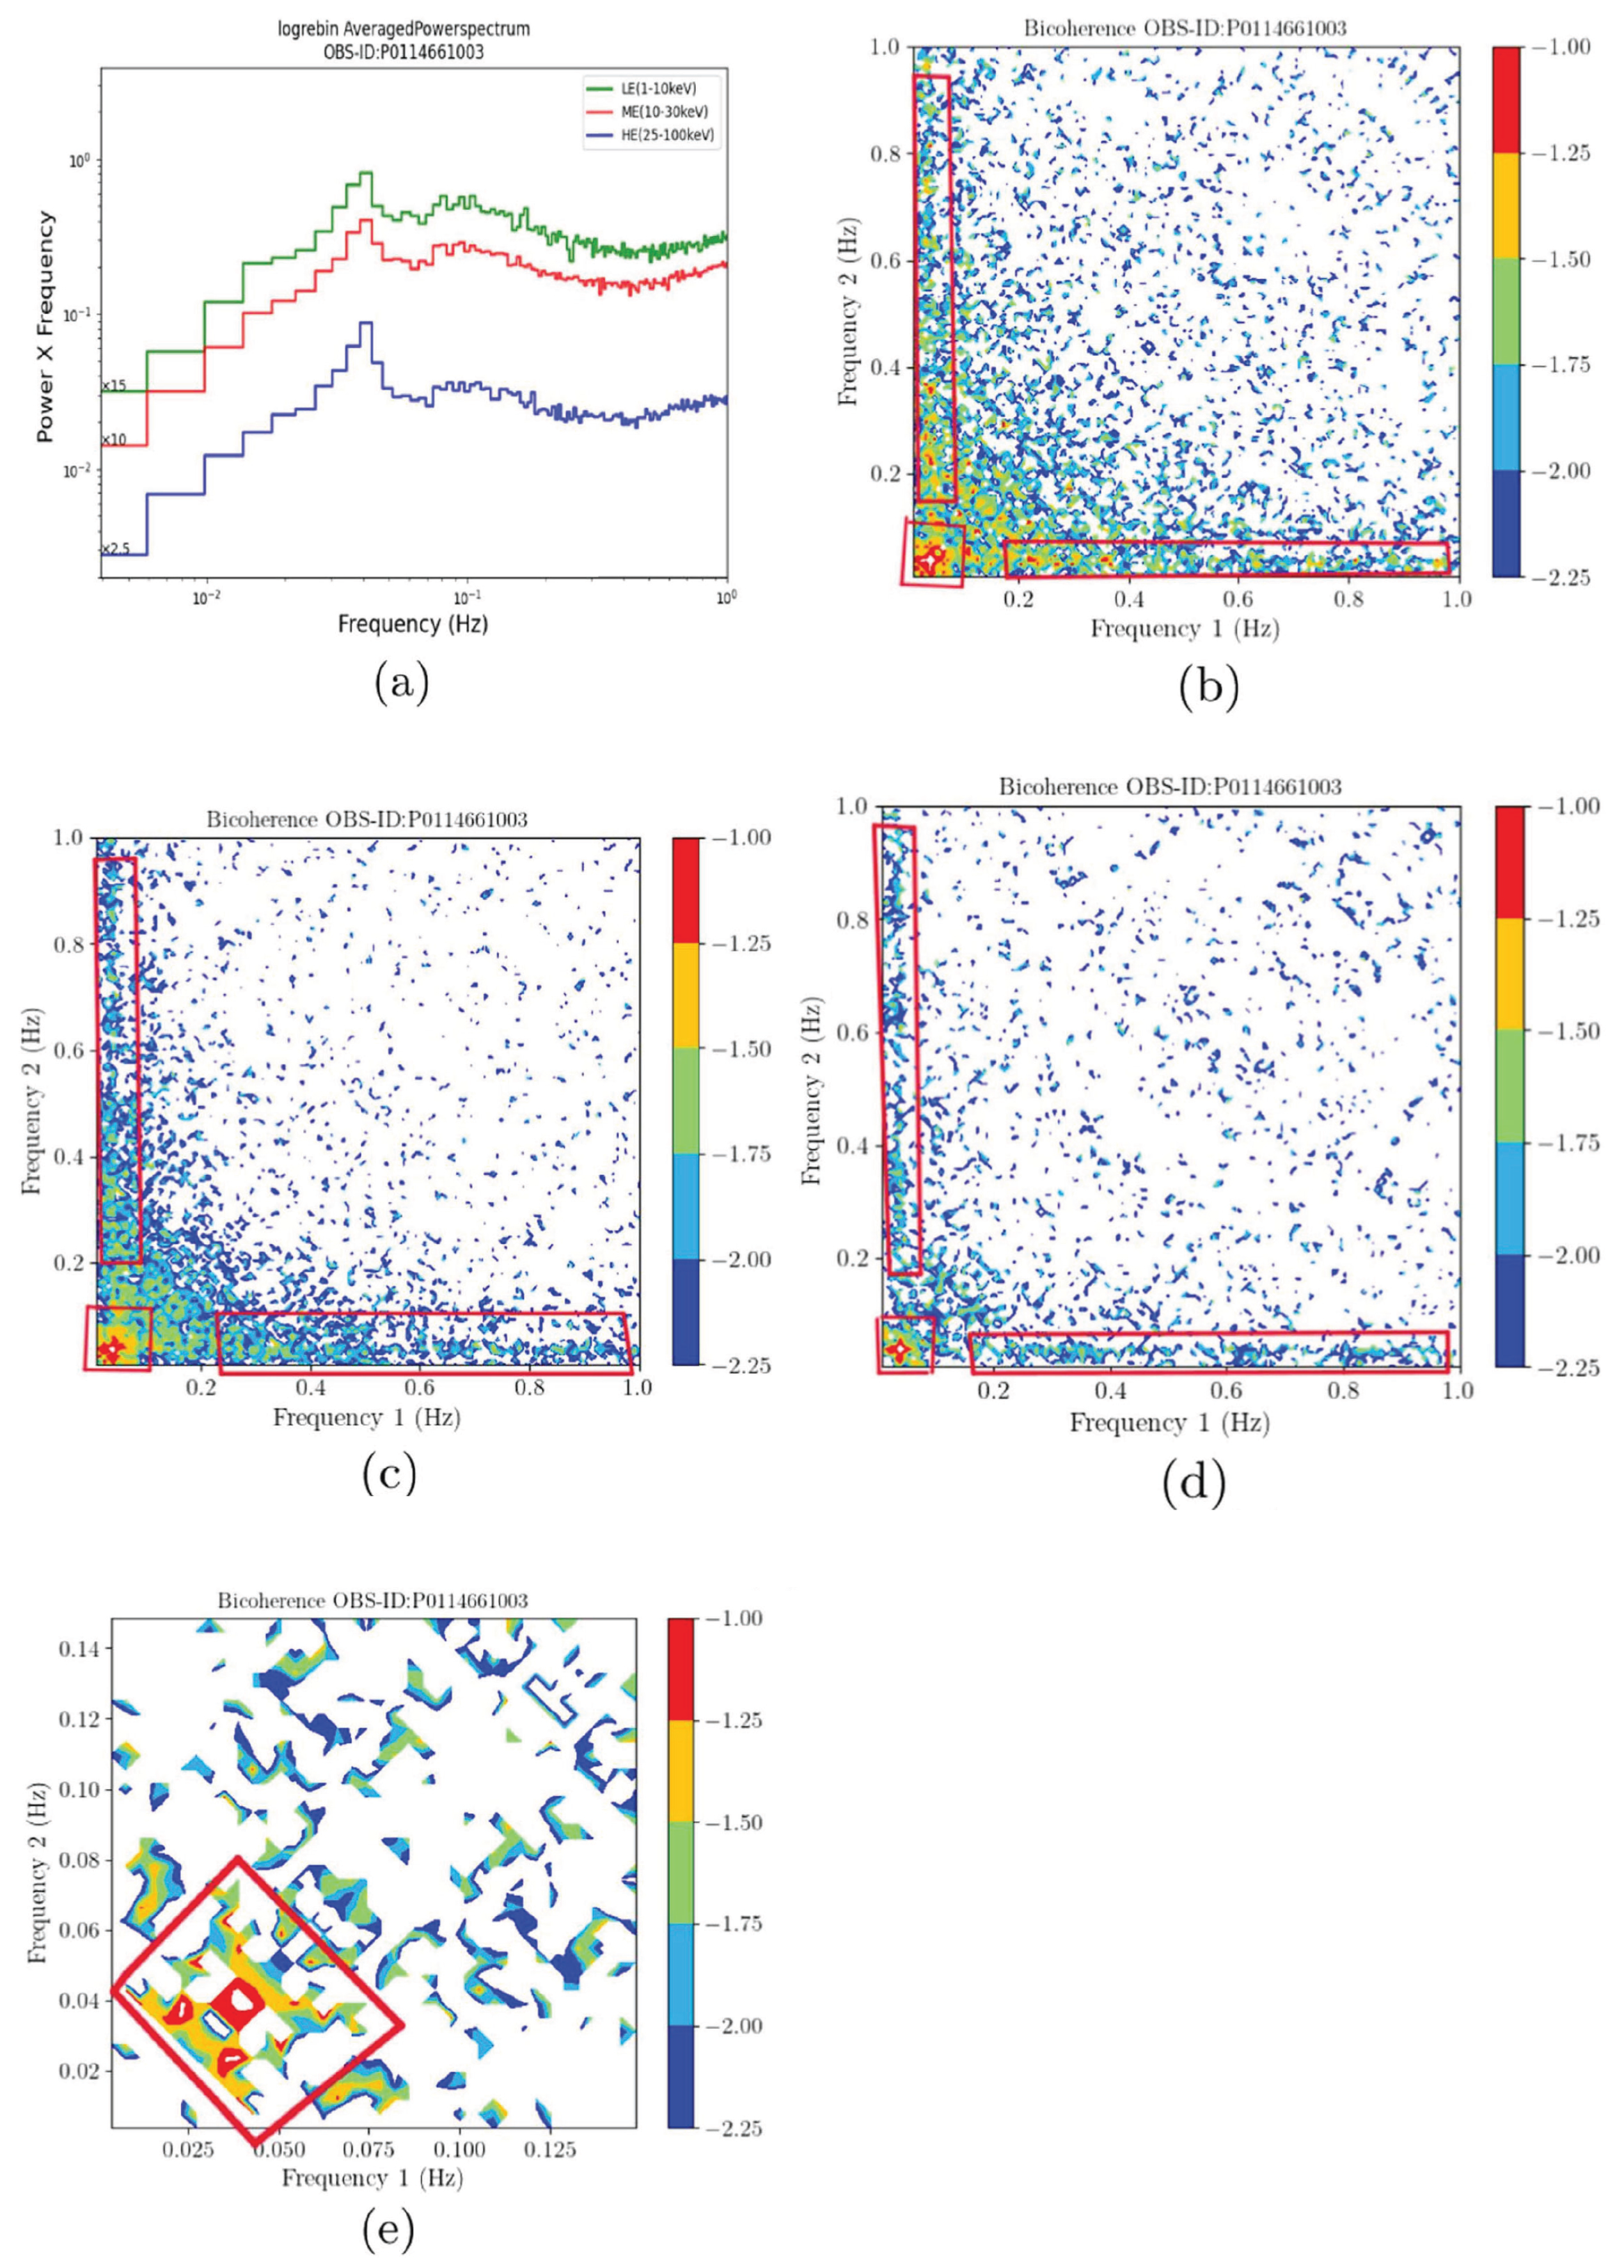
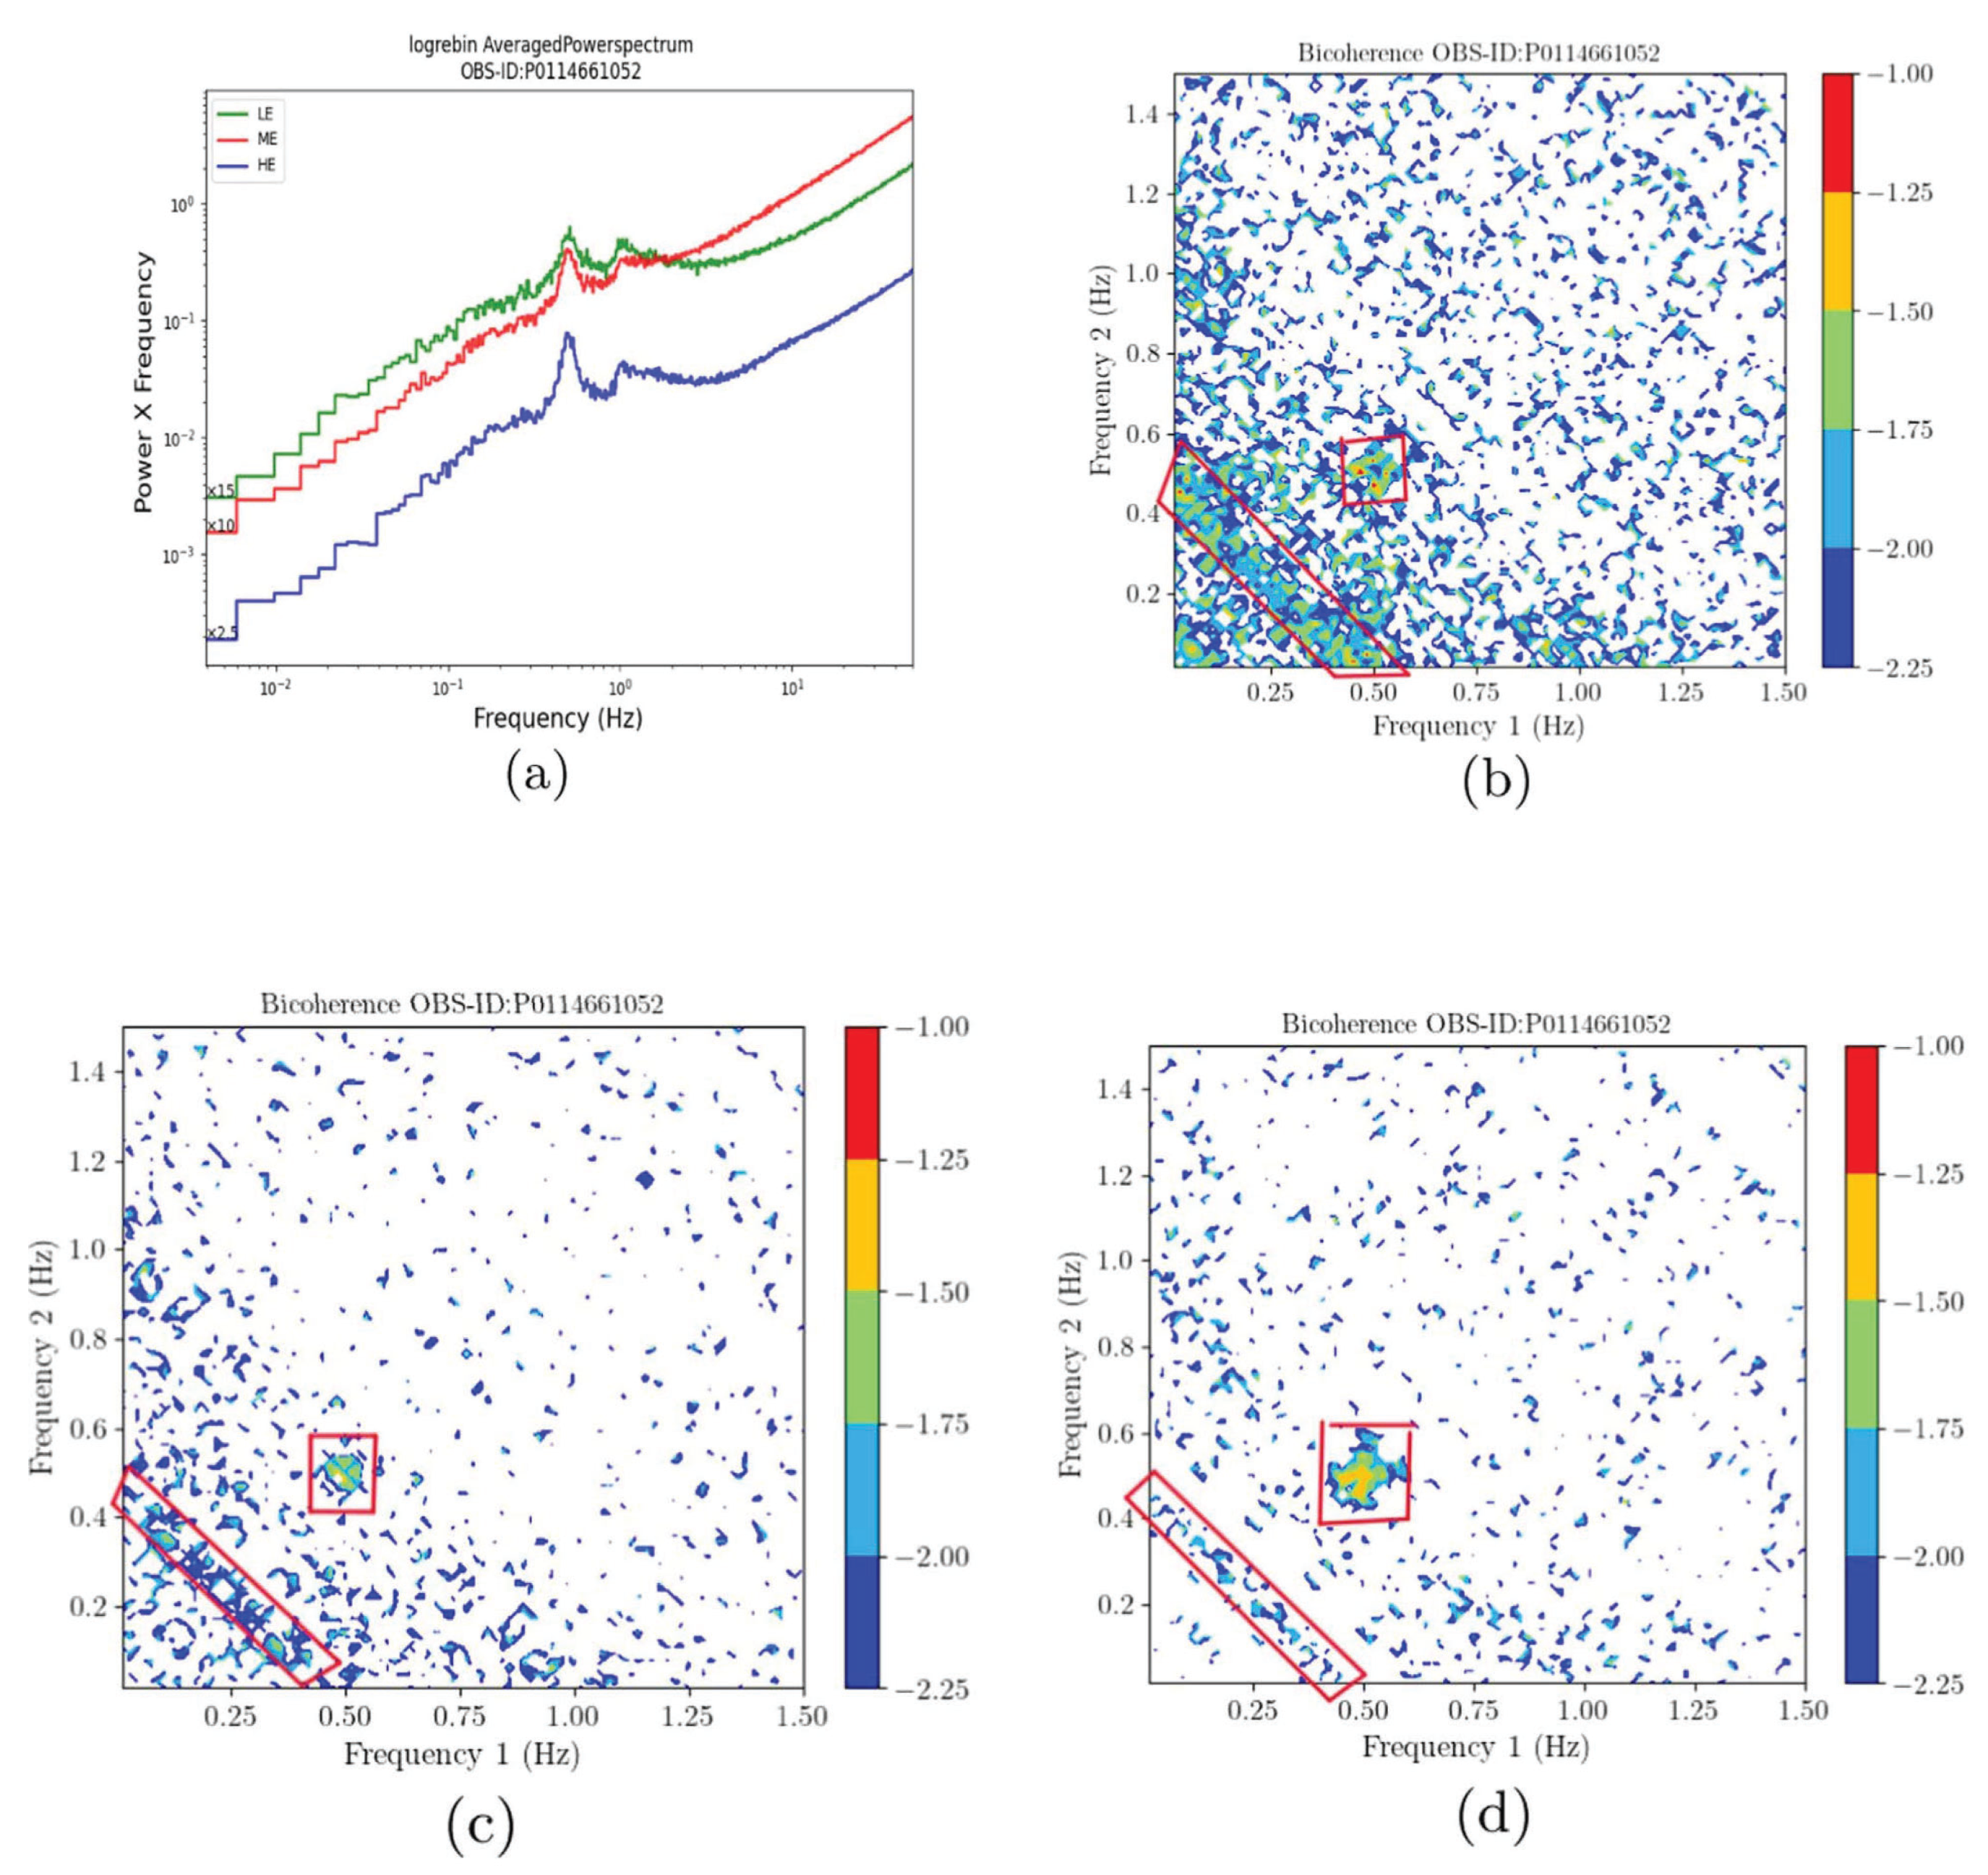
Ding et al. [121] performed a detailed timing analysis of nonlinear variability in two black hole low-mass X-ray binaries, MAXI J1820+070 and MAXI J1535-571, using bicoherence as a metric to quantify phase coupling between different Fourier frequencies. They identified distinct bicoherence patterns—such as the “cross” and “hypotenuse”—associated with LFQPOs in various spectral states. When clearly resolved, these patterns persist consistently across a wide energy range from 1 to 100 keV, as illustrated in Figure 28 and Figure 29.
Interestingly, a hypotenuse pattern—typically considered a hallmark of type-C QPOs—was also observed in a type-B QPO. This unexpected result implies that different QPO types may share common physical origins. Moreover, the study highlights the potential of nonlinear timing analysis as a powerful diagnostic tool for distinguishing between competing QPO models, particularly those that differ in how they describe the coupling between broadband noise and QPO signals.
Zhu et al. [122] applied bicoherence analysis to study QPOs in the black hole X-ray binary MAXI J1535-571 during its 2017 September–October outburst. In their results, the bicoherence pattern of the type-C QPO initially appeared as a “web” and subsequently evolved into a “hypotenuse” following the emergence of a type-B QPO. This pattern evolution suggests that MAXI J1535-571 is likely a low-inclination system. Moreover, the strength of the bicoherence signal was found to vary across different energy bands. The authors interpreted these results within the framework of a dual-corona geometry.
In a subsequent study, Zhu et al. [123] conducted bicoherence analysis of Swift J1727.8-1613 during its 2023 outburst, utilizing data from Insight-HXMT. Their investigation focused on QPOs with frequencies above 1 Hz, all of which were classified as type-C QPOs. A strong correlation was observed between the QPO frequency and the hardness ratio, as well as a linear relationship between the QPO fractional rms and the hardness ratio.
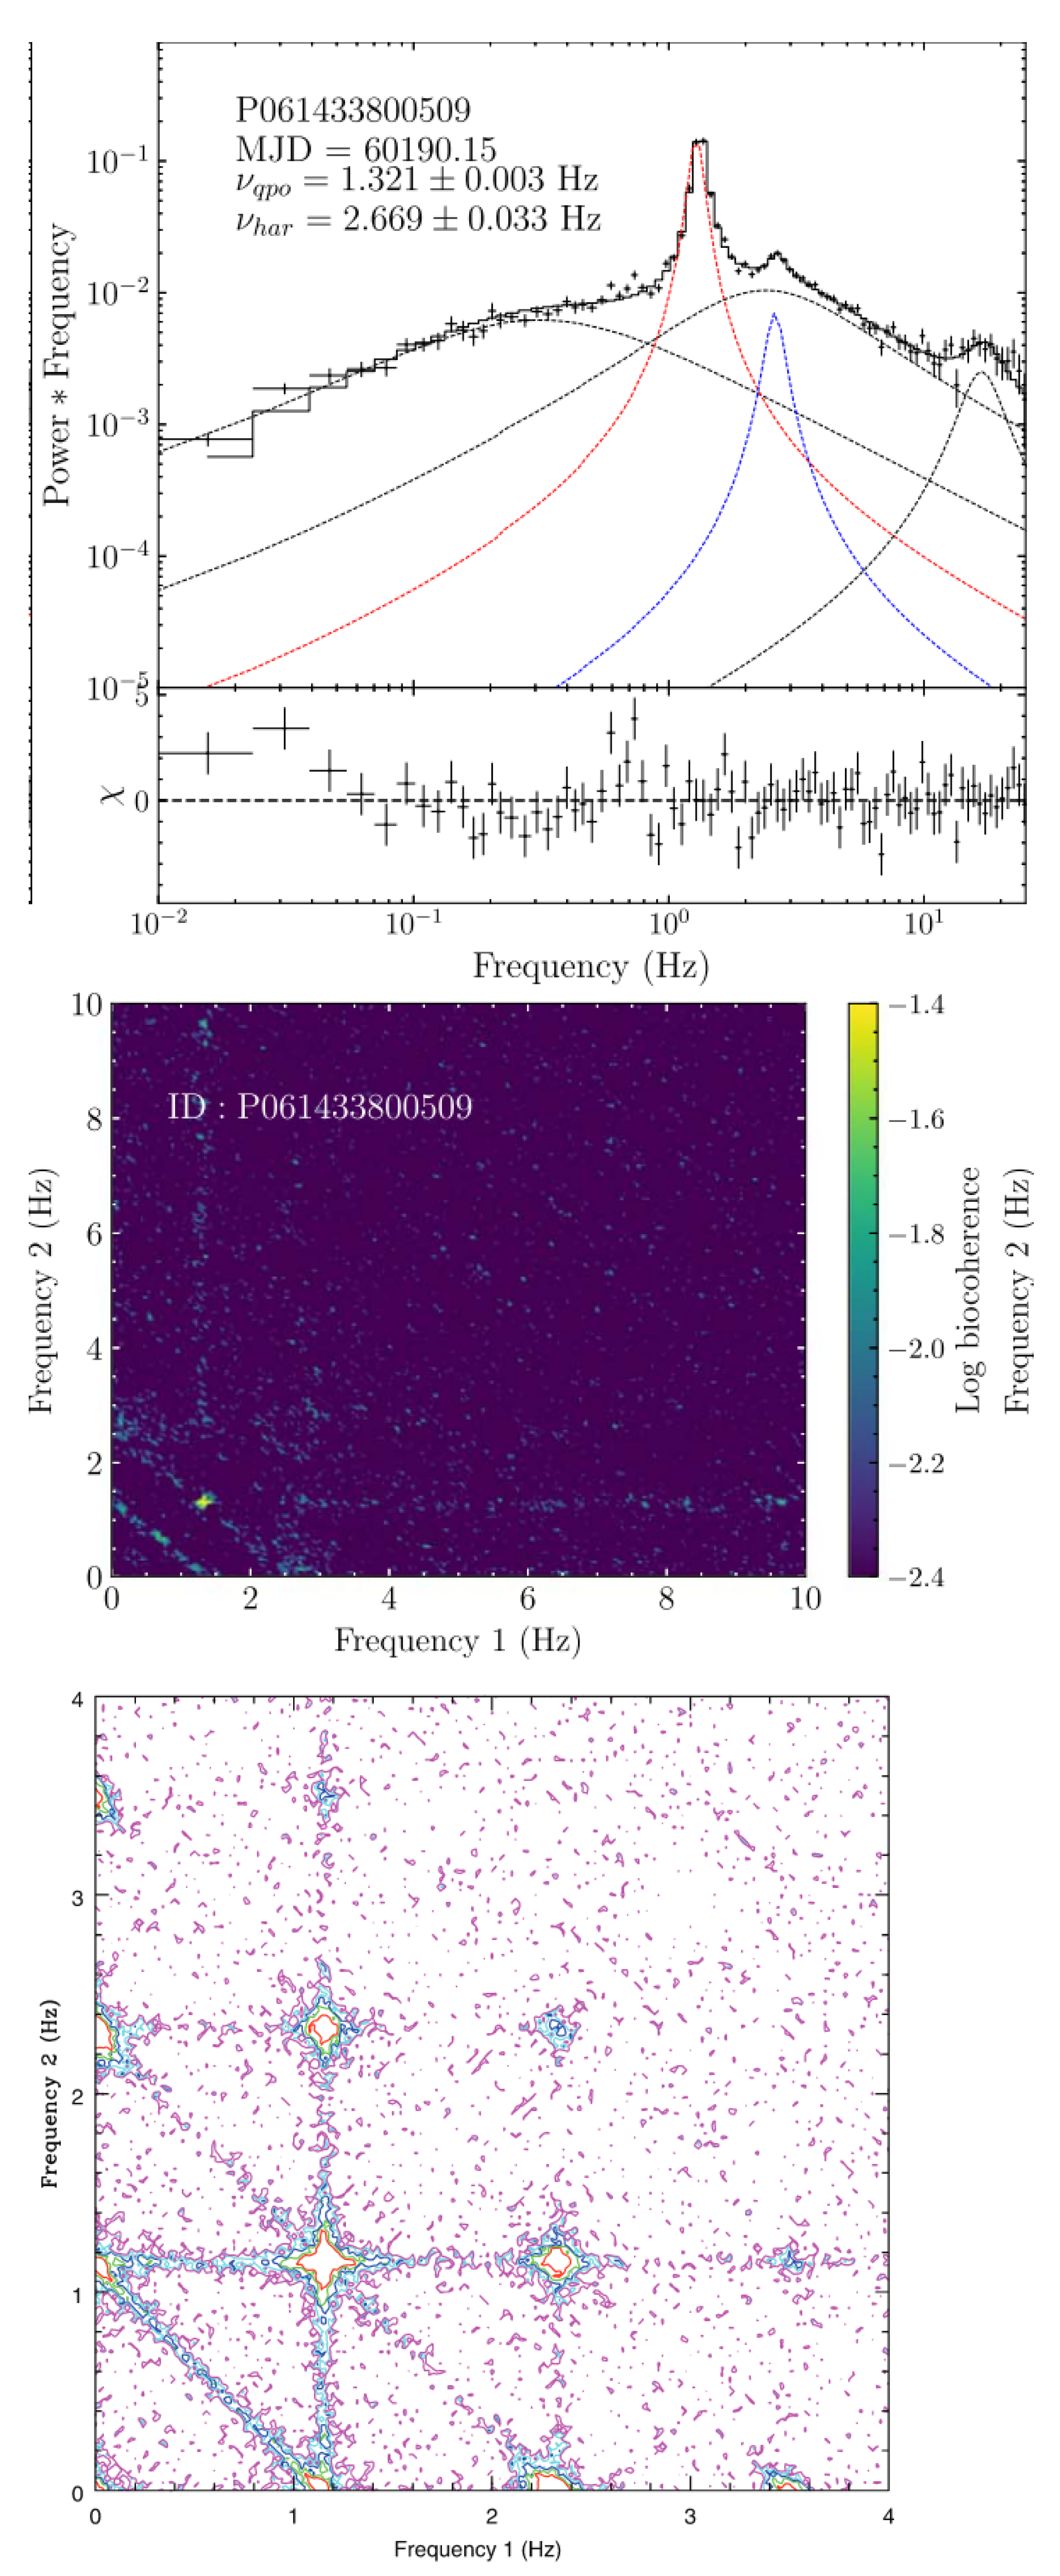
Bicoherence analysis revealed a transition from a “web” to a “hypotenuse” pattern in both the LE and HE bands. These patterns exhibit correlations along the f 1 = f 2 = f QPO axis, with the strength of the coupling varying with the count rate. Additionally, the diagonal structure at f 1 + f 2 = f QPO becomes increasingly prominent at higher energies. A particularly novel discovery was reported in the ME band (10–20 keV), where a new bicoherence pattern emerged [123]. In this energy range, a prominent diagonal structure appeared at f 1 + f 2 = f har (the harmonic frequency), which was absent in other bands (see the top and middle panels of Figure 30). The authors referred to this distinct feature as the “parallel” pattern, emphasizing its energy-dependent nature and its implications for phase coupling mechanisms in QPOs.
Notably, Maccarone et al. [119] previously analyzed RXTE observations of GRS 1915+105 and demonstrated that QPOs are coupled to broadband noise (BBN) components rather than arising independently. Through simulations of light curves under various physical scenarios involving correlated QPO and noise signals, they reproduced multiple bicoherence patterns. When comparing the ME-band bicoherence results from Zhu et al. [123] to those simulations, a clear consistency emerged. Specifically, the “parallel” pattern closely resembles the simulated outcomes under conditions of low variability amplitude and absence of reintroduced broadband noise (see the bottom of Figure 30). When the noise component is re-added, the pattern transforms into the more commonly observed “web” structure. These findings suggest that the observed ME-band bicoherence pattern reflects a physical regime similar to that described in the reservoir model proposed by Maccarone et al. [119], characterized by weak or negligible coupling between the QPO and noise components.

7. Conclusions and Future Outlook

In summary, this review has presented four widely used time-series analysis techniques—traditional Fourier analysis, wavelet analysis, the HHT, and bicoherence analysis—and their applications in studying quasi-periodic oscillations (QPOs) in black hole X-ray binaries. Each method offers unique strengths: traditional Fourier analysis provides a foundational understanding of spectral components; wavelet analysis excels at capturing transient and evolving features; HHT enables high-resolution tracking of nonstationary, nonlinear oscillations; and bicoherence analysis reveals nonlinear coupling and phase relationships. These techniques complement one another and collectively expand our ability to probe the complex dynamics of accretion flows. As they are increasingly applied to high-quality data from missions such as Insight-HXMT and NICER, they promise to play a central role in refining QPO classification, testing theoretical models, and deepening our understanding of black hole accretion physics. For clarity, Table 1 provides a comparative overview of their advantages, main applications, and defining features.
Based on Insight-HXMT wideband X-ray observations in last seven years, these methods have led to a series of important new scientific results. For example, in MAXI J1820+070, Insight-HXMT revealed the highest-energy QPOs detected to date [65], along with a pronounced energy-dependent evolution of the broadband noise [89]. Wavelet analysis has further shown that different types of QPOs display distinctly different evolutionary behaviors in terms of the S-factor, thereby providing a new diagnostic criterion for QPO classification [102]. In addition, phase-resolved spectral analysis based on the HHT has proven effective in uncovering the modulation of various physical parameters, offering fresh perspectives for testing theoretical models [41]. Moreover, the discovery of novel bicoherence patterns through bicoherence analysis points to complex couplings among timing signals, shedding new light on the intricate variability mechanisms in accreting systems [123].
Recently, some novel methods have been developed to study the properties and new features in QPOs. Méndez et al. [124] proposed a novel method to measure the phase lags of weak variability components in low-mass X-ray binaries, including both neutron-star and black-hole systems. Their technique assumes that the power spectra (PS) and cross-spectra (CS) consist of several components that are coherent across energy bands but mutually incoherent. By simultaneously fitting the power spectrum and the real and imaginary parts of the CS with multiple Lorentzian components, they were able to detect new variability features not evident in the PS alone—particularly components with large imaginary parts and small real parts in the CS. One of their key results demonstrated that the frequency of type-C QPOs in GRS 1915+105 is in fact energy-independent, contrary to earlier claims [125]. They attributed the previously reported energy dependence to the presence of an additional QPO component with a slightly higher frequency and a more rapid increase in rms amplitude with energy than the main QPO. These results indicate that, similar to the PS, the CS can also be decomposed into multiple Lorentzian components. This suggests that the frequency-dependent transfer function of these systems may consist of several discrete responses, each operating over distinct timescales, challenging models that invoke a single broadband transfer function to explain the observed lags. Subsequent studies have applied this method and obtained numerous new results [126,127,128].
Fogantini et al. [129] studied all NICER observations of Cygnus X-1 to search for new variability components not visible in the power spectrum. By fitting both the power spectrum and the real and imaginary parts of the cross spectrum between soft (0.3–2 keV) and hard (2–12 keV) energy bands using a multi-Lorentzian model, they detected a narrow component with low rms but large phase lag—referred to as the “imaginary QPO.” This feature shows a strong dip in intrinsic coherence and a sharp rise in phase lag at a frequency that increases with the spectral slope. The results suggest that this component behaves like a type-C QPO, marking the first such detection in Cygnus X-1.
Looking ahead, applying this method to Insight-HXMT observational data—leveraging its broad energy coverage and strengths in timing analysis—promises to yield new insights across a wider range of sources. Meanwhile, the recently operational Einstein Probe [130] has already uncovered many previously unseen phenomena [131,132,133,134]. Employing advanced timing analysis techniques on these novel discoveries will greatly enhance our understanding of the underlying physical mechanisms driving diverse astrophysical phenomena in the universe.

Funding

This work is supported by the National Key Research and Development Program of China (grant No. 2021YFA0718503), the NSFC (12133007).

Data Availability Statement

No new data were created or analyzed in this study. Data sharing is not applicable to this article.

Conflicts of Interest

The authors declare no conflicts of interest.

Note

1

References

  1. Remillard, R.A.; McClintock, J.E. X-ray properties of black-hole binaries. Annu. Rev. Astron. Astrophys. 2006, 44, 49–92. [Google Scholar] [CrossRef]
  2. Esin, A.A.; McClintock, J.E.; Narayan, R. Advection-dominated accretion and the spectral states of black hole X-ray binaries: Application to Nova Muscae 1991. Astrophys. J. 1997, 489, 865. [Google Scholar] [CrossRef]
  3. Fender, R.P.; Belloni, T.M.; Gallo, E. Towards a unified model for black hole X-ray binary jets. Mon. Not. R. Astron. Soc. 2004, 355, 1105–1118. [Google Scholar] [CrossRef]
  4. Basak, R.; Zdziarski, A.A. Spectral analysis of the XMM–Newton data of GX 339–4 in the low/hard state: Disc truncation and reflection. Mon. Not. R. Astron. Soc. 2016, 458, 2199–2214. [Google Scholar] [CrossRef]
  5. Sharma, R.; Jaleel, A.; Jain, C.; Pandey, J.C.; Paul, B.; Dutta, A. Spectral properties of MXB 1658–298 in the low/hard and high/soft state. Mon. Not. R. Astron. Soc. 2018, 481, 5560–5569. [Google Scholar] [CrossRef]
  6. Belloni, T.; Motta, S.; Bambi, C. Astrophysics of Black Holes: From Fundamental Aspects to Latest Developments; Astrophysics and Space Science Library; Springer: Berlin/Heidelberg, Germany, 2016; Volume 440. [Google Scholar]
  7. Wang, W. Observations of fast radio variations in microquasars by FAST. Chin. Phys. Lett. 2024, 41, 119701. [Google Scholar] [CrossRef]
  8. Casella, P.; Belloni, T.; Stella, L. The ABC of low-frequency quasi-periodic oscillations in black hole candidates: Analogies with Z sources. Astrophys. J. 2005, 629, 403. [Google Scholar] [CrossRef]
  9. Motta, S.; Casella, P.; Henze, M.; Muñoz-Darias, T.; Sanna, A.; Fender, R.; Belloni, T. Geometrical constraints on the origin of timing signals from black holes. Mon. Not. R. Astron. Soc. 2015, 447, 2059–2072. [Google Scholar] [CrossRef]
  10. Motta, S.E. Quasi periodic oscillations in black hole binaries. Astron. Nachrichten 2016, 337, 398–403. [Google Scholar] [CrossRef]
  11. Ingram, A.R.; Motta, S.E. A review of quasi-periodic oscillations from black hole X-ray binaries: Observation and theory. New Astron. Rev. 2019, 85, 101524. [Google Scholar] [CrossRef]
  12. Stella, L.; Vietri, M. Lense-Thirring precession and quasi-periodic oscillations in low-mass X-ray binaries. Astrophys. J. 1997, 492, L59. [Google Scholar] [CrossRef]
  13. Stella, L.; Vietri, M.; Morsink, S.M. Correlations in the quasi-periodic oscillation frequencies of low-mass X-ray binaries and the relativistic precession model. Astrophys. J. 1999, 524, L63. [Google Scholar] [CrossRef]
  14. Schnittman, J.D.; Homan, J.; Miller, J.M. A precessing ring model for low-frequency quasi-periodic oscillations. Astrophys. J. 2006, 642, 420. [Google Scholar] [CrossRef]
  15. Ingram, A.; Done, C.; Fragile, P.C. Low-frequency quasi-periodic oscillations spectra and Lense–Thirring precession. Mon. Not. R. Astron. Soc. Lett. 2009, 397, L101–L105. [Google Scholar] [CrossRef]
  16. Ingram, A.; Done, C. A physical model for the continuum variability and quasi-periodic oscillation in accreting black holes. Mon. Not. R. Astron. Soc. 2011, 415, 2323–2335. [Google Scholar] [CrossRef]
  17. Torrence, C.; Compo, G.P. A practical guide to wavelet analysis. Bull. Am. Meteorol. Soc. 1998, 79, 61–78. [Google Scholar] [CrossRef]
  18. Gendreau, K.C.; Arzoumanian, Z.; Adkins, P.W.; Albert, C.L.; Anders, J.F.; Aylward, A.T.; Baker, C.L.; Balsamo, E.R.; Bamford, W.A.; Benegalrao, S.S.; et al. The neutron star interior composition explorer (NICER): Design and development. In Proceedings of the Space Telescopes and Instrumentation 2016: Ultraviolet to Gamma Ray, Edinburgh, UK, 26 June–1 July 2016; SPIE: Bellingham, WA, USA, 2016; Volume 9905, pp. 420–435. [Google Scholar]
  19. Chen, X.; Wang, W. Different behaviors of wavelet results for type-B and type-C QPOs of MAXI J1535-571 based on NICER data. J. High Energy Astrophys. 2024, 41, 89–96. [Google Scholar] [CrossRef]
  20. Huang, N.E.; Shen, Z.; Long, S.R.; Wu, M.C.; Shih, H.H.; Zheng, Q.; Yen, N.C.; Tung, C.C.; Liu, H.H. The empirical mode decomposition and the Hilbert spectrum for nonlinear and non-stationary time series analysis. Proc. R. Soc. Lond. Ser. A Math. Phys. Eng. Sci. 1998, 454, 903–995. [Google Scholar] [CrossRef]
  21. Huang, N.E. Hilbert-Huang Transform and Its Applications; World Scientific: Singapore, 2014; Volume 16. [Google Scholar]
  22. Rilling, G.; Flandrin, P.; Goncalves, P. On empirical mode decomposition and its algorithms. In Proceedings of the IEEE-EURASIP Workshop on Nonlinear Signal and Image Processing, NSIP-03, Grado, Italy, 8–11 June 2003. [Google Scholar]
  23. Su, Y.H.; Chou, Y.; Hu, C.P.; Yang, T.C. Characterizing the Intermittency of the 4-Hz Quasi-Periodic Oscillation in XTE J1550-564 Using the Hilbert-Huang Transform. Astrophys. J. 2015, 815, 74. [Google Scholar] [CrossRef]
  24. Kim, Y.C.; Powers, E.J. Digital bispectral analysis and its applications to nonlinear wave interactions. IEEE Trans. Plasma Sci. 1979, 7, 120–131. [Google Scholar] [CrossRef]
  25. Fackrell, J.; McLaughlin, S. Detecting nonlinearities in speech sounds using the bicoherence. Proc.-Inst. Acoust. 1996, 18, 123–130. [Google Scholar]
  26. Maccarone, T.J.; Coppi, P.S. Higher order variability properties of accreting black holes. Mon. Not. R. Astron. Soc. 2002, 336, 817–825. [Google Scholar] [CrossRef]
  27. Belloni, T.; Psaltis, D.; van der Klis, M. A unified description of the timing features of accreting X-ray binaries. Astrophys. J. 2002, 572, 392. [Google Scholar] [CrossRef]
  28. Uttley, P.; McHardy, I.; Vaughan, S. Non-linear X-ray variability in X-ray binaries and active galaxies. Mon. Not. R. Astron. Soc. 2005, 359, 345–362. [Google Scholar] [CrossRef]
  29. Ingram, A.; Done, C. Modelling variability in black hole binaries: Linking simulations to observations. Mon. Not. R. Astron. Soc. 2012, 419, 2369–2378. [Google Scholar] [CrossRef]
  30. Mushtukov, A.A.; Lipunova, G.V.; Ingram, A.; Tsygankov, S.S.; Mönkkönen, J.; van der Klis, M. Broad-band aperiodic variability in X-ray pulsars: Accretion rate fluctuations propagating under the influence of viscous diffusion. Mon. Not. R. Astron. Soc. 2019, 486, 4061–4074. [Google Scholar] [CrossRef]
  31. Rapisarda, S.; Ingram, A.; van der Klis, M. Modelling hard and soft states of Cygnus X-1 with propagating mass accretion rate fluctuations. Mon. Not. R. Astron. Soc. 2017, 472, 3821–3832. [Google Scholar] [CrossRef]
  32. Turner, S.G.; Reynolds, C.S. Investigating the theory of propagating fluctuations with numerical models of stochastic accretion discs. Mon. Not. R. Astron. Soc. 2021, 504, 469–486. [Google Scholar] [CrossRef]
  33. You, B.; Cao, X.; Yan, Z.; Hameury, J.M.; Czerny, B.; Wu, Y.; Xia, T.; Sikora, M.; Zhang, S.N.; Du, P.; et al. Observations of a black hole X-Ray binary indicate formation of a magnetically arrested disk. Science 2023, 381, 961–964. [Google Scholar] [CrossRef] [PubMed]
  34. Peng, J.Q.; Zhang, S.; Wang, P.J.; Zhang, S.N.; Kong, L.D.; Chen, Y.P.; Shui, Q.C.; Ji, L.; Qu, J.L.; Tao, L.; et al. Back to Business: SLX 1746–331 after 13 Years of Silence. Astrophys. J. 2023, 955, 96. [Google Scholar] [CrossRef]
  35. Peng, J.Q.; Zhang, S.; Shui, Q.C.; Zhang, S.N.; Chen, Y.P.; Kong, L.D.; Yu, Z.L.; Ji, L.; Wang, P.J.; Ge, M.Y.; et al. NICER, NuSTAR, and Insight-HXMT Views to Black Hole X-Ray Binary SLX 1746–331. Astrophys. J. Lett. 2024, 965, L22. [Google Scholar] [CrossRef]
  36. Ma, R.; Soria, R.; Tao, L.; Zhang, W.; Qu, J.; Zhang, S.; Zhang, L.; Qiao, E.; Zhao, S.; Ge, M.; et al. The peculiar spectral evolution of the new X-ray transient MAXI J0637–430. Mon. Not. R. Astron. Soc. 2022, 514, 5238–5265. [Google Scholar] [CrossRef]
  37. Song, Y.; Jia, N.; Yang, J.; Feng, Y.; Gou, L.; Lu, T. The spin measurement of MAXI J1348-630 using the Insight-HXMT data. Mon. Not. R. Astron. Soc. 2023, 526, 6041–6051. [Google Scholar] [CrossRef]
  38. Wu, H.; Wang, W.; Sai, N.; Zhu, H.; Chen, J. A moderate spin for the black hole in X-ray binary MAXI J1348-630 revealed by Insight-HXMT. Mon. Not. R. Astron. Soc. 2023, 522, 4323–4331. [Google Scholar] [CrossRef]
  39. Chen, J.; Wang, W. The spin of a stellar black hole 4U 1543-47 determined by Insight-HXMT. Mon. Not. R. Astron. Soc. 2024, 527, 238–248. [Google Scholar] [CrossRef]
  40. Yorgancioglu, E.; Bu, Q.; Santangelo, A.; Tao, L.; Davis, S.; Vahdat, A.; Kong, L.; Piraino, S.; Zhou, M.; Zhang, S. Spin measurement of 4U 1543-47 with Insight-HXMT and NICER from its 2021 outburst-A test of accretion disk models at high luminosities. Astron. Astrophys. 2023, 677, A79. [Google Scholar] [CrossRef]
  41. Shui, Q.C.; Zhang, S.; Zhang, S.N.; Chen, Y.P.; Kong, L.D.; Wang, P.J.; Peng, J.Q.; Ji, L.; Santangelo, A.; Yin, H.X.; et al. A phase-resolved view of the low-frequency quasiperiodic oscillations from the black hole binary MAXI J1820+ 070. Astrophys. J. 2023, 957, 84. [Google Scholar] [CrossRef]
  42. Zhao, Q.C.; Tao, L.; Li, H.C.; Zhang, S.N.; Feng, H.; Ge, M.Y.; Ji, L.; Wang, Y.N.; Huang, Y.; Ma, X.; et al. The first polarimetric view on quasiperiodic oscillations in a black hole X-ray binary. Astrophys. J. Lett. 2024, 961, L42. [Google Scholar] [CrossRef]
  43. Zhang, S.; Zhang, S.; Lu, F.; Li, T.; Song, L.; Xu, Y.; Wang, H.; Qu, J.; Liu, C.; Chen, Y.; et al. The insight-HXMT mission and its recent progresses. In Proceedings of the Space Telescopes and Instrumentation 2018: Ultraviolet to Gamma Ray, Austin, TX, USA, 10–15 June 2018; SPIE: Bellingham, WA, USA, 2018; Volume 10699, pp. 434–455. [Google Scholar]
  44. Zhang, S.N.; Li, T.; Lu, F.; Song, L.; Xu, Y.; Liu, C.; Chen, Y.; Cao, X.; Bu, Q.; Chang, Z.; et al. Overview to the hard X-ray modulation telescope (Insight-HXMT) satellite. Sci. China Phys. Mech. Astron. 2020, 63, 249502. [Google Scholar] [CrossRef]
  45. Liu, C.; Zhang, Y.; Li, X.; Lu, X.; Chang, Z.; Li, Z.; Zhang, A.; Jin, Y.; Yu, H.; Zhang, Z.; et al. The High Energy X-ray telescope (HE) onboard the Insight-HXMT astronomy satellite. Sci. China Phys. Mech. Astron. 2020, 63, 249503. [Google Scholar] [CrossRef]
  46. Cao, X.; Jiang, W.; Meng, B.; Zhang, W.; Luo, T.; Yang, S.; Zhang, C.; Gu, Y.; Sun, L.; Liu, X.; et al. The Medium Energy X-ray telescope (ME) onboard the Insight-HXMT astronomy satellite. Sci. China Phys. Mech. Astron. 2020, 63, 249504. [Google Scholar] [CrossRef]
  47. Chen, Y.; Cui, W.; Li, W.; Wang, J.; Xu, Y.; Lu, F.; Wang, Y.; Chen, T.; Han, D.; Hu, W.; et al. The Low Energy X-ray telescope (LE) onboard the Insight-HXMT astronomy satellite. Sci. China Phys. Mech. Astron. 2020, 63, 249505. [Google Scholar] [CrossRef]
  48. Luo, Q.; Liao, J.Y.; Li, X.F.; Li, G.; Zhang, J.; Liu, C.Z.; Li, X.B.; Zhu, Y.; Li, C.K.; Huang, Y.; et al. Calibration of the instrumental response of Insight-HXMT/HE CsI detectors for gamma-ray monitoring. J. High Energy Astrophys. 2020, 27, 1–13. [Google Scholar] [CrossRef]
  49. Li, X.; Li, X.; Tan, Y.; Yang, Y.; Ge, M.; Zhang, J.; Tuo, Y.; Wu, B.; Liao, J.; Zhang, Y.; et al. In-flight calibration of the Insight-Hard X-ray Modulation Telescope. J. High Energy Astrophys. 2020, 27, 64–76. [Google Scholar] [CrossRef]
  50. Tuo, Y.; Li, X.; Ge, M.; Nie, J.; Song, L.; Xu, Y.; Zheng, S.; Lu, F.; Zhang, S.N.; Liu, C.; et al. In-orbit timing calibration of the insight-hard X-ray modulation telescope. Astrophys. J. Suppl. Ser. 2022, 259, 14. [Google Scholar] [CrossRef]
  51. Shu, Z.; Shuang-Nan, Z. Insight-HXMT Research Progress Since 2023. Chin. J. Space Sci. 2024, 44, 643–667. [Google Scholar] [CrossRef]
  52. Liao, J.Y.; Zhang, S.; Lu, X.F.; Zhang, J.; Li, G.; Chang, Z.; Chen, Y.P.; Ge, M.Y.; Guo, C.C.; Huang, R.; et al. Background model for the high-energy telescope of Insight-HXMT. J. High Energy Astrophys. 2020, 27, 14–23. [Google Scholar] [CrossRef]
  53. Guo, C.C.; Liao, J.Y.; Zhang, S.; Zhang, J.; Tan, Y.; Song, L.M.; Lu, F.J.; Cao, X.L.; Chang, Z.; Chen, Y.P.; et al. The background model of the medium energy X-ray telescope of Insight-HXMT. J. High Energy Astrophys. 2020, 27, 44–50. [Google Scholar] [CrossRef]
  54. Liao, J.Y.; Zhang, S.; Chen, Y.; Zhang, J.; Jin, J.; Chang, Z.; Chen, Y.P.; Ge, M.Y.; Guo, C.C.; Li, G.; et al. Background model for the low-energy telescope of Insight-HXMT. J. High Energy Astrophys. 2020, 27, 24–32. [Google Scholar] [CrossRef]
  55. Liao, J.Y.; Zhang, S.; Zhang, J.; Li, G.; Chang, Z.; Chen, Y.P.; Ge, M.Y.; Jin, J.; Lu, X.F.; You, Y.; et al. Five-year in-orbit background of Insight-HXMT. Radiat. Detect. Technol. Methods 2023, 7, 34–47. [Google Scholar] [CrossRef]
  56. Negoro, H.; Ishikawa, M.; Ueno, S.; Tomida, H.; Sugawara, Y.; Isobe, N.; Shimomukai, R.; Mihara, T.; Sugizaki, M.; Serino, M.; et al. MAXI/GSC discovery of a new hard X-ray transient MAXI J1535-571. Astron. Telegr. 2017, 10699, 1. [Google Scholar]
  57. Kennea, J.; Evans, P.; Beardmore, A.; Krimm, H.; Romano, P.; Yamaoka, K.; Serino, M.; Negoro, H. MAXI J1535-571: Swift detection and localization. Astron. Telegr. 2017, 10700, 1. [Google Scholar]
  58. Huang, Y.; Qu, J.; Zhang, S.; Bu, Q.; Chen, Y.; Tao, L.; Zhang, S.; Lu, F.; Li, T.; Song, L.; et al. INSIGHT-HXMT Observations of the New Black Hole Candidate MAXI J1535-571: Timing Analysis. Astrophys. J. 2018, 866, 122. [Google Scholar] [CrossRef]
  59. Miyamoto, S.; Kimura, K.; Kitamoto, S.; Dotani, T.; Ebisawa, K. X-ray variability of GX 339-4 in its very high state. Astrophys. J. Part 1 1991, 383, 784–807. [Google Scholar] [CrossRef]
  60. Van den Eijnden, J.; Ingram, A.; Uttley, P.; Motta, S.; Belloni, T.; Gardenier, D. Inclination dependence of QPO phase lags in black hole X-ray binaries. Mon. Not. R. Astron. Soc. 2017, 464, 2643–2659. [Google Scholar] [CrossRef]
  61. Xu, Y.; Harrison, F.A.; García, J.A.; Fabian, A.C.; Fürst, F.; Gandhi, P.; Grefenstette, B.W.; Madsen, K.K.; Miller, J.M.; Parker, M.L.; et al. Reflection spectra of the black hole binary candidate MAXI j1535-571 in the hard state observed by NuSTAR. Astrophys. J. Lett. 2018, 852, L34. [Google Scholar] [CrossRef]
  62. Wang, Y.; Ji, L.; Zhang, S.; Méndez, M.; Qu, J.; Maggi, P.; Ge, M.; Qiao, E.; Tao, L.; Zhang, S.; et al. The evolution of the broadband temporal features observed in the black-hole transient MAXI J1820+ 070 with insight-HXMT. Astrophys. J. 2020, 896, 33. [Google Scholar] [CrossRef]
  63. Liu, H.X.; Huang, Y.; Xiao, G.C.; Bu, Q.C.; Qu, J.L.; Zhang, S.; Zhang, S.N.; Jia, S.M.; Lu, F.J.; Ma, X.; et al. Timing analysis of the black hole candidate EXO 1846–031 with Insight-HXMT monitoring. Res. Astron. Astrophys. 2021, 21, 070. [Google Scholar] [CrossRef]
  64. Jin, Y.; Wang, W.; Chen, X.; Tian, P.; Liu, Q.; Zhang, P.; Wu, H.; Sai, N. Quasi-periodic Oscillations in GX 339-4 during the 2021 Outburst Observed with Insight-HXMT. Astrophys. J. 2023, 953, 33. [Google Scholar] [CrossRef] [PubMed]
  65. Ma, X.; Tao, L.; Zhang, S.N.; Zhang, L.; Bu, Q.C.; Ge, M.Y.; Chen, Y.P.; Qu, J.L.; Zhang, S.; Lu, F.J.; et al. Discovery of oscillations above 200 keV in a black hole X-ray binary with Insight-HXMT. Nat. Astron. 2021, 5, 94–102. [Google Scholar] [CrossRef]
  66. Ma, X.; Zhang, L.; Tao, L.; Bu, Q.; Qu, J.; Zhang, S.; Zhou, D.; Huang, Y.; Jia, S.; Song, L.; et al. A Detailed View of Low-frequency Quasi-periodic Oscillation in the Broadband 0.2–200 keV with Insight-HXMT and NICER. Astrophys. J. 2023, 948, 116. [Google Scholar] [CrossRef]
  67. Zhu, H.; Chen, X.; Wang, W. Timing analysis of the new black hole candidate MAXI J1803-298 with Insight–HXMT and NICER. Mon. Not. R. Astron. Soc. 2023, 523, 4394–4404. [Google Scholar] [CrossRef]
  68. Xu, Y.C.; Qu, J.L.; Méndez, M.; Ma, R.C.; Ji, L.; Zhang, L.; Huang, Y.; Bu, Q.C.; Song, L.M. Timing and Spectral Analysis of the Black Hole X-Ray Binary MAXI J1803-298 with Insight-HXMT Data. Res. Astron. Astrophys. 2024, 24, 065017. [Google Scholar] [CrossRef]
  69. Page, K.L.; Dichiara, S.; Gropp, J.D.; Krimm, H.A.; Parsotan, T.M.; Williams, M.A.; Neil Gehrels Swift Observatory Team. GRB 230824A: Swift detection of a burst. GCN 2023, 34537, 1. [Google Scholar]
  70. Negoro, H.; Serino, M.; Nakajima, M.; Kobayashi, K.; Tanaka, M.; Soejima, Y.; Kudo, Y.; Mihara, T.; Kawamuro, T.; Yamada, S.; et al. MAXI/GSC detection of a new hard X-ray transient Swift J1727.8-1613 (GRB 230824A). ATel 2023, 16205, 1. [Google Scholar]
  71. Castro-Tirado, A.; Sanchez-Ramirez, R.; Caballero-Garcia, M.; Perez-Garcia, I.; Fernandez-Garcia, E.; Guziy, S.; Hu, Y.D.; Blazek, M.; Hermelo, I.; Pinter, V.; et al. Optical spectroscopy of Swift J1727.8-1613 confirms a new low-mass X-ray binary hosting a black hole candidate. ATel 2023, 16208, 1. [Google Scholar]
  72. Miller-Jones, J.; Sivakoff, G.; Bahramian, A.; Russell, T. VLA radio detection of the new black hole X-ray binary candidate Swift J1727.8-1613. ATel 2023, 16211, 1. [Google Scholar]
  73. Sunyaev, R.; Mereminskiy, I.; Molkov, S.; Semena, A.; Arefiev, V.; Krivonos, R.; Levin, V.; Lutovinov, A.; Shtykovsky, A.; Tkachenko, A.Y. INTEGRAL and SRG/ART-XC observations of the rise of Swift J1727.8-1613. ATel 2023, 16217, 1. [Google Scholar]
  74. Palmer, D.M.; Parsotan, T.M. Swift J1727.8-1613 reaches 7.6 Crab with strong QPO in Hard X-rays. ATel 2023, 16215, 1. [Google Scholar]
  75. Sánchez, D.M.; Muñoz-Darias, T.; Padilla, M.A.; Casares, J.; Torres, M. Evidence for inflows and outflows in the nearby black hole transient Swift J1727.8-162. Astron. Astrophys. 2024, 682, L1. [Google Scholar] [CrossRef]
  76. Veledina, A.; Muleri, F.; Dovčiak, M.; Poutanen, J.; Ratheesh, A.; Capitanio, F.; Matt, G.; Soffitta, P.; Tennant, A.F.; Negro, M.; et al. Discovery of X-Ray Polarization from the Black Hole Transient Swift J1727.8-1613. ApJL 2023, 958, L16. [Google Scholar] [CrossRef]
  77. Ingram, A.; Bollemeijer, N.; Veledina, A.; Dovčiak, M.; Poutanen, J.; Egron, E.; Russell, T.D.; Trushkin, S.A.; Negro, M.; Ratheesh, A.; et al. Tracking the X-Ray Polarization of the Black Hole Transient Swift J1727.8-1613 during a State Transition. Astrophys. J. 2024, 968, 76. [Google Scholar] [CrossRef]
  78. Peng, J.Q.; Zhang, S.; Shui, Q.C.; Zhang, S.N.; Kong, L.D.; Chen, Y.P.; Wang, P.J.; Ji, L.; Qu, J.L.; Tao, L.; et al. NICER, NuSTAR, and Insight-HXMT Views to the Newly Discovered Black Hole X-Ray Binary Swift J1727.8-1613. Astrophys. J. Lett. 2024, 960, L17. [Google Scholar] [CrossRef]
  79. Yu, W.; Bu, Q.C.; Zhang, S.N.; Liu, H.X.; Zhang, L.; Ducci, L.; Tao, L.; Santangelo, A.; Doroshenko, V.; Huang, Y.; et al. Timing analysis of the newly discovered black hole candidate Swift J1727.8-1613 with Insight-HXMT. Mon. Not. R. Astron. Soc. 2024, 529, 4624–4632. [Google Scholar] [CrossRef]
  80. Psaltis, D.; Belloni, T.; van der Klis, M. Correlations in quasi-periodic oscillation and noise frequencies among neutron star and black hole X-ray binaries. Astrophys. J. 1999, 520, 262. [Google Scholar] [CrossRef]
  81. Zhu, H.; Wang, W. Energy Dependence of the Low-frequency Quasiperiodic Oscillations in Swift J1727.8-1613. Astrophys. J. 2024, 968, 106. [Google Scholar] [CrossRef]
  82. Yang, Z.X.; Zhang, L.; Zhang, S.N.; Tao, L.; Zhang, S.; Ma, R.; Bu, Q.C.; Huang, Y.; Liu, H.X.; Yu, W.; et al. A timing view of the additional high-energy spectral component discovered in the black hole candidate Swift J1727.8-1613. Astrophys. J. Lett. 2024, 970, L33. [Google Scholar] [CrossRef]
  83. Stiele, H.; Yu, W. Energy dependence of the band-limited noise in black hole X-ray binaries. Mon. Not. R. Astron. Soc. 2015, 452, 3666–3678. [Google Scholar] [CrossRef]
  84. Belloni, T.; Motta, S.; Munoz-Darias, T. Black hole transients. Bull. Astr. Soc. India 2011, 39, 409. [Google Scholar]
  85. Yu, W.; Zhang, W. Energy-dependent Power Spectral States and Origin of Aperiodic Variability in Black Hole Binaries. Astrophys. J. 2013, 770, 135. [Google Scholar] [CrossRef]
  86. Stiele, H.; Yu, W. Detection of distinct power spectra in soft and hard X-ray bands in the hard state of GRS 1915+ 105. Mon. Not. R. Astron. Soc. 2014, 441, 1177–1185. [Google Scholar] [CrossRef]
  87. Yang, Z.X.; Zhang, L.; Bu, Q.C.; Huang, Y.; Liu, H.X.; Yu, W.; Wang, P.; Tao, L.; Qu, J.; Zhang, S.; et al. The accretion flow geometry of MAXI J1820+ 070 through broadband noise research with insight hard X-ray modulation telescope. Astrophys. J. 2022, 932, 7. [Google Scholar] [CrossRef]
  88. Gao, C.; Yan, Z.; Yu, W. Low-frequency quasi-periodic oscillation in MAXI J1820+ 070: Revealing distinct Compton and reflection contributions. Mon. Not. R. Astron. Soc. 2023, 520, 5544–5551. [Google Scholar] [CrossRef]
  89. Gao, C.; Yu, W.; Yan, Z. On the Broadening of the Characteristic Frequency Range towards Higher Photon Energies in the X-ray Variability of the Black Hole Transient MAXI J1820+ 070. arXiv 2024, arXiv:2409.06414. [Google Scholar] [CrossRef]
  90. Jin, Y.J.; Chen, X.; Zhu, H.F.; Jiang, Z.J.; Wang, W. Broad-band noises in GX 339-4 during the 2021 outburst observed with Insight-HXMT and NICER. Astron. Astrophys. 2025, 697, A120. [Google Scholar] [CrossRef]
  91. Done, C.; Gierliński, M.; Kubota, A. Modelling the behaviour of accretion flows in X-ray binaries: Everything you always wanted to know about accretion but were afraid to ask. Astron. Astrophys. Rev. 2007, 15, 1–66. [Google Scholar] [CrossRef]
  92. Kato, S.; Fukue, J.; Mineshige, S. Black-Hole Accretion Disks: Towards a New Paradigm; Kyoto University Press: Kyoto, Japan, 2008. [Google Scholar]
  93. Kawamura, T.; Axelsson, M.; Done, C.; Takahashi, T. A full spectral-timing model to map the accretion flow in black hole binaries: The low/hard state of MAXI J1820+ 070. Mon. Not. R. Astron. Soc. 2022, 511, 536–552. [Google Scholar] [CrossRef]
  94. Xu, Y.; Harrison, F.A.; Tomsick, J.A.; Barret, D.; Gandhi, P.; García, J.A.; Miller, J.M.; Uttley, P.; Walton, D.J. Broadband X-Ray Spectral and Timing Analyses of the Black Hole Binary Candidate Swift J1658.2-4242: Rapid Flux Variation and the Turn-on of a Transient QPO. Astrophys. J. 2019, 879, 93. [Google Scholar] [CrossRef]
  95. Sriram, K.; Rao, A.; Choi, C. Study of a sudden QPO transition event in the black hole source XTE J1550-564. Astrophys. J. 2016, 823, 67. [Google Scholar] [CrossRef]
  96. Zhang, L.; Altamirano, D.; Uttley, P.; García, F.; Méndez, M.; Homan, J.; Steiner, J.; Alabarta, K.; Buisson, D.; Remillard, R.; et al. NICER uncovers the transient nature of the type-B quasi-periodic oscillation in the black hole candidate MAXI J1348-630. Mon. Not. R. Astron. Soc. 2021, 505, 3823–3843. [Google Scholar] [CrossRef]
  97. Sriram, K.; Harikrishna, S.; Choi, C. Spectro-temporal Studies of Rapid Transition of the Quasi-periodic Oscillations in the Black Hole Source H1743-322. Astrophys. J. 2021, 911, 127. [Google Scholar] [CrossRef]
  98. Ding, Y.; Wang, W.; Zhang, P.; Bu, Q.; Cai, C.; Cao, X.; Zhi, C.; Chen, L.; Chen, T.; Chen, Y.; et al. QPOs and orbital elements of X-ray binary 4U 0115+ 63 during the 2017 outburst observed by Insight-HXMT. Mon. Not. R. Astron. Soc. 2021, 503, 6045–6058. [Google Scholar] [CrossRef]
  99. Chen, X.; Wang, W.; You, B.; Tian, P.; Liu, Q.; Zhang, P.; Ding, Y.; Qu, J.; Zhang, S.; Song, L.; et al. Wavelet analysis of MAXI J1535-571 with Insight-HXMT. Mon. Not. R. Astron. Soc. 2022, 513, 4875–4886. [Google Scholar] [CrossRef]
  100. Tian, P.; Zhang, P.; Wang, W.; Wang, P.; Sun, X.; Liu, J.; Zhang, B.; Dai, Z.; Yuan, F.; Zhang, S.; et al. Subsecond periodic radio oscillations in a microquasar. Nature 2023, 621, 271–275. [Google Scholar] [CrossRef]
  101. Chen, X.; Wang, W.; Tian, P.; Zhang, P.; Liu, Q.; Wu, H.; Sai, N.; Huang, Y.; Song, L.; Qu, J.; et al. Wavelet analysis of the transient QPOs in MAXI J1535-571 with Insight-HXMT. Mon. Not. R. Astron. Soc. 2022, 517, 182–191. [Google Scholar] [CrossRef]
  102. Jin, Y.; Chen, X.; Zhu, H.; Jiang, Z.; Zhang, L.; Wang, W. Wavelet analysis of low-frequency quasi-periodic oscillations in MAXI J1803-298 observed with Insight-HXMT and NICER. Mon. Not. R. Astron. Soc. 2024, 535, 207–216. [Google Scholar] [CrossRef]
  103. García, F.; Méndez, M.; Karpouzas, K.; Belloni, T.; Zhang, L.; Altamirano, D. A two-component Comptonization model for the type-B QPO in MAXI J1348-630. Mon. Not. R. Astron. Soc. 2021, 501, 3173–3182. [Google Scholar] [CrossRef]
  104. Bellavita, C.; García, F.; Méndez, M.; Karpouzas, K. vKompth: A variable Comptonization model for low-frequency quasi-periodic oscillations in black hole X-ray binaries. Mon. Not. R. Astron. Soc. 2022, 515, 2099–2109. [Google Scholar] [CrossRef]
  105. Peirano, V.; Méndez, M.; García, F.; Belloni, T. Dual-corona Comptonization model for the type-b quasi-periodic oscillations in GX 339-4. Mon. Not. R. Astron. Soc. 2023, 519, 1336–1348. [Google Scholar] [CrossRef]
  106. Wang, W.; Chen, J.; Tian, P.; Ho, L.C.; Sun, X.; Wang, P.; Zhang, B.; Zheng, Z.; Chen, X.; Zhang, P.; et al. Quasi-periodic oscillations of GHz-band polarization in a black hole. Nat. Commun. 2025, 16, 5139. [Google Scholar] [CrossRef]
  107. Hu, C.P.; Chou, Y.; Yang, T.C.; Su, Y.H. Tracking the Evolution of the Quasi-Periodic Oscillation in RE J1034+396 Using the Hilbert–Huang Transform. Astrophys. J. 2014, 788, 31. [Google Scholar]
  108. Hu, C.P.; Lin, L.C.C.; Pan, K.C.; Li, K.L.; Yen, C.C.; Kong, A.K.; Hui, C. A comprehensive analysis of the gravitational wave events with the stacked Hilbert–Huang transform: From compact binary coalescence to supernova. Astrophys. J. 2022, 935, 127. [Google Scholar] [CrossRef]
  109. Hsieh, H.E.; Chou, Y. Phase-resolved Analyses of Millihertz Quasi-periodic Oscillations in 4U 1636-53 using the Hilbert–Huang Transform. Astrophys. J. 2020, 900, 116. [Google Scholar] [CrossRef]
  110. Dai, X.; Kong, L.; Ji, L.; Zhou, M.; Shui, Q.; Wang, P.; Zhang, S.; Santangelo, A. Unveiling the rebrightening mechanism of GRS 1915+ 105: Insights from a change in the quasi-periodic oscillations and from a wind analysis. Astron. Astrophys. 2024, 692, A117. [Google Scholar] [CrossRef]
  111. Huang, N.E.; Wu, Z. A review on Hilbert-Huang transform: Method and its applications to geophysical studies. Rev. Geophys. 2008, 46, RG2006. [Google Scholar] [CrossRef]
  112. Yu, W.; Bu, Q.C.; Yang, Z.X.; Liu, H.X.; Zhang, L.; Huang, Y.; Zhou, D.K.; Qu, J.L.; Zhang, S.N.; Zhang, S.; et al. Hilbert–Huang Transform Analysis of Quasiperiodic Oscillations in MAXI J1820+ 070. Astrophys. J. 2023, 951, 130. [Google Scholar] [CrossRef]
  113. Spada, M.; Ghisellini, G.; Lazzati, D.; Celotti, A. Internal shocks in the jets of radio-loud quasars. Mon. Not. R. Astron. Soc. 2001, 325, 1559–1570. [Google Scholar] [CrossRef]
  114. Boettcher, M.; Dermer, C.D. Timing signatures of the internal-shock model for blazars. Astrophys. J. 2010, 711, 445. [Google Scholar] [CrossRef]
  115. Yang, W.; Wang, W.; Epili, P.R. Evidence for a Cyclotron Absorption Line and Spectral Transition in EXO 2030+ 375 during the 2021 Giant Outburst. Astrophys. J. 2024, 969, 107. [Google Scholar] [CrossRef]
  116. Liu, Q.; Wang, W.; Santangelo, A.; Kong, L.; Ji, L.; Ducci, L. Temporal and spectral variations of the X-ray pulsar Cen X-3 observed by NuSTAR. Astron. Astrophys. 2024, 687, A210. [Google Scholar] [CrossRef]
  117. Shui, Q.C.; Zhang, S.; Peng, J.Q.; Zhang, S.N.; Chen, Y.P.; Ji, L.; Kong, L.D.; Feng, H.; Yu, Z.L.; Wang, P.J.; et al. Phase-resolved Spectroscopy of Low-frequency Quasiperiodic Oscillations from the Newly Discovered Black Hole X-Ray Binary Swift J1727.8-1613. Astrophys. J. 2024, 973, 59. [Google Scholar] [CrossRef]
  118. Shui, Q.C.; Zhang, S.; Zhang, S.N.; Chen, Y.P.; Kong, L.D.; Peng, J.Q.; Ji, L.; Wang, P.J.; Chang, Z.; Zhuo, L.Y.; et al. Recovery of High-energy Low-frequency Quasiperiodic Oscillations from Black Hole X-Ray Binary MAXI J1535-571 with a Hilbert–Huang Transform Method. Astrophys. J. Lett. 2024, 965, L7. [Google Scholar] [CrossRef]
  119. Maccarone, T.J.; Uttley, P.; Van Der Klis, M.; Wijnands, R.A.; Coppi, P.S. Coupling between QPOs and broad-band noise components in GRS 1915+ 105. Mon. Not. R. Astron. Soc. 2011, 413, 1819–1827. [Google Scholar] [CrossRef][Green Version]
  120. Arur, K.; Maccarone, T. Non-linear variability of quasi-periodic oscillations in GX 339-4. Mon. Not. R. Astron. Soc. 2019, 486, 3451–3458. [Google Scholar][Green Version]
  121. Ding, Q.; Ji, L.; Bu, Q.C.; Dong, T.; Chang, J. Nonlinear variability observed with Insight-HXMT in MAXI J1820+ 070 and MAXI J1535-571. Res. Astron. Astrophys. 2023, 23, 085024. [Google Scholar] [CrossRef]
  122. Zhu, Z.; Chen, X.; Wang, W. The bicoherence study of quasi-periodic oscillations in MAXI J1535-571. Mon. Not. R. Astron. Soc. 2024, 529, 4602–4610. [Google Scholar] [CrossRef]
  123. Zhu, H.; Wang, W.; Zhu, Z. The Bicoherence Analysis of Type-C Quasiperiodic Oscillations in Swift J1727.8-1613. Astrophys. J. 2024, 974, 303. [Google Scholar] [CrossRef]
  124. Méndez, M.; Peirano, V.; García, F.; Belloni, T.; Altamirano, D.; Alabarta, K. Unveiling hidden variability components in accreting X-ray binaries using both the Fourier power and cross-spectra. Mon. Not. R. Astron. Soc. 2024, 527, 9405–9430. [Google Scholar] [CrossRef]
  125. Qu, J.; Lu, F.; Lu, Y.; Song, L.; Zhang, S.; Ding, G.; Wang, J. The energy dependence of the centroid frequency and phase lag of the quasi-periodic oscillations in GRS 1915+ 105. Astrophys. J. 2010, 710, 836. [Google Scholar] [CrossRef]
  126. Lin, Z.; Wang, Y.; del Palacio, S.; Méndez, M.; Zhang, S.N.; Russell, T.D.; Ji, L.; Zhang, J.; Zhang, L.; Altamirano, D.; et al. Unraveling the Hybrid Origins of the X-Ray Nonthermal Emission from IGR J17091-3624. Astrophys. J. 2024, 974, 79. [Google Scholar] [CrossRef]
  127. Bellavita, C.; Méndez, M.; García, F.; Ma, R.; König, O. The nature of an imaginary quasi-periodic oscillation in the soft-to-hard transition of MAXI J1820+ 070. Astron. Astrophys. 2025, 696, A128. [Google Scholar] [CrossRef]
  128. Jin, P.; Méndez, M.; García, F.; Altamirano, D.; Zhang, G.; Rout, S.K. Timing analysis of the black-hole candidate Swift J1727.8-1613: Detection of a dip-like feature in the high-energy cross spectrum. arXiv 2025, arXiv:2504.20717. [Google Scholar] [CrossRef]
  129. Fogantini, F.A.; García, F.; Méndez, M.; König, O.; Wilms, J. A hidden quasi-periodic oscillation in Cygnus X-1 revealed by NICER. Astron. Astrophys. 2025, 696, A237. [Google Scholar] [CrossRef]
  130. Yuan, W.; Zhang, C.; Chen, Y.; Ling, Z. The Einstein probe mission. In Handbook of X-Ray and Gamma-Ray Astrophysics; Springer: Berlin/Heidelberg, Germany, 2022; pp. 1–30. [Google Scholar]
  131. Zhang, W.; Yuan, W.; Ling, Z.; Chen, Y.; Rea, N.; Rau, A.; Cai, Z.; Cheng, H.; Zelati, F.C.; Dai, L.; et al. Einstein Probe discovery of EP240408a: A peculiar X-ray transient with an intermediate timescale. Sci. China Phys. Mech. Astron. 2025, 68, 219511. [Google Scholar] [CrossRef]
  132. van Dalen, J.N.; Levan, A.J.; Jonker, P.G.; Malesani, D.B.; Izzo, L.; Sarin, N.; Quirola-Vásquez, J.; Sánchez, D.M.; de Ugarte Postigo, A.; van Hoof, A.P.; et al. The Einstein Probe Transient EP240414a: Linking fast X-Ray transients, gamma-ray bursts, and luminous fast blue optical transients. Astrophys. J. Lett. 2025, 982, L47. [Google Scholar] [CrossRef]
  133. Marino, A.; Yang, H.; Zelati, F.C.; Rea, N.; Guillot, S.; Jaisawal, G.; Maitra, C.; Ness, J.U.; Haberl, F.; Kuulkers, E.; et al. Einstein Probe Discovery of EP J005245. 1-722843: A Rare Be–White Dwarf Binary in the Small Magellanic Cloud? Astrophys. J. Lett. 2025, 980, L36. [Google Scholar] [CrossRef]
  134. Liu, Y.; Sun, H.; Xu, D.; Svinkin, D.; Delaunay, J.; Tanvir, N.; Gao, H.; Zhang, C.; Chen, Y.; Wu, X.F.; et al. Soft X-ray prompt emission from the high-redshift gamma-ray burst EP240315a. Nat. Astron. 2025, 9, 564–576. [Google Scholar] [CrossRef]
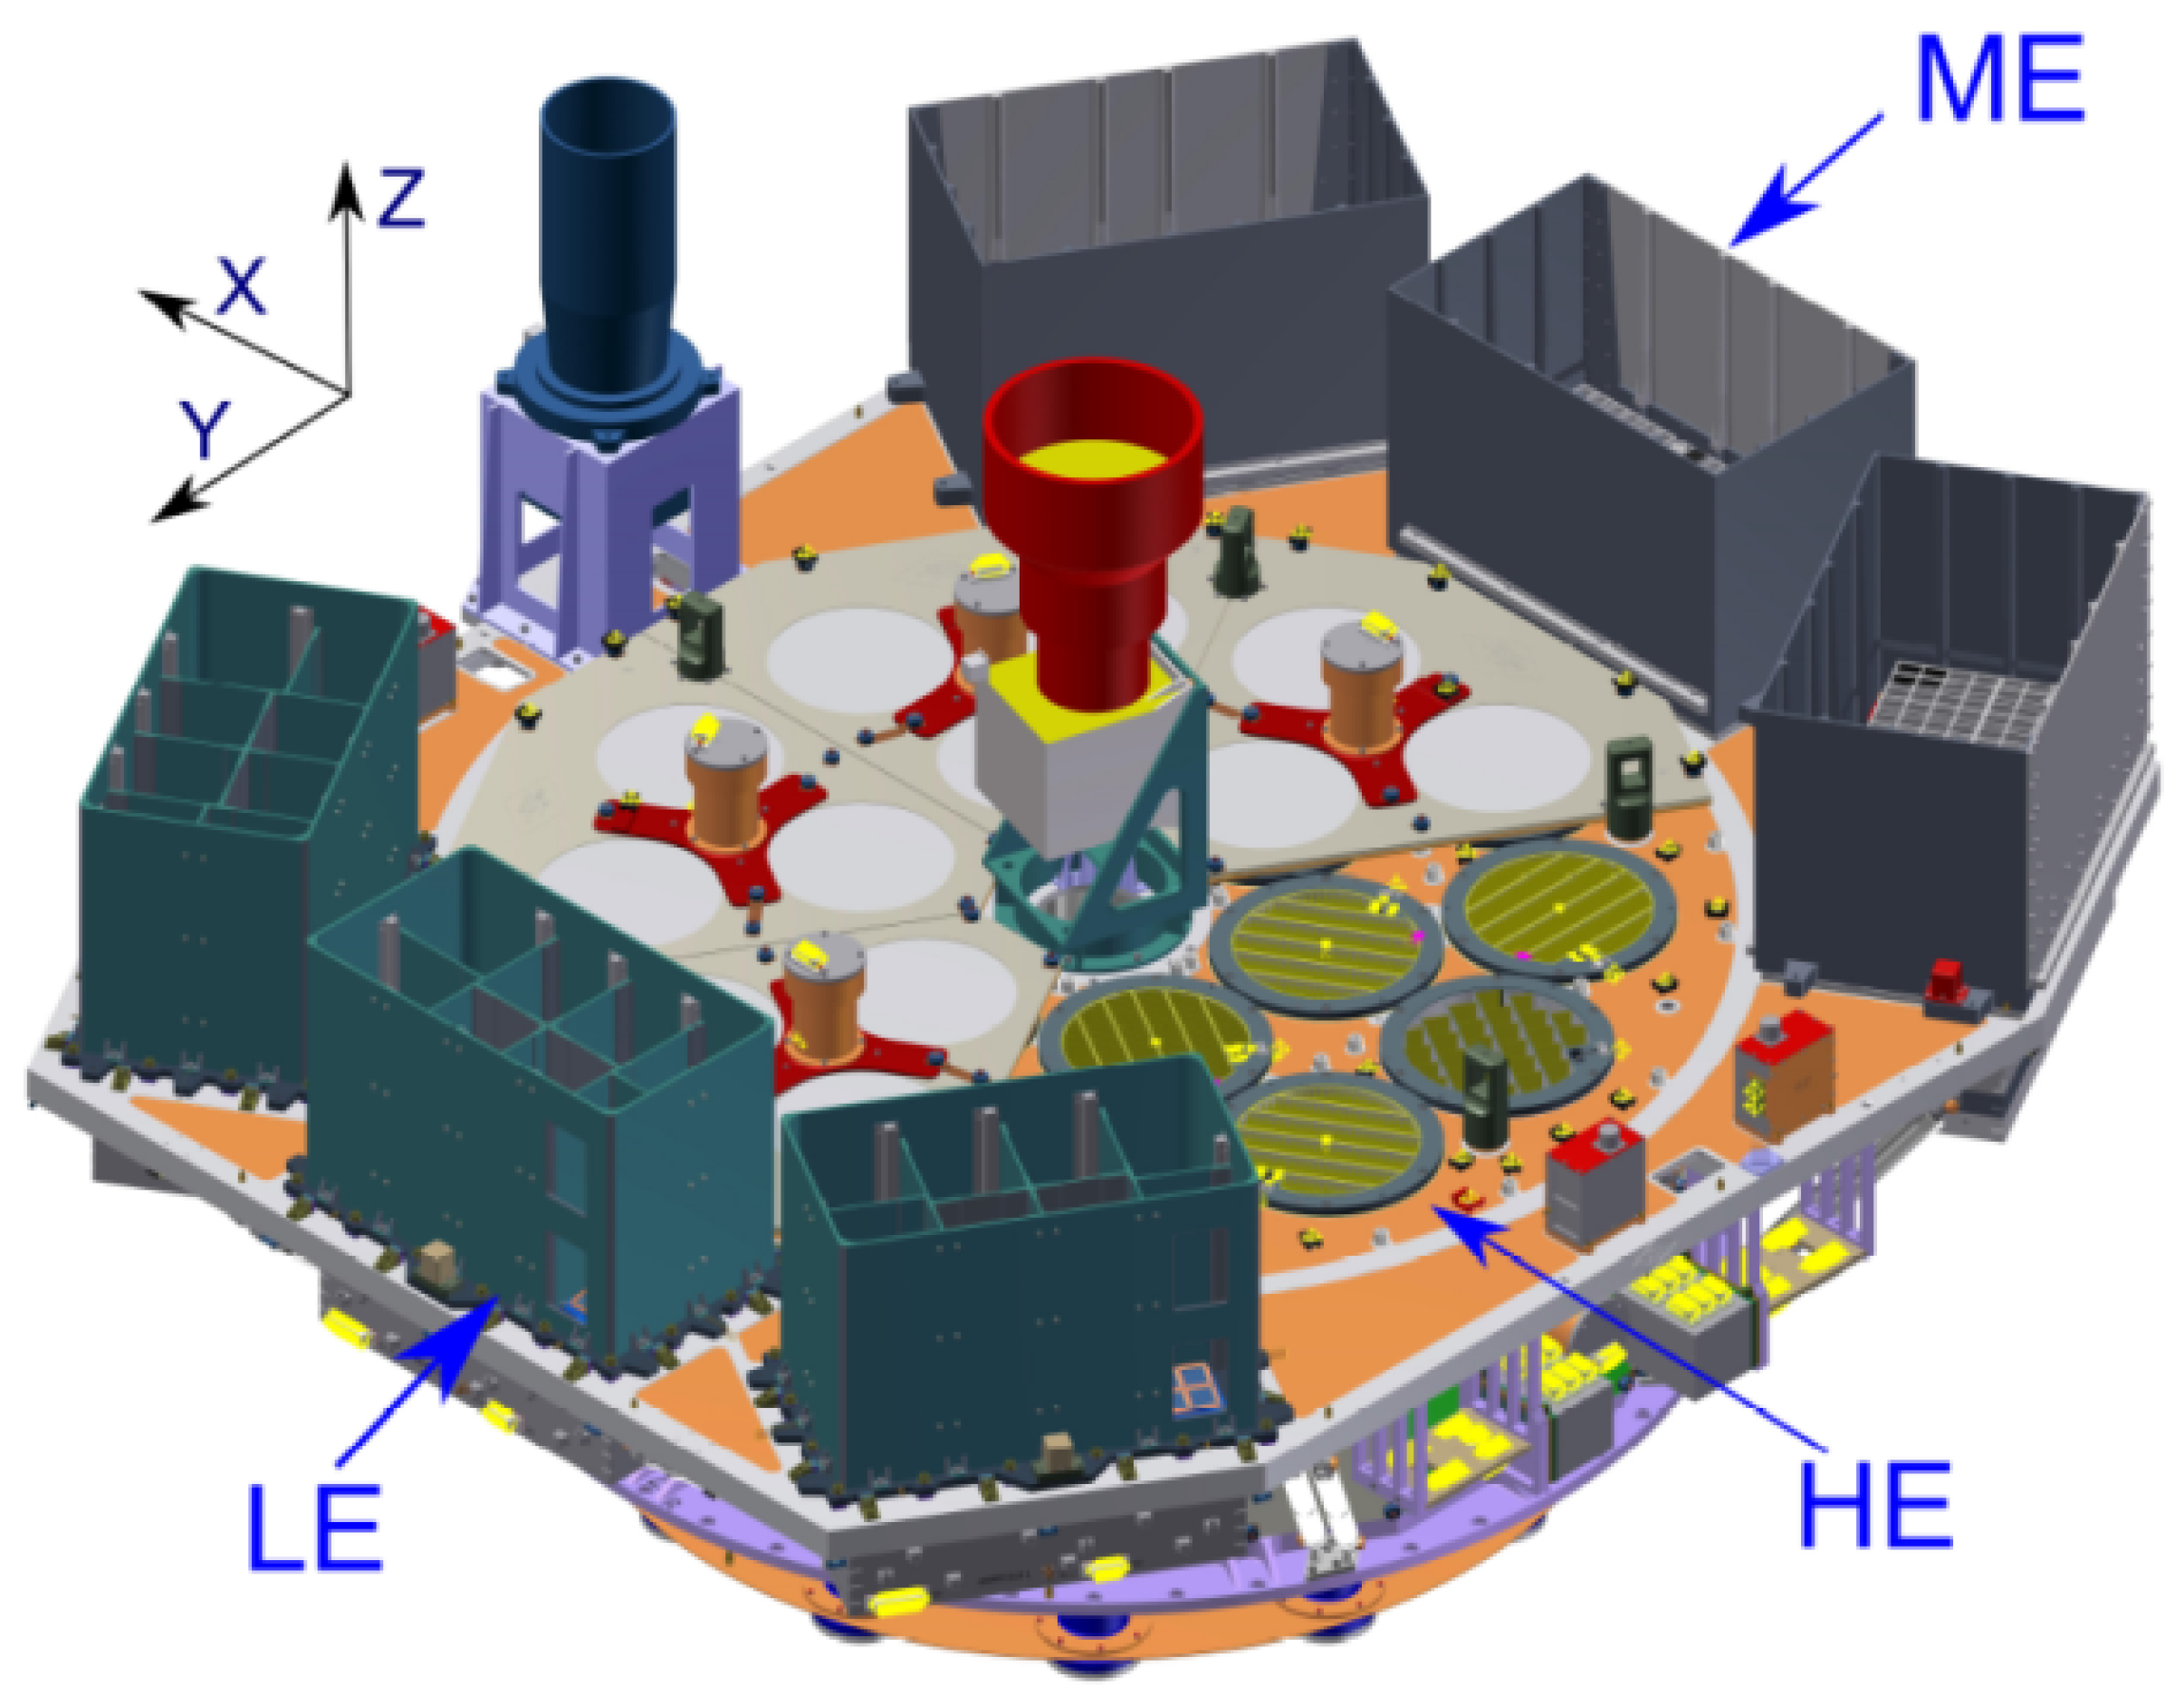
Figure 1. Main payloads onboard Insight-HXMT: the 18 cylindrical NaI/CsI detectors at the center represent the HE telescope; the rectangular detectors at the lower left correspond to the LE telescope; and those at the upper right denote the ME telescope. Adapted from [43].
Galaxies 13 00111 g001
Figure 2. (Left) panels: Insight-HXMT/LE (1–12 keV), Insight-HXMT/ME (6–38 keV), and Insight-HXMT/HE (20–90 keV) light curves, and the hardness ratio between the LE hard energy band (3–12 keV) and soft energy band (1–3 keV) of MAXI J1535-571. Each point represents one Insight-HXMT observation. The vertical dashed lines indicate the transition of states. (Right) panel: MAXI/GSC HID. In the right panel, intensity here is the count rate in the 2.0–20.0 keV range, while hardness is defined as the 4.0–20.0 to 2.0–4.0 keV count ratio. The red points indicate the time interval during which Insight-HXMT observations were taken. Adapted from [58].
Galaxies 13 00111 g002
Figure 3. (Top) panels: A representative PDS of MAXI J1535–571 based on Insight-HXMT/ME observations (6–38 keV), where QPO signals are clearly present. The dashed lines indicate the Lorentzian components used for the fit. (Bottom) panels: PDS of the same observation from three detectors. The upper, middle, and lower panels are for LE: 1–12 keV, ME: 6–38 keV, and HE: 26–100 keV, respectively. The observation was performed on MJD 58008.3 (ObsID: P011453500119). Adapted from [58].
Galaxies 13 00111 g003aGalaxies 13 00111 g003b
Figure 4. Energy dependence of the centroid frequency of type-C QPOs in MAXI J1535–571, with black, blue, and red points denoting data from the LE, ME, and HE telescopes, respectively. Adapted from [58].
Galaxies 13 00111 g004
Figure 5. Fractional rms amplitude of type-C QPOs plotted as a function of energy for MAXI J1535–571. Data points from the LE, ME, and HE telescopes are shown in black, blue, and red, respectively. Adapted from [58].
Galaxies 13 00111 g005
Figure 6. Phase lags at a typc-C fundamental QPO as a function of frequency for MAXI J1535–571. Adapted from [58].
Galaxies 13 00111 g006
Figure 7. (a) Insight-HXMT light curves of MAXI J1820+070, with vertical dashed lines marking the time interval during which LFQPOs are detected. The boxes indicate the PDS of the longest observation on MJD 58,201.3–58,203.3 (ObsID P0114661004; HE exposure ∼ 67 ks). (b) HID, where hardness is defined as the ratio of count rates in the 3–10 keV and 1–3 keV bands, plotted against the total 1–10 keV count rate. (c) PDS for different energy bands during the longest observation. Power values are scaled for clarity, and the vertical dashed line denotes the LFQPO centroid frequency. Error bars indicate 1 σ uncertainties. Adapted from [65].
Galaxies 13 00111 g007
Figure 8. The evolution of the LFQPO phase lag as a function of photon energy for MAXI J1820+070. Adapted from [65].
Galaxies 13 00111 g008
Figure 9. Schematic of the jet precession model. The black dot marks the black hole, and the Z-axis shows the spin direction. A small-scale jet, shown as a colored ribbon, moves around the spin axis in a circular cone, keeping a fixed angle θ f l o w . The left inset zooms in to show that photon energy decreases with height along the jet. Different positions along the curved jet are marked by θ f l o w to show the precession. The right inset shows the 3D twist of the jet around the spin axis. Adapted from [65].
Galaxies 13 00111 g009
Figure 10. Relation between the QPO (Q1) and peaked noise (Q3) frequencies. The dashed lines indicate the PBK relation. Adapted from [79].
Galaxies 13 00111 g010
Figure 11. Slopes of the QPO frequency-energy relation as a function of QPO frequency for Swift J1727.8-1613. Red dots represent positive slopes, while blue dots indicate negative ones, both derived from linear fits. The green dashed line marks a slope of zero. Frequencies correspond to the QPO fits obtained from the LE detector. Adapted from [79].
Galaxies 13 00111 g011
Figure 12. A representative PDS for MAXI J1820+070 in the high-energy band (30–150 keV), shown with the best-fit multi-Lorentzian model (in red). Q1 and Q2 correspond to the QPO and its second harmonic, respectively, while L1, L2, L3, and L4 represent four broadband noise. Adapted from [87].
Galaxies 13 00111 g012
Figure 13. The energy dependence of the fractional rms and characteristic frequency of component L1 for MAXI J1820+070 is shown, with green, blue, and red points representing the LE, ME, and HE data, respectively. The characteristic frequency remains nearly constant across the energy range. Adapted from [87].
Galaxies 13 00111 g013
Figure 14. Energy dependence of the fractional rms and characteristic frequency of L2 (left), L3 (middle), and L4 (right) for MAXI J1820+070. Green, blue, and red points indicate the LE, ME, and HE data, respectively. Adapted from [87].
Galaxies 13 00111 g014
Figure 15. Simultaneous PDS derived from time series in different energy bands for MAXI J1820+070 are presented, with vertical shifts applied for clarity. The PDS reveal how the characteristic frequency of the broadband noise evolves with photon energy. A vertical gray dashed line marks the frequency of the black hole LFQPO. Different colors indicate different energy bands, with corresponding best-fit models shown as solid lines. The low-frequency ( L l ) and high-frequency ( L h ) broadband noise components are overlaid, highlighting their opposite energy-dependent trends. Together, these components reveal a broadening of the PDS plateau at higher photon energies. Adapted from [89].
Galaxies 13 00111 g015
Figure 16. The schematic illustration shows the correspondence between the Comptonization geometries (lower panel) and the observed energy-dependent PDS (upper panel) extracted in three energy bands: 1–2 keV (blue), 35–46 keV (orange), and 100–250 keV (red). The characteristic frequencies of the high-frequency broadband noise component ( L h ) and the low-frequency broadband noise component ( L l ) vary with photon energy, reflecting the different radii where their seed photons originate. Adapted from [89].
Galaxies 13 00111 g016
Figure 17. Timing properties of GX 339–4. (Top) panel: The temporal evolution of the characteristic frequency and fractional rms of four variability components is presented for Insight-HXMT observations in three energy bands: LE (1–10 keV, left column), ME (10–30 keV, middle column), and HE (28–100 keV, right column). In the top row, black dots represent the QPO component, while green right-triangles, blue stars, and red upward-triangles denote the L 1 , L 2 , and L 3 broadband noise components, respectively. The three subsequent rows illustrate the evolution of the fractional rms for the L 1 , L 2 , and L 3 components over time. (Bottom) panel: The correlation between the QPO component and the L 1 , L 2 , and L 3 components is shown. The top row depicts the relation between frequencies, and the bottom row shows the relation between rms values. The same symbols are used to represent the L 1 (green right-triangle), L 2 (blue star), and L 3 (red up-triangle) components. Linear regression fits between the QPO and the L 1 and L 2 frequencies (on a logarithmic scale) are shown as solid lines. The slope of the regression lines and Pearson correlation coefficients (PCCs) are indicated in each panel. Adapted from [90].
Galaxies 13 00111 g017
Figure 18. Schematic illustration of the proposed accretion geometry for GX 339-4 during its transition from LHS to the SIMS. The outer, stable thin disc (shown in grey), located at large radii from the black hole, remains non-variable. In contrast, variability arises from the inner accretion structure, where mass accretion rate fluctuations propagate inward through a variable flow. These fluctuations generate broad-band noise components with distinct characteristic frequencies, originating from different radial zones: the outer region of the variable disc ( L 1 , green), its inner region ( L 2 , blue), and the hot inner flow ( L 3 , red). As the accretion disc moves closer to the innermost stable circular orbit (ISCO), the hot flow and the inner region of the variable disc gradually merge, forming a unified variable flow structure. Adapted from [90].
Galaxies 13 00111 g018
Figure 19. Time selection diagram for a 40-s wavelet result of MAXI J1535-571. In the left panel, the PDS is displayed as a grey curve, with the red dashed line indicating the 95% confidence level. Dark circles mark the intersection points where the global wavelet spectrum exceeds this confidence threshold. In the accompanying contour plot, the black contour outlines regions where the wavelet power is above the 95% confidence level, while the grey hatched area denotes the cone of influence—where edge effects become significant and interpretation should be treated with caution. Adapted from [99].
Galaxies 13 00111 g019
Figure 20. (Left) panel: The spectral fitting results for nine observations of MAXI J1535-571 are shown. The vertical axes display the ratios of the QPO and non-QPO spectral parameters relative to their corresponding time-averaged values. From top to bottom, the panels present the evolution of the cutoff energy, photon index, and inner disk temperature. Solid red lines represent the QPO regimes, while blue dash-dotted lines correspond to the non-QPO regimes. (Right) panel: The summed flux in the 2–100 keV range, including error bars, is presented. The vertical axes show the ratio of the QPO and non-QPO fluxes relative to their corresponding time-averaged fluxes. From top to bottom, the panels display the total unabsorbed flux, the cutoff power-law flux and the disk flux. The solid red lines correspond to the QPO regime, while the blue dash-dotted lines represent the non-QPO regime. The non-QPO data points are slightly shifted to the right to better display their error bars. Error bars correspond to the 90% confidence level. Adapted from [99].
Galaxies 13 00111 g020
Figure 21. (Top) panel: S-factor evolution calculated with 68% confidence level in MAXI J1535-571. Blue points are type-C QPOs, while red stars are type-B QPOs. Adapted from [19]. (Bottom) panel: the relationship between the S-factors of QPOs and their frequencies in MAXI J1803–298 within the 1–10 keV energy band is presented, with 95% confidence intervals labeled as (a) and 68% confidence intervals labeled as (b). Blue circles represent type-C QPOs, while red stars denote type-B QPOs. The dotted lines mark the typical S-factor range associated with type-B QPOs. Insets in each panel provide a magnified view of the data points where the S-factor approaches zero, with a rescaled Y-axis for better visibility. Adapted from [102].
Galaxies 13 00111 g021
Figure 22. Representative example of a 50 s long light curve from 27–150 keV and its corresponding IMFs. From top to bottom: the original light curve (DATA), seven individual IMFs (IMF0 to IMF6), and the residual. The high-frequency noise is obtained from the sum of IMF0 to IMF2; the LFQPO corresponds to IMF3; and the low-frequency noise is obtained from the sum of IMF4 to the residual. Adapted from [112].
Galaxies 13 00111 g022
Figure 23. Fourier power spectra of MAXI J1820+070, produced from the sum of IMF0 to IMF2 (orange), from IMF3 (red), from the sum of IMF4 to IMF6 and Residual (blue), and the original light curve (black). Adapted from [112].
Galaxies 13 00111 g023
Figure 24. Hilbert spectrum of the LFQPO in MAXI J1820+070, with the z-axis color indicating the QPO amplitude. Adapted from [112].
Galaxies 13 00111 g024
Figure 25. Constructed QPO waveforms of four epochs by phase folding the light curve from LE in the energy range of 1–10 keV for MAXI J1820+070. Adapted from [41].
Galaxies 13 00111 g025
Figure 26. Phase dependence of seven free spectral parameters— the inner disk temperature ( T i n ), inner radius ( R i n ), spectral index ( Γ ), electron temperature ( k T e ), reflection fraction ( R f ), and the normalizations of relxillCp (Norm1) and xillverCp (Norm2)—is shown across four epochs. Each panel also features the QPO waveform as a gray dashed line. Adapted from [41].
Galaxies 13 00111 g026
Figure 27. Schematic illustrations of the bicoherence patterns, from left to right: hypotenuse, cross, and web. Adapted from [119].
Galaxies 13 00111 g027
Figure 28. Panel (a): The power spectrum of MAXI J1820+070, obtained with the LE (1–10 keV; green), ME (10–30 keV; red), and HE (30–100 keV; blue) detectors. Narrow peaks around 0.4 Hz indicate the presence of QPOs. For clarity, each power spectrum has been scaled by a constant factor. Panels (be): The corresponding bicoherence plots for the LE, ME, and HE bands, respectively, where a clear cross pattern is observed. Adapted from [121].
Galaxies 13 00111 g028
Figure 29. Same source as in Figure 28, but for other ObsID. Panel (a): The power spectrum of MAXI J1820+070, obtained with the LE (1–10 keV; green), ME (10–30 keV; red), and HE (30–100 keV; blue) detectors. The bicoherence plots for the (b) LE, (c) ME, and (d) HE bands all exhibit the hypotenuse pattern. High bicoherence regions are marked with red boxes. Adapted from [121].
Galaxies 13 00111 g029
Figure 30. Comparison between the parallel pattern observed in the ME band of Swift J1727.8-1613 and the model results. From top to bottom: the PDS, the corresponding bicoherence plot from observations, and the simulated result from the model. Adapted from [123] and Maccarone et al. [119]. In the top panel, the red dashed line represents the QPO, the blue dashed line represents the harmonic, and the black dashed line represents the noise.
Galaxies 13 00111 g030
Table 1. Comparison of Fourier, Wavelet, HHT, and Bicoherence Analyses.
MethodAdvantagesApplications/Notes
Fourier AnalysisHigh frequency resolution; computationally efficient; commonly used methodQPO frequency, rms, phase lag extraction; limited in capturing short-term variations
Wavelet AnalysisGood time-frequency localization; detects transientsTracking short-term frequency changes; sensitive to mother wavelet choice
HHTAdaptive for nonlinear, non-stationary data; instantaneous frequency and phaseQPO signal extraction; modulation and phase studies; noise sensitive
Bicoherence AnalysisQuantifies nonlinear phase coupling; reveals frequency interactionsStudies QPO and noise coupling; requires high Signal-to-Noise Ratio; less common
Disclaimer/Publisher’s Note: The statements, opinions and data contained in all publications are solely those of the individual author(s) and contributor(s) and not of MDPI and/or the editor(s). MDPI and/or the editor(s) disclaim responsibility for any injury to people or property resulting from any ideas, methods, instructions or products referred to in the content.