Article

The Photometric Variability and Spectrum of the Hot Post-AGB Star IRAS 21546+4721

by
Natalia Ikonnikova
*,
Marina Burlak
and
Alexander Dodin
Sternberg Astronomical Institute, Moscow State University, Moscow 119234, Russia
*
Author to whom correspondence should be addressed.
Galaxies 2025, 13(2), 31; https://doi.org/10.3390/galaxies13020031
Submission received: 25 February 2025 / Revised: 21 March 2025 / Accepted: 27 March 2025 / Published: 31 March 2025
(This article belongs to the Special Issue Circumstellar Matter in Hot Star Systems)

Abstract

:
We present the results of photometric and spectroscopic observations of a poorly studied B-type supergiant with infrared excess, the hot post-AGB star IRAS 21546+4721. Based on our photometric observations in the U B V R C I C bands, we detected rapid, night-to-night, non-periodic brightness variations in the star with peak-to-peak amplitudes up to 0 . m 3 in the V band, as well as color–color and color–brightness correlations. Based on its variability characteristics, IRAS 21546+4721 appears similar to other hot post-AGB stars. Possible causes of the photometric variability are discussed. Additionally, we acquired low-resolution spectra in a wavelength range from 3500 to 7500 Å. The spectrum contains absorption lines typical of an early B-type star, along with a set of emission lines of H I, He I, [O I], [O II], [N II], [S II], and C II originating from an ionized circumstellar envelope. An analysis of the emission spectrum allowed us to estimate the parameters of the gas envelope ( N e ∼ 104 cm−3, T e ∼ 10,000 K) and the star’s temperature (∼26,500 K). The radial velocity measured from the emission lines was V r = 141 ± 7 km s−1.

1. Introduction

The post-asymptotic giant branch (post-AGB) stage in the evolution of low- and intermediate-mass stars (ranging from 1 to 8 M on the main sequence) is an intermediate phase between the asymptotic giant branch (AGB) and the planetary nebula (PN) phase. Among post-AGB stars, there is a distinct group of hot objects—early B-type supergiants with emission lines in their spectra—that are believed to be immediate precursors of PN nuclei [1]. These stars have already reached sufficiently high temperatures ( T eff > 15 , 000  K) to begin ionizing their surrounding envelopes. However, their ultraviolet radiation is still insufficient to excite the [O III] emission characteristic of PNs.
This work focuses on exploring the photometric behavior and spectral characteristics of a poorly studied B-type supergiant with infrared excess, the hot post-AGB star and future planetary nebula IRAS 21546+4721. The infrared (IR) source IRAS 21546+4721 ( α = 21 h 56 m 32 s . 9 ; δ = + 47 ° 36 12 . 8 (2000)) was first mentioned by Manchado et al. [2] as an object with far-IR colors similar to those of planetary nebulae, although it was not detected in the near-IR range. Later, García-Lario et al. [3] estimated the star’s brightness in the near-IR range ( J H K bands). The spectrum of the star was first presented in the spectroscopic atlas of post-AGB stars and planetary nebulae [4], where it was identified as a transitional object from post-AGB to PN [4]. IRAS 21546+4721 was included in “An evolutionary catalogue of galactic post-AGB and related objects” [5]. The star is also listed in the “Catalogue of H-alpha emission stars in the Northern Milky Way” under the name HBHA 4705-02 [6]. Frew et al. [7] measured the absolute flux of the H α line as log F ( H α ) = 11.89 (mW/m2). IRAS 21546+4721 was found to be a source without detectable water maser emission [8]. The object was also listed among planetary nebulae identified in the AKARI IRC and FIS Catalogues [9]. Cherrigone et al. [10] obtained the first radio observations of the star at 4.8, 8.4, and 22.4 GHz with the Very Large Array. The analysis of the IRAS 21546+4721 spectrum in the range of 5–40  μ m, obtained by the Spitzer Space Telescope, revealed that the object’s dust shell exhibits carbon chemistry, as evidenced by strong 6.2, 7.7, and 11.2  μ m features attributed to polycyclic aromatic hydrocarbons (PAHs) and the IR vibration modes of fullerene (C60) [11]. Venkata Raman et al. [11] also modeled the spectral energy distribution (SED) and determined the parameters of two shells and the mass-loss rate for IRAS 21546+4721. Akras et al. [12] performed the first optical broad-band ( U B V R I ) aperture polarimetric observations of the star and concluded that IRAS 21546+4721 is likely a very weakly polarized object.
All data available at the beginning of our research indicated that IRAS 21546+4721 belongs to objects at the post-AGB evolutionary stage. Hot post-AGB stars in the early phase of shell ionization are known to exhibit photometric and spectral variability [13,14]. Hoping to detect such variability for IRAS 21546+4721, we conducted photometric and spectroscopic observations. To date, no information has been published regarding the photometric behavior of the star, and data on its spectrum remain extremely scarce.

2. Observations and Data Reduction

2.1. Photometric Data

Optical photometry of the star was conducted using the 60 cm Ritchey-Chrétien (RC600) telescope at the Caucasian mountain observatory of Moscow State University (CMO MSU). The telescope is equipped with a set of photometric filters and an Andor iKon-L CCD camera (2048 × 2048 pixels, 13.5 μ m pixel size, 0. 67 per pixel scale, 22 × 22 field of view). A detailed description of the setup is provided in [15]. Observations were carried out remotely over four seasons from 2020 to 2024. During this period, IRAS 21546+4721 was observed on 225 nights, with 2–8 frames obtained per night in the U B V R C I C bands. The Maxim DL Version 6.28 software was used for both observations and data processing, including bias subtraction, dark correction, and flat-fielding.
We applied aperture photometry to IRAS 21546+4721 and several nearby stars within the field of view using custom Python scripts. The aperture size was adjusted based on seeing conditions. Since IRAS 21546+4721 is blue, it was challenging to select non-variable comparison stars with similar color and brightness to minimize the influence of unequal atmospheric and instrumental transmission. We picked a set of four stars. On several nights with fine photometric conditions, we observed the Landolt area GD 391 [16] at the same airmass as IRAS 21546+4721 to derive a zero point and color transformation coefficients and obtain the U B V R C I C magnitudes for the comparison stars, which are listed in Table 1. Finally, we performed differential photometry for IRAS 21546+4721, applying the derived color transformation coefficients.

2.2. Spectroscopic Observations

Spectroscopic observations were carried out on 28 October 2020 and 11 February 2025 on the 2.5 m telescope of the CMO MSU with a low-resolution Transient Double-beam Spectrograph (TDS) equipped with holographic gratings (see Potanin et al. [17]). The detectors in use were Andor Newton 940P cameras with 512 × 2048 E2V CCD42-10 CCDs. The spectra covered the range of 3500–7500 Å, with a spectral resolution of 1300 for the 3500–5720 Å region (blue channel) and 2500 for the 5720–7500 Å region (red channel). The log of observations can be found in Table 2.
The data reduction sequence included bias, flat-field, and dark corrections, cosmic ray removal, two-dimensional wavelength linearization, background subtraction, and relative flux calibration based on spectrophotometric standard stars and was performed using a set of self-developed Python scripts. The processing algorithm is described in Potanin et al. [17]. Observations were conducted with a long slit width of 1 . 0 or 1 . 5 , depending on the seeing conditions. If the seeing degraded during exposure, the absolute fluxes may be underestimated because of light loss in the slit. The hot subdwarf BD+ 28°4211 from the list of spectrophotometric standards compiled at the European Southern Observatory [18] was used in 2020, while the A0 V star HIP 10512 was employed in 2025.

3. Results

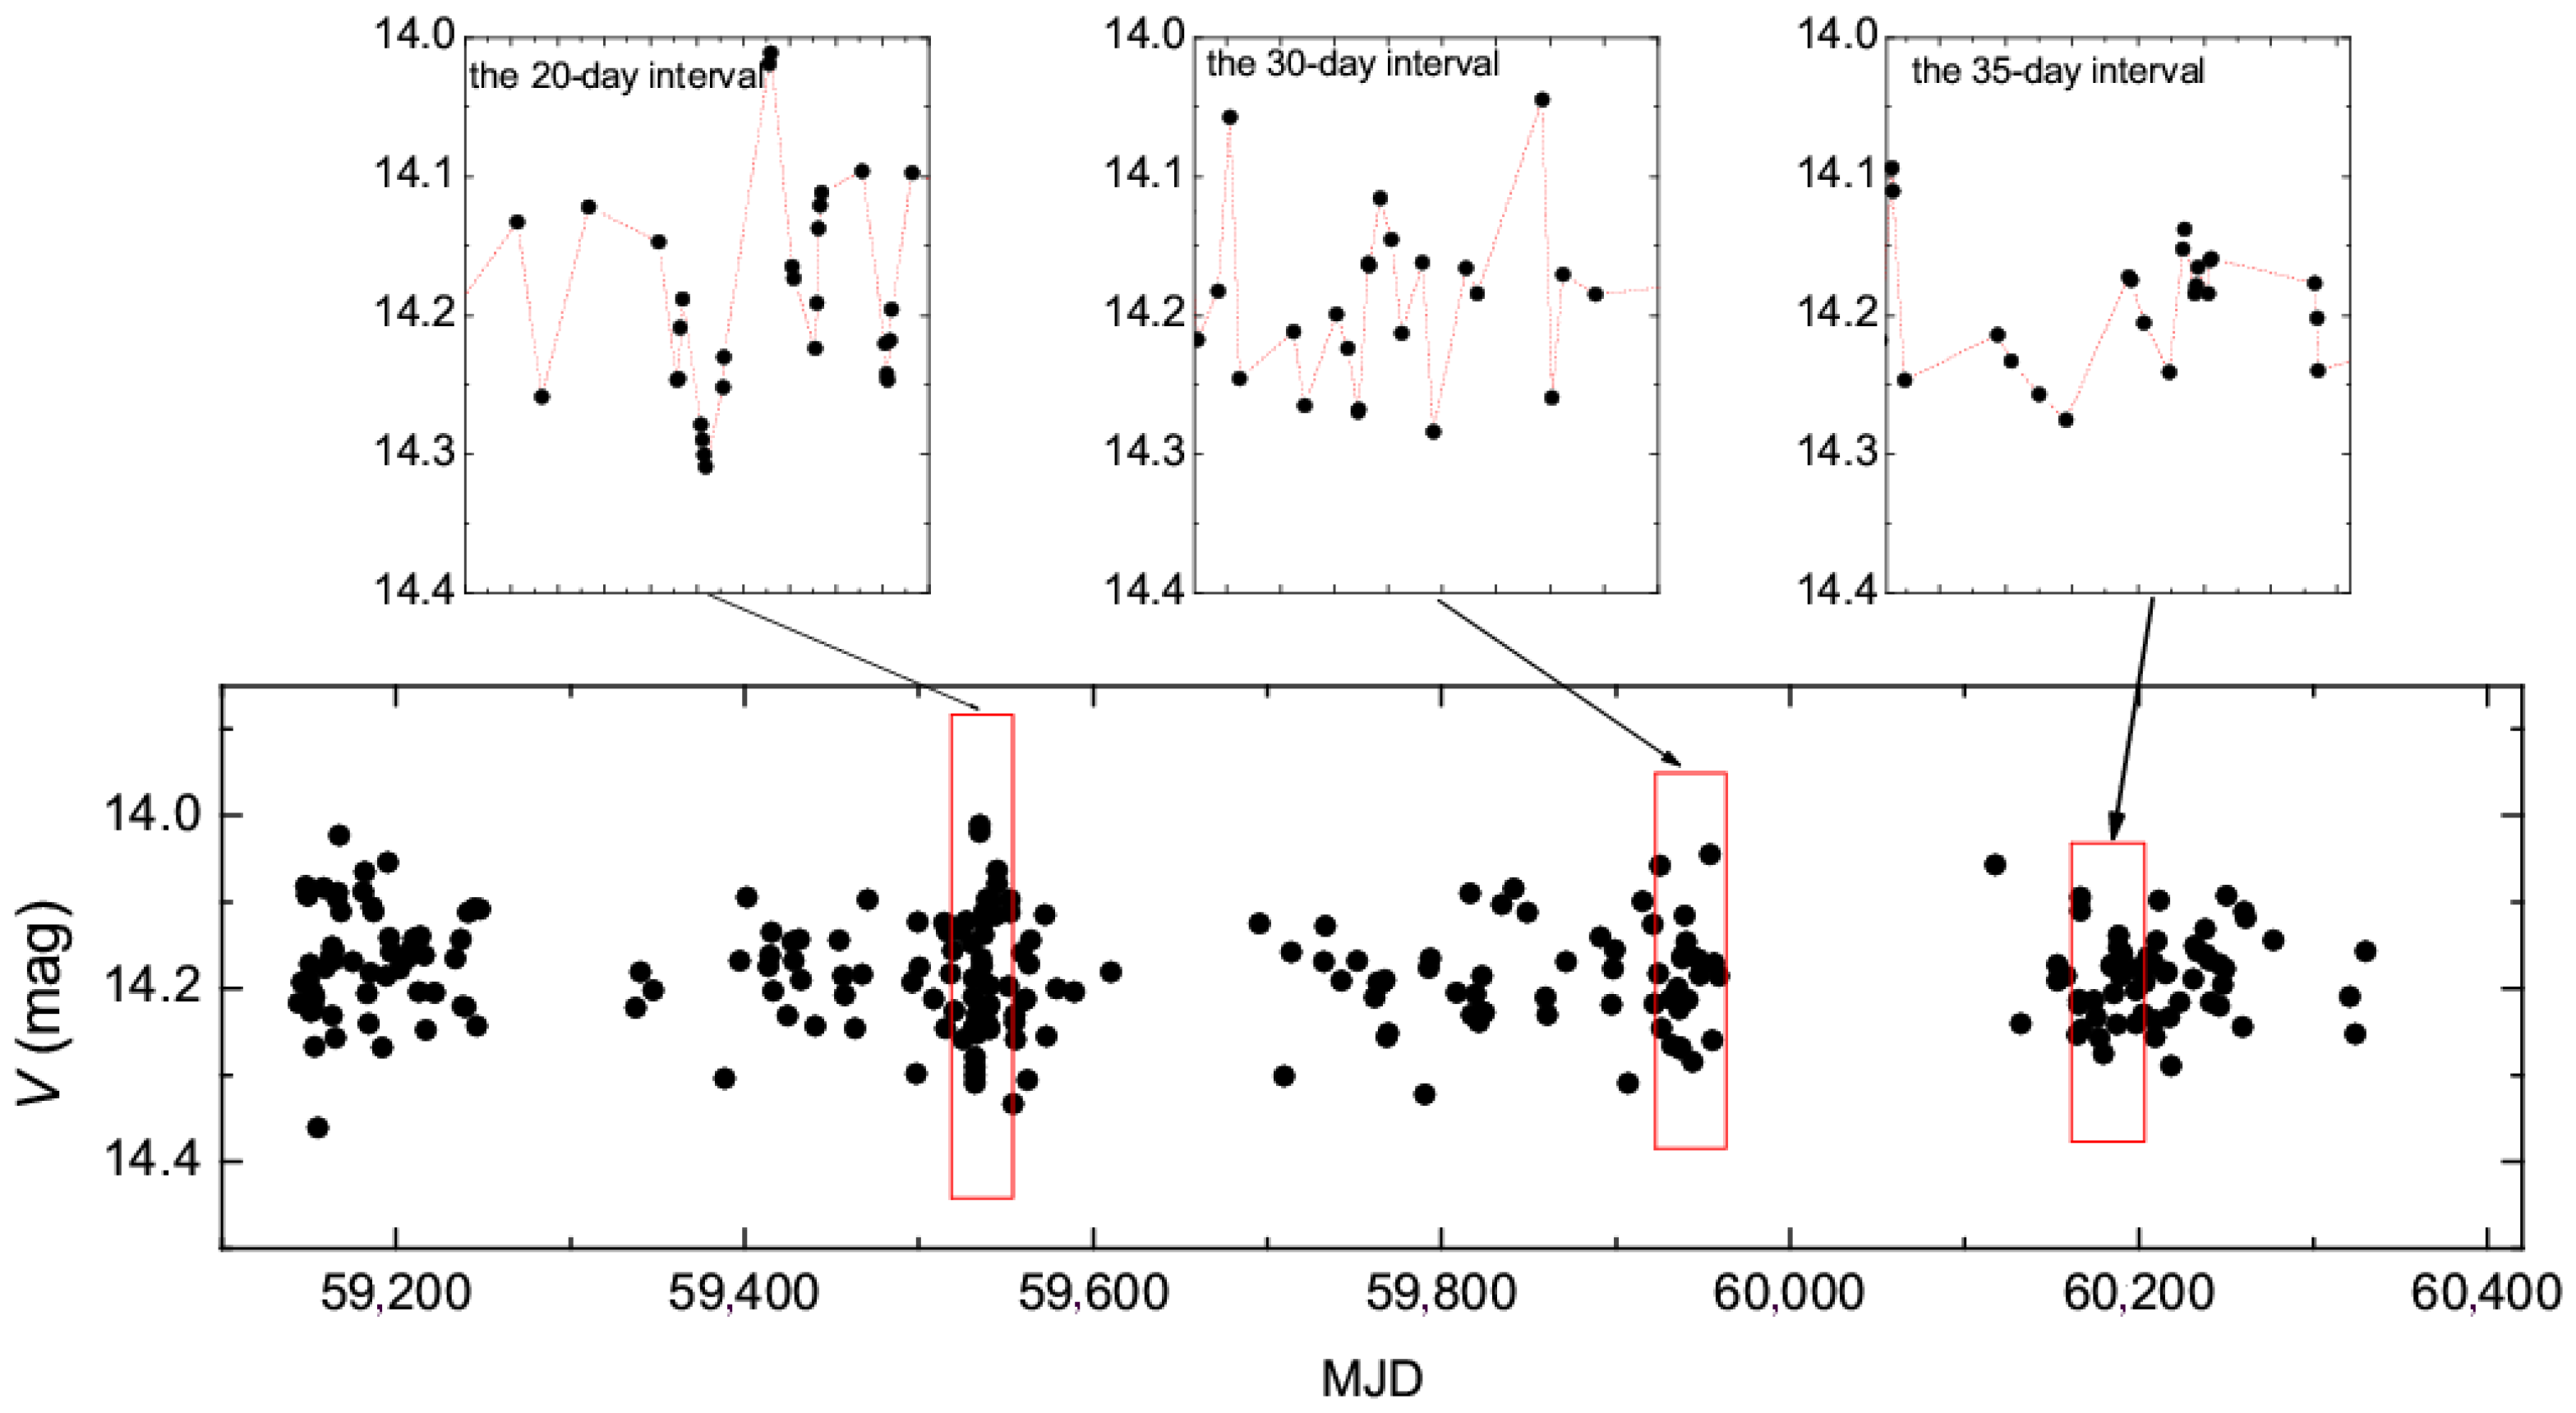
3.1. Optical Photometry

Figure 1 shows the complete light curve in the V band, along with more detailed light curves for three selected time intervals. The brightness variations exhibit similar patterns in other photometric bands. Table 3 lists the average magnitudes, peak-to-peak amplitudes, and average errors for single brightness measurements in the U B V R C I C bands. The star exhibits rapid, irregular night-to-night brightness variations. The search for periods in the 0.5–20-day range across the entire dataset yielded no results.
Figure 2 shows the position of the color indices on a color–color diagram, along with the sequence of intrinsic colors for supergiants [19]. The observed color indices are significantly reddened. To align them with the theoretical values, we applied a color-excess correction of E ( B V ) = 0.45 , which allowed us to classify the star as a B0-type supergiant. Notably, the color indices vary: B V changes by 0 . m 05 , while U B varies by 0 . m 1 . Moreover, a specific trend is observed: A bluer U B is accompanied by a redder B V . This behavior cannot be explained by temperature variations, which would cause both indices to redden simultaneously, moving the star along the line of intrinsic color indices. Thus, pulsations as a potential cause of variability fail to account for the observed behavior.
As a star evolves beyond the AGB phase, increasing temperature triggers a new phase of mass loss driven by radiation pressure in resonant lines [21]. This suggests that photometric variability may be linked to an unstable stellar wind. In hot post-AGB stars, the plasma parameters ( N e and T e ) in the wind can vary significantly depending on the stellar mass and wind intensity. Near the star, where the wind forms, electron densities can reach 10 10 10 13 cm−3 due to high gas density near the photosphere, where wind acceleration begins. The density decreases with distance as the wind expands. To evaluate whether the color index variability on the two-color diagram can be explained by stellar wind variations, Figure 2 presents theoretical U B vs. B V dependencies for hydrogen plasma with different parameters. These include (1) plasma transparent in the Balmer continuum but opaque in lines, with T e = 10,000 K and N e = 10 10 cm−3; (2) plasma with T e = 15,000 K and varying optical thickness in the Balmer continuum [20]. The star’s movement on the diagram—upward and to the right, or downward and to the left—aligns with changes in the Balmer continuum transparency, likely driven by the variable stellar wind density.
The color–brightness diagrams (Figure 3) reveal a clear correlation: decreases in brightness correspond to reddening in U B and V R C but blueing in B V and R C I C . This behavior cannot be explained by changes in the star’s temperature, which would cause all color indices to redden as the brightness decreases. Instead, the observed variability is likely driven by an additional radiation source, most probably an unstable stellar wind.

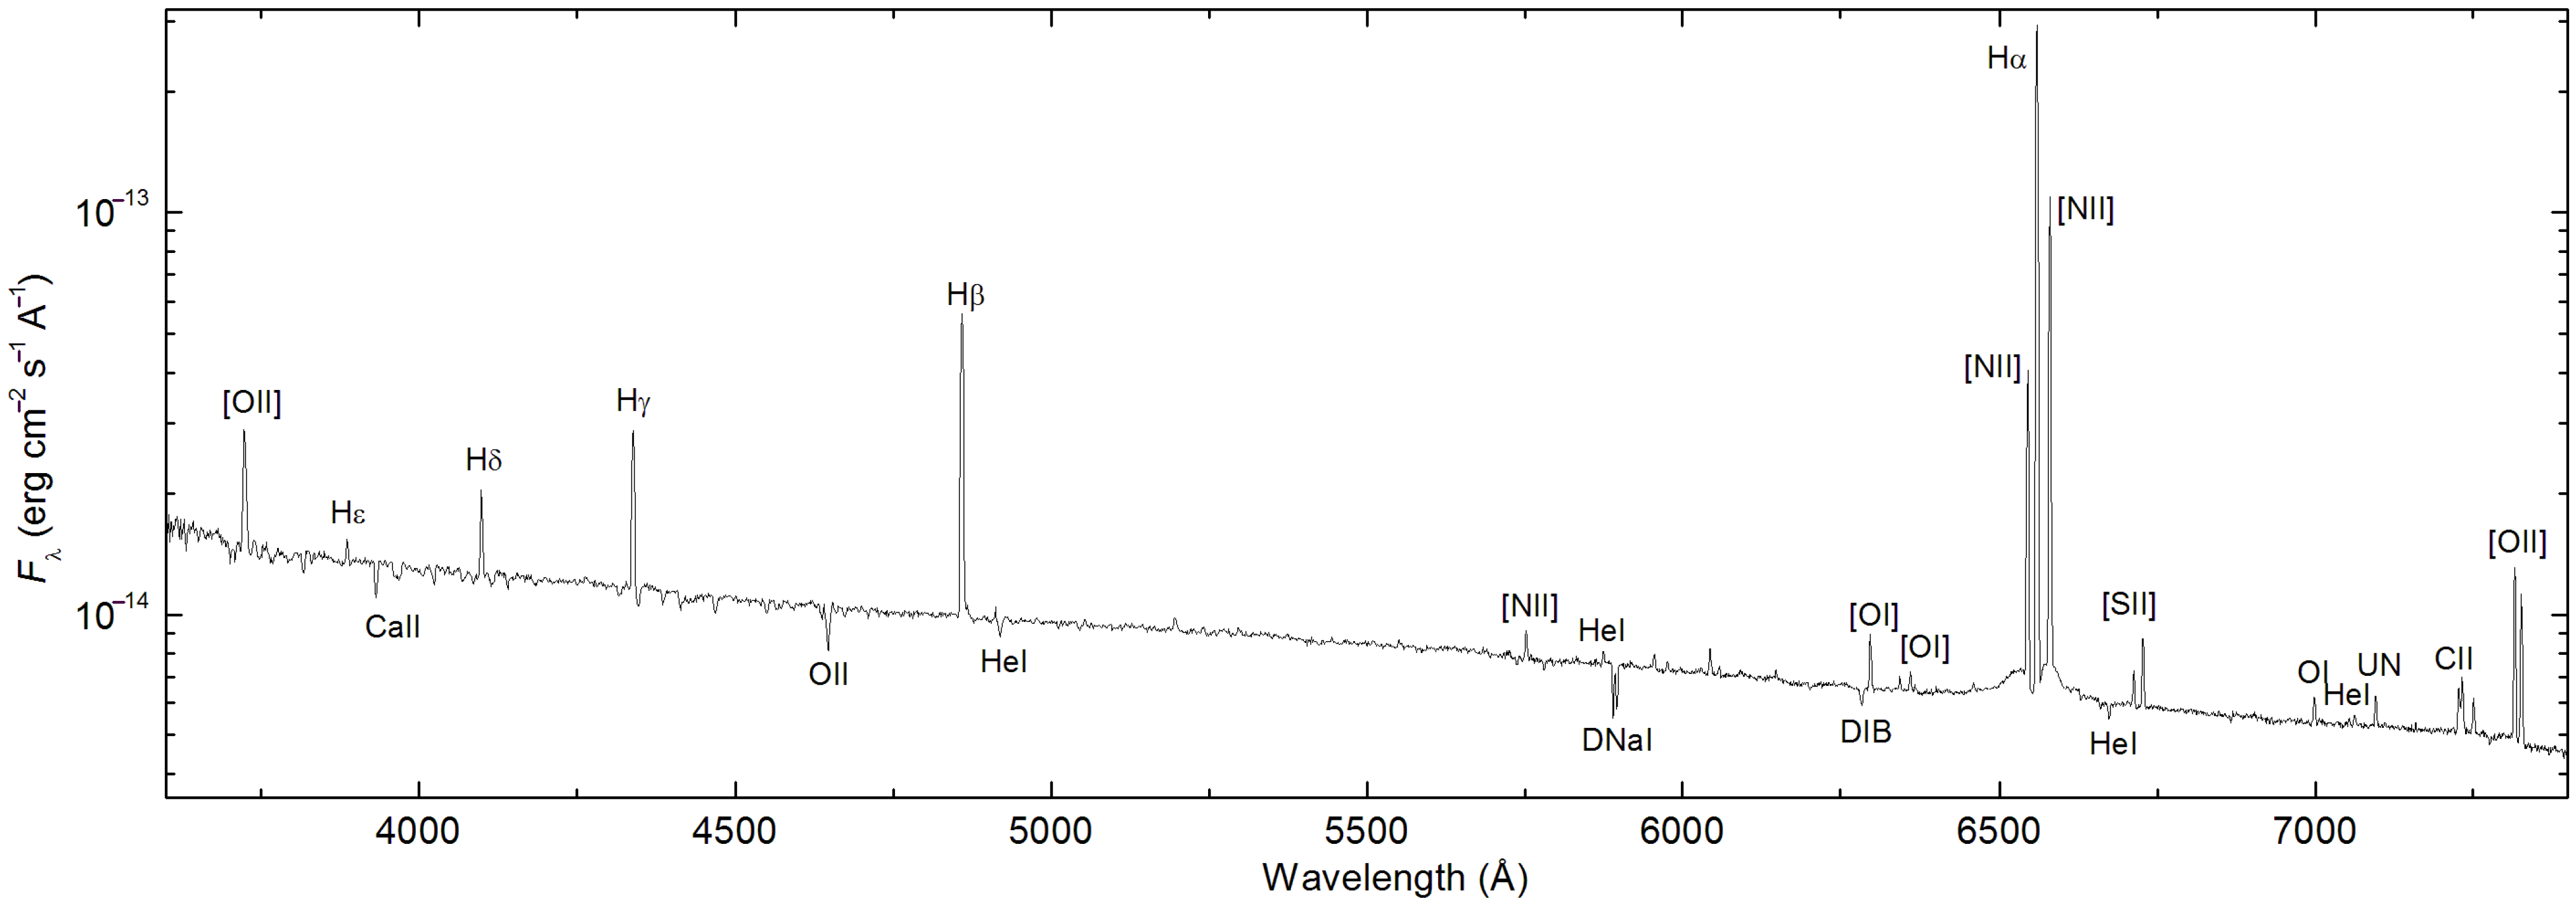
3.2. Analysis of the Spectrum

Figure 4 shows the spectrum obtained on 10 February 2025. The optical spectrum of IRAS 21546+4727 is a combination of the photospheric spectrum of a hot star with emission lines from a circumstellar gas nebula. Because of a low spectral resolution, only the strongest stellar absorption lines and interstellar features, such as H and K Ca II, D Na I, and DIB 6282 Å  can be confidently identified. The emission spectrum of the gas shell includes hydrogen Balmer lines, C II 7231, 7236 Å, and forbidden lines: [O I] 6300, 6363 Å; [O II] 3727-29, 7320, 7330 Å; [N II] 5755, 6548, 6584 Å; and [S II] 6717, 6730 Å. HeI lines are seen both in absorption (4921 Å, 6678 Å) and in emission (5876 Å, 7065 Å). We measured the absolute fluxes and equivalent widths of the emission lines. The measurement errors are 3–5% for strong lines and around 10 % for weak lines. Since absolute fluxes may be underestimated due to light loss during narrow-slit observations, Table 4 provides relative line intensities normalized to I ( H β ) = 100. Table 4 also includes the equivalent widths ( E W ), observed ( λ o b s . ) and laboratory ( λ l a b . ) wavelengths, and heliocentric radial velocities ( V r ). The relative intensities and equivalent widths are given for two dates, 28 October 2020 and 10 February 2025, with the values for each date separated by commas. The differences between the two dates do not exceed 3 σ . The radial velocities correspond to the date 28 October 2020, with measurement uncertainties of ∼10 km s−1.
The average radial velocity of V r = 141.2 ± 6.6 km s−1, determined from the emission lines (excluding He I 5876 Å), indicates that IRAS 21546+4721 is a high-velocity post-AGB star, similar to IRAS 22023+5249 ( V r = 144.13 km s−1) [22] and LS 5112 ( V r = 139 km s−1) [23]. However, it should be taken into account that the radial velocity derived from emission features may differ by several km s−1 from that of stellar absorption lines. As previously established for similar objects, the shift between absorptions and emissions can be either positive [22,24] or negative [23,25,26]. The radial velocities of the dust clouds along the line of sight, measured from interstellar K CaII and D NaI, were about −18 km s−1 and 14 ± 3 km s−1, respectively. Given the significant uncertainties associated with the low-resolution spectrum, these values should be regarded as estimates.
Figure 5 shows the profiles of the H α and H β lines in the spectra obtained in 2020 and 2025. The H α line—the strongest emission line in the visible spectrum—is superimposed on a broad base, which can be interpreted as Lorentz wings distorted by stellar absorption and possibly a P-Cygni absorption feature with velocities up to −1000 km s−1. This may indicate the presence of stellar wind. A P-Cygni profile can also be suspected in the H β line, where an elongated red wing is observed, while the blue side of the profile ends abruptly. The broad base of the H α line shows some differences between the 2020 and 2025 spectra.
Due to the relatively low temperature of the central star, the object’s spectrum contains a limited set of lines typically used for diagnosing the gaseous envelope. The density and temperature values were calculated using available diagnostic line ratios and the software pyneb [27]. To simultaneously determine the temperature and density from the [NII], [OII], and [SII] lines, we constructed diagnostic diagrams. The relative intensities of the emission lines of interest (from Table 4) were corrected for the extinction using E ( B V ) = 0.45 or c ( H β ) = 0.66 . Figure 6 shows the diagnostic diagram obtained using the Python scripts that implement pyneb.
The ratio F ( λ 6716 ) / F ( λ 6731 ) provides an estimate of N e 104 cm−3. The intersection of the [S II] and [N II] curves indicates an electron temperature of T e 10,000 K in the region where the [N II] lines are formed. For the [O II] lines, T e has a higher value of about 12,000 K. It is worth noting that the [O II] line pairs are significantly separated in the spectrum, and their intensity ratio is highly dependent on the extinction value.
Knowledge of the star’s parameters ( T eff , log g ) is extremely important for clarifying its evolutionary status. However, their determination is postponed until a high-resolution spectrum is obtained. In the meantime, we attempt to estimate the temperature of the ionizing star by comparing its emission spectrum with those of brighter related objects whose effective temperatures have already been determined.
Based on the composition of emission lines in the spectrum, the values of the relative intensities, and the equivalent widths of the lines, IRAS 21546+4721 is the most similar to the hottest post-AGB stars, such as IRAS 07171+1821 and IRAS 19336–0040. Their spectra contain forbidden lines of [O I], [O II], [N II], and [S II], with the equivalent widths of the H α line at 120 Å [25] and 311 Å [14], respectively. IRAS 21546+4721, with E W ( H α ) = 158 ± 7 Å, occupies an intermediate position between these comparison objects. From a high-resolution spectrum, the spectral type of IRAS 07171+1821 has been estimated to be B0.5I [25], which corresponds to an effective temperature of 25 , 230 ± 1740 K using a calibration from [28]. The effective temperature T eff = 27 , 700 ± 1100 K of IRAS 19336-0040 was determined by Herrera et al. [29]. We believe it is entirely reasonable to adopt T eff 26 , 500 K for IRAS 21546+4721, especially since this value does not contradict the spectral type B0I.

4. Discussion

Hot post-AGB stars with temperatures above 15,000 K are direct precursors of planetary nebulae. Currently, about 30 such objects are known [1,4,5], but observational data on photometry and spectra are not available for all of them. Observing and studying as many of these objects as possible is crucial for determining their general characteristics and identifying individual features unique to each object.
The focus of our study is IRAS 21546+4721, a still poorly studied star for which we conducted multicolor photometric observations. These data allowed us to detect a brightness variability and construct color–color and color–magnitude diagrams. The brightness variability manifests as night-to-night changes with amplitudes of about 0 . m 3 in the photometric bands ranging from U to I C . No periodicity was detected. A color–color diagram was constructed, showing a decrease in U B as B V increases. The color–brightness relationships demonstrate reddening in U B and V R C , and blueing in B V and R C I C as the brightness decreases.
This star has become the seventeenth object in the sample of hot post-AGB stars, alongside V5555 Sgr [30], V1853 Cyg [31,32], V886 Her [33], IRAS 19200+3457 [34], IRAS 07171+1823 [25], IRAS 19336–0400 [14], IRAS 01005+7910, IRAS 22023+5249 [35], M 2-54 [35,36], Hen 3-1347, Hen 3-1428, LSS 4634 [37], LS 5112 [23], LS 4331 [26], Hen 3-1013 [38], and IRAS 19306+1407 [39], whose photometric variability has been detected.
The general characteristics of the variability include rapid, night-to-night irregular brightness variations with amplitudes ranging from 0 . m 2 to 0 . m 4 in the V band, reddening B V with increasing brightness, or the absence of a correlation between color and brightness.
There is still no consensus on the causes of variability in hot post-AGB stars. The main hypotheses invoke a variable stellar wind and pulsations [36]. It is possible that both of these factors play a role. The gradual changes can be attributed to fluctuations in stellar mass loss, whereas the short-term variations are most likely due to stellar pulsations. Evidence supporting the stellar wind hypothesis includes signs of mass loss in the majority of stars in the sample, such as the P Cyg profiles of individual lines in their optical spectra [22,23,40,41,42] and the C IV and N V stellar wind features in the UV(IUE) spectra of some objects [43]. The identified color–color and color–brightness dependencies for IRAS 21546+4721 and some other hot post-AGB stars can also be explained by the instability of the stellar wind.
Using the color–color diagram, we estimated the total light extinction for IRAS 21546+4721 to be E ( B V ) 0.45 or A V = 3.1 E ( B V ) 1.40 . The maximum interstellar extinction in the direction of IRAS 21546+4721 ( l = 95 . ° 0 , b = 5 . ° 6 ) according to the 3D maps by Green et al. [44], is A V = 0.88 ; therefore, approximately 0.5 of A V is due to extinction by the circumstellar dust envelope.
To estimate the physical parameters of the star, primarily its mass, it is necessary to determine its position on the Hertzsprung–Russell diagram. However, IRAS 21546+4721 is a distant object for which the parallax ( π = 0.028 ± 0.028 mas, RUWE = 1.818) [45] and distance ( d = 9781 1546 + 969 pc) [46] are currently determined unreliably, so the luminosity estimate will also have large uncertainty.
An analysis of the low-resolution spectrum revealed that it contains absorption line characteristic of an early-B-type star as well as emission lines from a gaseous envelope. The emission spectrum includes lines from the Balmer series of hydrogen and forbidden lines of [O I], [O II], [S II], and [N II]. The radial velocities from the envelope emissions were measured for the first time. The obtained radial velocity values indicate that IRAS 21546+4621 is a high-velocity object, similar to IRAS 22023+5249 [22] and LS 5112 [23]. The derived parameters of the gaseous envelope, such as N e 10 4 cm−3 and T e 10,000 K, are typical for this class of objects. The spectral analysis also showed that the star ionizing the envelope has a temperature of about 26,500 K based on the composition and intensities of the emission lines, and thus belongs to the group of the hottest post-AGB stars, such as IRAS 07171+1823 [25], M 2-54 [35], and IRAS 19336-0040 [14].
Future research directions for IRAS 21546+4621 should focus on obtaining and analyzing high-resolution spectra to determine stellar parameters such as T eff and log g , as well as the chemical composition of its atmosphere. This will allow for a comparison with theoretical evolutionary tracks to estimate the star’s mass and its position on the Hertzsprung–Russell diagram. High time-resolution photometric observations are also crucial for establishing the characteristic timescales of brightness variations and understanding the causes of the variability. For instance, Handler [36] suggested conducting multi-site observing campaigns well separated in longitude over a period of several weeks. It is also important to calculate the theoretical U B and B V dependencies for plasma with various parameters, which can then be compared with observational data for hot post-AGB stars.

Author Contributions

Conceptualization, N.I.; software, A.D. and M.B.; formal analysis, N.I. and M.B.; investigation, N.I.; data curation, N.I., M.B. and A.D.; writing—original draft preparation, N.I.; writing—review and editing, N.I. and M.B. All authors have read and agreed to the published version of the manuscript.

Funding

This research received no external funding.

Informed Consent Statement

Not applicable.

Data Availability Statement

The photometric data and original spectra reported in this study are available on request to the first author via email at ikonnikova@sai.msu.ru.

Acknowledgments

This study was conducted under the state assignment of Lomonosov Moscow State University. We thank Safonov B.S., who obtained the TDS spectra on 28 October 2020.

Conflicts of Interest

The authors declare no conflicts of interest.

References

  1. Parthasarathy, M.; Vijapurkar, J.; Drilling, J.S. Low resolution spectroscopy of hot post-AGB candidates. Astron. Astrophys. Suppl. 2000, 145, 269–274. [Google Scholar]
  2. Manchado, A.; Pottasch, S.R.; García-Lario, P.; Esteban, C.; Mampaso, A. Near-infrared survey of IRAS sources with colours like planetary nebulae. Astron. Astrophys. 1989, 214, 139–147. [Google Scholar]
  3. García-Lario, P.; Manchado, A.; Pych, W.; Pottasch, S.R. Near infrared photometry of IRAS sources with colours like planetary nebulae. III. Astron. Astrophys. Suppl. Ser. 1997, 126, 479–502. [Google Scholar]
  4. Suárez, O.; García-Lario, P.; Manchado, A.; Manteiga, M.; Ulla, A.; Pottasch, S.R. A spectroscopic atlas of post-AGB stars and planetary nebulae selected from the IRAS point source catalogue. Astron. Astrophys. 2006, 458, 173–180. [Google Scholar] [CrossRef]
  5. Szczerba, R.; Siódmiak, N.; Stasińska, G.; Borkowski, J. An evolutionary catalogue of galactic post-AGB and related objects. Astron. Astrophys. 2007, 469, 799–809. [Google Scholar]
  6. Kohoutek, L.; Wehmeyer, R. Catalogue of H-alpha emission stars in the Northern Milky Way. Astron. Astrophys. Suppl. 1999, 134, 255–256. [Google Scholar]
  7. Frew, D.J.; Bojičić, I.S.; Parker, Q.A. A catalogue of integrated Hα fluxes for 1258 Galactic planetary nebulae. Mon. Not. R. Astron. Soc. 2013, 431, 2–26. [Google Scholar]
  8. Suárez, O.; Gómez, J.F.; Morata, O. New detections of H2O masers in planetary nebulae and post-AGB stars using the Robledo-70 m antenna. Astron. Astrophys. 2007, 467, 1085–1091. [Google Scholar]
  9. Phillips, J.P.; Márquez-Lugo, R.A. Mid- and Far-Infrared Photometry of Galactic Planetary Nebulae with the AKARI All-Sky Survey. Rev. Mex. Astron. Astroph. 2011, 47, 83–112. [Google Scholar]
  10. Cerrigone, L.; Trigilio, C.; Umana, G.; Buemi, C.S.; Leto, P. From pre- to young planetary nebulae: Radio continuum variability. Mon. Not. R. Astron. Soc. 2011, 412, 1137–1144. [Google Scholar] [CrossRef]
  11. Raman, V.V.; Anandarao, B.G.; Janardhan, P.; Pandey, R. An infrared photometric and spectroscopic study of post-AGB stars. Mon. Not. R. Astron. Soc. 2017, 470, 1593–1611. [Google Scholar] [CrossRef]
  12. Akras, S.; Ramírez Vélez, J.C.; Nanouris, N.; Ramos-Larios, G.; López, J.M.; Hiriart, D.; Panoglou, D. Multi-band polarimetry of post-asymptotic giant branch stars—I. Optical measurements. Mon. Not. R. Astron. Soc. 2017, 466, 2948–2982. [Google Scholar] [CrossRef]
  13. Arkhipova, V.P.; Ikonnikova, N.P.; Komissarova, G.V.; Noskova, R.I. The variability of hot protoplanetary objects and the stellar wind from central stars of planetary nebulae. In Proceedings of the Planetary Nebulae in our Galaxy and Beyond, Waikoloa Beach, HI, USA, 3–7 April 2006; Barlow, M.J., Méndez, R.H., Eds.; International Astronomical Union Symposia: Paris, France, 2006; Volume 234, pp. 357–358. [Google Scholar]
  14. Arkhipova, V.P.; Burlak, M.A.; Esipov, V.F.; Ikonnikova, N.P.; Komissarova, G.V. Variability of hot supergiant IRAS 19336-0400 in the early phase of planetary nebula ionization. Astron. Lett. 2012, 38, 157–166. [Google Scholar] [CrossRef]
  15. Berdnikov, L.N.; Belinskii, A.A.; Shatskii, N.I.; Burlak, M.A.; Ikonnikova, N.P.; Mishin, E.O.; Cheryasov, D.V.; Zhuiko, S.V. BVIc Observations and Search for Evolutionary Variations in the Cepheid V811 Oph Period. Astron. Rep. 2020, 64, 310–318. [Google Scholar] [CrossRef]
  16. Clem, J.L.; Landolt, A.U. Faint UBVRI standard star fields at +50° declination. Astron. J. 2016, 152, 91. [Google Scholar]
  17. Potanin, S.A.; Belinski, A.A.; Dodin, A.V.; Zheltoukhov, S.G.; Lander, V.Y.; Postnov, K.A.; Savvin, A.D.; Tatarnikov, A.M.; Cherepashchuk, A.M.; Cheryasov, D.V.; et al. Transient Double-Beam Spectrograph for the 2.5-m Telescope of the Caucasus Mountain Observatory of SAI MSU. Astron. Lett. 2020, 46, 836–854. [Google Scholar]
  18. ESO.org. Available online: https://www.eso.org/sci/observing/tools/standards/spectra/stanlis.html (accessed on 23 February 2025).
  19. Straižys, V. Multicolor Stellar Photometry; Pachart Pub. House: Tucson, AZ, USA, 1992; pp. 238–239. [Google Scholar]
  20. Chalenko, N.N. Application of theoretical UBVRI color-color diagrams to colorimetric analyses of various astrophysical objects. Astron. Rep. 1999, 43, 459–461. [Google Scholar]
  21. Kwok, S. ProtoPlanetary Nebulae. In Proceedings of the Planetary Nebulae, Innsbruck, Austria, 13–17 July 1992; Weinberger, R., Acker, A., Eds.; International Astronomical Union Symposia: Paris, France, 1993; Volume 155, p. 263. [Google Scholar]
  22. Sarkar, G.; García-Hernández, D.A.; Parthasarathy, M. High-resolution spectroscopy of the high-velocity hot post-AGB star LS III +52°24 (IRAS 22023+5249). Mon. Not. R. Astron. Soc. 2012, 421, 679–699. [Google Scholar]
  23. Ikonnikova, N.P.; Parthasarathy, M.; Dodin, A.V.; Hubrig, S.; Sarkar, G. High-resolution spectroscopy of the high-velocity hot post-AGB star IRAS 18379-1707 (LS 5112). Mon. Not. R. Astron. Soc. 2020, 491, 4829–4842. [Google Scholar]
  24. Smith, V.V.; Lambert, D.L. High-Resolution Spectroscopy of V1853 Cygni (LS II +34°26): Birth of a Planetary Nebula? Astrophys. J. 1994, 424, L123–L126. [Google Scholar] [CrossRef]
  25. Arkhipova, V.P.; Klochkova, V.G.; Chentsov, E.L.; Esipov, V.F.; Ikonnikova, N.P.; Komissarova, G.V. Spectroscopy and photometry of the protoplanetary nebula candidate StHα62 = IRAS 07171+1823. Astron. Lett. 2007, 32, 661–670. [Google Scholar]
  26. Ikonnikova, N.P.; Parthasarathy, M.; Shaposhnikov, I.A.; Hubrig, S.; Sarkar, G. High-resolution spectroscopy of the variable hot post-AGB star LS 4331 (IRAS 17381-1616). J. Astrophys. Astr. 2024, 45, 27. [Google Scholar]
  27. Luridiana, V.; Morisset, C.; Shaw, R.A. PyNeb: A new tool for analyzing emission lines. I. Code description and validation of results. Astron. Astrophys. 2015, 573, A42. [Google Scholar]
  28. Straižys, V. Metal-Deficient Stars; Mokslas: Vilnius, Lithuania, 1982; pp. 298–299. [Google Scholar]
  29. Herrero, A.; Parthasarathy, M.; Simón-Díaz, S.; Hubrig, S.; Sarkar, G.; Muneer, S. Analysis of absorption lines in the high-resolution spectra of five hot post-AGB candidates. Mon. Not. R. Astron. Soc. 2020, 494, 2117–2130. [Google Scholar]
  30. Arkhipova, V.P.; Ikonnikova, N.P.; Noskova, R.I.; Komissarova, G.V. Photometric Variability of the Protoplanetary Nebula LS IV-12°111. Astron. Lett. 2002, 28, 257–260. [Google Scholar]
  31. Turner, D.G.; Drilling, J.S. LSII +34 26, an unusual B supergiant located near the outer edge of the galaxy. Publ. Astron. Soc. Pac. 1984, 96, 292–296. [Google Scholar]
  32. Arkhipova, V.P.; Ikonnikova, N.P.; Noskova, R.I.; Komissarova, G.V.; Klochkova, V.G.; Esipov, V.F. Photometric Variability and Spectral Features of the Protoplanetary Nebula LS II+34°26 = V1853 Cyg. Astron. Lett. 2001, 27, 719–727. [Google Scholar]
  33. Arkhipova, V.P.; Esipov, V.F.; Ikonnikova, N.P.; Komissarova, G.V.; Noskova, R.I. Variability and rapid evolution of the protoplanetary object IRAS 18062 + 2410 = V886 her. Astron. Lett. 2007, 33, 604–614. [Google Scholar]
  34. Arkhipova, V.P.; Ikonnikova, N.P.; Noskova, R.I.; Komissarova, G.V.; Esipov, V.F. Photometric Variability and Spectrum of the Post-AGB Candidate IRAS 19200+3457. Astron. Lett. 2004, 30, 779–784. [Google Scholar]
  35. Arkhipova, V.P.; Burlak, M.A.; Esipov, V.F.; Ikonnikova, N.P.; Komissarova, G.V. Nonstationarity of hot post-AGB objects: Variations of the brightness and spectrum of IRAS 01005+7910, IRAS 22023+5249, and IRAS 22495+5134. Astron. Lett. 2013, 39, 619–633. [Google Scholar]
  36. Handler, G. Variable central stars of young Planetary Nebulae. A photometric study of the central star of M 2-54. Astron. Astrophys. Suppl. 1999, 135, 493–498. [Google Scholar] [CrossRef]
  37. Arkhipova, V.P.; Burlak, M.A.; Esipov, V.F.; Ikonnikova, N.P.; Kniazev, A.Y.; Komissarova, G.V.; Tekola, A. Variability and possible rapid evolution of the hot post-AGB stars Hen 3-1347, Hen 3-1428, and LSS 4634. Astron. Lett. 2014, 40, 485–498. [Google Scholar] [CrossRef]
  38. Arkhipova, V.P.; Parthasarathy, M.; Ikonnikova, N.P.; Ishigaki, M.; Hubrig, S.; Sarkar, G.; Kniazev, A.Y. Line identification and photometric history of the hot post-AGB star Hen 3-1013 (IRAS 14331-6435). Mon. Not. R. Astron. Soc. 2018, 481, 3935–3952. [Google Scholar] [CrossRef]
  39. Hrivnak, B.J.; Henson, G.; Hillwig, T.C.; Lu, W.; Nault, K.A.; Volk, K. Variability in Protoplanetary Nebulae: VII. Light-curve Studies of Five Medium-bright, Oxygen-rich, or Mixed-chemistry Post-AGB/Post-RGB Objects. Astrophys. J. 2020, 901, 9. [Google Scholar] [CrossRef]
  40. García-Lario, P.; Parthasarathy, M.; de Martino, D.; Sanz Fernandez de Cordoba, L.; Monier, R.; Manchado, A.; Pottasch, S.R. A multiwavelength study of LS II+34 26: A hot post-AGB star in the process of becoming a planetary nebula. Astron. Astrophys. 1997, 326, 1103–1110. [Google Scholar]
  41. Klochkova, V.G.; Yushkin, M.V.; Miroshnichenko, A.S.; Panchuk, V.E.; Bjorkman, K.S. Discovery of spectral variation in the optical counterpart of IRAS 01005+7910. Astron. Astrophys. 2002, 392, 143–150. [Google Scholar] [CrossRef]
  42. Mello, D.R.C.; Daflon, S.; Pereira, C.B.; Hubeny, I. Chemical abundances of hot post-AGB stars. Astron. Astrophys. 2012, 543, A11. [Google Scholar] [CrossRef]
  43. Gauba, G.; Parthasarathy, M. UV(IUE) spectra of hot post-AGB candidates. Astron. Astrophys. 2003, 407, 1007–1020. [Google Scholar] [CrossRef]
  44. Green, G.M.; Schlafly, E.; Zucker, C.; Speagle, J.S.; Finkbeiner, D. A 3D Dust Map Based on Gaia, Pan-STARRS 1, and 2MASS. Astrophys. J. 2019, 887, 93. [Google Scholar] [CrossRef]
  45. Gaia Collaboration; Vallenari, A.; Brown, A.G.A.; Prusti, T.; de Bruijne, J.H.J.; Arenou, F.; Babusiaux, C.; Biermann, M.; Creevey, O.L.; Ducourant, C.; et al. Gaia Data Release 3. Summary of the content and survey properties. Astron. Astrophys. 2023, 674, A1. [Google Scholar]
  46. Bailer-Jones, C.A.L.; Rybizki, J.; Fouesneau, M.; Demleitner, M.; Andrae, R. Estimating Distances from Parallaxes. V. Geometric and Photogeometric Distances to 1.47 Billion Stars in Gaia Early Data Release 3. Astron. J. 2021, 161, 147. [Google Scholar]
Figure 1. Light curves in the V band. The average error bar is 0 . m 006 and does not exceed the size of the symbols.
Galaxies 13 00031 g001
Figure 2. A U B versus B V color–color diagram. The colors of IRAS 21546+4721, observed and dereddened with E ( B V ) = 0.45 mag, are shown as black and gray dots, respectively. The solid line represents the supergiant sequence. The dashed lines correspond to theoretical U B , B V relations for emitting plasma: (1) optically thin in the Balmer continuum with T e = 10,000 K, N e = 10 10 cm−3, and (2) optically thick with T e = 15,000 K. The relations are taken from Chalenko [20].
Galaxies 13 00031 g002
Figure 3. A plot showing the color index versus the brightness index. A clear trend is seen: the object is redder in U B and V R C and bluer in B V and R C I C when fainter.
Galaxies 13 00031 g003
Figure 4. Low-resolution spectrum taken on 10 February 2025.
Galaxies 13 00031 g004
Figure 5. H α region with [N II] 6548, 6583 Å lines (left panel, see also Figure 4 for the full profile) and H β (right panel) profile in the 2020 and 2025 spectra.
Galaxies 13 00031 g005
Figure 6. Diagnostic diagram for IRAS 21546+4721 from the 2025 spectroscopic data.
Galaxies 13 00031 g006
Table 1. Magnitudes of comparison stars.
2MASS ID U ± σ U B ± σ B V ± σ V R C ± σ R C I C ± σ I C
J21561343+474345113.51 ± 0.1413.255 ± 0.02812.996 ± 0.01612.878 ± 0.01112.694 ± 0.010
J21562880+473515414.82 ± 0.1414.652 ± 0.03613.959 ± 0.01813.573 ± 0.01213.146 ± 0.010
J21564838+473226314.07 ± 0.1413.886 ± 0.02713.634 ± 0.01413.510 ± 0.01013.302 ± 0.012
J21571717+473916013.99 ± 0.1413.747 ± 0.03213.275 ± 0.01613.006 ± 0.01112.672 ± 0.009
Table 2. Log of spectroscopic observations.
DateMJDSlitExposureStandard
( )(s)
28 October 202059,150.91.0600BD+ 28°4211
11 February 202560,716.71.5900HIP 10512
Table 3. Summary of photometric study of IRAS 21546+4721 in 2020–2024.
BandMean MagnitudePeak-to-Peak Amplitude σ
(mag)(mag)(mag)
U13.6910.3760.016
B14.4000.3340.009
V14.1830.3500.006
R C 13.8470.3130.008
I C 13.7380.3580.008
Table 4. Emission line properties in the spectrum of IRAS 21546+4721. Columns provide: (1) line identification; (2–3) laboratory and observed wavelengths; (4–5) relative intensities and EWs for two epochs (2020-10-28, left of comma; 2025-02-10, right of comma) and (6) heliocentric velocity.
Identification λ lab . λ obs . I/I(H β )· 100EW V r
(Å)(Å) (Å)(km s−1)
[O II]3727-37293724.829.9, 36.95.9, 6.6blend
H I3889.063887.24.0, 4.20.7, 0.8−143.7
H I4101.734099.715.1, 15.82.9, 2.9−148.7
H I4340.474338.234.7, 35.57.2, 7.7−156.8
H I4861.354859.3100.0, 100.022.8, 23.3−126.4
[N II]5754.595752.02.9, 2.50.7, 0.6−134.9
He I5875.625873.81.2, 1.40.3, 0.4−92.9
[O I]6300.306297.43.7, 3.81.2, 1.6−138.2
[O I]6363.786360.81.3, 1.20.4, 0.5−140.2
[N II]6548.056545.052.1, 49.717.0, 18.2−139.6
H I6562.796559.7517.1, 461.6169.3, 166.7−141.2
[N II]6583.456580.3165.7, 152.954.5, 55.6−143.4
[S II]6716.446713.32.5, 2.31.0, 0.9−140.2
[S II]6730.826727.74.9, 4.51.7, 1.8−138.8
He I7065.197061.81.4, 0.70.5, 0.3−143.8
[O II]7319.997316.512.9, 11.85.2, 5.8−142.9
[O II]7330.197326.811.1, 9.24.5, 4.9−138.6
Disclaimer/Publisher’s Note: The statements, opinions and data contained in all publications are solely those of the individual author(s) and contributor(s) and not of MDPI and/or the editor(s). MDPI and/or the editor(s) disclaim responsibility for any injury to people or property resulting from any ideas, methods, instructions or products referred to in the content.

