Article

AS 314: A Massive Dusty Hypergiant or a Low-Mass Post-Asymptotic Giant Branch Object?

by
Aigerim Bakhytkyzy
1,*,
Anatoly S. Miroshnichenko
2,3,
Valentina G. Klochkova
4,
Vladimir E. Panchuk
4,
Sergey V. Zharikov
5,
Laurent Mahy
6,
Hans Van Winckel
7,
Aldiyar T. Agishev
1 and
Serik A. Khokhlov
1
1
Faculty of Physics and Technology, Al-Farabi Kazakh National University, Al-Farabi Ave., 71, Almaty 050040, Kazakhstan
2
Department of Physics and Astronomy, University of North Carolina—Greensboro, Greensboro, NC 27402, USA
3
Fesenkov Astrophysical Institute, Observatory, 23, Almaty 050020, Kazakhstan
4
Special Astrophysical Observatory of the Russian Academy of Sciences, Nizhnyj Arkhyz, Zelenchukskiy Region, Karachai-Cherkessian Republic 369167, Russia
5
Instituto de Astronomía, Universidad Nacional Autónoma de Mexico, AP 106, Ensenada 22800, BC, Mexico
6
Royal Astronomical Observatory Belgium, Av. Circulaire 3, 1180 Uccle, Belgium
7
Instituut Voor Sterrenkunde, KU Leuven, Celestijnenlaan 200D Bus 2401, 3001 Leuven, Belgium
*
Author to whom correspondence should be addressed.
Galaxies 2025, 13(2), 17; https://doi.org/10.3390/galaxies13020017
Submission received: 28 December 2024 / Revised: 19 February 2025 / Accepted: 25 February 2025 / Published: 28 February 2025
(This article belongs to the Special Issue Circumstellar Matter in Hot Star Systems)

Abstract

:
AS 314 (V452 Sct) is a poorly studied early-type emission-line star, which exhibits an infrared excess at wavelengths longer than 10 μ m. Its earlier studies have been limited to small amounts of observational data and led to controversial conclusions about its fundamental parameters and evolutionary status. Comparison of high-resolution spectra of AS 314 taken over 20 years ago with those of Luminous Blue Variables and other high-luminosity objects suggested its observed properties can be explained by a strong stellar wind from a distant (D∼10 kpc) massive star, possibly in a binary system. However, a recent assessment of its low-resolution spectrum along with a new distance from a Gaia parallax (∼1.6 kpc) resulted in an alternative hypothesis that AS 314 is a low-mass post-asymptotic giant branch (post-AGB) star. The latter hypothesis ignored the high-resolution data, which gave rise to the former explanation. We collected over 30 mostly high-resolution spectra taken in 1997–2023, supplemented them with results of long-term photometric surveys, compared the spectra and the spectral energy distribution with those of post-AGB objects and B/A supergiants, and concluded that the observed properties AS 314 are more consistent with those of the latter.

1. Introduction

AS 314 (V452 Sct, LS 5107, BD 13 5061 ) is a ∼10 mag star in Scutum. The presence of a strong H α line in emission was discovered in the course of the Mount Wilson Observatory survey by Merrill and Burwell [1]. In a number of subsequent papers (e.g., [2,3]), the star was classified as a B– or A–type supergiant from optical photometry or low-resolution spectroscopy. Miroshnichenko et al. [4] obtained three high-resolution optical spectra, which supported the previous luminosity assessments and suggested a distance of D 10 kpc to the object. This study also found that the spectral energy distribution (SED) of AS 314 exhibits an IR excess at wavelengths over 10 μ m that is similar to those of some Luminous Blue Variables (LBVs). Chentsov et al. [5] compared high-resolution spectra of AS 314 with those of a few other supergiants and LBV candidates (e.g., HD 160529, HD 168607, HD 168625, and HD 183143) and found many similarities between them. At the same time, the large distance is not well constrained and is mostly based on an interstellar extinction law, which was poorly known at that time.
Alternatively, Venn et al. [6] suggested that AS 314 was a misclassified Be star due to a double-peaked H α profile and broad emission features around a few sharp metal lines. Also, a Gaia DR3 parallax measurement was converted to a distance of D = 1 . 61 0.32 + 0.37 kpc [7]. A similar result from Gaia DR2 ( D = 1 . 50 0.14 + 0.18 kpc) prompted Smith et al. [8] to recalculate the luminosity of AS 314 to log (L/L) = 3.5 and suggest that it is an intermediate-mass post-AGB star and not related to LBVs.
Parthasarathy et al. [9] included AS 314 in a list of post-AGB candidates due to a high heliocentric radial velocity (RV) ( 76.7 ± 8.3 km s−1 listed with a plus sign in Gaia DR2, [10]). These authors did not mention previous spectroscopic studies of AS 314 [4,5], but referred to post-AGB or planetary nebula-like far-IR colors. Mahy et al. [11] measured RVs of selected absorption lines in nine high-resolution spectra of AS 314 taken between 2016 and 2020, found irregular RV variations from −40 km s−1 to −62 km s−1, and concluded that the object is not a binary system without addressing the evolutionary status.
The history of studies of AS 314 summarized above does not provide a conclusive assessment of its nature and evolutionary status. A confusion between the observed properties of dusty massive early-type supergiants and intermediate-/low-mass post-AGB stars has been known for years (e.g., [12]). A careful investigation of as many object’s properties as possible is needed to resolve the problem. Here, we report the results of our study of photometric and spectral properties of AS 314 derived from long-term observations taken in the last ∼25 years. Our goals included a search for periodic or cyclic variations in the object’s brightness and/or spectral line positions as signs of possible binarity as well as a better understanding of its nature through more careful comparison of the spectral properties with both high-luminosity supergiants and post-AGB objects.

2. Observations

We collected optical spectroscopic data taken for AS 314 in 1997–2023. A total of 34 spectra were taken at the facilities listed in Table 1. The spectra were extracted from the raw 2D images using échelle tasks in the MIDAS (OAN SPM, ESO, ORLM, SAO) or IRAF 2.16 (McD, TCO) software (for details see the papers on individual instruments referenced in Table 1 caption). Each spectrum typically consists of several exposures, which are summed up during the data reduction process. The latter includes bias subtraction, spectral order separation, and wavelength calibration using spectra of a ThAr lamp.
Photometric data were taken from Miroshnichenko et al. [4] ( U to L–bands), the ASAS–3 database (V–band, 2000–2009, [20]), and the ASAS SN Photometry Database ( V and g–bands, 2015–2024, [21]). Infrared data were obtained from several space-based missions, such as IRAS [22], WISE [23], MSX [24], and AKARI [25].

3. Results

3.1. SED Modeling

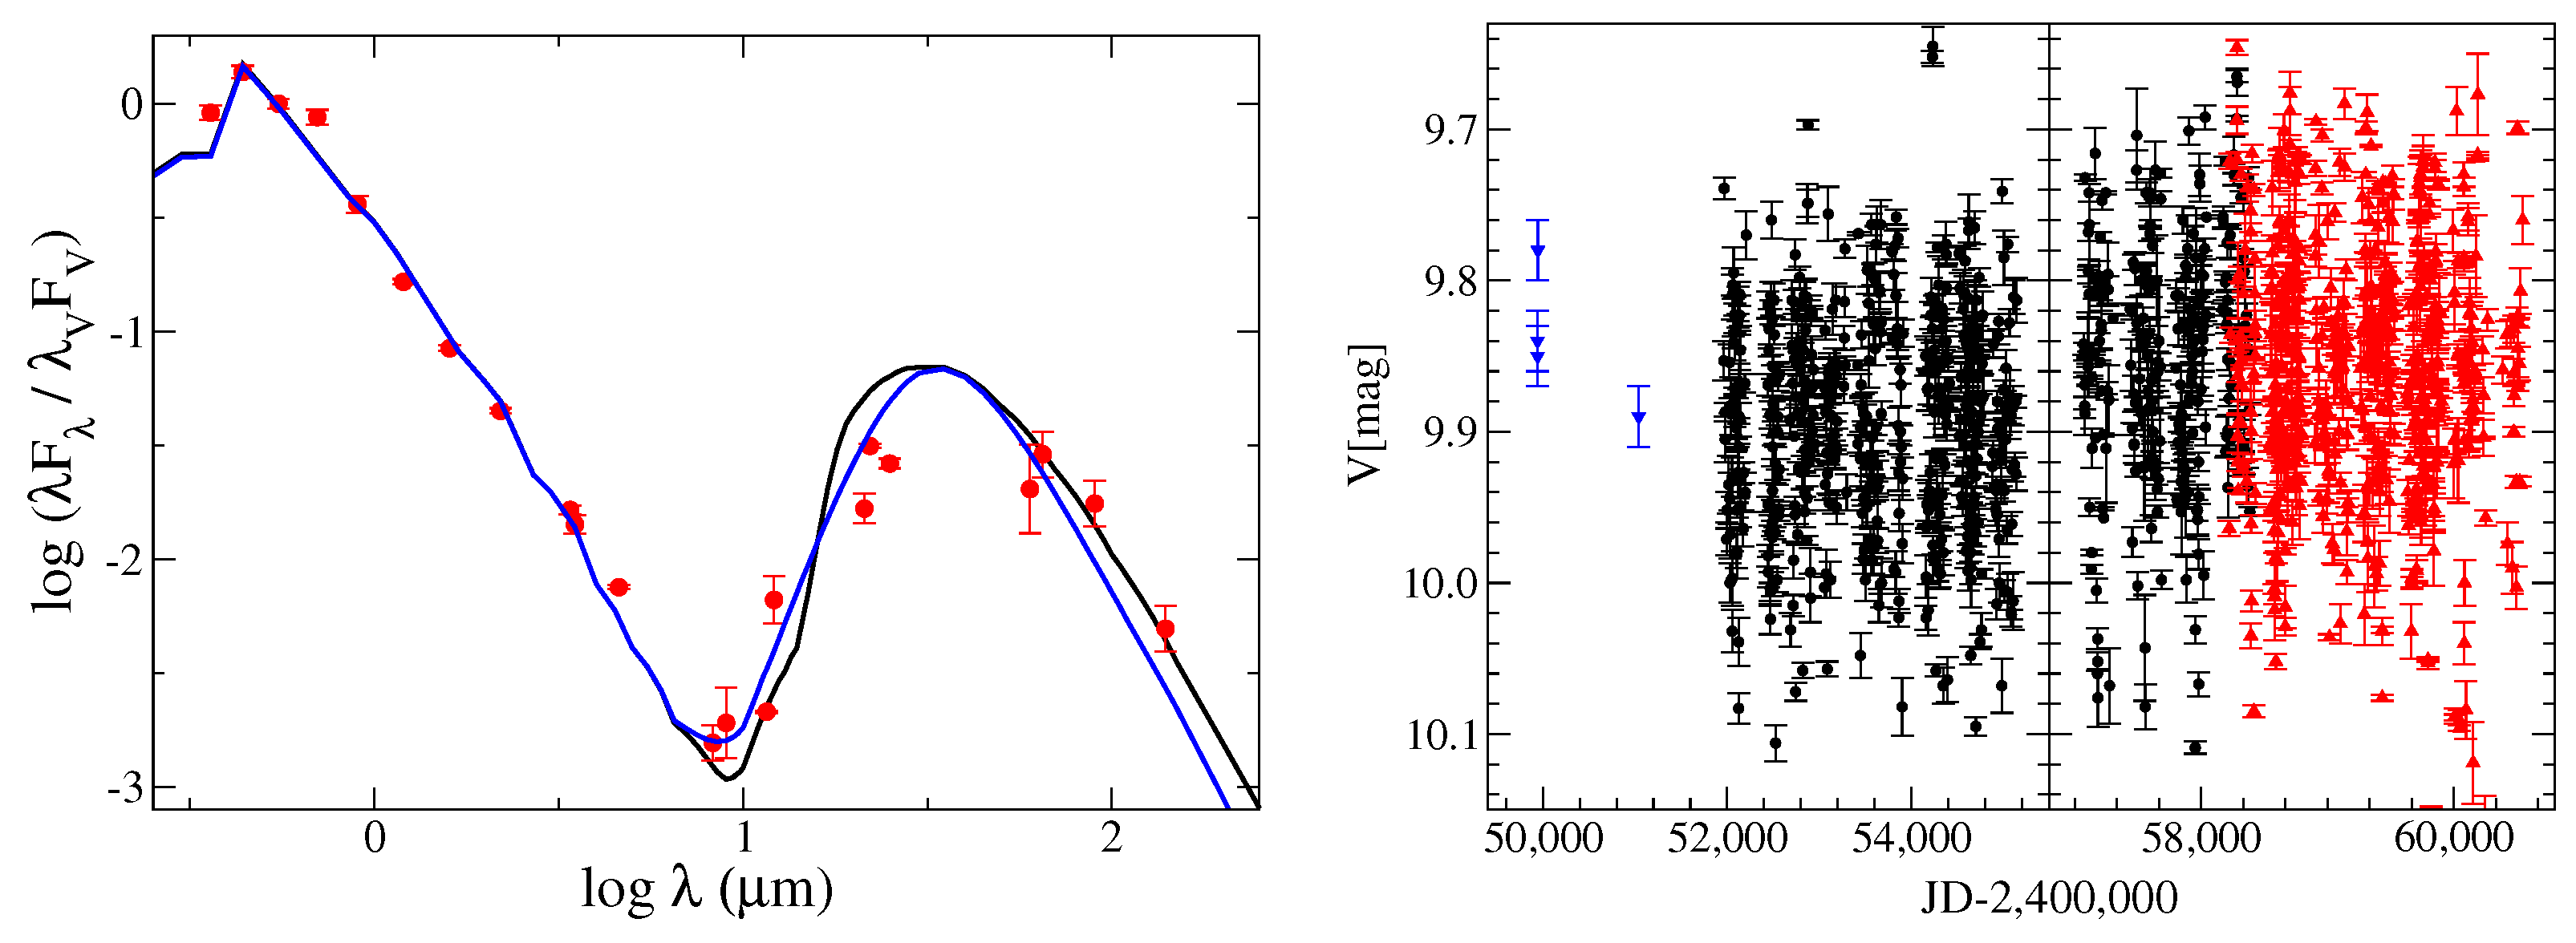
The light curve of AS 314 (see Figure 1, right panel) exhibits minor variability in the V–band, likely due to pulsations or variable stellar wind. Fourier analyses of both ASAS–3 and ASAS SN light curves show no signs of periodic variations. The absence of significant long-term trends or brightness variations suggests that AS 314 is in a relatively stable evolutionary phase. Therefore, the SED in the optical spectral region, where reddening is stronger than that in the IR region, is reliable.
The SED of AS 314 was shown in Miroshnichenko et al. [4] with an IR excess revealed from the IRAS data only. Such an excess produced by relatively cold (∼100 K) circumstellar dust is observed in SEDs of both LBVs and post-AGB objects and may be due to a strong mass-loss that occurred in the past. A detailed study of the object’s spectrum in [4,5] showed that the absorption lines are typical for an A0–type supergiant and that the interstellar reddening is E ( B V ) 0.9 mag. The latter was derived from both the optical photometry and the diffuse interstellar bands (DIBs). However, due to a scatter of the relationships between the DIB strengths and color excesses (e.g., [26]), the derived color excess can also be due to the total reddening, circumstellar and interstellar.
Figure 1. Left panel: SED of AS 314 corrected for the total reddening (E ( B V ) = 0.9 mag). Photometric data are shown by red circles with error bars calculated from the brightness uncertainties. Results of DUSTY modeling for a model atmosphere Teff = 10,000 K and log g = 2.0 [27] are shown by the solid lines (silicate dust—black line, graphite dust—blue line). The fluxes are normalized to that in the V–band, the wavelength scale is shown in microns. Right panel: V–band light curve of AS 314. Blue symbols show the data from Miroshnichenko et al. [4], black symbols show the data from ASAS–3 (left part) and ASAS SN (right part). Red symbols represent g–band data from ASAS SN shifted by 0.47 mag to match the V–band brightness level. The vertical bars show the uncertainties of the average brightness measurements taking during one night.
Galaxies 13 00017 g001
The presence of an IR excess may imply a circumstellar reddening and extinction that depends on whether the stellar radiation passes through the circumstellar material. In order to investigate this effect on the SED of AS 314, whose IR excess is better constrained with recent data from various IR missions (see Section 2), we modeled it using the code DUSTY [28]. The code and the underlying theory are described in [29].
DUSTY solves exactly the radiative transfer problem in both spherical and planar geometries taking full advantage of scaling. The following dust properties need to be specified: the temperature at the inner radius, the overall optical depth at an arbitrary wavelength, and the chemical composition of the dusty grains. Other input properties involve dimensionless, normalized profiles of the external (stellar) radiation, dust optical properties, and the dust density scale.
Since no IR spectra in the mid-IR region ( λ λ 10 50 μ m) have been reported in the literature, we cannot constrain the dust chemical composition and the grain size distribution. However, DUSTY allows using a variety of optical constants (absorption and scattering cross-sections) including mixtures of different types of grain. In our calculations, we used several grain mixtures, which included only graphite or silicate grains as well as their combinations with their different fractions (see [30] for description of this kind of modeling and sources of the cross-sections).
The relatively weak observed IR excess suggests a low optical depth of the dust. Nevertheless, we explored a range of optical depths from 0.05 to 1.0 and a range of dust temperatures at the envelope’s inner edge from 100 to 150 K. It turned out that similarly good fits to the observed SED can be obtained for most of the used grain mixtures with about the same optical depth (∼0.1) and inner temperatures. A radial density gradient of ρ r 2 was taken in all models. The grain size distribution was assumed to be typical for interstellar grains [31], in which grain radii (a) vary a 3.5 from 0.005 to 0.25 μ m.
Examples of good fits are shown in the left panel of Figure 1. The blue solid line represents a model with pure graphite dusty grains and an optical depth of 0.07, while the black solid line shows a model with pure silicate grains and an optical depth of 0.14. The main outcome of the SED modeling is that the circumstellar dust is optically thin. Therefore, the dust envelope geometry is irrelevant and nearly all the optical flux reddening is interstellar irrespective of how much dust is located on the line of sight.

3.2. Spectral Variations

The spectrum of AS 314 is variable. Temporal variations are observed in the equivalent widths and relative intensities of many spectral lines. The most substantial changes are evident in the Balmer lines, where the strength of the redshifted emission components as well as the depths and widths of the blueshifted absorption components of the P Cyg-type profiles vary noticeably (see left panel of Figure 2). In particular, the width of the absorption component is indicative of the terminal velocity of the stellar wind. Our data show that the latter varies between ∼150 and ∼200 km s−1.
The right panel of Figure 2 shows a significant difference in the Mg ii (4481 Å) and Si ii (6347 and 6371 Å) line profiles taken in 2016 and 2020. The broader and split Si ii lines seen in a higher-resolution 2020 HERMES spectrum might be attributed to several reasons, which include variable turbulence in the star’s atmosphere or even yet unconfirmed binarity.
The average RVs of several groups of purely absorption lines vary from 90 km s−1 to 25 km s−1 (see Figure 3), which is somewhat larger than the range found in previous studies (e.g., [11]). The variations may be attributed to intrinsic stellar activity, such as pulsations or episodic mass loss, rather than to orbital motion, as the lack of periodicity argues against the presence of a close companion. However, the latter possibility is still not excluded and requires spectral monitoring at various timescales.

4. Discussion

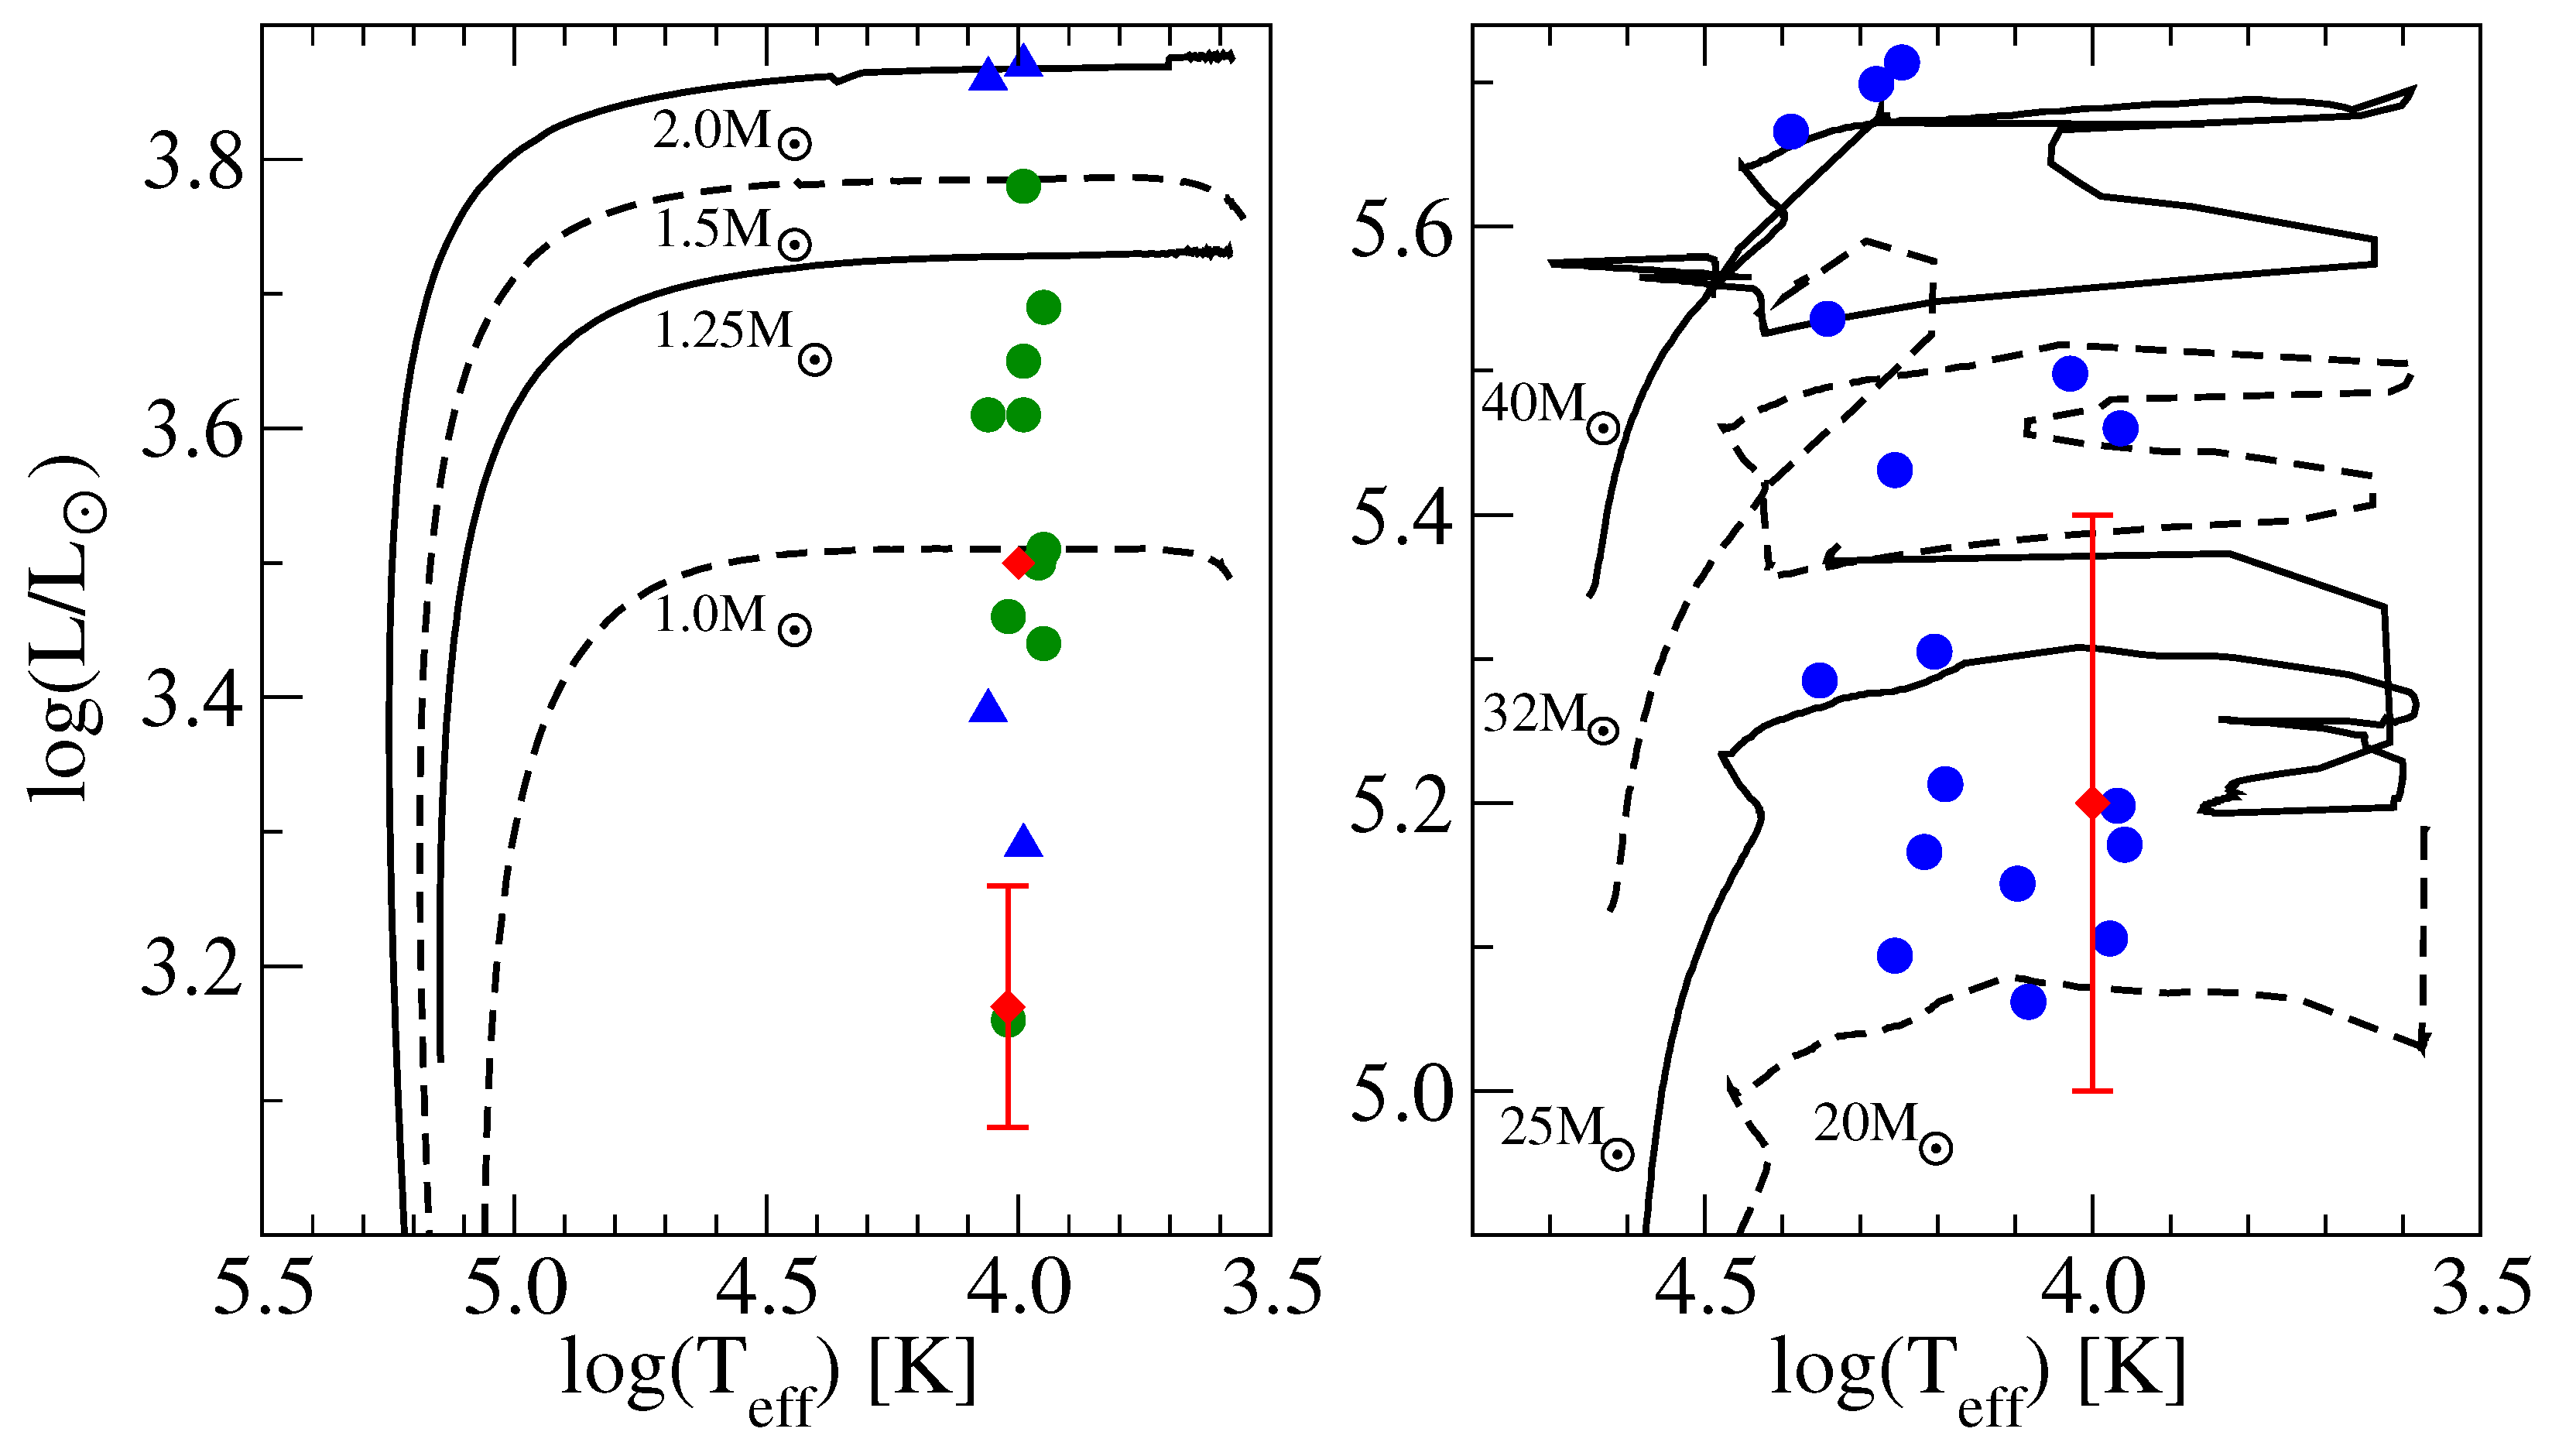
As mentioned above, the different distances of AS 314 suggest two alternative evolutionary scenarios. According to [8,9], the star should lie in a low-luminosity region of post-AGB evolutionary tracks and thus is a low-mass post-AGB star (see Figure 4). This suggestion is based on the Gaia distance and the IR excess produced by cold dust, which is typical of some post-AGB objects.
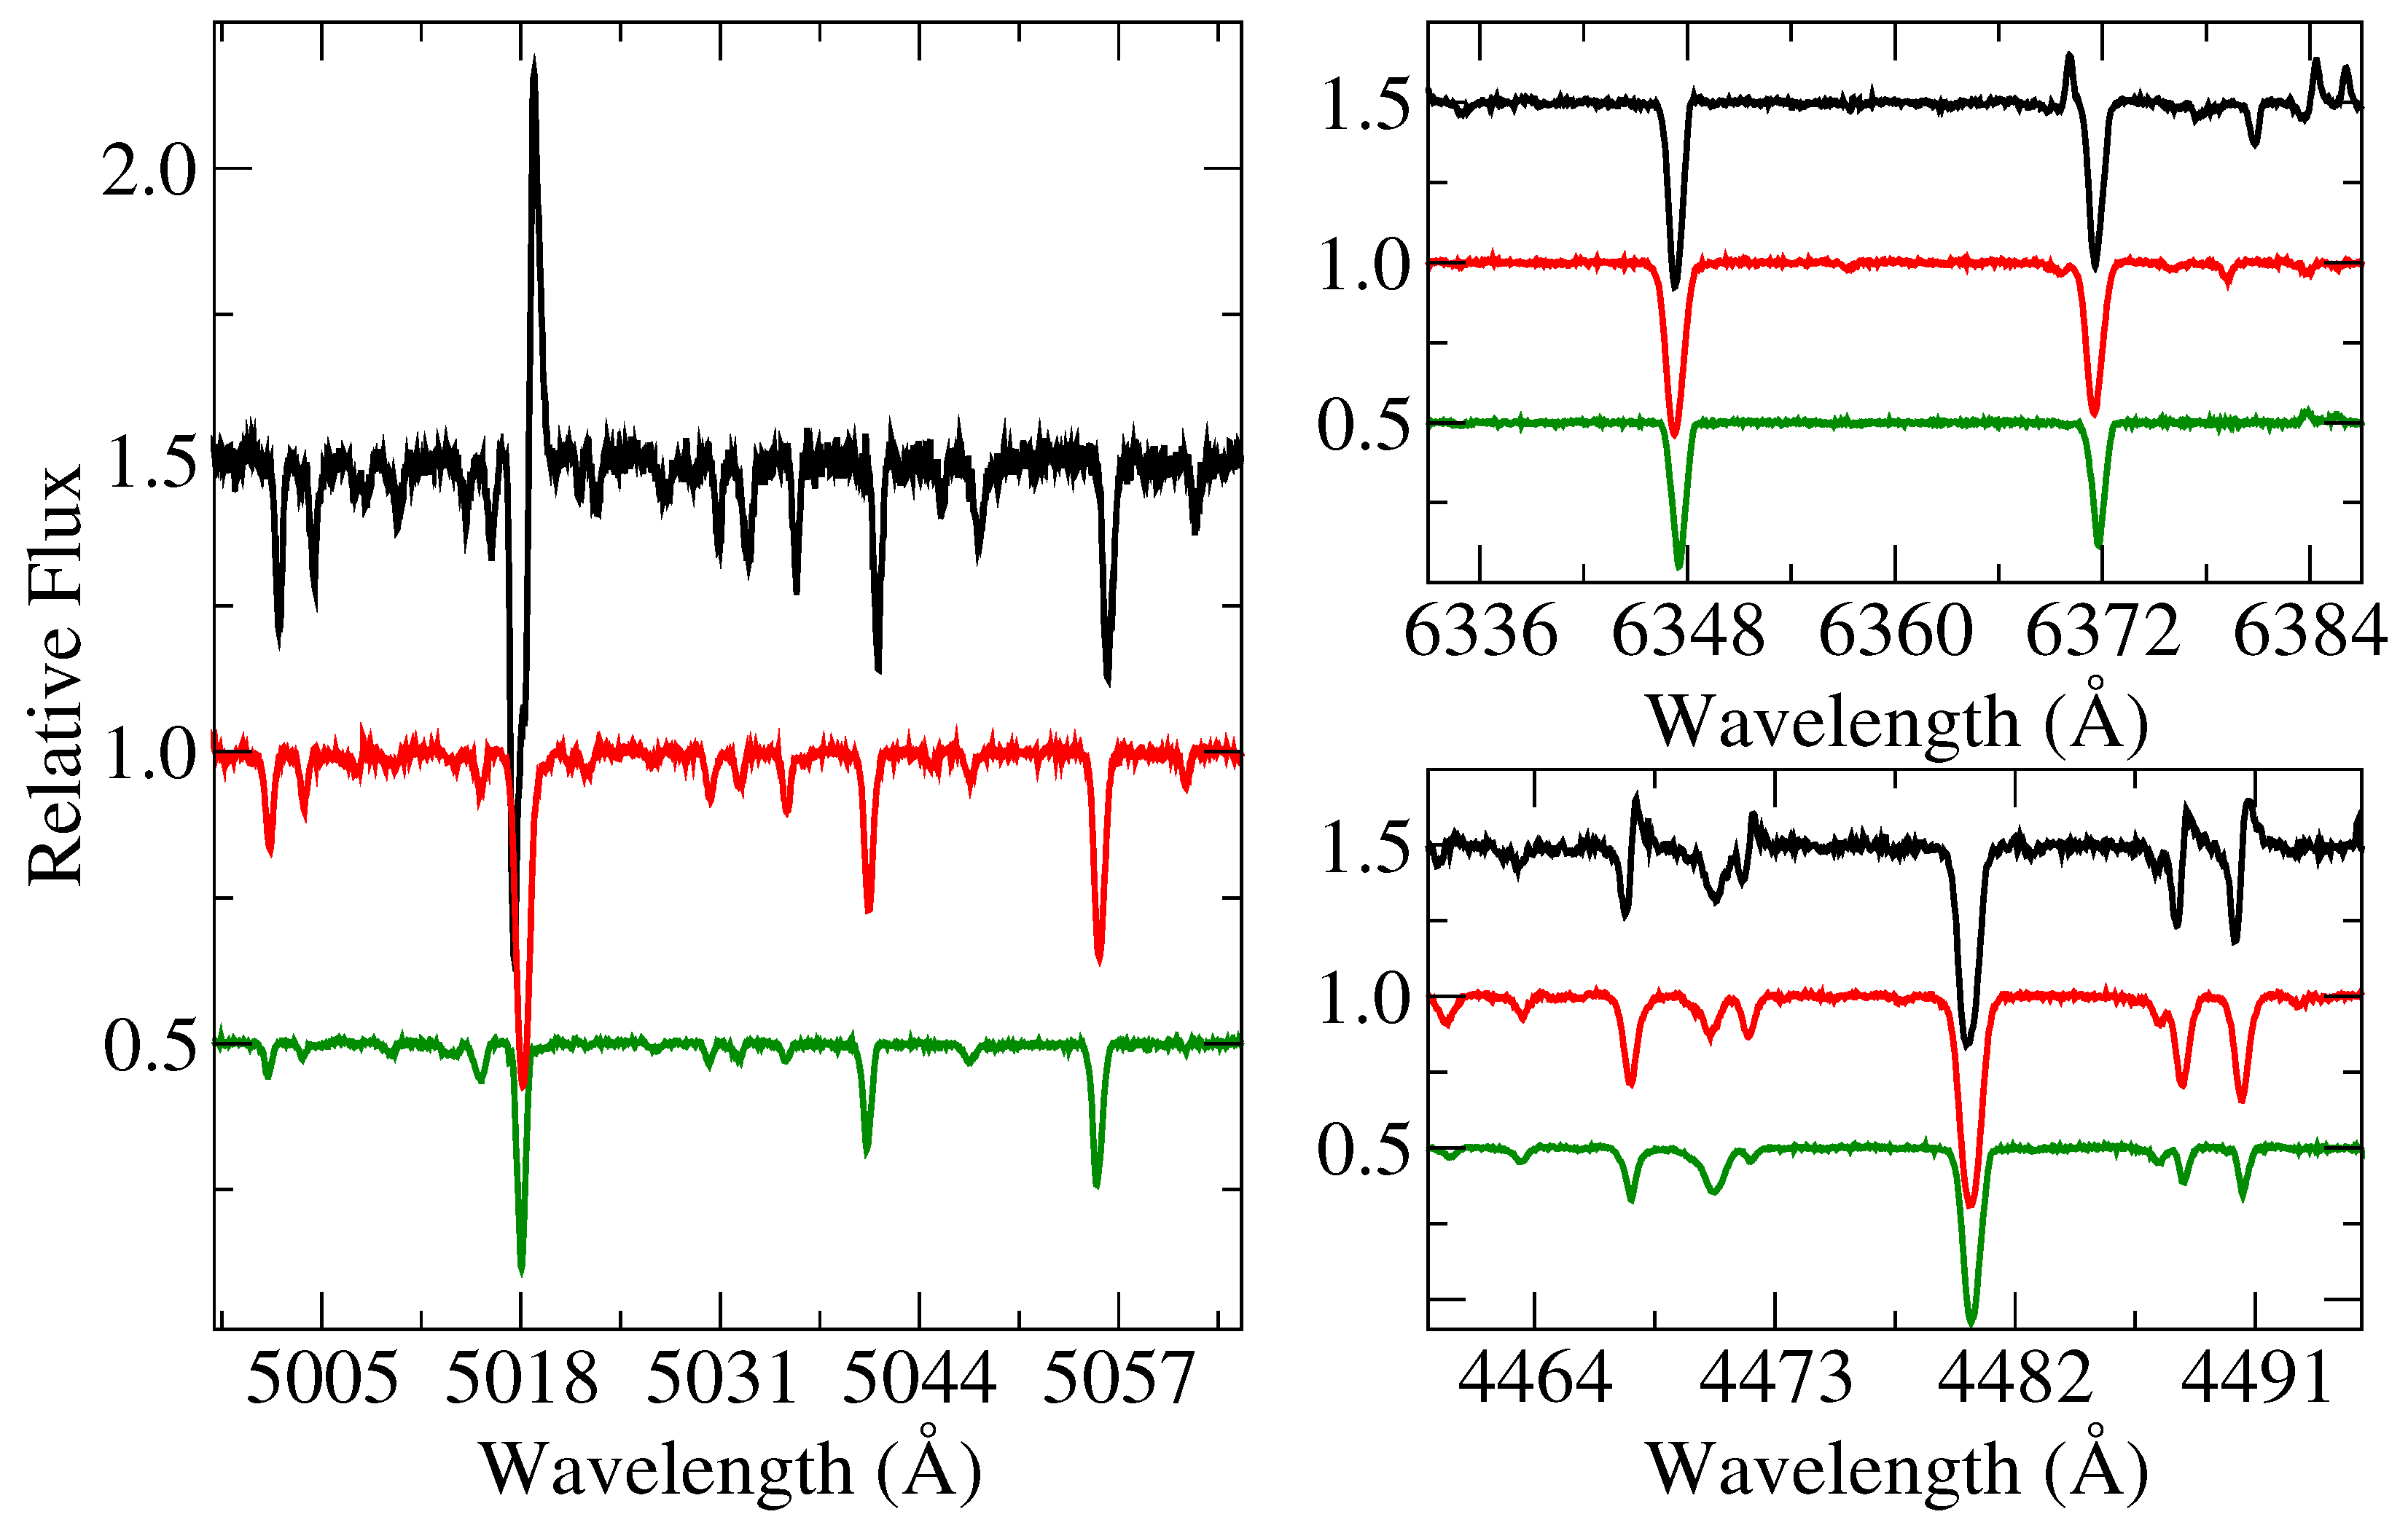
However, the spectrum of AS 314 differs significantly from those of such stars, which typically show chemical signatures of internal enrichment (e.g., the s–process elements enhancement [32] or, in a case of binaries, a strong depletion of most metals (cf. [33])). In particular, AS 314 exhibits emission components in numerous Fe ii lines (cf. [5]) and a strong emission in the Balmer lines, which are rare in low-temperature post-AGB stars. Also, comparison with a spectrum of an apparently single post-AGB star HD 172324 (see Figure 5), which has a similar Teff and a luminosity similar to that assigned to AS 314 from the Gaia distance (see Table 2), shows weaker Fe ii lines and a much weaker Balmer lines emission in the former. This particular comparison may not look convincing, but there are just a few post-AGB stars with such fundamental parameters. Additionally, it would be a very old star with a mass of ∼1 M irrespective of the initial metallicity and metallic absorption lines noticeably weaker than those in much younger massive supergiants.
In contrast, the results from Miroshnichenko et al. [4] suggest a much higher luminosity for AS 314, which places it in the area of massive stars, particularly in the LBV phase. Comparison with a spectrum of the much younger A-supergiant HD 91533, whose fundamental parameters (see Table 2) are very close to those of AS 314 derived in [4], further supports this suggestion (see Figure 5).
Also, the majority of post-AGB objects show weak and narrow H α emission lines, which are typically double-peaked (e.g., [33]). In contrast, the H α line in the spectrum of AS 314 is stronger than those in many massive and luminous supergiants (see, e.g., [34]) and only comparable to those of much hotter post-AGB objects (e.g., IRAS 01005+7910, Teff = 21,500 K, [35]).
Although the main argument for the high luminosity and the large distance of AS 314 is based on the comparison with spectra of the most luminous supergiants and LBVs, it is not unusual that distances toward stars and binary systems with circumstellar envelopes measured by Gaia differ from those estimated from spectroscopy. For instance, a Gaia EDR3 distance to the B[e] binary MWC 728 is D = 292 20 + 25 pc, while the one found from spectroscopy and consistent with the system’s evolutionary history is 1.0 kpc [36]. Such discrepancies may be due to the presence of a secondary companion or an asymmetric shape of the circumstellar matter that may affect motion of the object’s photocenter.
A Hertzsprung–Russell diagram shown in the right panel of Figure 4 includes evolutionary tracks for massive stars, showing that the high luminosity of AS 314 fits well within the evolutionary paths of LBVs. Although AS 314 has not exhibited an LBV-like optical brightening yet, its IR excess produced by distant cold circumstellar dust separates it from “normal” supergiants.
We note here that the luminosity of AS 314 derived in [4] versus those from [8,9] (see Table 2) is not just scaled by the different distances used, because the latter authors do not provide sufficient details to verify their results. Using the average V–band brightness, V = 9.85 ± 0.06 mag, from the ASAS data, E ( B V ) = 0.9 ± 0.1 mag, a bolometric correction for Teff 9500 ± 500 K (BCV = 0.4 mag [37]), and the Gaia EDR3 distance ( 1 . 61 0.32 + 0.37 kpc), one can calculate a luminosity of log L/L = 3.65 ± 0.35 . This value is within the uncertainty that coincides with that from [8].
Another line of support for the larger distance to AS 314 comes from the interstellar extinction law in the object’s direction provided by Green et al. [38], which was unavailable at the time of the distance estimate by Miroshnichenko et al. [4]. According to this new compilation, a reddening of E ( g r ) E ( B V ) 0.5 mag is reached at the Gaia distance to AS 314. It is significantly lower than the observed E ( B V ) 0.9 mag, which is reached at distances larger than 4.8 kpc. Therefore, our study currently tends to confirm the earlier results by Miroshnichenko et al. [4] and Chentsov et al. [5].
Figure 4. Left panel: HR diagram for “likely” (green) and “possible” (blue) post-AGB stars [39]. Evolutionary tracks were taken from Miller Bertolami [40], corresponding to an initial metallicity of Z = 0.02 and initial masses ranging from 1 to 4 M . Right panel: HR diagram for LBV stars (blue circles) [41]. The evolutionary tracks were taken from Ekström et al. [42] for single stars with initial masses ranging from 20 to 40 M . The positions of AS 314 are marked by the red symbols based on the parameters suggested in ([8,9], left panel) and in ([4], right panel).
Galaxies 13 00017 g004
Figure 5. Comparison of FEROS spectra of AS 314 (black), the supergiant HD 91533 (red), and HD 172324 (green). The wavelength scales of both spectra were shifted to the same rest frame for easier comparison.
Galaxies 13 00017 g005
Table 2. Stellar Characteristics.
ObjectE ( B V ) Sp.t.Teff (K) log ( L / L ) Ref.
HD 915330.33A2Iab/b9100 ± 1505.171 ± 0.133[41]
HD 1723240.06A0Iabe10,0003.54[9]
AS3140.9A0 ia+90005.2 ± 0.2[4]
AS314---3.5[8]
AS314--10,5003.17 ± 0.09[9]
AS314-B9 iae10,500-[43]
Column information: 1—Star ID, 2—Color excess E ( B V ) , 3—Spectral type, 4—Effective temperature, 5—Bolometric luminosity in solar units, 6—Reference to the source of the data.

5. Conclusions

Our study of photometric and spectroscopic data of AS 314, an emission-line star with a controversial evolutionary status, taken in the last ∼25 years yielded the following results. The star’s brightness level has been unchanged ( V = 9.85 ± 0.06 mag) with no signs of periodic variations. The IR excess constrained with the data from space-based missions shows the presence of cold circumstellar dust with a characteristic temperature of ∼90 K.
The optical spectrum is more similar to those of supergiants and LBVs than to post-AGB stars. We were unable to detect periodic variations of the absorption line positions using 34 spectra taken between 1997 and 2023, thus leaving open the question of the object’s binarity (typical for both LBVs and post-AGB stars). The interstellar reddening (E ( B V ) = 0.9 mag) points to a large ( D 5 kpc) distance toward the object and is inconsistent with the Gaia parallax measurements ( D 1.6 kpc).
We are planning a more detailed comparison of the observed properties of AS 314 with those of both evolved high-luminosity stars and post-AGB objects in order to arrive at a better justified conclusion on its nature and evolutionary status. Also, more frequent high-resolution spectroscopic observations on timescales of weeks and months would be needed to address the subject of the object’s binarity. An IR spectrum to reveal chemical composition of the circumstellar dust and imaging at a high spatial resolution or interferometry to try detecting a possible nebula would be just as important for further investigation of this unusual object.

Author Contributions

Observations, A.S.M., L.M., S.V.Z., V.G.K. and V.E.P.; Data reduction, A.S.M., L.M., S.V.Z. and V.G.K.; Data analysis, A.B., A.S.M., A.T.A. and V.G.K.; Software A.B., A.S.M. and S.V.Z.; writing—original draft preparation A.B. and A.S.M.; writing—review and editing A.B., A.S.M., V.G.K., H.V.W., S.A.K. and S.V.Z. All authors have read and agreed to the published version of the manuscript.

Funding

This research was funded by the Science Committee of the Ministry of Science and Higher Education of the Republic of Kazakhstan (Grant No. AP23484898). S.V.Z. acknowledges PAPIIT grant IN119323. V.G.K and V.E.P. thank the Russian Science Foundation for financial support (grant no. 22–12–00069, https://rscf.ru/project/22-12-00069/ (accessed on 24 February 2025)).

Data Availability Statement

The HERMES spectra are available on request via email from laurent.mahy@oma.be. The TCO and SAO spectra are available on request via email at a_mirosh@uncg.edu. The FEROS spectrum is available online from http://archive.eso.org/scienceportal/ (accessed on 24 February 2025), programs ID: 091.D–0221 and 097.A.–9039.

Acknowledgments

This research has made use of the SIMBAD database, operated at CDS, Strasbourg, France; SAO/NASA ADS, ASAS, and Gaia data products. This paper is partly based on observations obtained at the 2.1 m telescope of the Observatorio Astronómico Nacional San Pedro Martir (Baja California, Mexico), the 2.1 m Otto Struve Telescope at the McDonald Observatory (Texas, USA), the Mercator Telescope, operated on the island of La Palma by the Flemish Community, at the Spanish Observatorio del Roque de los Muchachos of the Instituto de Astrofísica de Canarias, and the 0.81 m of the Three College Observatory (North Carolina, USA). A.M. acknowledges technical support from Dan Gray (Sidereal Technology company), Joshua Haislip (University of North Carolina Chapel Hill), and Mike Shelton (University of North Carolina Greensboro) as well as funding from the UNCG College of Arts and Sciences and Department of Physics and Astronomy.

Conflicts of Interest

The authors declare no conflicts of interest.

Abbreviations

The following abbreviations are used in this manuscript: RV—radial velocity, R—spectral resolving power, TCO—Three College Observatory, SED—spectral energy distribution, LBV—Luminous Blue Variable.

References

  1. Merrill, P.W.; Burwell, C.G. Additional Stars whose Spectra have a Bright H α Line. APJ 1950, 112, 72. [Google Scholar] [CrossRef]
  2. Hiltner, W.A.; Iriarte, B. Photometric and Spectroscopic Studies of Early-Type Stars Between Galactic Longitude L = 338° and L = 33°. APJ 1955, 122, 185. [Google Scholar] [CrossRef]
  3. Kozok, J.R. Distances, reddenings and distribution of emission B-stars in the galactic centre region L <= 45. A&A Suppl. Ser. 1985, 62, 7–16. [Google Scholar]
  4. Miroshnichenko, A.S.; Chentsov, E.L.; Klochkova, V.G. AS 314: A dusty A-type hypergiant. A&A Suppl. Ser. 2000, 144, 379–389. [Google Scholar] [CrossRef]
  5. Chentsov, E.L.; Ermakov, S.V.; Klochkova, V.G.; Panchuk, V.E.; Bjorkman, K.S.; Miroshnichenko, A.S. An atlas of spectra of B6-A2 hypergiants and supergiants from 4800 to 6700 Å. A&A 2003, 397, 1035–1042. [Google Scholar] [CrossRef]
  6. Venn, K.A.; Smartt, S.J.; Lennon, D.J.; Dufton, P.L. New identifications for blue objects towards the Galactic center: Post-AGB stars, Be/disk stars and others. A&A 1998, 334, 987–999. [Google Scholar]
  7. Bailer-Jones, C.A.L.; Rybizki, J.; Fouesneau, M.; Demleitner, M.; Andrae, R. Estimating Distances from Parallaxes. V. Geometric and Photogeometric Distances to 1.47 Billion Stars in Gaia Early Data Release 3. AJ 2021, 161, 147. [Google Scholar] [CrossRef]
  8. Smith, N.; Aghakhanloo, M.; Murphy, J.W.; Drout, M.R.; Stassun, K.G.; Groh, J.H. On the Gaia DR2 distances for Galactic luminous blue variables. Mon. Not. R. Astron. Soc. 2019, 488, 1760–1778. [Google Scholar] [CrossRef]
  9. Parthasarathy, M.; Matsuno, T.; Aoki, W. Gaia DR2 data and the evolutionary status of eight high-velocity hot post-AGB candidates. Publ. Astron. Soc. Jpn. 2020, 72, 99. [Google Scholar] [CrossRef]
  10. Gaia Collaboration; Brown, A.G.A.; Vallenari, A.; Prusti, T.; de Bruijne, J.H.J.; Babusiaux, C.; Bailer-Jones, C.A.L.; Biermann, M.; Evans, D.W.; Eyer, L.; et al. Gaia Data Release 2. Summary of the contents and survey properties. A&A 2018, 616, A1. [Google Scholar] [CrossRef]
  11. Mahy, L.; Lanthermann, C.; Hutsemékers, D.; Kluska, J.; Lobel, A.; Manick, R.; Miszalski, B.; Reggiani, M.; Sana, H.; Gosset, E. Multiplicity of Galactic luminous blue variable stars. A&A 2022, 657, A4. [Google Scholar] [CrossRef]
  12. Klochkova, V.G.; Chentsov, E.L. The Problem of Spectral Mimicry of Supergiants. Astron. Rep. 2018, 62, 19–30. [Google Scholar] [CrossRef]
  13. Contarini, G.; Gratton, R. The Instrumental Profile and Straylight in the REOSC Ekar Echelle Spectrograph. In Proceedings of the European Southern Observatory Conference and Workshop Proceedings, La Serena, Chile, 21–24 January 1992; Volume 42, p. 737. [Google Scholar]
  14. Panchuk, V.E.; Klochkova, V.G.; Yushkin, M.V. The high-resolution Echelle Spectrograph of the 6-m telescope of the special astrophysical observatory. Astron. Rep. 2017, 61, 820–831. [Google Scholar] [CrossRef]
  15. Panchuk, V.E.; Najdenov, I.D.; Klochkova, V.G.; Ivanchik, A.B.; Yermakov, S.V.; Murzin, V.A. On the problem of high spectral resolution observations of faint objects. Bull. Spec. Astrophys. Obs. 1997, 44, 127–131. [Google Scholar]
  16. Panchuk, V.E.; Klochkova, V.G.; Galazutdinov, G.A.; Ryadchenko, V.P.; Chentsov, E.L. An echelle spectrometer with a CCD array for the 6-m telescope. Astron. Lett. 1993, 19, 431–434. [Google Scholar]
  17. McCarthy, J.K.; Sandiford, B.A.; Boyd, D.; Booth, J. The Sandiford 2.1 M Cassegrain Echelle Spectrograph for McDonald Observatory: Optical and Mechanical Design and Performance. Publ. Astron. Soc. Pac. 1993, 105, 881. [Google Scholar] [CrossRef]
  18. Kaufer, A.; Stahl, O.; Tubbesing, S.; Nørregaard, P.; Avila, G.; Francois, P.; Pasquini, L.; Pizzella, A. Commissioning FEROS, the new high-resolution spectrograph at La-Silla. Messenger 1999, 95, 8–12. [Google Scholar]
  19. Raskin, G.; van Winckel, H.; Hensberge, H.; Jorissen, A.; Lehmann, H.; Waelkens, C.; Avila, G.; de Cuyper, J.P.; Degroote, P.; Dubosson, R.; et al. HERMES: A high-resolution fibre-fed spectrograph for the Mercator telescope. A&A 2011, 526, A69. [Google Scholar] [CrossRef]
  20. Pojmanski, G. The All Sky Automated Survey. Acta Astron. 1997, 47, 467–481. [Google Scholar]
  21. Kochanek, C.S.; Shappee, B.J.; Stanek, K.Z.; Holoien, T.W.S.; Thompson, T.A.; Prieto, J.L.; Dong, S.; Shields, J.V.; Will, D.; Britt, C.; et al. The All-Sky Automated Survey for Supernovae (ASAS-SN) Light Curve Server v1.0. Publ. Astron. Soc. Pac. 2017, 129, 104502. [Google Scholar] [CrossRef]
  22. Helou, G.; Walker, D.W. (Eds.) Infrared Astronomical Satellite (IRAS) Catalogs and Atlases. Volume 7: The Small Scale Structure Catalog; NASA: Washington, DC, USA, 1988; Volume 7. [Google Scholar]
  23. Cutri, R.M.; Wright, E.L.; Conrow, T.; Fowler, J.W.; Eisenhardt, P.R.M.; Grillmair, C.; Kirkpatrick, J.D.; Masci, F.; McCallon, H.L.; Wheelock, S.L.; et al. Explanatory Supplement to the AllWISE Data Release Products; NASA: Washington, DC, USA, 2013. [Google Scholar]
  24. Egan, M.P.; Price, S.D.; Kraemer, K.E.; Mizuno, D.R.; Carey, S.J.; Wright, C.O.; Engelke, C.W.; Cohen, M.; Gugliotti, M.G. VizieR Online Data Catalog: MSX6C Infrared Point Source Catalog. The Midcourse Space Experiment Point Source Catalog Version 2.3 (October 2003); NASA: Washington, DC, USA, 2003. [Google Scholar]
  25. Ishihara, D.; Onaka, T.; Kataza, H.; Salama, A.; Alfageme, C.; Cassatella, A.; Cox, N.; García-Lario, P.; Stephenson, C.; Cohen, M.; et al. The AKARI/IRC mid-infrared all-sky survey. A&A 2010, 514, A1. [Google Scholar] [CrossRef]
  26. Herbig, G.H. The Diffuse Interstellar Bands. IX. Constraints on the Identification. APJ 1993, 407, 142. [Google Scholar] [CrossRef]
  27. Castelli, F.; Kurucz, R.L. New Grids of ATLAS9 Model Atmospheres. In Proceedings of the Modelling of Stellar Atmospheres; Piskunov, N., Weiss, W.W., Gray, D.F., Eds.; Astronomical Society of the Pacific: San Francisco, CA, USA, 2003; Volume 210, p. 20. [Google Scholar] [CrossRef]
  28. Nenkova, M.; Ivezić, Ž.; Elitzur, M. DUSTY: A Publicly Available Code for Modeling Dust Emission. In Proceedings of the Thermal Emission Spectroscopy and Analysis of Dust, Disks, and Regoliths; Sitko, M.L., Sprague, A.L., Lynch, D.K., Eds.; Astronomical Society of the Pacific: San Francisco, CA, USA, 2000; Volume 196, pp. 77–82. [Google Scholar]
  29. Ivezic, Z.; Elitzur, M. Self-similarity and scaling behaviour of infrared emission from radiatively heated dust—I. Theory. Mon. Not. R. Astron. Soc. 1997, 287, 799–811. [Google Scholar] [CrossRef]
  30. Miroshnichenko, A.; Ivezić, Ž.; Elitzur, M. On Protostellar Disks in Herbig Ae/Be Stars. Astrophys. J. 1997, 475, L41–L44. [Google Scholar] [CrossRef]
  31. Mathis, J.S.; Rumpl, W.; Nordsieck, K.H. The size distribution of interstellar grains. APJ 1977, 217, 425–433. [Google Scholar] [CrossRef]
  32. Kamath, D.; Van Winckel, H. Post-AGB Stars as Tracers of AGB Nucleosynthesis: An Update. Universe 2022, 8, 233. [Google Scholar] [CrossRef]
  33. Oomen, G.M.; Van Winckel, H.; Pols, O.; Nelemans, G.; Escorza, A.; Manick, R.; Kamath, D.; Waelkens, C. Orbital properties of binary post-AGB stars. A&A 2018, 620, A85. [Google Scholar] [CrossRef]
  34. Verdugo, E.; Talavera, A.; Gómez de Castro, A.I. Understanding A-type supergiants. I. Ultraviolet and visible spectral atlas. A&A Suppl. Ser. 1999, 137, 351–362. [Google Scholar] [CrossRef]
  35. Klochkova, V.G.; Yushkin, M.V.; Miroshnichenko, A.S.; Panchuk, V.E.; Bjorkman, K.S. Discovery of spectral variation in the optical counterpart of IRAS 01005+7910. A&A 2002, 392, 143–150. [Google Scholar] [CrossRef]
  36. Miroshnichenko, A.S.; Zharikov, S.V.; Danford, S.; Manset, N.; Korčáková, D.; Kříček, R.; Šlechta, M.; Omarov, C.T.; Kusakin, A.V.; Kuratov, K.S.; et al. Toward Understanding the B[e] Phenomenon. V. Nature and Spectral Variations of the MWC 728 Binary System. APJ 2015, 809, 129. [Google Scholar] [CrossRef]
  37. Miroshnichenko, A.S. New photometric calibration of the visual surface brightness method. In Proceedings of the IAU Symposium; Bedding, T.R., Booth, A.J., Davis, J., Eds.; School of Physics, University of Sydney: Sydney, Australia, 1997; Volume 189, p. 50. [Google Scholar]
  38. Green, G.M.; Schlafly, E.; Zucker, C.; Speagle, J.S.; Finkbeiner, D. A 3D Dust Map Based on Gaia, Pan-STARRS 1, and 2MASS. APJ 2019, 887, 93. [Google Scholar] [CrossRef]
  39. Oudmaijer, R.D.; Jones, E.R.M.; Vioque, M. A census of post-AGB stars in Gaia DR3: Evidence for a substantial population of Galactic post-RGB stars. Mon. Not. R. Astron. Soc. 2022, 516, L61–L65. [Google Scholar] [CrossRef]
  40. Miller Bertolami, M.M. New models for the evolution of post-asymptotic giant branch stars and central stars of planetary nebulae. A&A 2016, 588, A25. [Google Scholar] [CrossRef]
  41. Georgy, C.; Saio, H.; Meynet, G. Blue supergiants as tests for stellar physics. A&A 2021, 650, A128. [Google Scholar] [CrossRef]
  42. Ekström, S.; Georgy, C.; Eggenberger, P.; Meynet, G.; Mowlavi, N.; Wyttenbach, A.; Granada, A.; Decressin, T.; Hirschi, R.; Frischknecht, U.; et al. Grids of stellar models with rotation. I. Models from 0.8 to 120 M at solar metallicity (Z = 0.014). A&A 2012, 537, A146. [Google Scholar] [CrossRef]
  43. Thomas, S.J.; Rodgers, B.; van der Bliek, N.S.; Doppmann, G.; Bouvier, J.; Salvo, C.A.; Beuzit, J.L.; Rigaut, F. A Survey of Herbig Ae/Be Multiplicity. AJ 2023, 165, 135. [Google Scholar] [CrossRef]
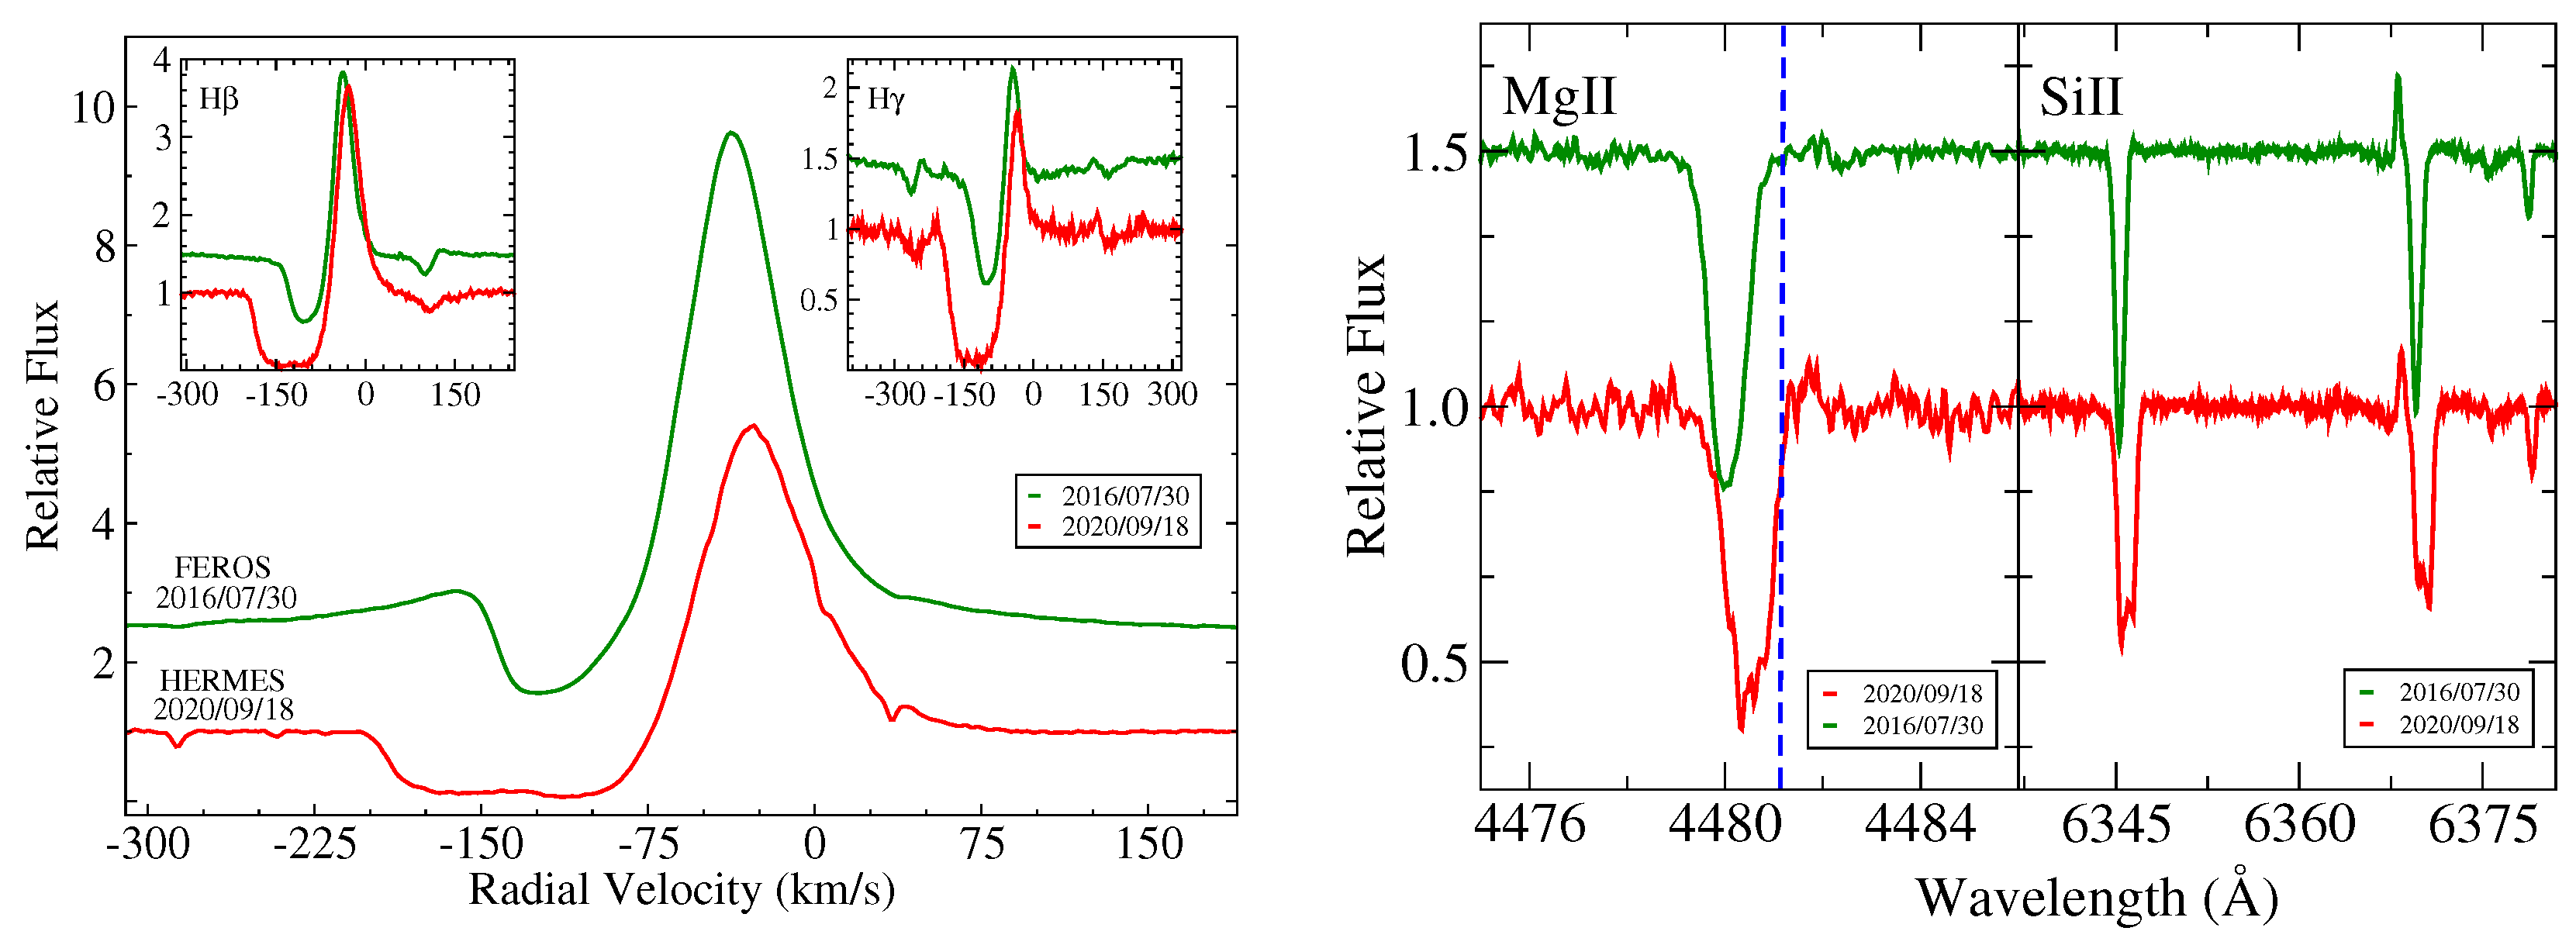
Figure 2. Right panel: Balmer line profiles observed in different spectra marked with observing dates and instruments. The intensity is normalized to local continuum, the RVs are heliocentric. Left panel: Temporal variations of the Mg ii and the Si ii line profiles of AS 314. The emission feature near the Si ii 6371 Å line in the right panel is an Fe ii line. The vertical dashed line shows the laboratory wavelength of the Mg ii line.
Galaxies 13 00017 g002
Figure 3. Radial velocity variations of AS 314 derived from a cross-correlation analysis of absorption lines in a spectral region between 5023 Å and 5080 Å as well as the Si ii 6347 Å and 6371 Å lines, based on HERMES spectra taken in 2020–2023.
Galaxies 13 00017 g003
Table 1. Observatories and Instruments.
ObservatoryTel.InstrumentRLocation# Sp.Obs.Years
OAN SPM2.1 mREOSC18,000B.C., Mexico12013
SAO6 mLYNX25,000N. Arkhyz, Russia21997–1999
SAO6 mPFES15,000N.Arkhyz, Russia22000–2001
SAO6 mNES60,000N. Arkhyz, Russia12002
ESO2.2 mFEROS48,000Chile12016
McD2.1 mSandiford60,000Mt. Locke, TX, USA12001
ORLM1.2 mHERMES85,000La Palma, Spain232020–2023
TCO0.81 meShel12,000NC, USA22023
Column information: 1—Observatory/Telescope acronym; 2—Telescope size; 3—Spectrograph name; 4—Spectral resolution R = λ/Δλ; 5—Observatory location; 6—Number of spectra taken; 7—Observation years. Acronyms: TCO—Three College Observatory; OAN SPM—Observatorio Astronómico Nacional San Pedro Martir; McD—McDonald Observatory; SAO—Special Astrophysical Observatory of the Russian Academy of Sciences; ORLM—Observatorio del Roque de Los Muchachos. Spectrograph references: eShel—https://www.shelyak.com (accessed on 27 February 2025); REOSC—[13]; NES—[14]; PFES—[15], LYNX—[16], Sandiford—[17]; FEROS—[18]; HERMES—[19].
Disclaimer/Publisher’s Note: The statements, opinions and data contained in all publications are solely those of the individual author(s) and contributor(s) and not of MDPI and/or the editor(s). MDPI and/or the editor(s) disclaim responsibility for any injury to people or property resulting from any ideas, methods, instructions or products referred to in the content.