Article

DEATHSTAR—CO Envelope Size and Asymmetry of Nearby AGB Stars

by
Miora Andriantsaralaza
1,*,
Wouter Vlemmings
2,
Sofia Ramstedt
1 and
Elvire De Beck
2
1
Theoretical Astrophysics, Division for Astronomy and Space Physics, Department of Physics and Astronomy, Uppsala University, Box 516, 751 20 Uppsala, Sweden
2
Department of Space, Earth and Environment, Chalmers University of Technology, Onsala Space Observatory, 439 92 Onsala, Sweden
*
Author to whom correspondence should be addressed.
Galaxies 2022, 10(1), 33; https://doi.org/10.3390/galaxies10010033
Submission received: 7 January 2022 / Revised: 3 February 2022 / Accepted: 8 February 2022 / Published: 12 February 2022
(This article belongs to the Special Issue Asymmetric Planetary Nebulae 8e)

Abstract

:
Low- and intermediate-mass stars evolve into asymptotic giant branch (AGB) stars near the end of their lives, losing mass through slow and massive winds. The ejected material creates a chemically-rich expanding envelope around the star, namely the circumstellar envelope (CSE). Investigating the anisotropy of the mass-loss phenomenon on the AGB is crucial in gaining a better understanding of the shaping of the CSE during the transition from AGB star to planetary nebula (PN). We investigate possible signs of deviation from spherical symmetry in the CO-emitting CSEs of 70 AGB stars by analysing their emission maps in CO J = 2 1 and 3 2 observed with the Atacama Compact Array, as part of the DEATHSTAR project. We find that about one third of the sources are likely aspherical, as they exhibit large-scale asymmetries that are unlikely to have been created by a smooth wind. Further high-resolution observations would be necessary to investigate the nature of, and the physical processes behind, these asymmetrical structures.

1. Introduction

Planetary nebulae (PNe) are complex objects that display a range of shapes (e.g., [1,2,3]), but the mechanism that leads to their diverse morphology is not entirely clear yet. With a sample of more than 900 PNe, Parker et al. [4] found that only 20 percent of their observed PNe could be classified as round, appearing circular in images. Close to 55 percent of the Parker et al. [4] sample exhibited an elongated shape and were classified as elliptical PNe, provided that their major and minor axes differed by less than 5 percent. The remaining sources were either bi- or multi-polar, displaying two or more lobes, irregular, asymmetric, or point-like. The results of surveys focused on pre-PNe [5] and young PNe [6] highlighted the rarity of the round morphology amongst these objects, with a relative abundance between 0 and ∼3.4 percent, respectively. Their progenitors, asymptotic giant branch (AGB) stars, lose mass through massive stellar winds, creating a chemically-rich circumstellar envelope (CSE) around the star. Studying the morphology of the CSE is, therefore, one way to investigate the properties of the winds that created it. One of the main motivations behind such investigations is to understand the shaping of the CSE during the transition from AGB star to PN before it is altered by ionisation, the fast wind, and/or jets. Whether the CSEs of AGB stars are (a)spherical and/or (a)symmetric could be the consequence of intrisic properties, such as a preferential direction in the winds, time-variable mass loss, or magnetic fields [7], or extrinsic properties, including the effects of interactions with a stellar or planetary companion or with the interstellar medium (e.g., [8,9]). In addition, the rate at which an AGB star loses mass exceeds the rate of nuclear burning inside the star, making the mass-loss rate the most important parameter at that stage of evolution, see review by [10], and references therein. The standard CSE model, and the mass-loss rates estimated from it, assume a spherically symmetric CSE. Therefore, a better description of the mass loss can be obtained by investigating signs of anisotropy in CSEs and in the winds.
Several studies showed evidence of the patchiness of AGB winds, attributing the departure from sphericity to clumps (scale ≤ a few tens of AU) caused by convection and local instabilities (e.g., [11,12,13]). The effects of this clumpiness are averaged out at larger scales, so that the aspherical inner structure is surrounded by a larger symmetric envelope. The results of the interferometric survey by Castro-Carrizo et al. [14] (COSAS project, scale ∼ a few times 1000 AU) showed that the CSEs of their sample of 16 stars were consistent with large-scale spherical symmetry and isotropic expansion, with some sources exhibiting signs of moderate deviation from spherical symmetry, such as arcs and spirals. At even larger scales (∼10,000 AU), the detached CO shells of a few carbon stars displayed a morphology consistent with spherical symmetry [15,16,17].
Observations of extended dust emission (scale ∼ a few arcmin) also show evidence of deviation from spherical symmetry. Scattered light [18] and far-IR dust observations (e.g., [8]) showed that some dusty CSEs presented signs of deviation from spherical symmetry. They could be tracers of the impact of, e.g., binarity, wind-ISM interaction, or magnetic fields, rather than proof of anisotropic mass loss.
The aim of this work is to report the degree of sphericity of the CO-emitting CSEs of the southern AGB stars in the DEATHSTAR sample observed with the Atacama Compact Array (ACA). DEATHSTAR1 (DEtermining Accurate mass-loss rate for THermally pulsing AGB stars; [19,20]) is a large project aimed at improving the accuracy of wind-parameter measurements towards the CSEs of nearby AGB stars, using CO observations from the ACA. These interferometric data will be used as constraints and combined with detailed radiative transfer modeling of the observed CO lines to obtain reliable mass-loss-rate estimates. This present study is part of the first step of the DEATHSTAR project, which consists of constraining the size of the CO-emitting CSEs [19,20] and comparing them with the CO sizes obtained from photodissociation models [21,22], which are used in current mass-loss rate estimates.

2. Data

The DEATHSTAR sample consists of a total of 182 stars. The completeness of the sample is discussed in Ramstedt et al. [19]. Only the 70 southern AGB stars in the main sample, with declinations lower than + 15 , are considered in this work, out of which 26 are M-, 15 are S-, and 29 are C-type stars.
The southern sources were observed during ALMA Cycle 4 and 5 with the 7 m ACA in stand-alone mode in bands 6 and 7. The four stars with the largest angular scales, AI Vol, AFGL 3068, R Dor, and IRC 30398 were also observed with the 12 m total power (TP) antennas in Cycle 5 to recover missing flux that was resolved out by the ACA. The maximum recoverable scale (MRS) with the 7 m ACA dishes at the desired frequencies was on average ∼25 and ∼19 arcsec in Band 6 and 7, respectively. The emission lines of interest were from carbon monoxide 12 CO transitions J = 2 1 and 3 2 , but our observations also covered other molecules such as SiO, SiS, CS, and SO 2 . The data were calibrated using the standard scripts provided by the pipeline using the Common Astronomy Software Application package (casa; [23]). The generated CO cubes have a spectral resolution of 0.75 km s 1 in both bands and an angular resolution of ∼5 and ∼18 arcsec for the ACA and TP maps, respectively. The generated cubes and dust continuum maps are publicly available via the VizieR Online Data Catalog for the Cycle 4 [24] and Cycle 5 [25] data.

3. Method

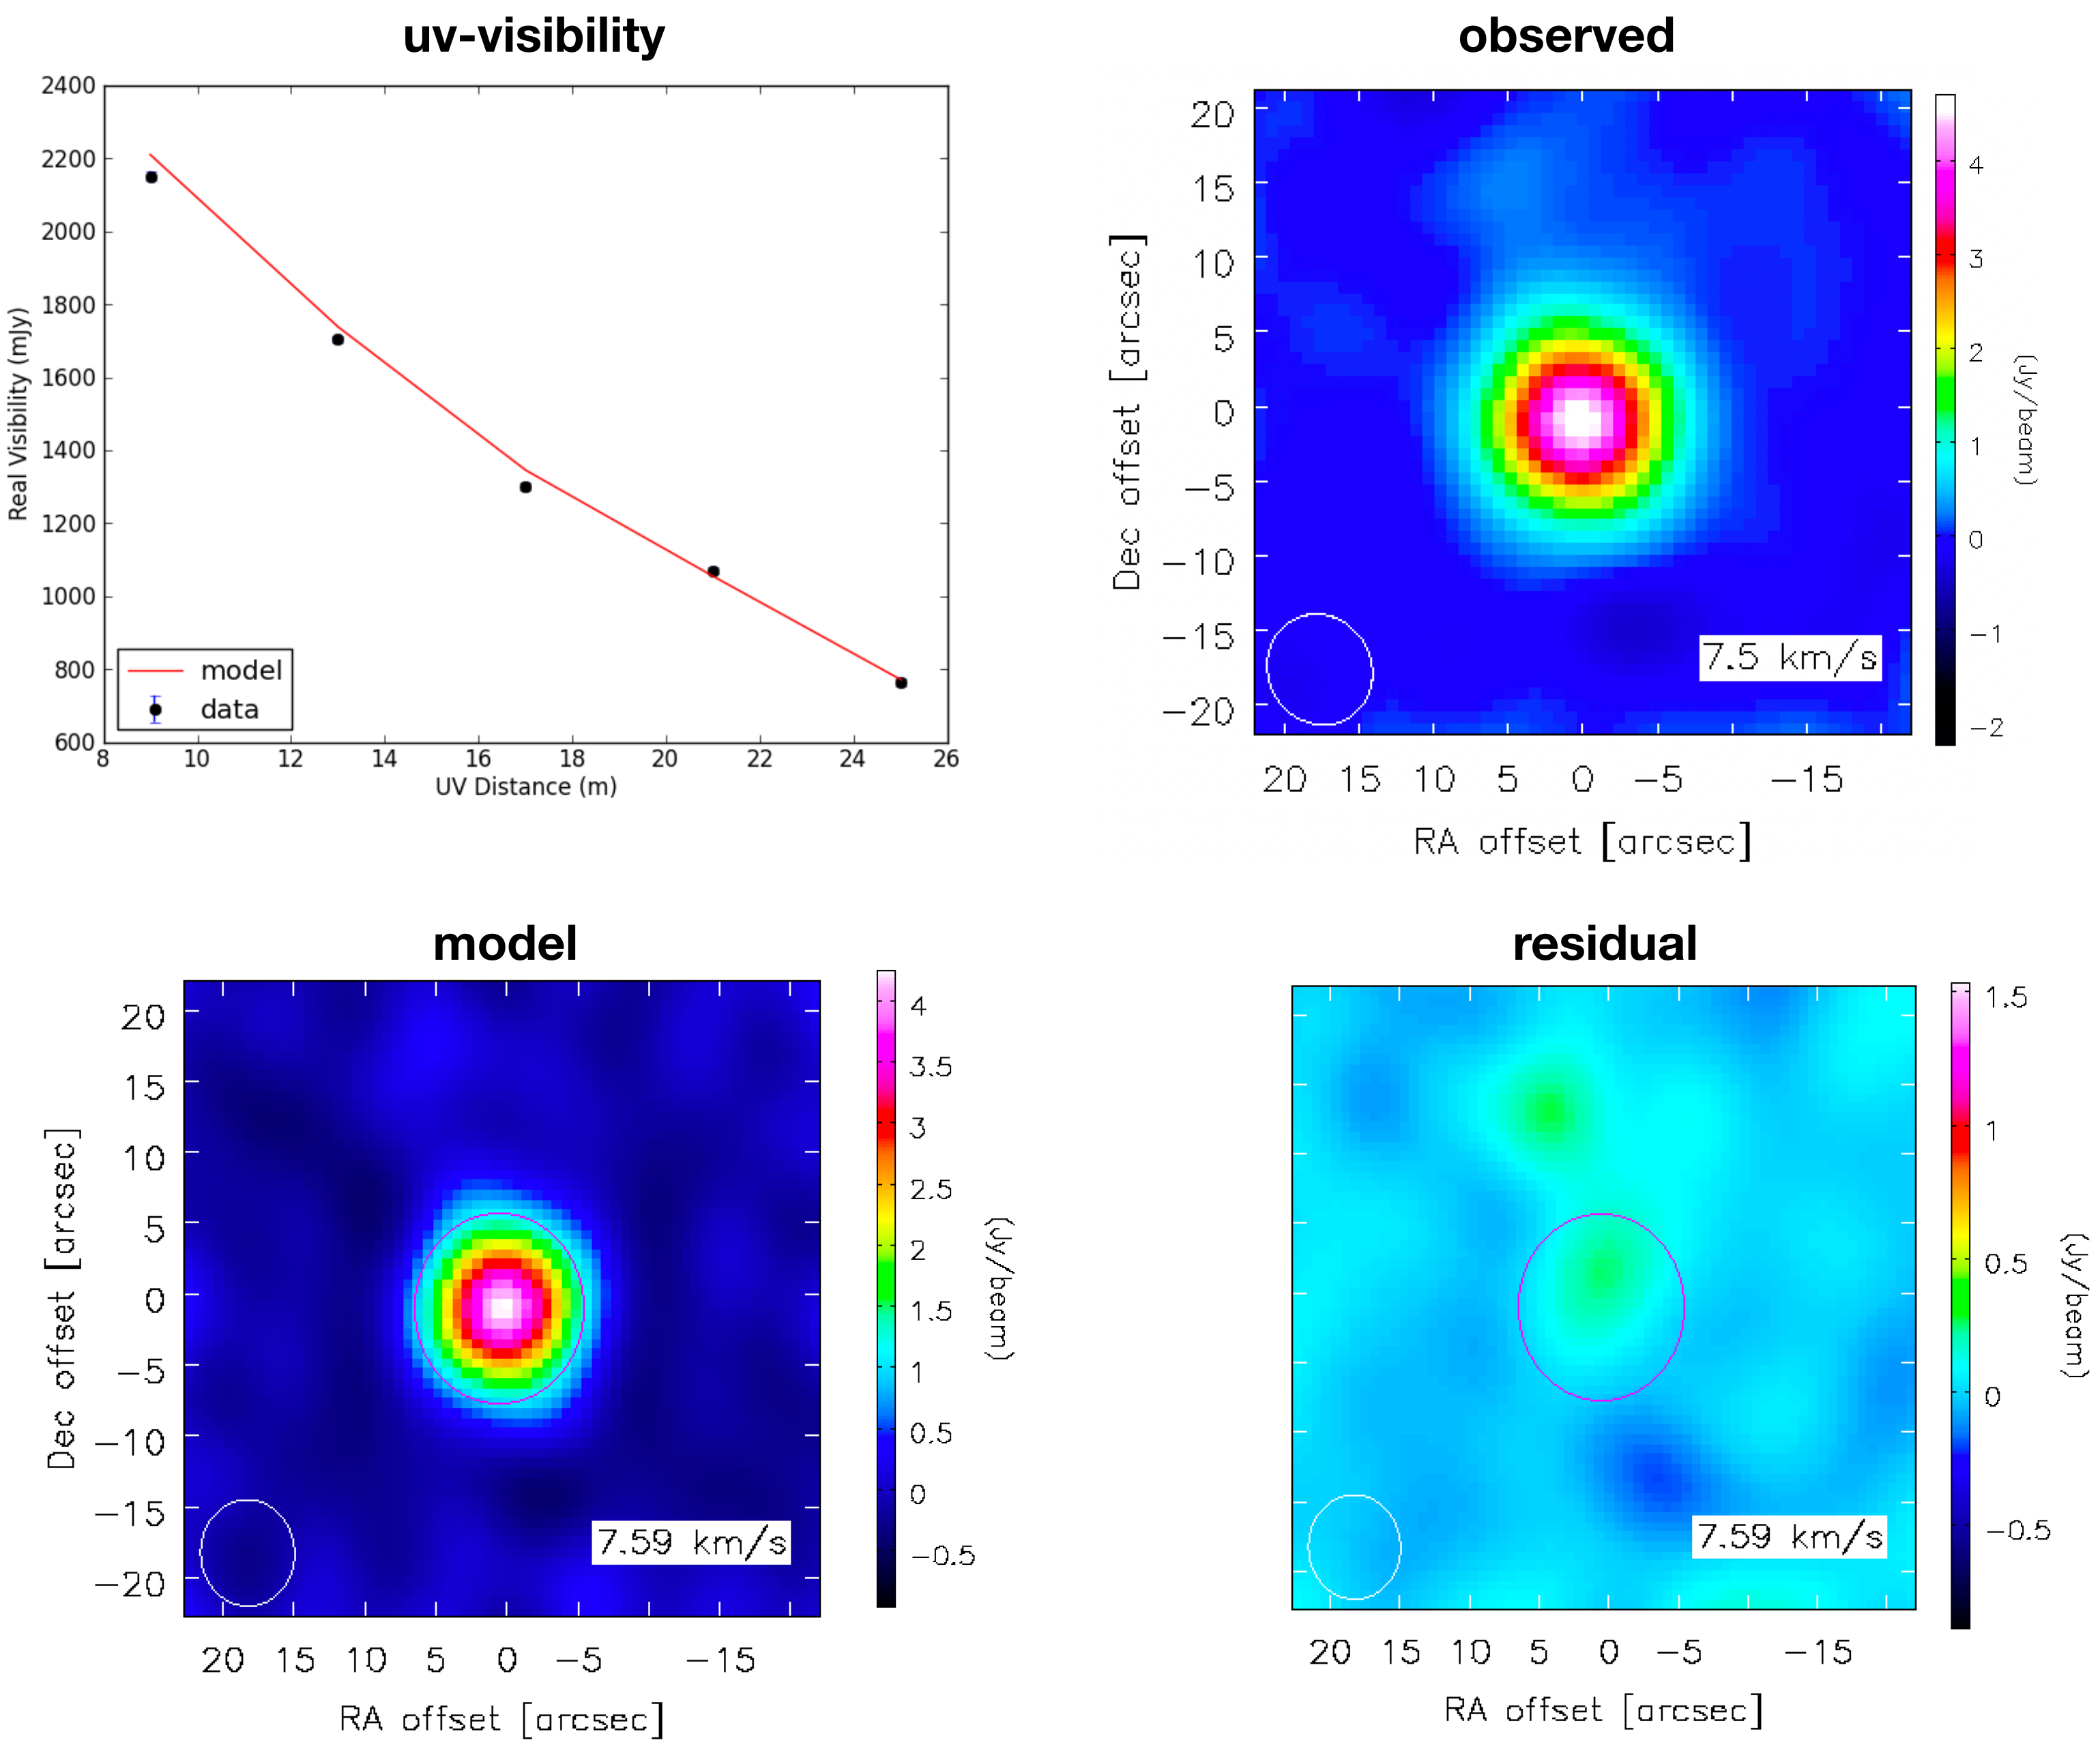
We fit a Gaussian emission distribution model to the interferometric visibilities of the sources in our sample in CO (2–1) and CO (3–2) in each velocity channel using the uvmultifit library implemented in casa [26]. For each run, uvmultifit outputs the position, flux, major axis, ratio between minor and major axes, and the position angle of the major axis of the fitted Gaussian. Measuring the CO size in the uv-plane minimizes the effects of artifacts introduced by the beam and permits obtaining better size estimates for the smallest sources. This method also allows explicit examination of the quality of the data, so that effects from the limitations of the carried observations (e.g., missing flux and unresolved source) can be easily distinguished from possible physical effects. As an example, Figure 1 illustrates the measurement of the CO(2–1) size for TT Cen using uvmultifit, showing the observed data and best-fit Gaussian model to the visibility.
The major axis taken at the center velocity channel gave us an initial estimate of the size of the CO envelope. We then compared the derived sizes with the sizes obtained from chemical models of CO photodissociation in the CSE [21,22]. The ratio between the minor and major axes was an indication of how circular our sources are. Deviations from unity in the axis ratio that were larger than 10 percent were considered inconsistent with a spherical shell. In addition, we tracked the position of the peak emission in each channel in both RA and Dec. A consistent position gradient in both observing bands could be the signature of rotation or plane-parallel expansion. For a spherically symmetric CSE, the largest size corresponds to the central velocity channel, and the sizes in both the red- and blue-shifted sides monotonically increase towards that peak. Therefore, a nonmonotonic growth or drop in the size distribution is an additional sign of deviation from the standard CSE model.
To investigate possible signs of anisotropy in the winds, we also analysed the CO line profiles. In particular, we looked for wide wings, which can indicate the presence of a faster outflow, and multiple peaks, which have been associated with an expanding torus in the literature (e.g., [27]).

4. Results

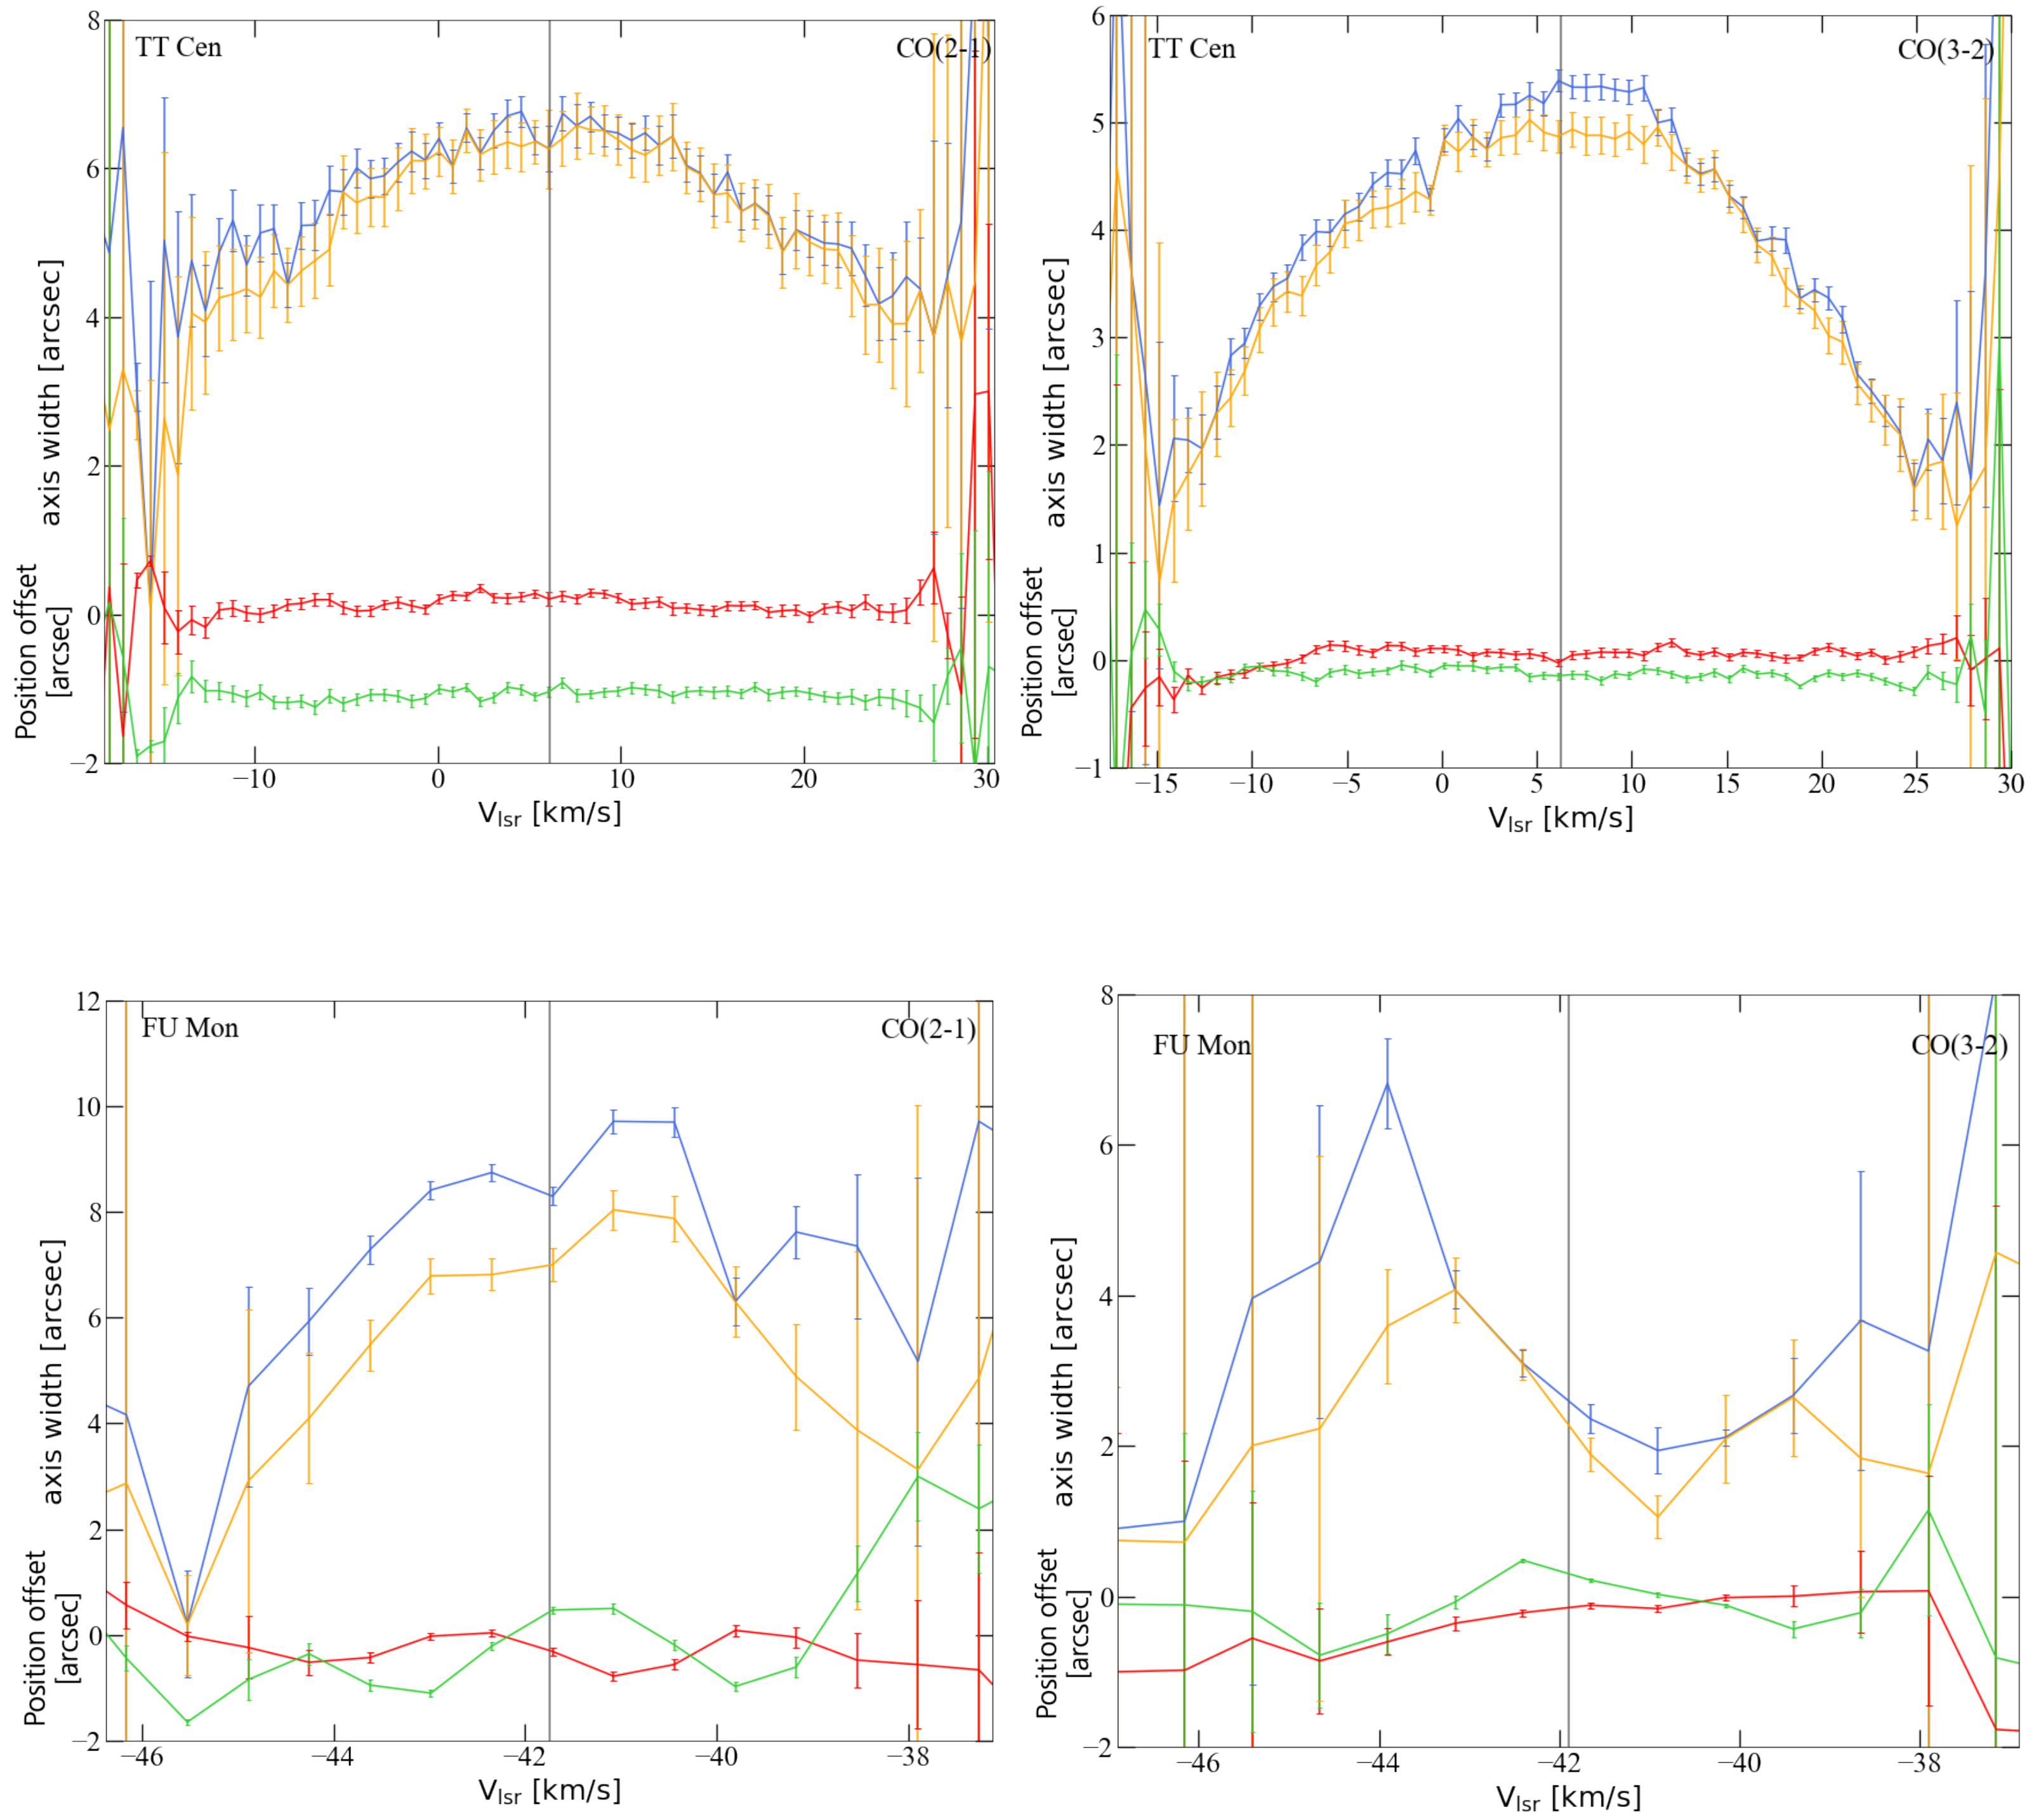
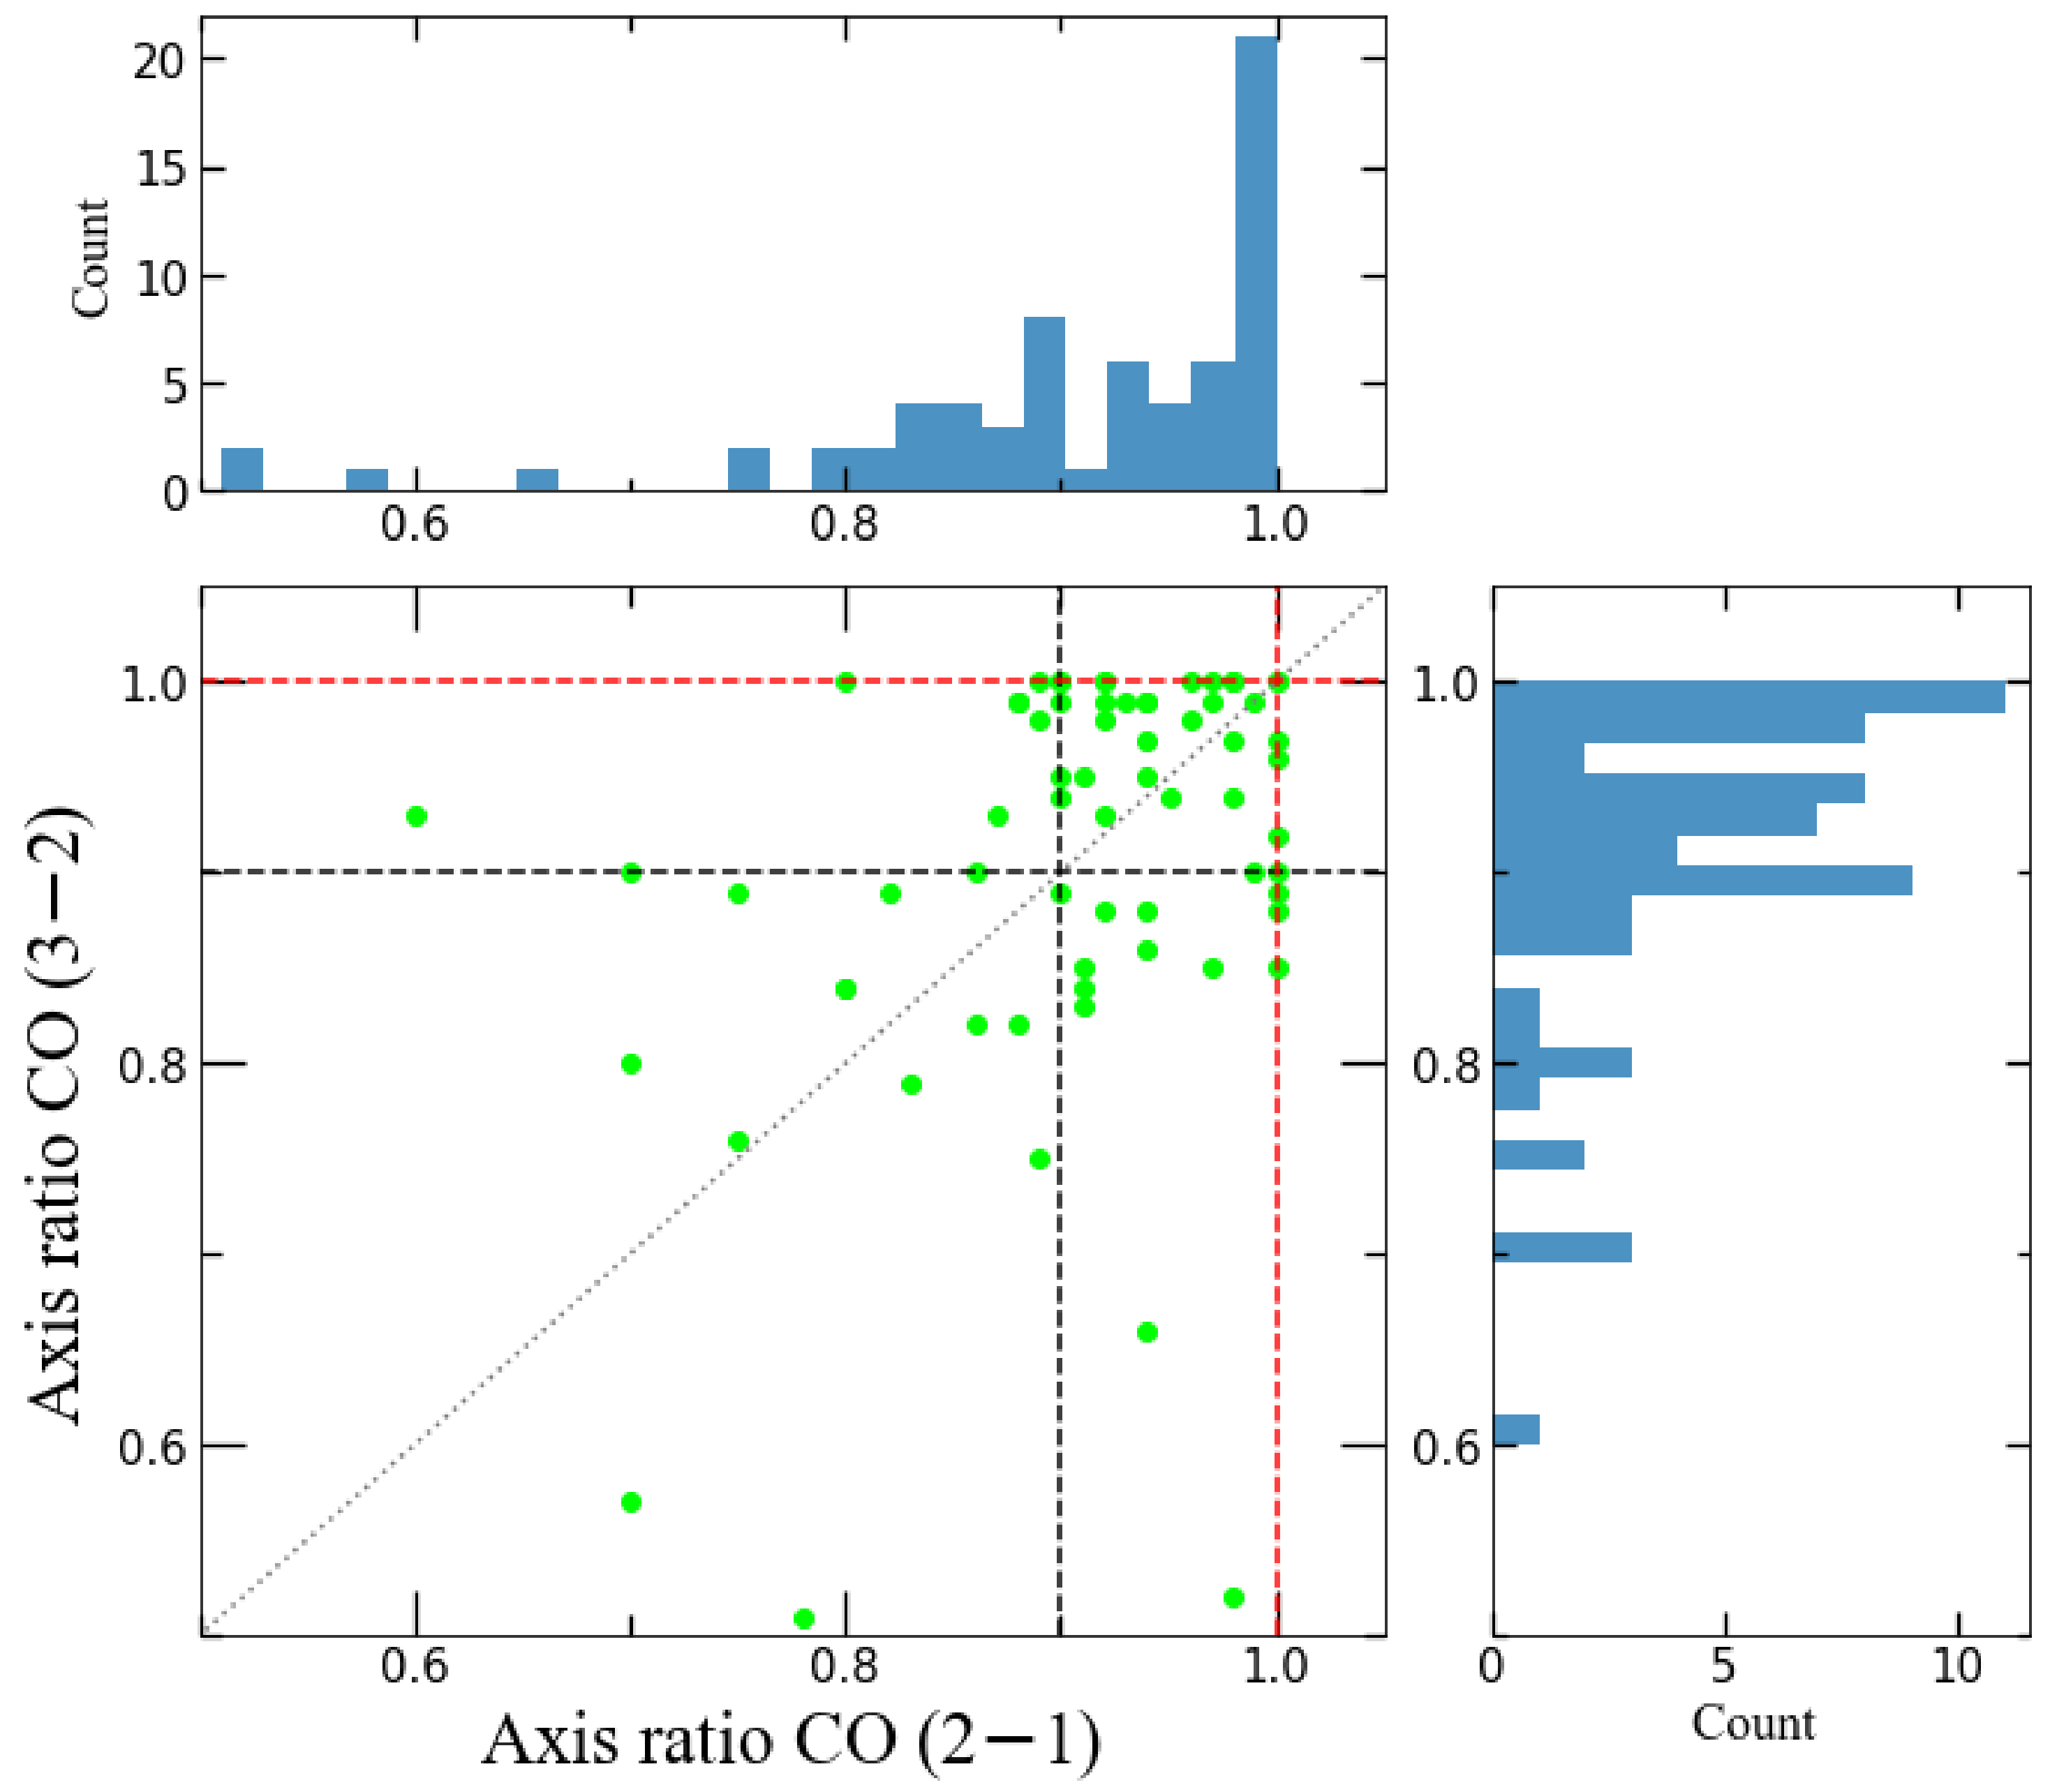
We found that about one third of the sources in our sample were likely aspherical, based on the ratio of their minor and major axes, the size distribution and position across the velocity channels, their spectral line profiles, and their apparent shape in images. The most common signature of anisotropy in these aspherical sources was a gradient in the position of the peak emission across the velocity channels. Figure 2 shows an example of a CSE consistent with a spherically symmetric CSE, and a case where there was a position gradient in both RA and Dec. The derived minor/major axis ratio taken at the center velocity channel in both CO (2–1) and (3–2) are shown in Figure 3 for all our sources. It is clear from Figure 3 that a number of the sources had axis ratios that lay significantly away from one, within 10 percent, and/or had ratios that were very different in the two transitions, which were strong indications that they were not consistent with a spherical shell.
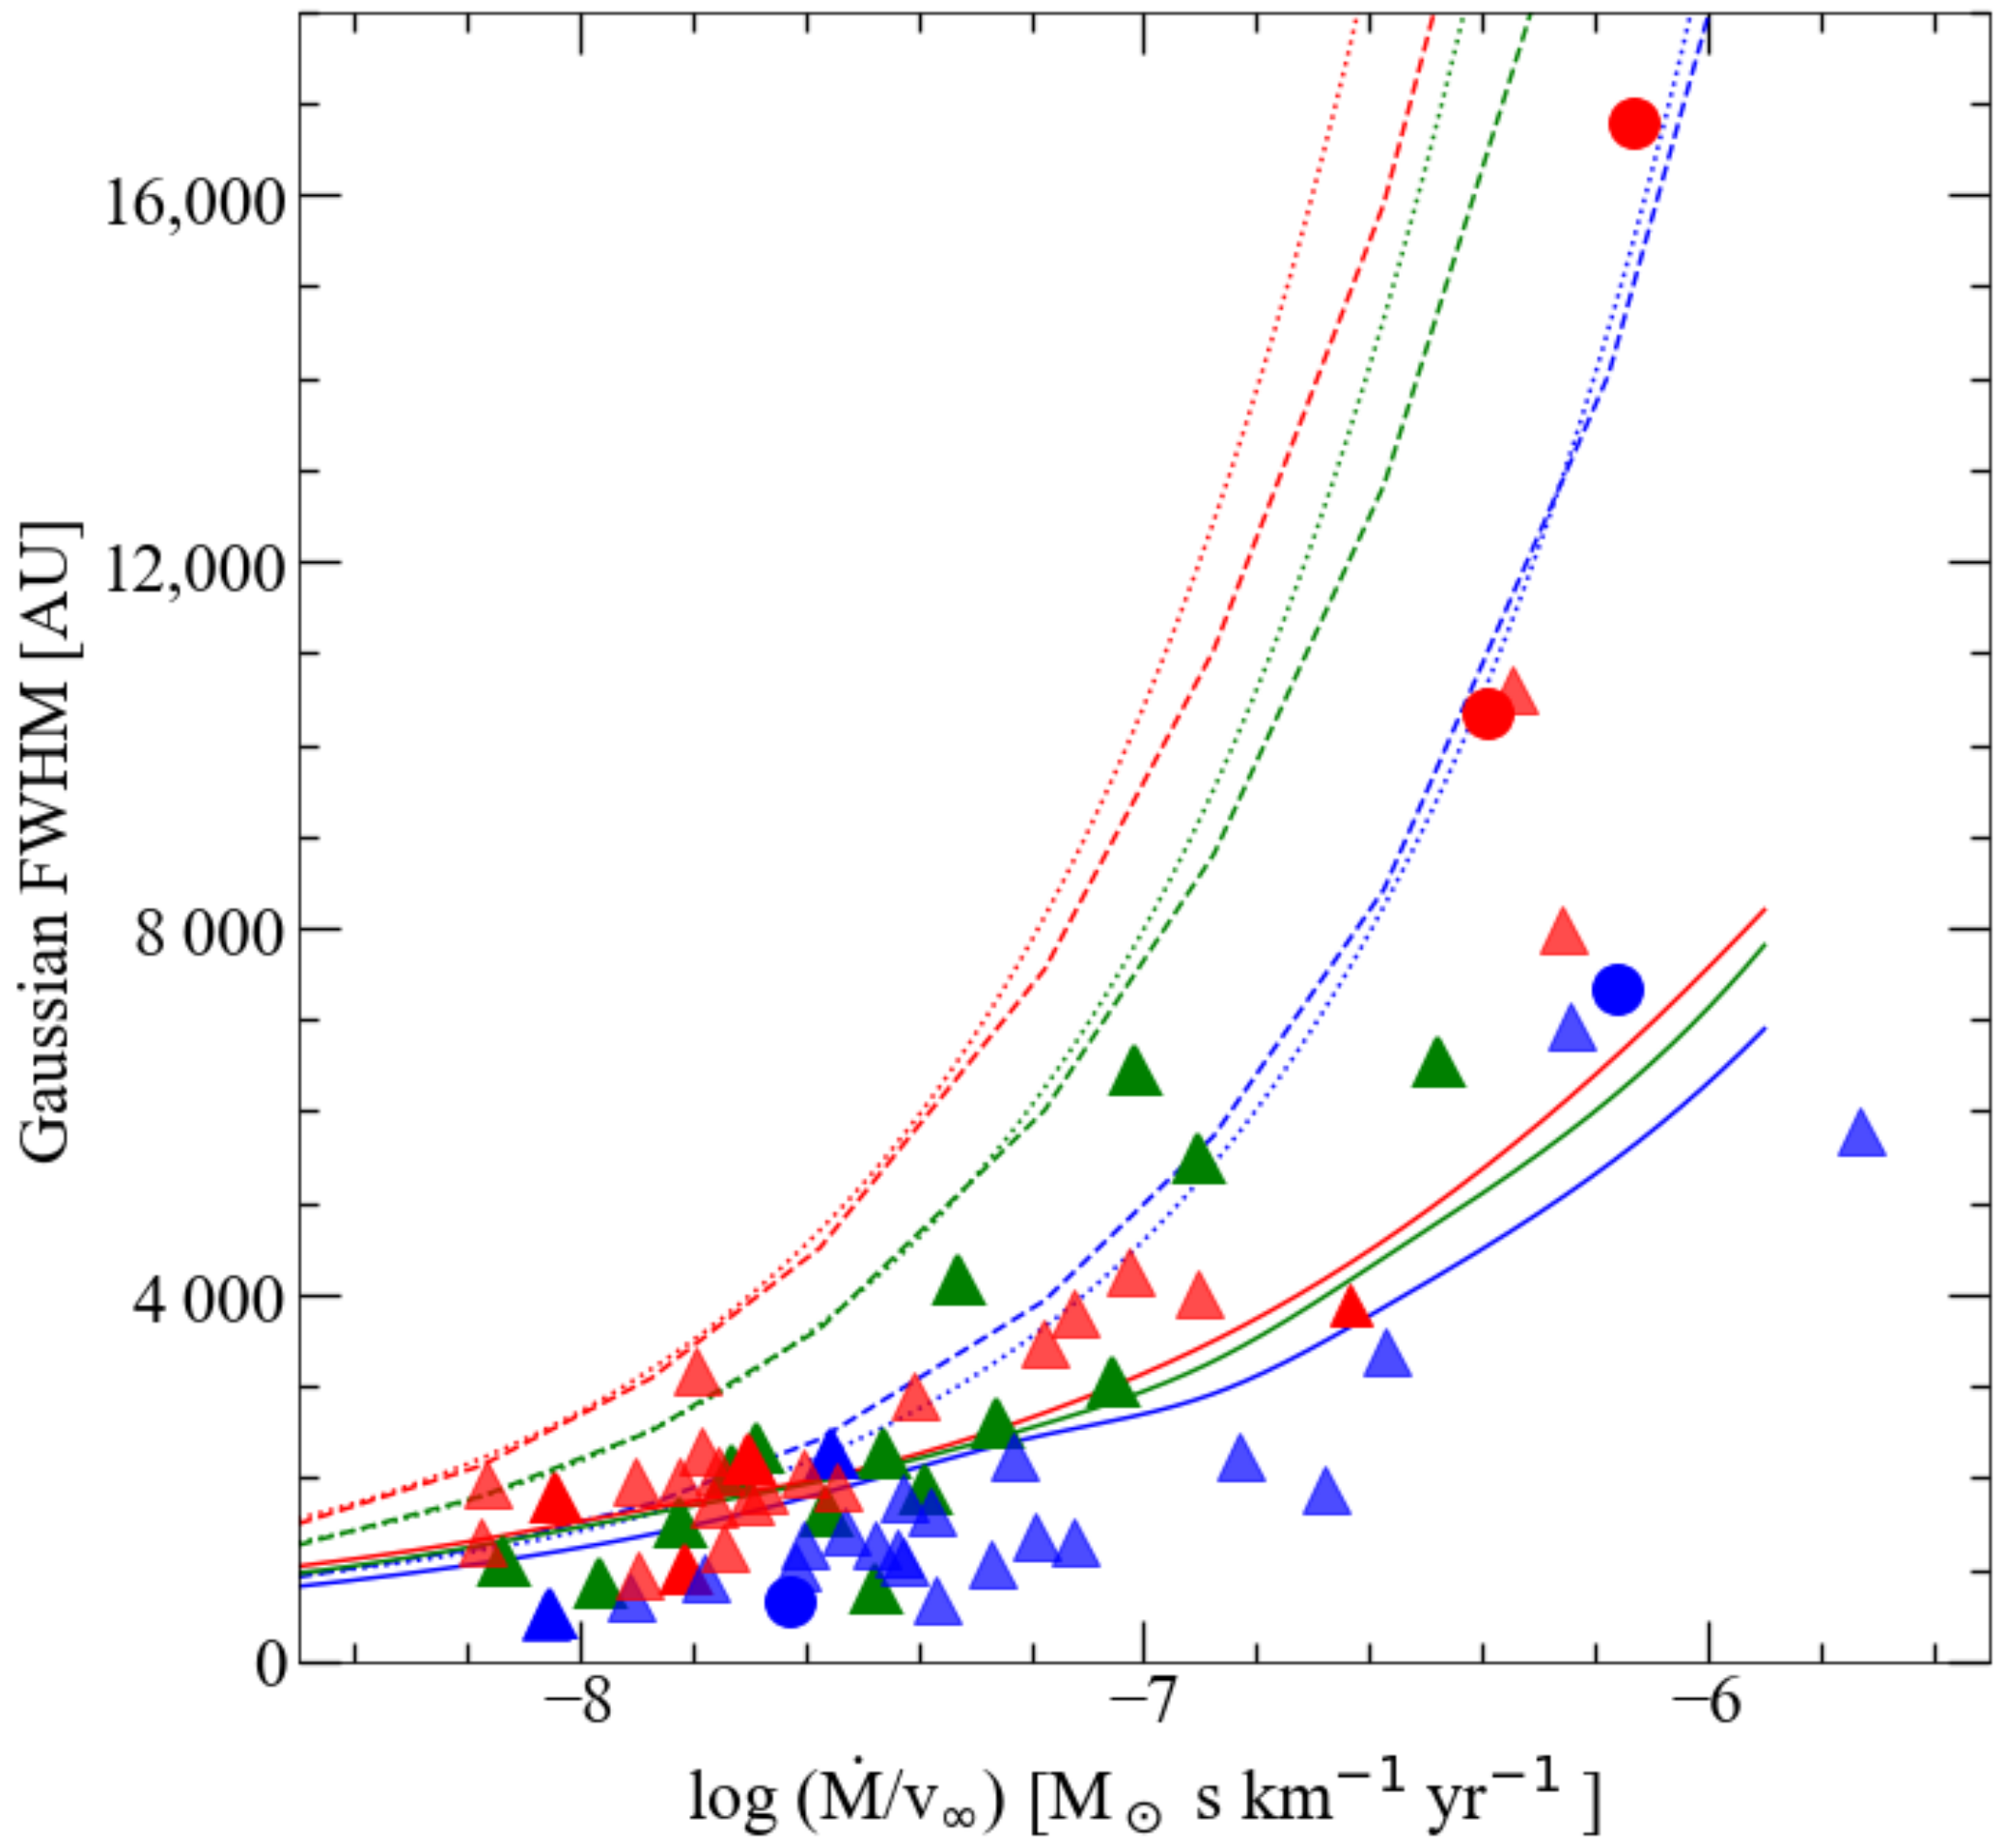
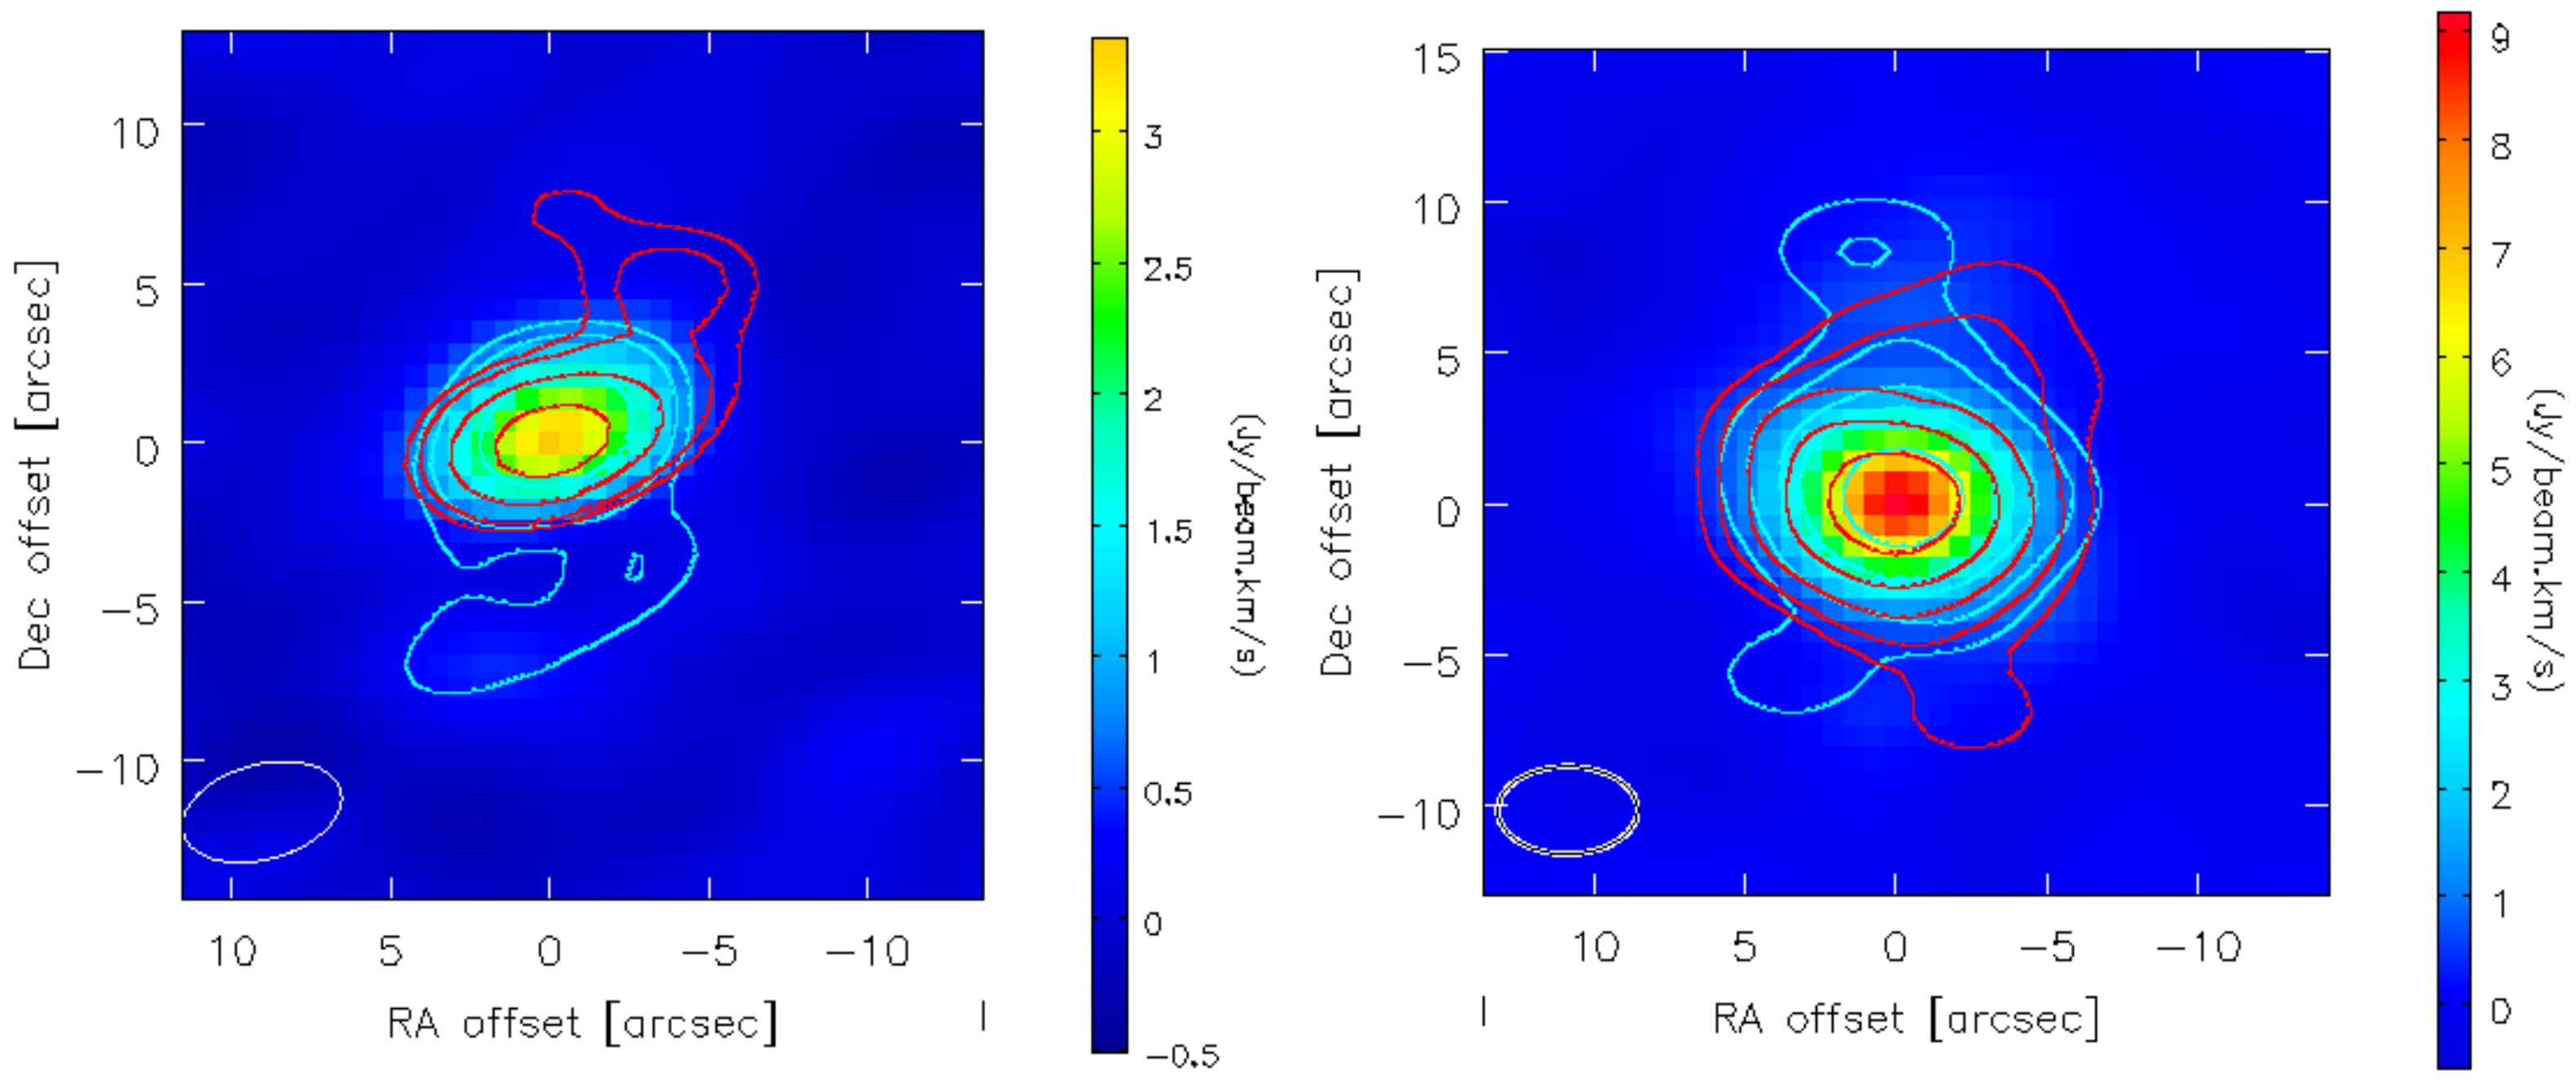
Figure 4 shows the dependence of the derived sizes with the outflow density, defined as the ratio between the mass-loss rate and expansion velocity taken from previous studies [28,29,30,31]. We found that, for a density lower than ∼5 × 10 8 M s km 1 yr 1 , the envelope sizes of three carbon stars were up to a factor of two larger than the sizes predicted by photodissociation theory, while the CSEs of M-type stars tended to be smaller than the CO photodissociation sizes. We found a median CSE size of 2000 AU for all three chemical types at low density and based on the distances collected from Schöier and Olofsson [28], González Delgado et al. [29], and Ramstedt et al. [31]. The size-density dependence was steeper at higher density, and the C- and S-type stars were almost all larger than expected. A number of the CSEs of the high-mass-losing S-type stars showed strong signs of anisotropy that cannot have been created by a smooth wind and are larger than expected based on their CO abundances when compared to the M- and C-type CSEs. This is the case for FU Mon and RZ Sgr, whose CO emission reveals outflows in opposite spatial directions in the red- and blue-shifted velocities, as shown in Figure 5. These large- and small-scale asymmetries have likely influenced the Gaussian fitting, making the derived sizes unreliable for these sources.

5. Discussion

In this work, we looked for signs of deviation from spherical symmetry in the CO-emitting CSEs of nearby AGB stars using the ALMA ACA, with the aim to investigate whether the outermost large-scale molecular envelopes of AGB stars already show the type of asymmetries that PNe exhibited at that stage of stellar evolution. In fact, the compact array (angular resolution: ∼5 arcsec, MRS: 19–25 arcsec) was chosen in order to map the extended, large-scale emission of the envelope, filtering out potential small-scale inhomogeneities that can be observed by high angular-resolution, i.e., small-scale-focused surveys such as in Decin et al. [9] (angular resolution: 25–50 × milliarcsec, MRS: 0.38–0.62 arcsec). Furthermore, as previously mentioned, the presence of small-scale asymmetries does not necessarily imply that the large-scale extended emission is not smooth. This is the case for the S-type star W Aql, which is in a wide binary system. Although showing a double arc pattern close to the star, its CO (3–2) emission is entirely dominated by a smooth symmetric extended component [32]. The findings of previous large-scale interferometric surveys by Neri et al. [33] and Castro-Carrizo et al. [14] using CO J = 1 0 and 2 1 line emission showed that two thirds of the stars in their sample were consistent with a spherically symmetric CSE. This is in agreement with our results.
One important source of uncertainty in the derived sizes is the distances adopted. The choice of the best distance estimates for the complete sample will be discussed in a future publication (Andriantsaralaza et al., subm.), and the results will be implemented in our mass-loss rate determination. In addition, a size estimate based on a Gaussian fitting becomes less reliable for stars with high mass-loss rate, affecting the largest sources in particular [19]. This can be due to optical depth effects. Therefore, the sizes measured using this method should be considered as a first approximation. More accurate results can be achieved by introducing better constraints on the geometry of the sources, the opacity, and the distance, which will be the focus of the next step of the DEATHSTAR project.

6. Conclusions

This work presented the observational results of 70 nearby southern AGB stars with the ALMA ACA in CO(2–1) and CO(3–2), as part of the DEATHSTAR project. The first step of the DEATHSTAR project consists of better constraining the sizes of the CO-emitting CSEs and investigating their morphologies by looking for signs of deviation from spherical symmetry. We found that the CSEs of 28 (∼one third) of the sources in our sample were not consistent with a spherically symmetric shell. Our results also showed that, at low density, the envelope sizes of carbon stars could be up to a factor of 2 larger than expected from photodissociation theory, while the CSEs of M-type stars tended to be smaller than predicted. The high-density-outflow S-stars had CSEs that were larger than expected based on their CO abundances, some being larger than the CSEs of C-stars for the same density. For several of our sources that exhibited signs of potential intricate wind dynamics, better resolution combined with high sensitivity observations are necessary for comparison with hydrodynamical models to obtain a more complete picture of the wind shaping mechanism. As an example, an angular resolution of ∼0.5 arcsec, ten times better than our ACA observations, is required to resolve small-scale structures down to 200 AU in the envelope of RZ Sgr using the CO (3–2) line. This resolution is similar to what has been achieved in previous studies on structures around binary stars (e.g., [32]). A high sensitivity (∼5 mJy for a resolution of ∼0.5 arcsec) is needed to observe the fainter outer envelope of RZ Sgr. These can be achieved by combining data from observations with the ALMA-main-array and the ACA.

Author Contributions

Conceptualization, S.R. and W.V.; methodology, S.R. and W.V.; software, W.V. and M.A.; validation, E.D.B.; formal analysis, M.A., S.R. and W.V.; investigation, M.A. and S.R.; resources, M.A. and S.R.; data curation, S.R. and M.A.; writing—original draft preparation, M.A.; writing—review and editing, E.D.B.; visualization, M.A.; supervision, E.D.B. and S.R.; project administration, S.R.; funding acquisition, S.R. and M.A. All authors have read and agreed to the published version of the manuscript.

Funding

This project has received funding from the European Research Council (ERC) under the European Union’s Horizon 2020 research and innovation programme under grant agreements No. 883867 [EXWINGS] and 730562 [RadioNet]. E.D.B. acknowledges financial support from the Swedish National Space Agency.

Institutional Review Board Statement

Not applicable.

Informed Consent Statement

Not applicable.

Data Availability Statement

This paper makes use of the following ALMA data: ADS/JAO.ALMA #2018.1.01434.S; ADS/JAO.ALMA#2017.1.00595.S and ADS/JAO.ALMA#2012.1.00524.S. ALMA is a partnership of ESO (representing its member states), NSF (USA) and NINS (Japan), together with NRC (Canada), MOST and ASIAA (Taiwan), and KASI (Republic of Korea), in cooperation with the Republic of Chile. The Joint ALMA Observatory is operated by ESO, AUI/NRAO and NAOJ. The data are available through the VizieR Online Data Catalog for the Cycle 4 [24] and Cycle 5 [25] data.

Acknowledgments

M.A. acknowledges support from the Nordic ALMA Regional Centre (ARC) node based at Onsala Space Observatory. The Nordic ARC node is funded through Swedish Research Council grant No 2017-00648.

Conflicts of Interest

The authors declare no conflict of interest. The funders had no role in the design of the study; in the collection, analyses, or interpretation of data; in the writing of the manuscript, or in the decision to publish the results.

Note

1
www.astro.uu.se/deathstar (accessed on 1 January 2022).

References

  1. Manchado, A.; Guerrero, M.A.; Stanghellini, L.; Serra-Ricart, M. The IAC Morphological Catalog of Northern Galactic Planetary Nebulae; Instituto de Astrofisica de Canarias: La Laguna, Spain, 1996. [Google Scholar]
  2. Balick, B.; Frank, A. Shapes and Shaping of Planetary Nebulae. Annu. Rev. Astron. Astrophys. 2002, 40, 439–486. [Google Scholar] [CrossRef]
  3. Stanghellini, L.; Villaver, E.; Manchado, A.; Guerrero, M.A. The Correlations between Planetary Nebula Morphology and Central Star Evolution: Analysis of the Northern Galactic Sample. Astrophys. J. 2002, 576, 285–293. [Google Scholar] [CrossRef] [Green Version]
  4. Parker, Q.A.; Acker, A.; Frew, D.J.; Hartley, M.; Peyaud, A.E.J.; Ochsenbein, F.; Phillipps, S.; Russeil, D.; Beaulieu, S.F.; Cohen, M.; et al. The Macquarie/AAO/Strasbourg Hα Planetary Nebula Catalogue: MASH. Mon. Not. R. Astron. Soc. 2006, 373, 79–94. [Google Scholar] [CrossRef] [Green Version]
  5. Sahai, R.; Morris, M.; Sánchez Contreras, C.; Claussen, M. Preplanetary Nebulae: A Hubble Space Telescope Imaging Survey and a New Morphological Classification System. Astron. J. 2007, 134, 2200–2225. [Google Scholar] [CrossRef] [Green Version]
  6. Sahai, R.; Morris, M.R.; Villar, G.G. Young Planetary Nebulae: Hubble Space Telescope Imaging and a New Morphological Classification System. Astron. J. 2011, 141, 134. [Google Scholar] [CrossRef] [Green Version]
  7. Vlemmings, W.H.T.; Diamond, P.J.; Imai, H. A magnetically collimated jet from an evolved star. Nature 2006, 440, 58–60. [Google Scholar] [CrossRef]
  8. Cox, N.L.J.; Kerschbaum, F.; van Marle, A.J.; Decin, L.; Ladjal, D.; Mayer, A.; Groenewegen, M.A.T.; van Eck, S.; Royer, P.; Ottensamer, R.; et al. A far-infrared survey of bow shocks and detached shells around AGB stars and red supergiants (Corrigendum). Astron. Astrophys. 2012, 543, C1. [Google Scholar] [CrossRef] [Green Version]
  9. Decin, L.; Montargès, M.; Richards, A.M.S.; Gottlieb, C.A.; Homan, W.; McDonald, I.; El Mellah, I.; Danilovich, T.; Wallström, S.H.J.; Zijlstra, A.; et al. (Sub)stellar companions shape the winds of evolved stars. Science 2020, 369, 1497–1500. [Google Scholar] [CrossRef] [PubMed]
  10. Decin, L. Evolution and Mass Loss of Cool Ageing Stars: A Daedalean Story. Annu. Rev. Astron. Astrophys. 2021, 59, 337–389. [Google Scholar] [CrossRef]
  11. Blasius, T.D.; Monnier, J.D.; Tuthill, P.G.; Danchi, W.C.; Anderson, M. The Keck Aperture Masking Experiment: Dust-enshrouded red giants. Mon. Not. R. Astron. Soc. 2012, 426, 2652–2667. [Google Scholar] [CrossRef] [Green Version]
  12. Males, J.R.; Close, L.M.; Skemer, A.J.; Hinz, P.M.; Hoffmann, W.F.; Marengo, M. Four Decades of IRC +10216: Evolution of a Carbon-rich Dust Shell Resolved at 10 μm with MMT Adaptive Optics and MIRAC4. Astrophys. J. 2012, 744, 133. [Google Scholar] [CrossRef] [Green Version]
  13. Ohnaka, K.; Weigelt, G.; Hofmann, K.H. Clumpy dust clouds and extended atmosphere of the AGB star W Hydrae revealed with VLT/SPHERE-ZIMPOL and VLTI/AMBER. Astron. Astrophys. 2016, 589, A91. [Google Scholar] [CrossRef] [Green Version]
  14. Castro-Carrizo, A.; Quintana-Lacaci, G.; Neri, R.; Bujarrabal, V.; Schöier, F.L.; Winters, J.M.; Olofsson, H.; Lindqvist, M.; Alcolea, J.; Lucas, R.; et al. Mapping the 12CO J = 1-0 and J = 2-1 emission in AGB and early post-AGB circumstellar envelopes. I. The COSAS program, first sample. Astron. Astrophys. 2010, 523, A59. [Google Scholar] [CrossRef] [Green Version]
  15. Olofsson, H.; González Delgado, D.; Kerschbaum, F.; Schöier, F.L. Mass loss rates of a sample of irregular and semiregular M-type AGB-variables. Astron. Astrophys. 2002, 391, 1053–1067. [Google Scholar] [CrossRef] [Green Version]
  16. Maercker, M.; Vlemmings, W.H.T.; Brunner, M.; De Beck, E.; Humphreys, E.M.; Kerschbaum, F.; Lindqvist, M.; Olofsson, H.; Ramstedt, S. A detailed view of the gas shell around R Sculptoris with ALMA. Astron. Astrophys. 2016, 586, A5. [Google Scholar] [CrossRef]
  17. Kastner, J.H.; Wilson, E. Detached Shell Carbon Stars: Tracing Thermal Pulses on the Asymptotic Giant Branch. arXiv 2021, arXiv:2108.08940. [Google Scholar] [CrossRef]
  18. Leal Ferreira, M.L. Magnetic Fields and the Formation of Aspherical Planetary Nebulae. Ph.D. Thesis, Argelander Institut für Astronomie, University of Bonn, Bonn, Germany, 2014. [Google Scholar]
  19. Ramstedt, S.; Vlemmings, W.H.T.; Doan, L.; Danilovich, T.; Lindqvist, M.; Saberi, M.; Olofsson, H.; De Beck, E.; Groenewegen, M.A.T.; Höfner, S.; et al. DEATHSTAR: Nearby AGB stars with the Atacama Compact Array. I. CO envelope sizes and asymmetries: A new hope for accurate mass-loss-rate estimates. Astron. Astrophys. 2020, 640, A133. [Google Scholar] [CrossRef]
  20. Andriantsaralaza, M.; Ramstedt, S.; Vlemmings, W.H.T.; Danilovich, T.; De Beck, E.; Groenewegen, M.A.T.; Höfner, S.; Kerschbaum, F.; Khouri, T.; Lindqvist, M.; et al. DEATHSTAR: Nearby AGB stars with the Atacama Compact Array. II. CO envelope sizes and asymmetries: The S-type stars. Astron. Astrophys. 2021, 653, A53. [Google Scholar] [CrossRef]
  21. Mamon, G.A.; Glassgold, A.E.; Huggins, P.J. The Photodissociation of CO in Circumstellar Envelopes. Astrophys. J. 1988, 328, 797. [Google Scholar] [CrossRef]
  22. Saberi, M.; Vlemmings, W.H.T.; De Beck, E. Photodissociation of CO in the outflow of evolved stars. Astron. Astrophys. 2019, 625, A81. [Google Scholar] [CrossRef] [Green Version]
  23. McMullin, J.P.; Waters, B.; Schiebel, D.; Young, W.; Golap, K. CASA Architecture and Applications. In Astronomical Data Analysis Software and Systems XVI; Shaw, R.A., Hill, F., Bell, D.J., Eds.; Astronomical Society of the Pacific Conference Series; Astronomical Society of the Pacific (ASP): San Francisco, CA, USA, 2007; Volume 376, p. 127. [Google Scholar]
  24. Ramstedt, S.; Vlemmings, W.H.T.; Doan, L.; Danilovich, T.; Lindqvist, M.; Saberi, M.; Olofsson, H.; de, B.E.; Groenewegen, M.A.T.; Hoefner, S.; et al. VizieR Online Data Catalog: DEATHSTAR. Nearby AGB stars with ALMA ACA (Ramstedt+, 2020). VizieR On-line Data Catalog: J/A+A/640/A133. 2020. Available online: https://ui.adsabs.harvard.edu/abs/2020yCat..36400133R (accessed on 1 January 2022).
  25. Andriantsaralaza, M.; Ramstedt, S.; Vlemmings, W.H.T.; Danilovich, T.; de, B.E.; Groenewegen, M.A.T.; Hoefner, S.; Kerschbaum, F.; Khouri, T.; Lindqvist, M.; et al. VizieR Online Data Catalog: DEATHSTAR. II. The S-type (Andriantsaralaza+, 2021). VizieR On-line Data Catalog: J/A+A/653/A53. 2021. Available online: https://ui.adsabs.harvard.edu/abs/2021yCat..36530053A (accessed on 1 January 2022).
  26. Martí-Vidal, I.; Vlemmings, W.H.T.; Muller, S.; Casey, S. UVMULTIFIT: A versatile tool for fitting astronomical radio interferometric data. Astron. Astrophys. 2014, 563, A136. [Google Scholar] [CrossRef] [Green Version]
  27. Doan, L.; Ramstedt, S.; Vlemmings, W.H.T.; Mohamed, S.; Höfner, S.; De Beck, E.; Kerschbaum, F.; Lindqvist, M.; Maercker, M.; Paladini, C.; et al. The extended molecular envelope of the asymptotic giant branch star π1 Gruis as seen by ALMA. II. The spiral-outflow observed at high-angular resolution. Astron. Astrophys. 2020, 633, A13. [Google Scholar] [CrossRef] [Green Version]
  28. Schöier, F.L.; Olofsson, H. Models of circumstellar molecular radio line emission. Mass loss rates for a sample of bright carbon stars. Astron. Astrophys. 2001, 368, 969–993. [Google Scholar] [CrossRef] [Green Version]
  29. González Delgado, D.; Olofsson, H.; Kerschbaum, F.; Schöier, F.L.; Lindqvist, M.; Groenewegen, M.A.T. “Thermal” SiO radio line emission towards M-type AGB stars: A probe of circumstellar dust formation and dynamics. Astron. Astrophys. 2003, 411, 123–147. [Google Scholar] [CrossRef] [Green Version]
  30. Ramstedt, S.; Schöier, F.L.; Olofsson, H.; Lundgren, A.A. On the reliability of mass-loss-rate estimates for AGB stars. Astron. Astrophys. 2008, 487, 645–657. [Google Scholar] [CrossRef]
  31. Ramstedt, S.; Schöier, F.L.; Olofsson, H. Circumstellar molecular line emission from S-type AGB stars: Mass-loss rates and SiO abundances. Astron. Astrophys. 2009, 499, 515–527. [Google Scholar] [CrossRef] [Green Version]
  32. Ramstedt, S.; Mohamed, S.; Vlemmings, W.H.T.; Danilovich, T.; Brunner, M.; De Beck, E.; Humphreys, E.M.L.; Lindqvist, M.; Maercker, M.; Olofsson, H.; et al. The circumstellar envelope around the S-type AGB star W Aql. Effects of an eccentric binary orbit. Astron. Astrophys. 2017, 605, A126. [Google Scholar] [CrossRef] [PubMed]
  33. Neri, R.; Kahane, C.; Lucas, R.; Bujarrabal, V.; Loup, C. A (12) CO (J=1-> 0) and (J=2-> 1) atlas of circumstellar envelopes of AGB and post-AGB stars. Astron. Astrophys. Suppl. Ser. 1998, 130, 1–64. [Google Scholar] [CrossRef]
Figure 1. Example of measurement of the CO(2–1) size using uvmultifit for the S-star TT Cen. Top left: Azimuthally averaged real amplitude of the visibility data against baseline length, where the red line shows the best-fit Gaussian model to the visibility. Top right: Color map of the observed CO(2–1) line taken at the central velocity. Bottom left: Map corresponding to the best-fit model, and bottom right: map of the residual, i.e., observed, model, both at the central velocity.
Galaxies 10 00033 g001
Figure 2. Results from the visibility fitting to the data measured towards TT Cen (top) and FU Mon (bottom) [20] in bands 6 (left) and 7 (right). The source name is given in the upper left corner, and the transition is in the upper right corner of each plot. The upper blue and orange lines show the major- and minor-axis widths of the best-fitting Gaussian in each channel, respectively. The lower red and green lines show the RA and Dec offset relative to the center position, respectively.
Galaxies 10 00033 g002
Figure 3. Minor/major axis ratio in CO(2–1) and CO(3–2) taken at the center velocity channel for all the sources in our sample. The dotted line represents the 1-to-1 relation. The black dashed lines show the limits of an axis ratio equal to unity within 10 percent, and the red dashed lines highlight an axis ratio equal to 1.
Galaxies 10 00033 g003
Figure 4. Major axis of the best-fitting Gaussian at the central velocity channel of the CO (2–1) emission as a function of a proxy of circumstellar density [19,20]. The triangle symbols show the sources observed with ACA-only, while the round symbols represent those for which we have TP observations. The C-, S-, and M-type stars are red, green, and blue, respectively. The dashed lines show the photodissociation diameter of C-type, S-type, and M-type stars from Saberi et al. [22]. The dotted lines are the fits to the CO photodissociation sizes from Mamon et al. [21]. The solid lines represent the expected Gaussian FWHM of the CO(2–1) line obtained from radiative transfer modeling of the results of Saberi et al. [22].
Galaxies 10 00033 g004
Figure 5. The color maps show the CO(3–2) line at the center velocity channel for two aspherical sources in our sample, FU Mon (left) and RZ Sgr (right), with an rms noise of 0.121 Jy/beam and 0.097 Jy/beam, respectively. The blue and red contours represent the extreme blue- and redshifted velocities, respectively. The contour levels correspond to 5, 10, 20, and 35 times the rms noise. The ellipse in the bottom-left corner of each image represents the beam, with a size of 5.1 arcsec × 3.0 arcsec for FU Mon and 4.6 arcsec × 2.9 arcsec for RZ Sgr. The line profiles and uvmultifit results for these sources are available in [20].
Galaxies 10 00033 g005
Publisher’s Note: MDPI stays neutral with regard to jurisdictional claims in published maps and institutional affiliations.