Article

Studying Nearby Galactic Planetary Nebulae with MUSE: On the Physical Properties of IC 418

by
Ana Monreal-Ibero 
1,* and
Jeremy R. Walsh
2
1
Leiden Observatory, Leiden University, Niels Bohrweg 2, 2333 CA Leiden, The Netherlands
2
European Southern Observatory, 85748 Garching, Germany
*
Author to whom correspondence should be addressed.
Galaxies 2022, 10(1), 18; https://doi.org/10.3390/galaxies10010018
Submission received: 12 December 2021 / Revised: 10 January 2022 / Accepted: 17 January 2022 / Published: 19 January 2022
(This article belongs to the Special Issue Asymmetric Planetary Nebulae 8e)

Abstract

:
Spectroscopic mapping of planetary nebulae (PNe) is particularly useful to capture the richness in terms of physical and chemical properties that exist in these objects. The advent of the multi-unit spectroscopic explorer (MUSE), a large integral field unit mounted on the ESO Very Large Telescope, allow us to obtain this information over the whole face of galactic PNe in a reasonable amount of time. This in turn reveals a wealth of information that can bring insight into this structural complexity. Here we discuss new results from commissioning data for the physical properties of IC 418 and succinctly review recently published results on two additional targets (NGC 3132 and NGC 7009). For the newly-analysed PN, electron densities are high with n e ([S ii]) displaying a completely different structure than n e ([Cl iii]). The electron temperature was relatively uniform, but somewhat higher at the rim as measured by two of the three used diagnostics ([S iii] 6312/9069, and [Ar iii] 5192/7136). The joint results for the three PNe amply illustrate the potential of MUSE for the study of galactic PNe.

1. Introduction

Planetary nebulae (PNe), extended ionised nebulae emerging from the evolution of low-mass (<8 M ) stars, are morphologically and structurally complex objects. Within a given object, it is possible to find zones presenting a variety of ionisation conditions, covering a range in densities and temperatures. A range of chemical abundances may be present as well. To capture this richness in terms of physical and chemical properties, one would like to have spectroscopic information all over the surface of the nebula. Integral field spectroscopy (IFS), able to record simultaneously spectra of a relatively large area on the sky, offers an opportunity to gather that information. The technique has been used for about three decades, mostly (but not exclusively) by the extragalactic community. However, since the pioneering works in the first decade of the century [1,2,3,4], the number of studies on PNe making use of data collected by instruments based on this technique has been growing in a slow but steady manner (e.g., [5,6]).
The advent of the multi-unit spectroscopic explorer (MUSE) [7] has revolutionised the scene. With a field of view in its standard wide field mode of ∼ 60 × 60 and a spatial sampling of 0 . 2, MUSE can map whole galactic PNe in a reasonable amount of time. A summary of the MUSE data for PNe collected so far was provided by [8]. Results for two objects, NGC 3132 and NGC 7009, were presented in [9,10,11]. We refer to these publications for a thorough discussion on the physical and chemical properties of these objects. The main results we found for dust extinction, electron density ( n e ), and electron temperature ( T e ) were the following:
Extinction: Reddening maps were derived from the H α   to H β   line ratio. Consistency was checked using the redder Paschen lines. Both PNe presented evidence of small- and large-scale dust structures within the ionised volume. Extinction tended to be the highest at the rim, but other local maxima in extinction were present, as well.
Electron density: Maps were derived using the [S ii]  and [Cl iii]  line ratios. There were large variations within the nebulae for both diagnostics. While NGC 7009 typically displays n e ([S ii]) > n e ([Cl iii]), we found that in NGC 3132, n e ([S ii]) < n e ([Cl iii]). Besides, while in NGC 7009, densities are higher in the innermost part of the nebula and lower outside, in NGC 3132, the densities are higher at the rim.
Electron temperature: Maps were derived using several collisionally excited line (CEL) ratios, He i  a recombination line ratio and the Paschen Jump. We found large spatial variations in both nebulae. Besides, in both nebulae, temperature could be ordered from higher to lower values according to this sequence: [N ii]→ [S iii]→ He i→ Paschen Jump. Here, we will use the results for T e from the CELs.
Here, we present the first results on an additional PN, IC 418, also called “The Spirograph Nebula”. This is an elliptical nebula with its major axis at position angle of ∼35 ° , and a size of about 14 × 12 surrounded by a more extended low-level ionised halo. It has a variable central star, HD 35914, [12], classified as an Of (H-rich) type [13]. High spatial resolution images with the Hubble Space Telescope (HST) in H α   and [O iii] λ 5007 show an enhanced emission in an inner bubble and the weave-like pattern that gives the nebula its name [14]. A previous IFS-based study on this nebula revealed a region of enhanced electron temperature by means of the [O iii]4363/5007 line ratio, interpreted as a consequence of an inner photoionised shock caused by the stellar wind [15]. Mid-infrared maps in the 17.65- μ m band (dominated by dust emission but containing a faint spectral feature due the C 60 fullerene), in the 11.3- μ m band (containing dust emission and a spectral feature caused by polycyclic aromatic hydrocarbons, PAH), and the broad 9–13- μ m feature display a ring-like structure while the dust continuum emission at 9.8  μ m peaks closer to the central star [16]. Reported distances to the nebula range from 1.0 kpc [15] to 2.6 kpc [17]. Here, we will assume a distance of 1.36±0.05 kpc, as inferred from the Gaia Early Data Release 3 parallax (see https://gea.esac.esa.int/archive/).

2. The New Data: IC 418

2.1. Observations and Data Reduction

The Planetary Nebula IC 418 was observed as part of commissioning run 2a [7] of the MUSE instrument at the VLT on the night of 4 February 2014 between 00:59 and 01:26 UTC and released by ESO to the community afterwards. MUSE has a wavelength coverage of 4750–9300 Å  with a spectral sampling of 1.25 Å  and a spectral resolution of ∼2500.
Six exposures were taken in total. Two of them with a long exposure time (t e x p = 600 s), one with a moderate exposure time (t e x p = 60 s), and three with a short exposure time (t e x p = 10 s). In this work, we use the long and short exposure time data. Exposures with the same exposure time were taken at the same position and orientation, but there was a small offset in position and a difference of ∼20 in orientation, between exposures taken at different exposures times. These were not reflected in the header and were determined a posteriori by comparing continuum and emission line maps derived from the different data sets (see below). Observing conditions were clear and the seeing, as reported by the DIMM, was ∼0 . 8–1 . 0.
We reduced the data with the public MUSE Instrument Pipeline v1.6.1 [18] and EsoRex, version 3.12.3, using the delivered calibration frames (bias, flat field, arc lamp, and twilight exposures), the pipeline astrometric, and geometric files for commissioning data, the vignetting mask and the corresponding bad pixels, atmospheric extinction and sky lines tables. The reduction for each individual frame includes bias subtraction, flat-fielding and slice tracing, wavelength calibration, twilight sky correction, sky subtraction, and correction to barycentric velocities. In the last step, individual exposures were flux calibrated—using data for the spectrophotometric standard HD 49798, and corrected from differential atmospheric diffraction.
The final outcome were two cubes, one with a long (t t o t = 2 × 600 = 1200 s) and one with short (t t o t = 3 × 10 = 30 s) exposure time. Hereafter, we refer to them as the deep and shallow cubes, respectively. They have 314 × 307 × 3681 voxels and occupy 2.6 Gb each.
To have an idea of the mapped area and depth of the data, a reconstructed image in [N ii] λ 6584 is displayed in Figure 1. The inner part was done using the shallow cube, while the outer part was done using the deep one. For that, images in each cube were trimmed at f(H β ) = 8 × 10 16  cm 2 erg s 1 . The figure displays a flux range of ∼4 orders of magnitude, and clearly detects the halo in the nebula.

2.2. Line Emission Measurements

Information was derived on a spaxel-by-spaxel basis. We followed the same methodology as for NGC 3132 (see a thorough description in [11]). It makes use of images for the brightest isolated emission lines as initial conditions and is based on Gaussians fits with the Python package LMFIT (see https://lmfit.github.io/lmfit-py/).
For IC 418, we used as a starting point to identify the lines, the emission line catalog presented in [19], and cross-checked the rest-frame wavelength with the NIST Atomic Spectra Database (https://www.nist.gov/pml/atomic-spectra-database). As a guideline, we attempt to create a flux map for those lines that had a flux F ( λ ) 5 × 10 4 F (H β ), and were relatively isolated (i.e., no other emission line in the local continuum section or line(s) suitable for deblending), making a total of ∼90 lines. Most of them were independently fitted. In some cases, it was not possible to find a line-free spectral range around a given line wide enough to perform the fit. Then, exceptionally, several lines were fitted together. Thus, in addition to the exceptions listed in [11], we also jointly fitted (from blue to red): (i) The [Ar  iii] λ 5192 and [N i] λ 5199 emission lines, fixing the difference in wavelength between them; (ii) the set of four N ii  recombination lines at λ 5666, λ 5676, λ 5679, λ 5686, fixing the difference in wavelength between them; (iii) the two Si ii  lines at λ 6347 and λ 6371 together with [O i] λ λ 6300,6363 and [S iii] λ 6312, fixing the difference in wavelength between lines of the same ion; (iv) the C ii λ λ 7231,7236 doublet, fixing the difference in wavelength between them; and (v) the same criteria were used for the N i λ 8216 and N i λ 8223 recombination lines. Additionally, in all the cases we assumed the same width for all the lines in a given set.
In order to minimise the inclusion of bad fits results, line flux images were cleaned by masking those spaxels satisfying at least one of the following criteria: (i) A value for flux error in the fit equal to, or larger than, half the value for the line flux; (ii) a flux smaller than 10 18  cm 2 erg s 1 , due to the low signal-to-noise ratio of these lines. After inspection of the created flux maps and a selection of the spectral fits per line, we retain a total of 75 emission lines, those for which we were able to map a considerable portion of the nebula at least in the deep cube. In this contribution, we make use of a small subset of them.

3. Results

3.1. Presentation of Selected Emission Line Maps

The mapped area can differ, depending largely on the line and cube under consideration. Typically, strong lines (e.g., H β ) are saturated in the deep cube for the main nebula but can be mapped in the halo to an extent that depends on the strength of the line. In most of the cases, these strong lines are adequately mapped in the main nebula when using the shallow cube. Exceptions are H α   and [O iii] λ 5007, that saturate in some spaxels even in the shallow cube. There are some medium strength lines that have very good quality in the deep cube and acceptable quality in the shallow cube for the main nebula (e.g., the [Cl iii] λ λ 5518,5538). Some of the lines in this strength range were used to align both cubes (see below). Finally, there are many faint collisional and recombination lines for which we extracted a poor quality map from the shallow cube but an acceptable to good map, at least for the main nebula, from the deep cube. Some images presented a sort of pedestal in a ∼20 -wide horizontal band centered at the MUSE field of view. This was most visible in the deep exposures of the [O i] λ 5577 map and in some maps for the reddest lines, and it is always in the halo. An inspection of the line fits led us to conclude that this was caused by the existence of sky-line residuals not optimally subtracted in this part of the MUSE field view, that were wrongly interpreted as an emission line by the fitting routine. The masking criteria outlined above eliminated most of the spaxels affected by this. Yet, this pedestal is still visible in some maps and leaves a clear footprint in some of the maps presented here. The take away message from this general overview of the data is that in order to properly map the physical and chemical properties of IC 418, the information contained in both, the shallow and the deep images, needs to be combined in a non-trivial and tailored manner, depending on the line and part of the nebula under consideration. Thus, we needed to accurately determine the relative position and angle between both sets of images.
To align the cubes, we used extracted continuum images in the 9180–9220 Å  spectral range and fitted the central star to a 2D Gaussian function, whose centre allowed us to determine an offset between the shallow and deep cubes of ( Δ x p i x , Δ y p i x ) = (−1.52, 0.91). The full width half maximum of the Gaussian functions were ∼ 0 . 8 0 . 9 , very much in agreement with the value provided by the DIMM (see Section 2.1). Two other continuum ranges were also explored (4880–4920 Å  and 6800–6840 Å) but could not be used because the central star was saturated in the deep cube. Then, to determine the difference in rotation angle we used maps for emission lines with good signal-to-noise ratio (S/N) in the shallow cube but not saturated in the deep one, sampling a variety of ions (and thus structures) and spectral ranges. Specifically, we used, from blue to red, [Cl iii] λ 5538, He i λ 6678, [S ii] λ 6716, [Ar  iii] λ 7136, He i λ 7281, and Paschen 13 ( λ 8665). Each image for the shallow cube was translated and rotated between 17 and 23 , with steps of 0.2 . We chose, as a difference in rotation, the median of the angle that minimised the differences between the shallow image and the translated and rotated deep image, which was 19 . 0 . In this contribution, all the displayed maps will be presented using the position and orientation of the deep cube, irrespective of which cube (or part thereof) was used to create it. Both cubes were trimmed using an f(H β ) reference level, manually adjusted for each map. For flux maps, we wanted to avoid areas with saturated lines, while going as deep as possible. For line ratio maps, we additionally wanted to trim the involved images at the same f(H β ) level. In this way, we avoid mixing at a given position the shifted and rotated shallow data with the deep data, which can create artefacts due to interpolation.
A selection of the derived emission line flux maps are presented in Figure 2 (CELs) and Figure 3 (recombination lines). With the spatial resolution achieved with these ground-based observations, the nebula looks rather regular with relatively little structure. The area affected by the pedestal effect described above is clearly visible in some maps (e.g., [O i] λ 6300, [S iii] λ 9069) and will make rather cumbersome the use of these data to study the halo. Nonetheless, it is worth noticing that with only ≲0.5 h of telescope time, several lines are clearly detected in the halo. This was one of the first set of data taken with this instrument and in that sense, the optimal observing protocols to observe with MUSE in general, and PNe in particular, were not at play. This includes, for example, applying a dithering and rotation pattern to mitigate the instrumental footprint, or carefully adjust the exposure time to observe both strong and faint lines or both the nebula and halo. Similar observations taken nowadays, with the know-how acquired through the years, should not display these effects. Following, we present results for the main nebula.

3.2. Reddening

Extinction was derived using the hydrogen recombination lines and the RedCorr() class in PyNeb [20] version 1.1.13. Since H α   was saturated in a non-negligible fraction of spaxels, we decided to use the Paschen 9 (Pa9, λ 9229) and H β   lines as measured in the shallow cube together with the extinction law in [21]. For a T e between 8000 K and 150,000 K and a n e between 5000 cm 3 and 35,000 cm 3 , the H β /Pa9 is relatively constant. Specifically, it ranges between 38.4 and 41.2, decreasing with the temperature and almost independently of the density with a mean value (±standard deviation) of 39.9 ± 0.8. We adopted this mean value as intrinsic H β /Pa9 line ratio. Besides, the Pa9 map was convolved with a Gaussian to compensate for the difference in spatial resolution between the red (Pa9) and blue (H β ) part of the spectral range.
The derived map for the nebula is displayed in the right panel in Figure 1. The mean c(H β ) was 0.26 and the mean estimated uncertainty was 0.06. These values agree well with previous reported determinations of c(H β ), ranging between 0.14 [22] and 0.37 [23]. The value is also compatible with the foreground extinction reported of E ( B V ) 0.191 (corresponding to c(H β ) = 0.27) along this line of sight [24]. The consequence of not using a dithering or rotation pattern during the observations is clearly seen as artefacts in the map in the shape of diagonal stripes. Interestingly enough, the map presents some structure, even if this is not as marked as in e.g., NGC 7009 and NGC 3132, with higher extinction at the rim, where values can reach up to c(H β ) = 0.33. In that sense, this pattern is more reminiscent of the ring-like structure detected in the bands associated to the PAH and C 60 than to the dust continuum emission at 9.8  μ m [16].

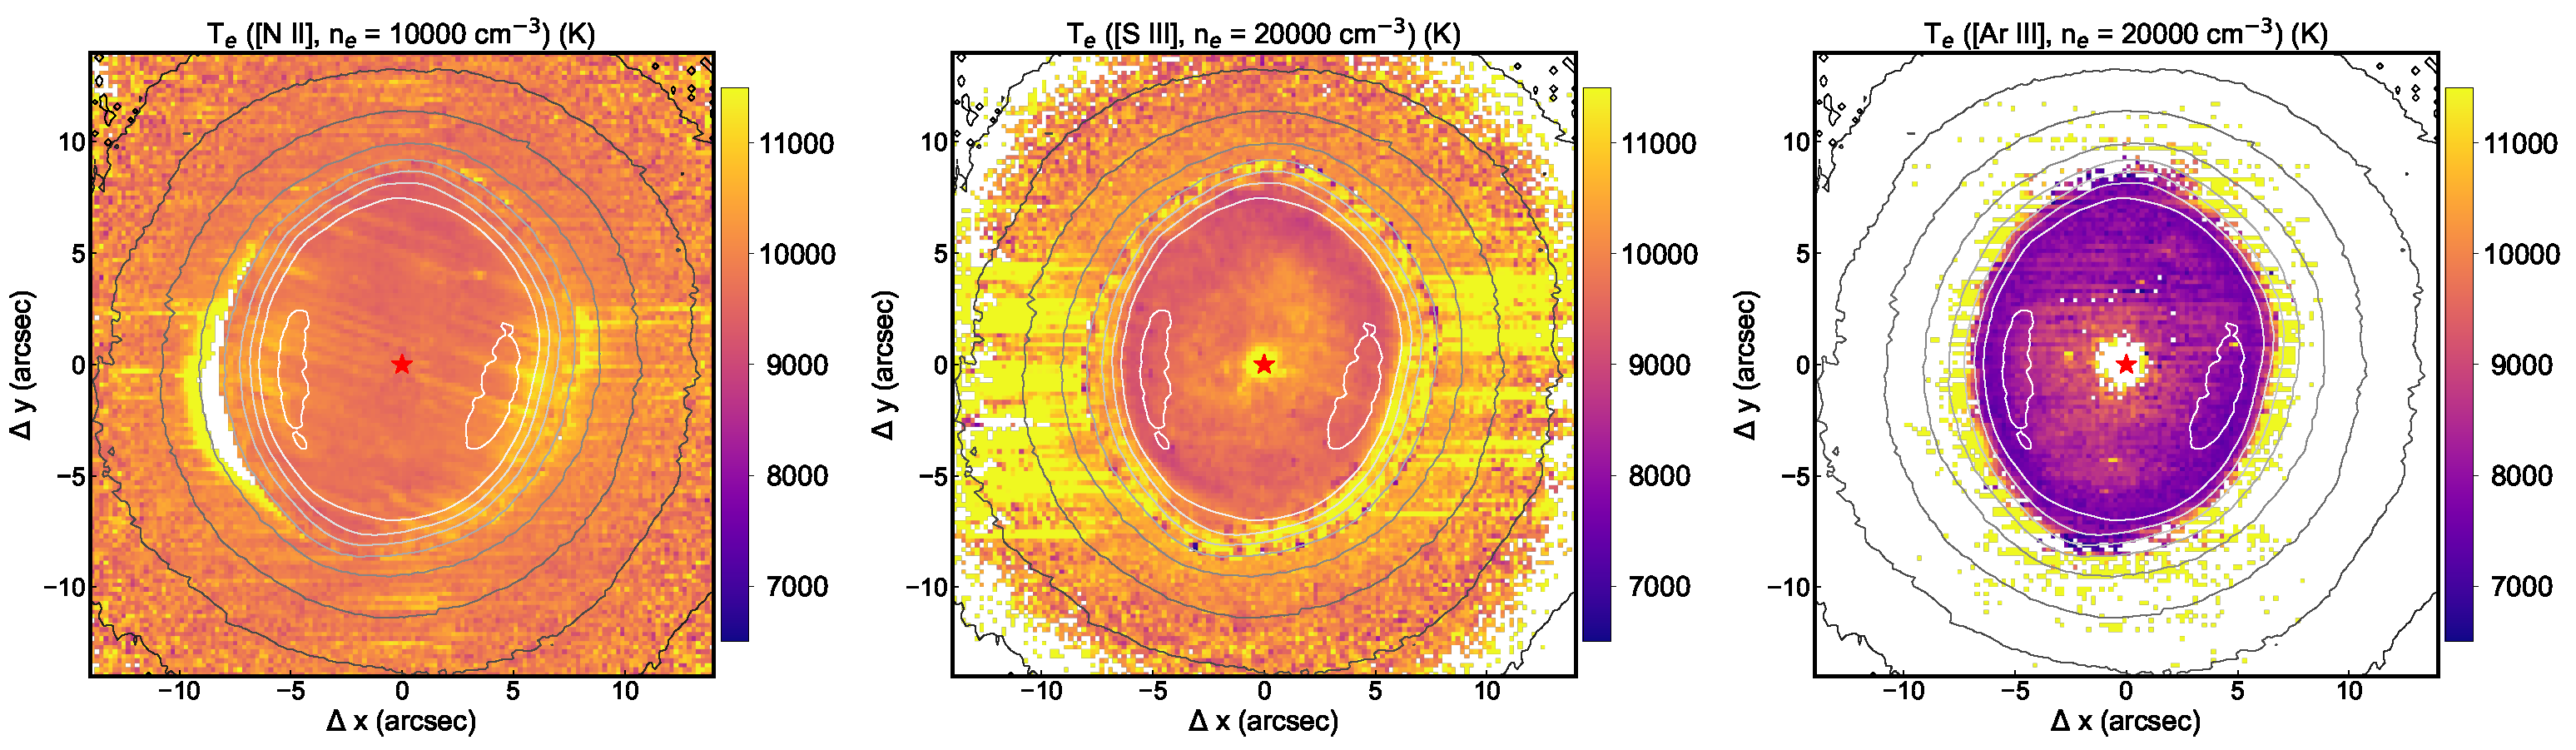
3.3. Electron Density and Temperature

We could derive n e and T e from several CEL ratios ([S ii] 6731/6716, [Cl iii] 5538/5518, [N ii] 5755/6584, [S iii] 6312/9069, and [Ar  iii] 5192/7136). These ratios are mostly sensitive to either density or temperature, while they are mildly or negligibly dependent on the other quantity. Ideally, and in the case of exquisite data quality, one would like to iteratively solve for all the physical quantities [25]. Here, we simply checked the dependence on n e and T e with the Atom.getEmissivity() method in PyNeb for all these diagnostics and the expected ranges of density and temperature. For those ratios sensitive to the density, the dependence with temperature was negligible. Thus, we could safely assume a T e = 10,000 K. The [S iii] 6312/9069 and [Ar  iii] 5192/7136 line ratios (sensitive to temperature) also displayed a negligible dependence on the density. For the [N ii] 5755/6584 line ratio, the dependence on the density was more evident but still lower or comparable to the uncertainty. Temperatures assuming n e ([S ii]) = 20,000 cm 3 were ∼1000 K lower than those assuming n e ([S ii]) = 10,000 cm 3 .
To translate our line ratios to T e and n e , we used the Atom.getTemDen() method with the default set of atomic data (transition probabilities and collision cross sections). Involved line fluxes maps were corrected from extinction using the map presented in Section 3.2. When we could not derive a value for c(H β ), we simply assumed c(H β ) = 0.27. Uncertainties were estimated by means of Monte Carlo simulations with 100 realisations.
Electron density maps are presented in Figure 4. The one from the chlorine lines was done using the deep cube while the one from the sulphur lines was done using a combination of the shallow (for the main nebula) and the deep (for the halo) cubes. We assumed T e = 10,000 K. Densities in the nebula are high. For n e ([S ii]), the median value was 6200 cm 3 with 50% of the spaxels with values between 3200 cm 3 and 9200 cm 3 . A clear gradient is seen: Densities are higher in the innermost nebula with values of up to 14,000 cm 3 and then they decrease when going to the halo, where values are ∼5000 cm 3 . As for comparison, reported single values of n e ([S ii]) for the whole nebula are ∼8400−15,000 cm 3 [15,26], comparable to those measured in the brightest and innermost part of IC 418. For n e ([Cl iii]), densities are even higher. The median value is n e ([Cl iii]) = 23,000 cm 3 , with 50% of the spaxels with values between 17,000 cm 3 and 29,000 cm 3 . The difference between n e ([S ii]) and n e ([Cl iii]) can partly be understood in terms of the lower critical density of the [S ii] transitions in comparison with those of [Cl iii]. However, the n e ([Cl iii]) map presents a completely different structure to that for n e ([S ii]): The innermost part of the nebula presents relatively low values (∼14,000 cm 3 ), then most of the main nebula has densities of n e ([Cl iii])∼20,000 cm 3 , and the highest densities are found close to the rim at the two arc-like structures with the highest surface brightness in H α . There, n e ([Cl iii]) reaches values of ∼40,000 cm 3 . The structure is similar, but with better signal-to-noise ratio, to the one found for NGC 3132 [11].
Electron temperature maps are presented in Figure 5. Those from the nitrogen and sulphur lines were done using a combination of the shallow (inner parts) and deep (outer parts) cubes. We did not derive T e ([N ii]) in the area just at Δ x = 7 in white since the [N ii] λ 6584 was saturated in the deep cube while the [N ii] λ 5575 line had very poor quality in the shallow cube. The so-called “pedestal effect” is clearly seen in the T e ([S iii]) map. The T e ([Ar iii]) map was done using the deep cube only.
The T e ([N ii]) map is the most homogeneous of the the three. The median value is 10,100 K with 50% of the spaxels with values between 9700 K and 10,500 K. This is good agreement within the uncertainties with single values reported in the literature (∼10,000 K, [15,26]). The similarity in T e inside and outside the rim is somewhat unexpected. Previous reported T e in PN haloes indicate that haloes are hot and in not thermal equilibrium. We attribute this similarity to our assumption of a constant density of n e = 10,000 cm 3 . Assuming a lower density in the halo, as hinted from the n e ([S ii]) map in Figure 4 would estimate higher temperatures in the halo, as expected. Both the T e ([S iii]) and the T e ([Ar iii]) maps are more structured with temperatures being higher at the rim, similar to the result reported for T e ([O iii]) and attributed to an inner stellar wind bubble shock [15]. However, there are differences between these two maps. While T e ([S iii]) values (median: 10,300 K; 50% of the spaxels between 9700 K and 11,000 K) are comparable to T e ([N ii]) values, T e ([Ar iii]) is systematically ∼1000 K lower (median 8 300 K, in perfect agreement with previous reported values [15]). These differences may be explained by the higher critical densities for [Ar iii] than for [S iii].

4. Conclusions

Integral field spectroscopy, in general, and MUSE, in particular, has revealed itself as an excellent tool to reveal the complex structure of PNe, in terms of morphology, physical and chemical properties, and even kinematics. This contribution discusses the physical properties, namely: Extinction, electron density, and temperature. We compile the results on two PNe (NGC 7009 and NGC 3132), and add new results for IC 418. The joint information for the three PNe allow us to draw the following general conclusions.
Extinction: All the three extinction maps reveal evidence of small and large scale structure within the nebulae. Besides, in all the three cases extinction tends to be higher at or close to the rim. Further evidence for peripheral enhancements of extinction in a few other PNe have already been reported [27]. Even if the sample is still small, these results suggest that many PNe possess internal dust and hence display reddening inhomogeneities.
Electron density: All three PNe present large variations within the nebula. However, no common trend is found. While in NGC 7009, n e ([S ii]) > n e ([Cl iii]), in NGC 3132 and IC 418, n e ([S ii]) < n e ([Cl iii]). Besides, while in NGC 7009 densities are higher in the innermost part of the nebula, and lower outside, in NGC 3132, densities are higher in the rim. Finally, in these two PNe both the n e ([S ii]) and n e ([Cl iii]) maps display, somehow, a similar structure while this is clearly not the case for IC 418 where the n e ([S ii]) and n e ([Cl iii]) maps display a completely different structure. This variety of results found using only three PNe highlights the complexity of these objects and desperately call for extending this kind of analysis to a larger sample.
Electron temperature: Again, all the three nebulae present some structure in temperatures at some level, although this is quite mild in the nebula analysed here. However, at least in two of the three used tracers, we found that temperatures were higher towards the rim.
The results discussed here, both new and compiled from previous works, illustrate the great potential that MUSE has for the study of PNe. There are however, key pieces of information that MUSE cannot provide. Specifically, it cannot reach the bluest part of the optical spectral range. Putting the focus on the physical properties, the bluest part of the optical spectrum contains features like the [O iii] λ 4363 auroral line to determine T e ([O iii]), the [O ii] λ λ 3726,3729 and [Ar iv] λ λ 4711,4740 doublets for n e determinations, or the Balmer jump to determine T e for recombination lines. Besides, and not discussed here, some key lines to determine ionic abundances also fall in this spectral range. Very promisingly, these needs will be fulfilled in the not so distant future with the BlueMUSE facility, a third-generation instrument planned for the VLT [28]. It will not only cover the blue part of the optical spectral range, but it will do so at a resolving power of >4000. Thus, besides providing information for additional diagnostics of the physical and chemical properties, it will open the door, for detailed kinematics studies of PNe.

Author Contributions

A.M.-I. attended the Asymmetrical Post-main-sequence Nebulae 8 e2021: The Shaping of Stellar Outflows conference, a virtual meeting hosted in Granada, Spain where the work on NGC 3132 and NGC 7009 was presented. The project for each nebula was led by A.M.-I. and J.R.W., respectively. Additionally, A.M.-I. led the exploration of the IC 418 data presented here. All authors have read and agreed to the published version of the manuscript.

Funding

A.M.-I. is grateful to ESO Garching, where part of this work was carried out, for their hospitality and funding via their visitor programme.

Data Availability Statement

The data presented in this study are openly available in ESO archive (http://archive.eso.org/cms/eso-data.html).

Acknowledgments

The authors are very grateful to David Carton and Jarle Brinchmann for their initial assessment of the quality of the MUSE Commissioning data for PNe. Their suggestions prompted us to reduce the data presented in this contribution. We also thank the four referees for the valuable comments that helped us to improve and clarify the first submitted version of this article.

Conflicts of Interest

The authors declare no conflict of interest.

Abbreviations

The following abbreviations are used in this manuscript:
CELCollisionally excited line
IFSIntegral field spectroscopy
MUSEMulti-unit spectroscopic explorer
PAHPolycyclic aromatic hydrocarbons
PNPlanetary nebula

References

  1. Monreal-Ibero, A.; Roth, M.M.; Schönberner, D.; Steffen, M.; Böhm, P. Integral Field Spectroscopy of Faint Halos of Planetary Nebulae. Astrophys. J. 2005, 628, L139–L142. [Google Scholar] [CrossRef]
  2. Monreal-Ibero, A.; Roth, M.M.; Schönberner, D.; Steffen, M.; Böhm, P. Working with VIMOS-IFU data: Searching and characterizing the faint haloes of planetary nebulae. New Astron. Rev. 2006, 50, 426–429. [Google Scholar] [CrossRef]
  3. Sandin, C.; Schönberner, D.; Roth, M.M.; Steffen, M.; Böhm, P.; Monreal-Ibero, A. Spatially resolved spectroscopy of planetary nebulae and their halos. I. Five galactic disk objects. Astron. Astrophys. 2008, 486, 545–567. [Google Scholar] [CrossRef] [Green Version]
  4. Tsamis, Y.G.; Walsh, J.R.; Péquignot, D.; Barlow, M.J.; Danziger, I.J.; Liu, X.W. Integral field spectroscopy of planetary nebulae: Mapping the line diagnostics and hydrogen-poor zones with VLT FLAMES. Mon. Not. R. Astron. Soc. 2008, 386, 22–46. [Google Scholar] [CrossRef] [Green Version]
  5. Monteiro, H.; Gonçalves, D.R.; Leal-Ferreira, M.L.; Corradi, R.L.M. Spatially resolved physical and chemical properties of the planetary nebula NGC 3242. Astron. Astrophys. 2013, 560, A102. [Google Scholar] [CrossRef] [Green Version]
  6. Ali, A.; Dopita, M.A.; Basurah, H.M.; Amer, M.A.; Alsulami, R.; Alruhaili, A. IFU spectroscopy of southern planetary nebulae—III. Mon. Not. R. Astron. Soc. 2016, 462, 1393–1404. [Google Scholar] [CrossRef] [Green Version]
  7. Bacon, R.; Accardo, M.; Adjali, L.; Anwand, H.; Bauer, S.; Biswas, I.; Blaizot, J.; Boudon, D.; Brau-Nogue, S.; Brinchmann, J.; et al. The MUSE second-generation VLT instrument. In Ground-Based and Airborne Instrumentation for Astronomy III; SPIE: Bellingham, WA, USA, 2010; Volume 7735, p. 773508. [Google Scholar] [CrossRef]
  8. Walsh, J.R.; Monreal-Ibero, A. Integral Field Spectroscopy of Planetary Nebulae with MUSE. Galaxies 2020, 8, 31. [Google Scholar] [CrossRef] [Green Version]
  9. Walsh, J.R.; Monreal-Ibero, A.; Barlow, M.J.; Ueta, T.; Wesson, R.; Zijlstra, A.A. The extinction and dust-to-gas structure of the planetary nebula NGC 7009 observed with MUSE. Astron. Astrophys. 2016, 588, A106. [Google Scholar] [CrossRef] [Green Version]
  10. Walsh, J.R.; Monreal-Ibero, A.; Barlow, M.J.; Ueta, T.; Wesson, R.; Zijlstra, A.A.; Kimeswenger, S.; Leal-Ferreira, M.L.; Otsuka, M. An imaging spectroscopic survey of the planetary nebula NGC 7009 with MUSE. Astron. Astrophys. 2018, 620, A169. [Google Scholar] [CrossRef] [Green Version]
  11. Monreal-Ibero, A.; Walsh, J.R. The MUSE view of the planetary nebula NGC 3132. Astron. Astrophys. 2020, 634, A47. [Google Scholar] [CrossRef]
  12. Gilra, D.P.; Pottasch, S.R.; Wesselius, P.R.; van Duinen, R.J. Ultraviolet observations of planetary nebulae. III. Variability of the central star. Astron. Astrophys. 1978, 63, 297–301. [Google Scholar]
  13. Acker, A.; Marcout, J.; Ochsenbein, F.; Stenholm, B.; Tylenda, R.; Schohn, C. The Strasbourg-ESO Catalogue of Galactic Planetary Nebulae. Parts I, II; European Southern Observatory: Garching, Germany, 1992. [Google Scholar]
  14. Sahai, R.; Morris, M.R.; Villar, G.G. Young Planetary Nebulae: Hubble Space Telescope Imaging and a New Morphological Classification System. Astron. J. 2011, 141, 134. [Google Scholar] [CrossRef] [Green Version]
  15. Dopita, M.A.; Ali, A.; Sutherland, R.S.; Nicholls, D.C.; Amer, M.A. IFU spectroscopy of southern planetary nebulae IV: A physical model for IC 418. Mon. Not. R. Astron. Soc. 2017, 470, 839–864. [Google Scholar] [CrossRef] [Green Version]
  16. Díaz-Luis, J.J.; García-Hernández, D.A.; Manchado, A.; García-Lario, P.; Villaver, E.; García-Segura, G. GTC/CanariCam Mid-IR Imaging of the Fullerene-rich Planetary Nebula IC 418: Searching for the Spatial Distribution of Fullerene-like Molecules. Astron. J. 2018, 155, 105. [Google Scholar] [CrossRef] [Green Version]
  17. Kudritzki, R.P.; Urbaneja, M.A.; Puls, J. Atmospheres and Winds of PN Central Stars. In Planetary Nebulae in Our Galaxy and Beyond; Barlow, M.J., Méndez, R.H., Eds.; Cambridge University Press: Cambridge, UK, 2006; Volume 234, pp. 119–126. [Google Scholar] [CrossRef] [Green Version]
  18. Weilbacher, P.M.; Palsa, R.; Streicher, O.; Bacon, R.; Urrutia, T.; Wisotzki, L.; Conseil, S.; Husemann, B.; Jarno, A.; Kelz, A.; et al. The Data Processing Pipeline for the MUSE Instrument. Astron. Astrophys. 2020, 641, A28. [Google Scholar] [CrossRef]
  19. Sharpee, B.; Williams, R.; Baldwin, J.A.; van Hoof, P.A.M. Introducing EMILI: Computer-aided Emission Line Identification. Astrophys. J. Suppl. 2003, 149, 157–187. [Google Scholar] [CrossRef] [Green Version]
  20. Luridiana, V.; Morisset, C.; Shaw, R.A. PyNeb: A new tool for analyzing emission lines. I. Code description and validation of results. Astron. Astrophys. 2015, 573, A42. [Google Scholar] [CrossRef]
  21. Cardelli, J.A.; Clayton, G.C.; Mathis, J.S. The relationship between infrared, optical, and ultraviolet extinction. Astrophys. J. 1989, 345, 245–256. [Google Scholar] [CrossRef]
  22. Henry, R.B.C.; Kwitter, K.B.; Bates, J.A. A New Look at Carbon Abundances in Planetary Nebulae. IV. Implications for Stellar Nucleosynthesis. Astrophys. J. 2000, 531, 928–941. [Google Scholar] [CrossRef] [Green Version]
  23. Gutierrez-Moreno, A.; Moreno, H. Studies of Southern Planetary Nebulae. III. Chemical Abundances. Publ. Astron. Soc. Pac. 1988, 100, 1497. [Google Scholar] [CrossRef]
  24. Capitanio, L.; Lallement, R.; Vergely, J.L.; Elyajouri, M.; Monreal-Ibero, A. Three-dimensional mapping of the local interstellar medium with composite data. Astron. Astrophys. 2017, 606, A65. [Google Scholar] [CrossRef] [Green Version]
  25. Ueta, T.; Otsuka, M. Proper Plasma Analysis Practice (PPAP), an Integrated Procedure of Extinction Correction and Plasma Diagnostics: A Demo with an HST/WFC3 Image Set of NGC 6720. Publ. Astron. Soc. Pac. 2021, 133, 093002. [Google Scholar] [CrossRef]
  26. Delgado-Inglada, G.; Rodríguez, M.; Peimbert, M.; Stasińska, G.; Morisset, C. Oxygen enrichment in carbon-rich planetary nebulae. Mon. Not. R. Astron. Soc. 2015, 449, 1797–1810. [Google Scholar] [CrossRef] [Green Version]
  27. Phillips, J.P.; Cuesta, L. Extinction Mapping of the Bipolar Outflow NGC 2346. Astron. J. 2000, 119, 335–341. [Google Scholar] [CrossRef] [Green Version]
  28. Richard, J.; Bacon, R.; Blaizot, J.; Boissier, S.; Boselli, A.; Bouché, N.; Brinchmann, J.; Castro, N.; Ciesla, L.; Crowther, P. BlueMUSE: Project Overview and Science Cases. arXiv 2019, arXiv:1906.01657. [Google Scholar]
Figure 1. (Left): Reconstructed image of IC 418 in the [N ii] λ 6584 emission line, made by line fitting to a Gaussian function (see main text for details). For reference, in this and further maps in this work, a similar map for H β is overplotted with 30 evenly-spaced contours (in logarithmic scale), ranging from 2.5 × 10 17 erg cm 2 s 1 (white) to 1 × 10 13 erg cm 2 s 1 (black). The position of the central star, HD 35914, (R.A.(J2000) = 05 h 27 m 31.5 s Dec(J2000)= 12 d 40 m 57 s ) is marked with a red star. (Right): Zoom on the central part of the field of view displaying the log extinction at H β , c(H β ).
Galaxies 10 00018 g001
Figure 2. Reconstructed images of IC 418 in a representative set of forbidden emission lines. In the upper row, three oxygen emission lines made by line fitting to a Gaussian function: O 0 from the [O i] λ 6300 line (left), O + (ionisation potential, I.P., 13.62 eV) from the [O ii] λ 7331 line (centre), and O + + (I.P., 35.12 eV) from the [O iii] λ 4959 line (right). In the lower row, we show three emission line maps for ions sampling as much as possible for our covered range of I.P. Specifically, they are the λ 8620 line for Fe + (I.P. 7.9 eV), the λ 6731 line for S + (I.P. 10.36 eV), and the λ 9069 line for S + + (I.P. 23.34 eV). All the maps but the one for [Fe ii] λ 8620 were made by combining the maps for the shallow (inner part) and deep (outer part) datacubes as the map in Figure 1. The one presented for [Fe ii] λ 8620 was made using the deep cube only.
Galaxies 10 00018 g002
Figure 3. Reconstructed image of IC 418 in a representative set of recombination lines. From (left) to (right) and from (top) to (bottom) these are He i λ 6678, N i λ 8237, N ii5686, O i λ 7002, Si ii λ 6347, and C ii λ 7231. For reference and comparison, the same map for H β as in Figure 1 is overplotted. All the maps were made using the deep cube only, but the one for He i λ 6678 that was made by combining the maps for the shallow (inner part) and deep (outer part) datacubes as the map in Figure 1.
Galaxies 10 00018 g003
Figure 4. Maps of n e determined from [S ii] (left) and [Cl iii] (right) line ratios and a T e = 10,000 K. The covered area is the same as in the right map in Figure 1.
Galaxies 10 00018 g004
Figure 5. Maps of T e determined from [N ii] (left), [S iii] (middle), and [Ar iii] (right) line ratios. We assumed n e = 10,000 cm 3 for the first one and n e = 20,000 cm 3 for the other two. The covered area is the same as in the right map in Figure 1.
Galaxies 10 00018 g005
Publisher’s Note: MDPI stays neutral with regard to jurisdictional claims in published maps and institutional affiliations.

