A Metabolomics Approach to Pharmacotherapy Personalization


Abstract
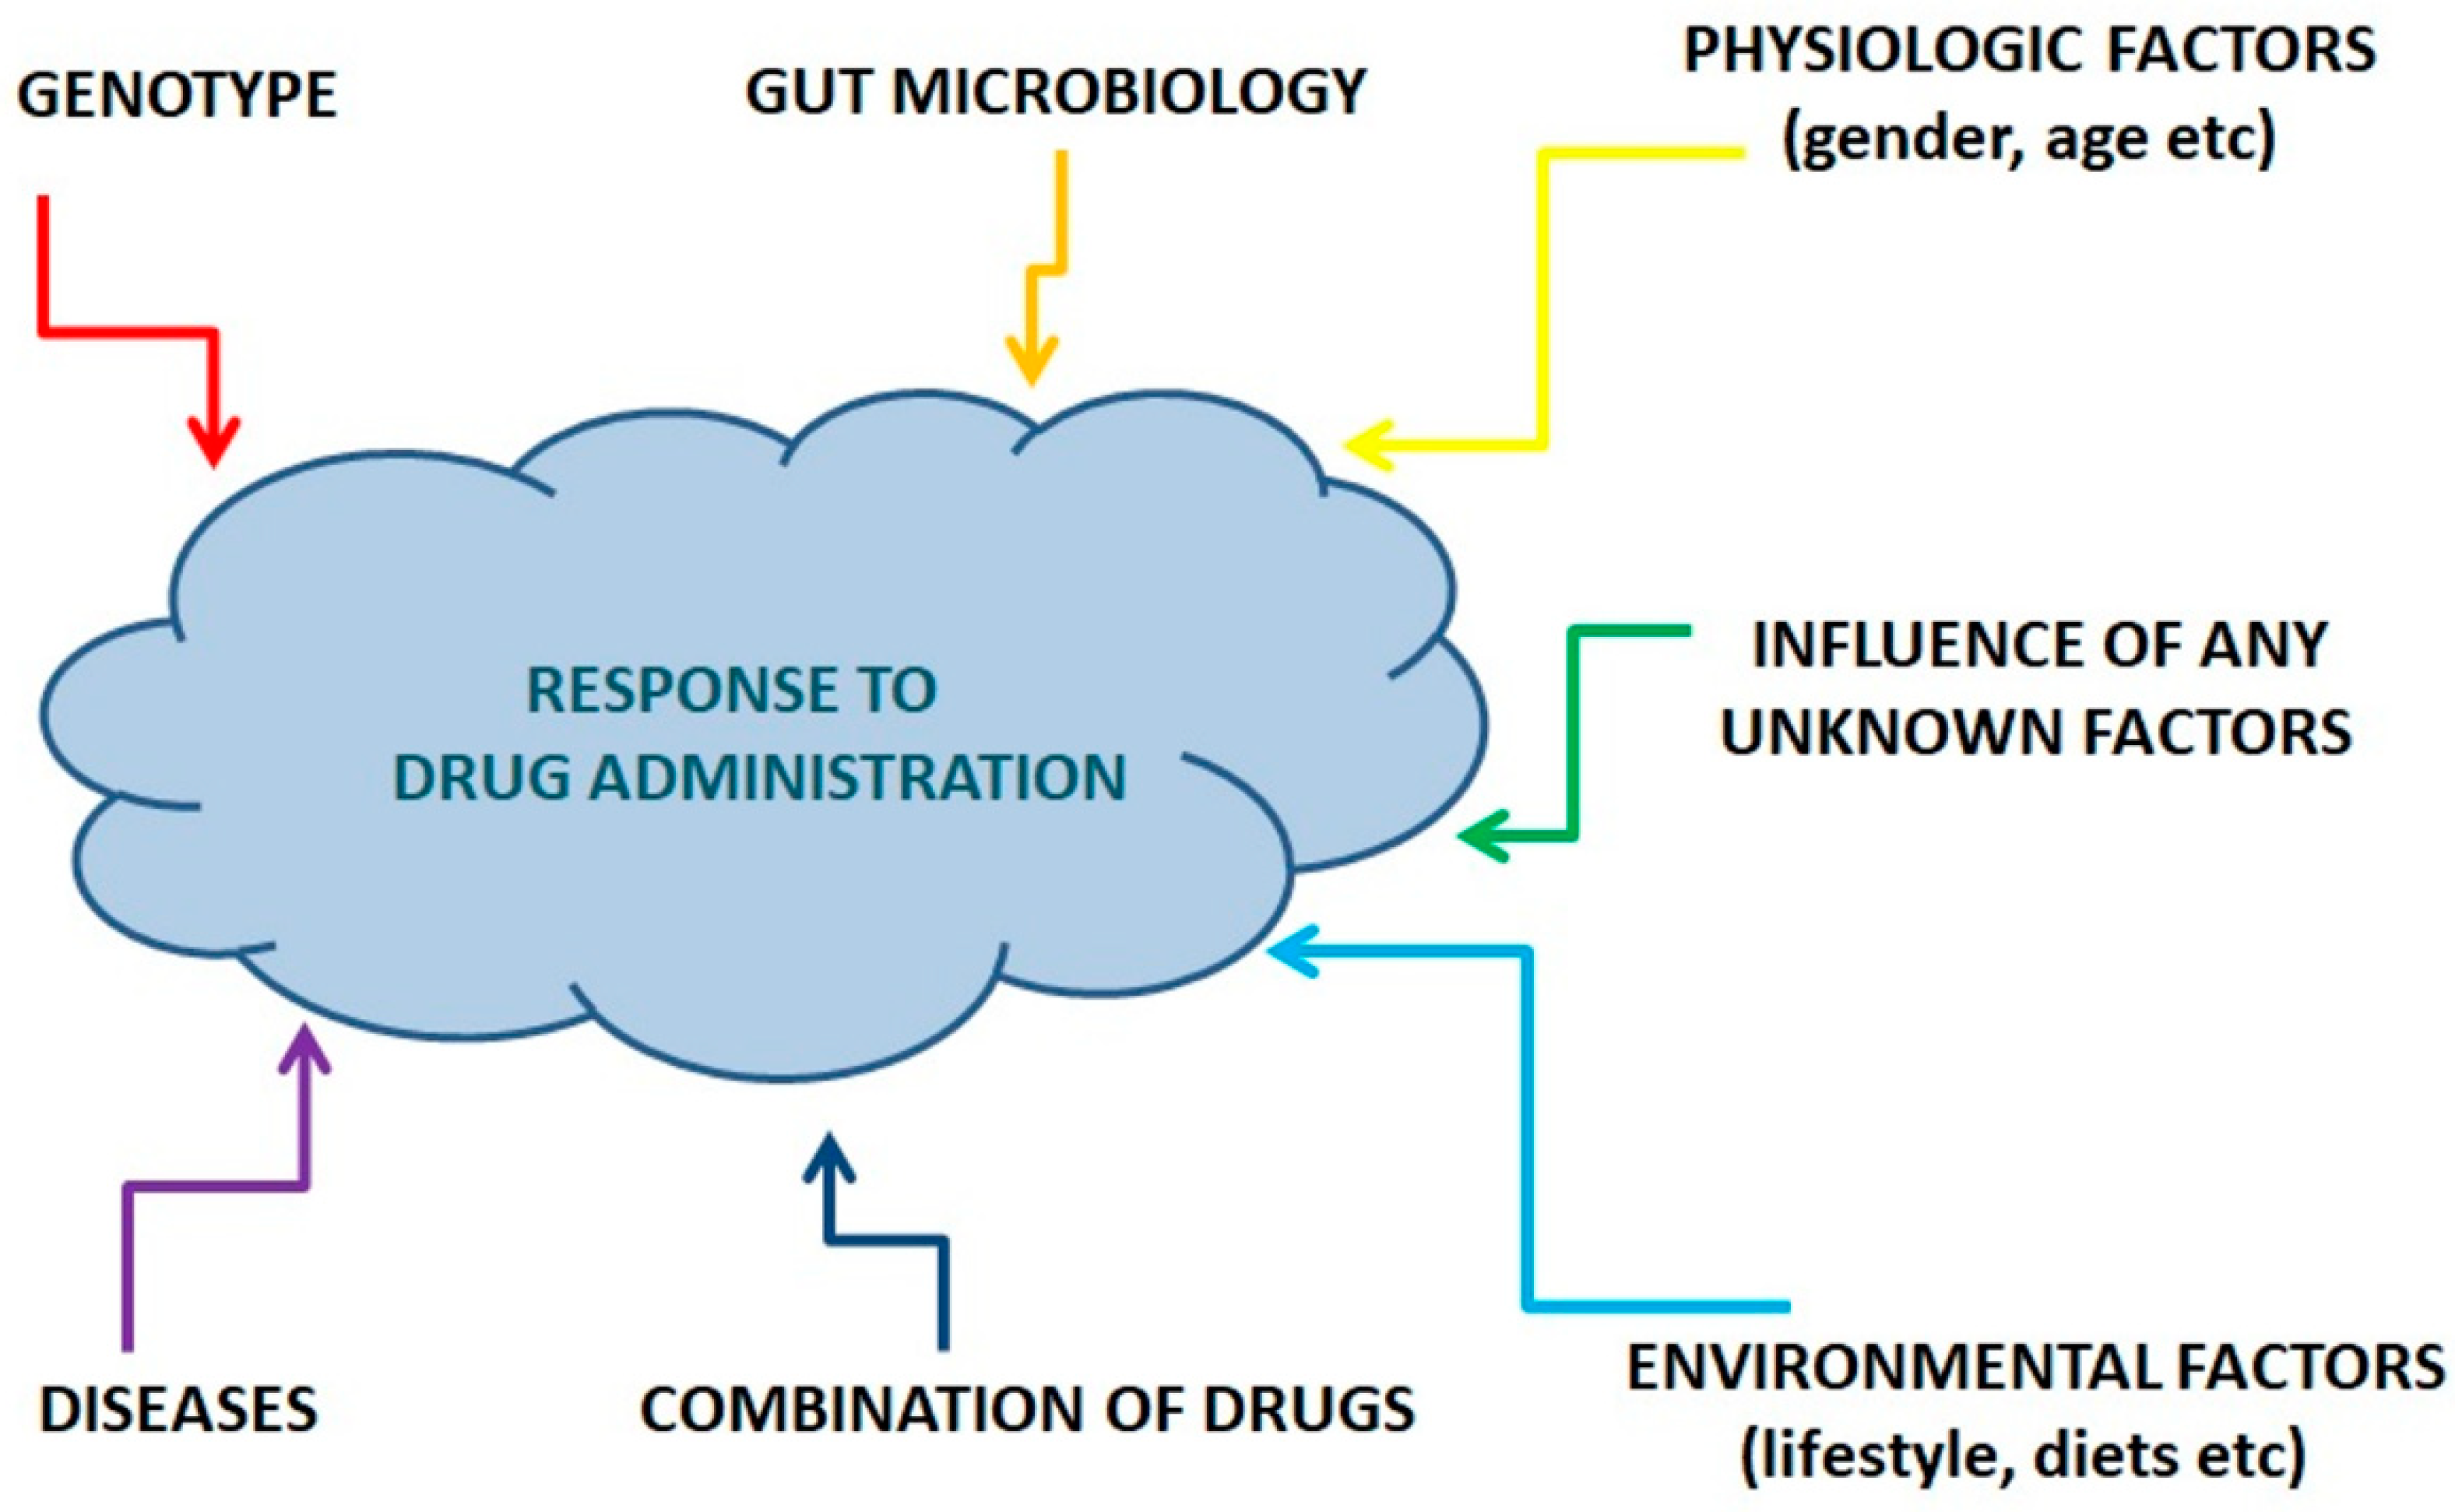
1. Introduction
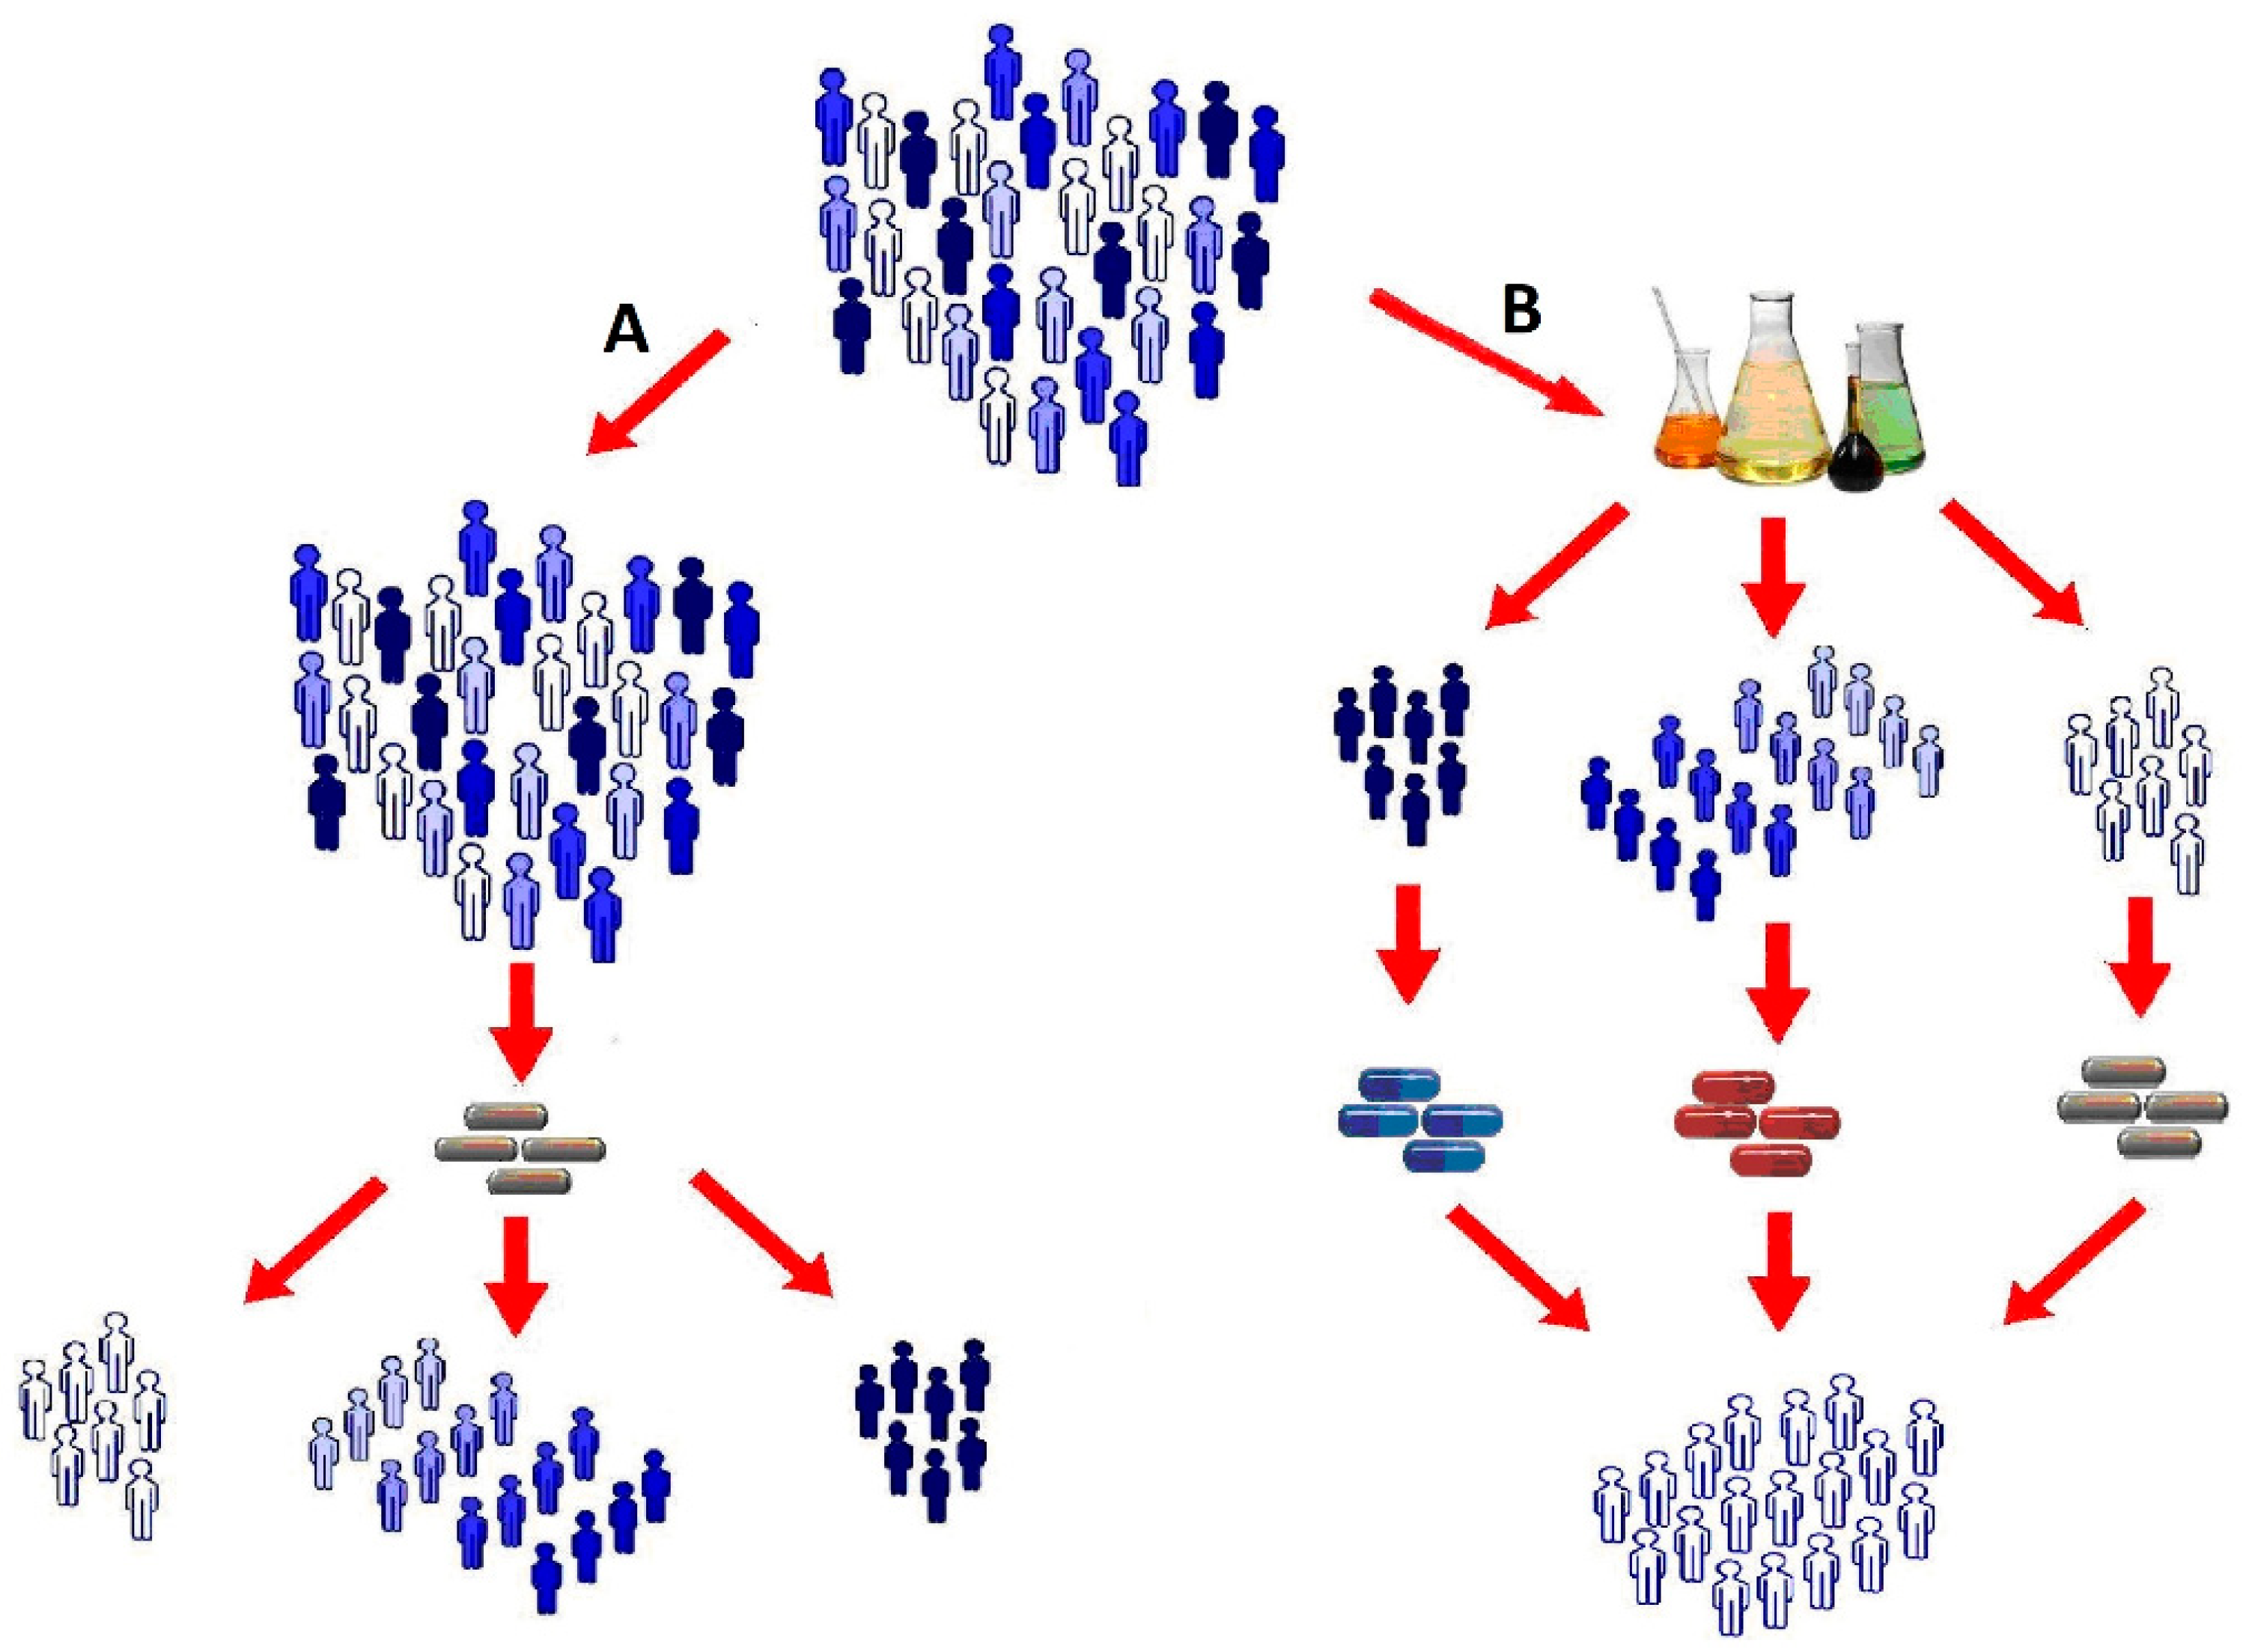
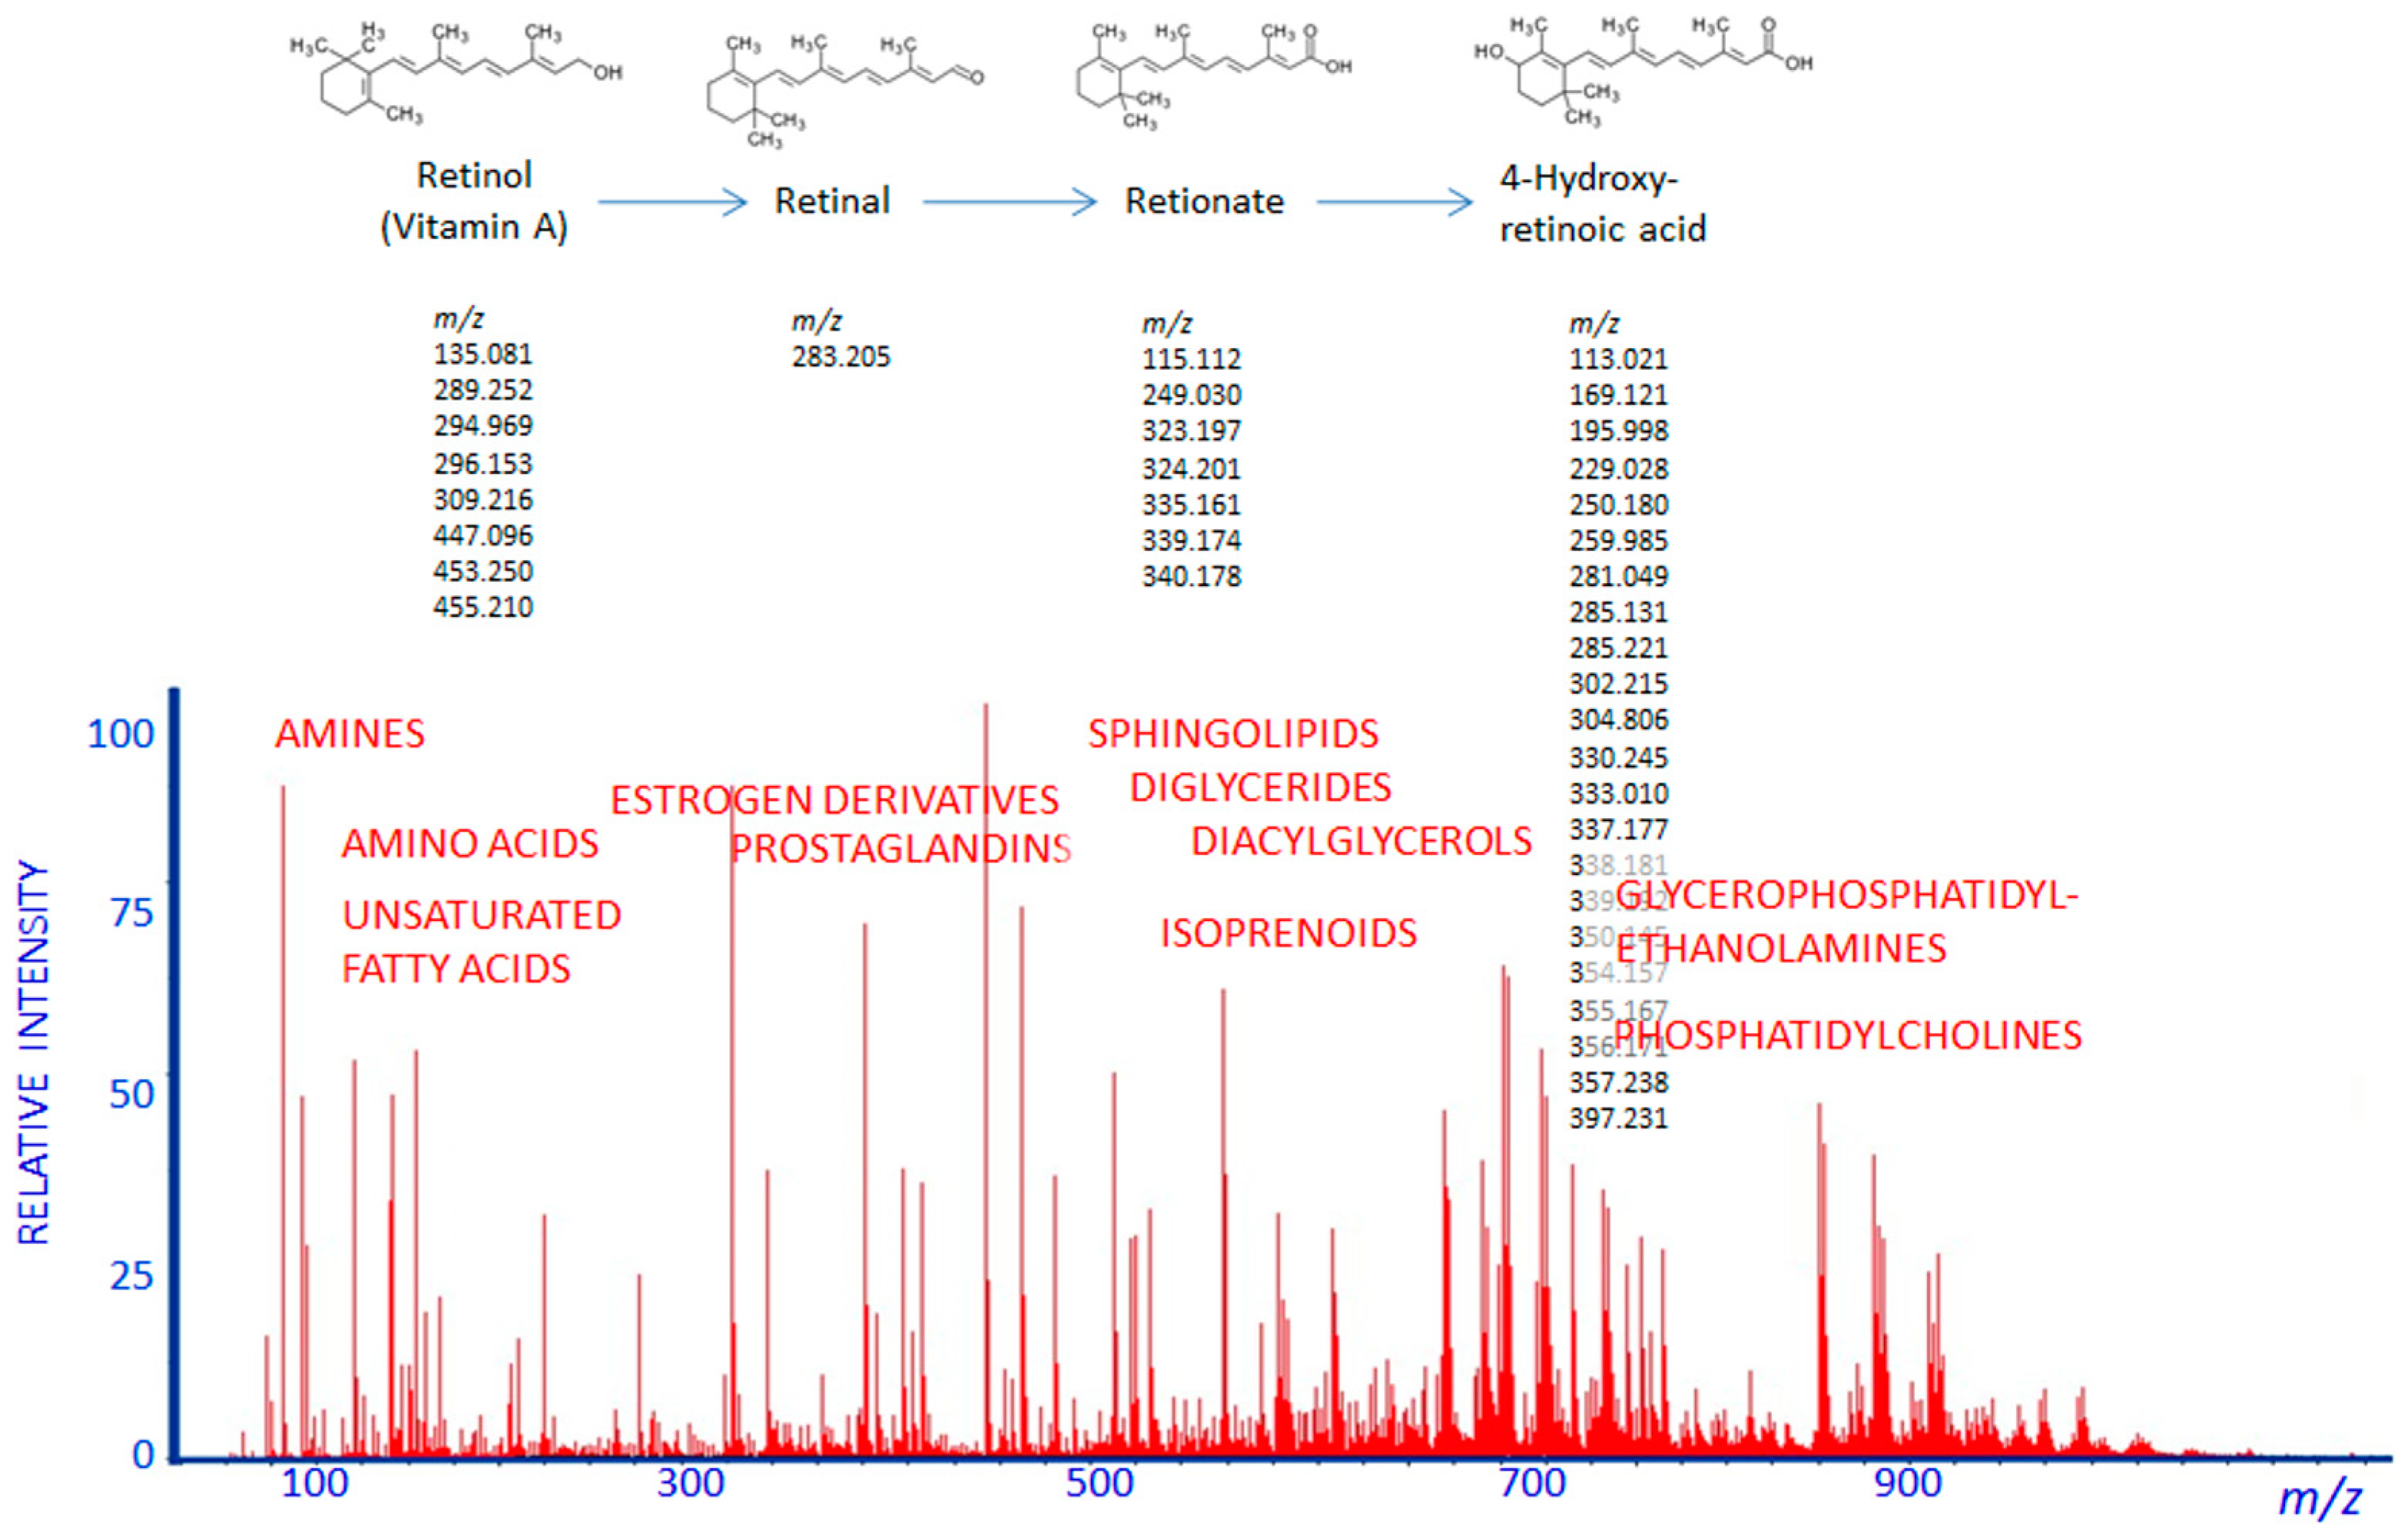
2. Pharmacometabolomics Methodology
3. Pharmacometabolomics: The Metabolomics Approach to Practical Medicine
4. Comparison of Pharmacometabolomics and Pharmacogenomics
5. Comparison of Pharmacometabolomics and Pharmacoproteomics
6. Comparison of Pharmacometabolomics and Therapeutic Drug Monitoring
7. Conclusions
Funding
Conflicts of Interest
References
- Aspinall, M.G.; Hamermesh, R.G. Realizing the promise of personalized medicine. Harv. Bus. Rev. 2007, 85, 108–117. [Google Scholar] [PubMed]
- Piquette-Miller, M.; Grant, D.M. The art and science of personalized medicine. Clin. Pharmacol. Ther. 2007, 81, 311–315. [Google Scholar] [CrossRef] [PubMed]
- Lazarou, J.; Pomeranz, B.H.; Corey, P.N. Incidence of adverse drug reactions in hospitalized patients: A meta-analysis of prospective studies. JAMA 1998, 279, 1200–1205. [Google Scholar] [CrossRef] [PubMed]
- Patidar, D.; Rajput, M.S.; Nirmal, N.P.; Savitri, W. Implementation and evaluation of adverse drug reaction monitoring system in a tertiary care teaching hospital in Mumbai, India. Interdiscip. Toxicol. 2013, 6, 41–46. [Google Scholar] [CrossRef] [PubMed]
- Alomar, M.J. Factors affecting the development of adverse drug reactions. Saudi Pharm. J. 2014, 22, 83–94. [Google Scholar] [CrossRef] [PubMed]
- Hoffmann, W.; Krafczyk-Korth, J.; Völzke, H.; Fendrich, K.; Kroemer, H.K. Towards a unified concept of individualized medicine. Pers. Med. 2011, 8, 111–113. [Google Scholar] [CrossRef] [PubMed]
- Pokorska-Bocci, A.; Stewart, A.; Sagoo, G.S.; Hall, A.; Kroese, M.; Burton, H. ‘Personalized medicine’: What’s in a name? Pers. Med. 2014, 11, 197–210. [Google Scholar] [CrossRef] [PubMed]
- Ghosh, S.; Drummond, H.E.; Ferguson, A. Neglect of growth and development in the clinical monitoring of children and teenagers with inflammatory bowel disease: Review of case records. BMJ 1998, 317, 120–121. [Google Scholar] [CrossRef] [PubMed]
- Lawton, K.; Berger, A.; Mitchell, M.; Milgram, E.; Evans, A.; Guo, L.; Hanson, R.W.; Kalhan, S.C.; Ryals, J.A.; Milburn, M.V. Analysis of the adult human plasma metabolome. Future Med. 2008, 9, 383–397. [Google Scholar] [CrossRef] [PubMed]
- Manzoni, C.; Kia, D.A.; Vandrovcova, J.; Hardy, J.; Wood, N.W.; Lewis, P.A.; Ferrari, R. Genome, transcriptome and proteome: The rise of omics data and their integration in biomedical sciences. Brief. Bioinform. 2018, 19, 286–302. [Google Scholar] [CrossRef] [PubMed]
- Chen, R.; Snyder, M. Promise of personalized omics to precision medicine. Wiley Interdiscip. Rev. Syst. Biol. Med. 2013, 5, 73–82. [Google Scholar] [CrossRef] [PubMed]
- Nicholson, J.K.; Lindon, J.C. Systems biology: Metabonomics. Nature 2008, 455, 1054–1056. [Google Scholar] [CrossRef] [PubMed]
- Patti, G.J.; Yanes, O.; Siuzdak, G. Innovation: Metabolomics: The apogee of the omics trilogy. Nat. Rev. Mol. Cell Biol. 2012, 13, 263–269. [Google Scholar] [CrossRef] [PubMed]
- Kaddurah-Daouk, R.; Kristal, B.S.; Weinshilboum, R.M. Metabolomics: A global biochemical approach to drug response and disease. Annu. Rev. Pharmacol. Toxicol. 2008, 48, 653–683. [Google Scholar] [CrossRef] [PubMed]
- Russell, C.; Rahman, A.; Mohammed, A.R. Application of genomics, proteomics and metabolomics in drug discovery, development and clinic. Ther. Deliv. 2013, 4, 395–413. [Google Scholar] [CrossRef] [PubMed]
- Kim, H.J.; Yoon, Y.R. Pharmacometabolomics: Current Applications and Future Perspectives. Transl. Clin. Pharmacol. 2014, 22, 8–10. [Google Scholar] [CrossRef]
- Nicholson, J.K.; Wilson, I.D.; Lindon, J.C. Pharmacometabonomics as an effector for personalized medicine. Pharmacogenomics 2011, 12, 103–111. [Google Scholar] [CrossRef] [PubMed]
- Yan, S.K.; Liu, R.H.; Jin, H.Z.; Liu, X.R.; Ye, J.; Shan, L.; Zhang, W.D. “Omics” in pharmaceutical research: Overview, applications, challenges, and future perspectives. Chin. J. Nat. Med. 2015, 13, 3–21. [Google Scholar] [CrossRef]
- Gutiu, I.A.; Andries, A.; Radulescu, F.; Georgescu, A.-M.; Cioaca, D. Pharmacometabolomics, Pharmacogenomics and Personalized Medicine. Rom. J. Intern. Med. 2010, 48, 187–191. [Google Scholar] [PubMed]
- Wishart, D.S. Applications of metabolomics in drug discovery and development. Drugs R D 2008, 9, 307–322. [Google Scholar] [CrossRef] [PubMed]
- Momper, J.D.; Wagner, J.A. Therapeutic drug monitoring as a component of personalized medicine: Applications in pediatric drug development. Clin. Pharmacol. Ther. 2014, 95, 138–140. [Google Scholar] [CrossRef] [PubMed]
- Trifonova, O.; Lokhov, P.; Archakov, A. Postgenomics diagnostics: Metabolomics approaches to human blood profiling. OMICS 2013, 17, 550–559. [Google Scholar] [CrossRef] [PubMed]
- Schnackenberg, L.K.; Beger, R.D. The role of metabolic biomarkers in drug toxicity studies. Toxicol. Mech. Methods 2008, 18, 301–311. [Google Scholar] [CrossRef] [PubMed]
- Dunn, W.B.; Broadhurst, D.I.; Atherton, H.J.; Goodacre, R.; Griffin, J.L. Systems level studies of mammalian metabolomes: The roles of mass spectrometry and nuclear magnetic resonance spectroscopy. Chem. Soc. Rev. 2011, 40, 387–426. [Google Scholar] [CrossRef] [PubMed]
- Psychogios, N.; Hau, D.D.; Peng, J.; Guo, A.C.; Mandal, R.; Bouatra, S.; Sinelnikov, I.; Krishnamurthy, R.; Eisner, R.; Gautam, B.; et al. The human serum metabolome. PLoS ONE 2011, 6, e16957. [Google Scholar] [CrossRef] [PubMed]
- Koen, N.; Du Preez, I.; Loots, D.T. Metabolomics and personalized medicine. Adv. Protein Chem. Struct. Biol. 2016, 102, 53–78. [Google Scholar] [CrossRef] [PubMed]
- Robertson, D.G.; Reily, M.D.; Sigler, R.E.; Wells, D.F.; Paterson, D.A.; Braden, T.K. Metabonomics: Evaluation of nuclear magnetic resonance (NMR) and pattern recognition technology for rapid in vivo screening of liver and kidney toxicants. Toxicol. Sci. 2000, 57, 326–337. [Google Scholar] [CrossRef] [PubMed]
- Lindon, J.C.; Nicholson, J.K.; Holmes, E.; Antti, H.; Bollard, M.E.; Keun, H.; Beckonert, O.; Ebbels, T.M.; Reily, M.D.; Robertson, D. Contemporary issues in toxicology—The role of metabonomics in toxicology and its evaluation by the COMET project. Toxicol. Appl. Pharmacol. 2003, 187, 137–146. [Google Scholar] [CrossRef]
- Lindon, J.C.; Keun, H.C.; Ebbels, T.M.; Pearce, J.M.; Holmes, E.; Nicholson, J.K. The Consortium for Metabonomic Toxicology (COMET): Aims, activities and achievements. Pharmacogenomics 2005, 6, 691–699. [Google Scholar] [CrossRef] [PubMed]
- Liu, D.Q.; Hop, C.E. Strategies for characterization of drug metabolites using liquid chromatography—Tandem mass spectrometry in conjunction with chemical derivatization and on-line H/D exchange approaches. J. Pharm. Biomed. Anal. 2005, 37, 1–18. [Google Scholar] [CrossRef] [PubMed]
- Chen, C.; Gonzalez, F.J.; Idle, J.R. LC–MS-based metabolomics in drug metabolism. Drug Metab. Rev. 2007, 39, 581–597. [Google Scholar] [CrossRef] [PubMed]
- Kristal, B.S.; Shurubor, Y.I.; Kaddurah-Daouk, R.; Matson, W.R. High-performance liquid chromatography separations coupled with coulometric electrode array detectors: A unique approach to metabolomics. Methods Mol. Biol. 2007, 358, 159–174. [Google Scholar] [PubMed]
- Beal, M.F.; Matson, W.R.; Swartz, K.J.; Gamache, P.H.; Bird, E.D. Kynurenine pathway measurements in Huntington’s disease striatum: Evidence for reduced formation of kynurenic acid. J. Neurochem. 1990, 55, 1327–1339. [Google Scholar] [CrossRef] [PubMed]
- Ogawa, T.; Matson, W.R.; Beal, M.F.; Myers, R.H.; Bird, E.D.; Milbury, P.; Saso, S. Kynurenine pathway abnormalities in Parkinson’s disease. Neurology 1992, 42, 1702–1706. [Google Scholar] [CrossRef] [PubMed]
- German, J.B.; Gillies, L.A.; Smilowitz, J.T.; Zivkovic, A.M.; Watkins, S.M. Lipidomics and lipid profiling in metabolomics. Curr. Opin. Lipidol. 2007, 18, 66–71. [Google Scholar] [PubMed]
- Musharraf, S.G.; Siddiqui, A.J.; Mazhar, S. Direct infusion ESI-MS analysis for metabolite profiling of human plasma using various fractionation techniques. Bioanalysis 2014, 6, 2057–2070. [Google Scholar] [CrossRef] [PubMed]
- Lokhov, P.G.; Maslov, D.L.; Trifonova, O.P.; Balashova, E.E.; Archakov, A.I. Mass spectrometry of blood low-molecular fraction as a method for unification of therapeutic drug monitoring. Biomed. Khim. 2014, 60, 201–216. [Google Scholar] [CrossRef] [PubMed]
- Drexler, D.M.; Reily, M.D.; Shipkova, P.A. Advances in mass spectrometry applied to pharmaceutical metabolomics. Anal. Bioanal. Chem. 2011, 399, 2645–2653. [Google Scholar] [CrossRef] [PubMed]
- Markley, J.L.; Brüschweiler, R.; Edison, A.S.; Eghbalnia, H.R.; Powers, R.; Raftery, D.; Wishart, D.S. The Future of NMR-Based Metabolomics. Curr. Opin. Biotechnol. 2017, 43, 34–40. [Google Scholar] [CrossRef] [PubMed]
- Lei, Z.; Huhman, D.V.; Sumner, L.W. Mass spectrometry strategies in metabolomics. J. Biol. Chem. 2011, 286, 25435–25442. [Google Scholar] [CrossRef] [PubMed]
- Lokhov, P.G.; Archakov, A.I. Mass spectrometry methods in metabolomics. Biomed. Khim. 2008, 54, 497–511. [Google Scholar] [CrossRef] [PubMed]
- Lokhov, P.G.; Dashtiev, M.I.; Moshkovskii, S.I.; Archakov, A.I. Metabolite profiling of blood plasma of patients with prostate cancer. Metabolomics 2010, 6, 156–163. [Google Scholar] [CrossRef]
- Lokhov, P.G.; Trifonova, O.P.; Maslov, D.L.; Archakov, A.I. Blood plasma metabolites and the risk of developing lung cancer in Russia. Eur. J. Cancer Prev. 2013, 22, 335–341. [Google Scholar] [CrossRef] [PubMed]
- González-Domínguez, R.; García-Barrera, T.; Gómez-Ariza, J.L. Using direct infusion mass spectrometry for serum metabolomics in Alzheimer’s disease. Anal. Bioanal. Chem. 2014, 406, 7137–7148. [Google Scholar] [CrossRef] [PubMed]
- Kirwan, J.A.; Weber, R.J.; Broadhurst, D.I.; Viant, M.R. Direct infusion mass spectrometry metabolomics dataset: A benchmark for data processing and quality control. Sci. Data 2014, 1, 140012. [Google Scholar] [CrossRef] [PubMed]
- González-Domínguez, R.; Sayago, A.; Fernández-Recamales, Á. Direct infusion mass spectrometry for metabolomic phenotyping of diseases. Bioanalysis 2017, 9, 131–148. [Google Scholar] [CrossRef] [PubMed]
- Lokhov, P.G.; Kharibin, O.N.; Archakov, A.I. Diagnosis of lung cancer based on direct-infusion electrospray mass spectrometry of blood plasma metabolites. Int. J. Mass Spectrom. 2012, 309, 200–205. [Google Scholar] [CrossRef]
- Lokhov, P.G.; Trifonova, O.P.; Maslov, D.L.; Balashova, E.E.; Archakov, A.I.; Shestakova, E.A.; Shestakova, M.V.; Dedov, I.I. Diagnosing impaired glucose tolerance using direct infusion mass spectrometry of blood plasma. PLoS ONE 2014, 9, e105343. [Google Scholar] [CrossRef] [PubMed]
- Lin, L.; Yu, Q.; Yan, X.; Hang, W.; Zheng, J.; Xing, J.; Huang, B. Direct infusion mass spectrometry or liquid chromatography mass spectrometry for human metabonomics? A serum metabonomic study of kidney cancer. Analyst 2010, 135, 2970–2978. [Google Scholar] [CrossRef] [PubMed]
- Koulman, A.; Tapper, B.A.; Fraser, K.; Cao, M.; Lane, G.A.; Rasmussen, S. High-throughput direct-infusion ion trap mass spectrometry: A new method for metabolomics. Rapid Commun. Mass Spectrom. 2007, 21, 421–428. [Google Scholar] [CrossRef] [PubMed]
- Balashova, E.E.; Lokhov, P.G.; Maslov, D.L.; Trifonova, O.P.; Khasanova, D.M.; Zalyalova, Z.A.; Nigmatullina, R.R.; Archakov, A.I.; Ugrumov, M.V. Plasma metabolome signature in patients with early-stage Parkinson disease. Curr. Metab. 2018, 6, 75–82. [Google Scholar] [CrossRef]
- Lokhov, P.G.; Balashova, E.E.; Voskresenskaya, A.A.; Trifonova, O.P.; Maslov, D.L.; Archakov, A. Mass spectrometric signatures of the blood plasma metabolome for disease diagnostics. Biomed. Rep. 2016, 4, 122–126. [Google Scholar] [CrossRef] [PubMed]
- Clayton, T.A.; Baker, D.; Lindon, J.C.; Everett, J.R.; Nicholson, J.K. Pharmacometabonomic identification of a significant host-microbiome metabolic interaction affecting human drug metabolism. Proc. Natl. Acad. Sci. USA 2009, 106, 14728–14733. [Google Scholar] [CrossRef] [PubMed]
- Kaddurah-Daouk, R.; Baillie, R.A.; Zhu, H.; Zeng, Z.-B.; Wiest, M.M.; Nguyen, U.T.; Watkins, S.M.; Krauss, R.M. Lipidomic analysis of variation in response to simvastatin in the cholesterol and pharmacogenetics study. Metabolomics 2010, 6, 191–201. [Google Scholar] [CrossRef] [PubMed]
- Kaddurah-Daouk, R.; Baillie, R.A.; Zhu, H.; Zeng, Z.B.; Wiest, M.M.; Nguyen, U.T.; Wojnoonski, K.; Watkins, S.M.; Trupp, M.; Krauss, R.M. Enteric microbiome metabolites correlate with response to simvastatin treatment. PLoS ONE 2011, 6, e25482. [Google Scholar] [CrossRef] [PubMed]
- Trupp, M.; Zhu, H.; Wikoff, W.R.; Baillie, R.A.; Zeng, Z.-B.; Karp, P.D.; Fiehn, O.; Krauss, R.M.; Kaddurah-Daouk, R. Metabolomics reveals amino acids contribute to variation in response to simvastatin treatment. PLoS ONE 2012, 7, e38386. [Google Scholar] [CrossRef] [PubMed]
- Phapale, P.B.; Kim, S.D.; Lee, H.W.; Lim, M.; Kale, D.D.; Kim, Y.L.; Cho, J.H.; Hwang, D.; Yoon, Y.R. An integrative approach for identifying a metabolic phenotype predictive of individualized pharmacokinetics of tacrolimus. Clin. Pharmacol. Ther. 2010, 87, 426–436. [Google Scholar] [CrossRef] [PubMed]
- Rahmioglu, N.; Le Gall, G.; Heaton, J.; Kay, K.L.; Smith, N.W.; Colquhoun, I.J.; Ahmadi, K.R.; Kemsley, E.K. Prediction of variability in CYP3A4 induction using a combined 1H NMR metabonomics and targeted UPLC-MS approach. J. Proteome Res. 2011, 10, 2807–2816. [Google Scholar] [CrossRef] [PubMed]
- Shin, K.H.; Choi, M.H.; Lim, K.S.; Yu, K.S.; Jang, I.J.; Cho, J.Y. Evaluation of endogenous metabolic markers of hepatic CYP3A activity using metabolic profiling and midazolam clearance. Clin. Pharmacol. Ther. 2013, 94, 601–609. [Google Scholar] [CrossRef] [PubMed]
- Diczfalusy, U.; Kanebratt, K.P.; Bredberg, E.; Andersson, T.B.; Bottiger, Y.; Bertilsson, L. 4β-Hydroxycholesterol as an endogenous marker for CYP3A4/5 activity. Stability and half-life of elimination after induction with rifampicin. Br. J. Clin. Pharmacol. 2009, 67, 38–43. [Google Scholar] [CrossRef] [PubMed]
- Everett, J.R. Pharmacometabonomics in humans: A new tool for personalized medicine. Pharmacogenomics 2015, 16, 737–754. [Google Scholar] [CrossRef] [PubMed]
- Wami, W.M.; Buntinx, F.; Bartholomeeusen, S.; Goderis, G.; Mathieu, C.; Aerts, M. Influence of chronic comorbidity and medication on the efficacy of treatment in patients with diabetes in general practice. Br. J. Gen. Pract. 2013, 63, 267–273. [Google Scholar] [CrossRef] [PubMed]
- Kaminsky, L.S.; Zhang, Z.Y. Human P450 metabolism of warfarin. Pharmacol. Ther. 1997, 73, 67–74. [Google Scholar] [CrossRef]
- Cavallari, L.H.; Perera, M.A. The future of warfarin pharmacogenetics in under-represented minority groups. Future Cardiol. 2012, 8, 563–576. [Google Scholar] [CrossRef] [PubMed]
- Lindh, J.D.; Holm, L.; Andersson, M.L.; Rane, A. Influence of CYP2C9 genotype on warfarin dose requirements—A systematic review and meta-analysis. Eur. J. Clin. Pharmacol. 2009, 65, 365–375. [Google Scholar] [CrossRef] [PubMed]
- De Grooth, G.J.; Zerba, K.E.; Huang, S.P.; Tsuchihashi, Z.; Kirchgessner, T.; Belder, R.; Vishnupad, P.; Hu, B.; Klerkx, A.H.; Zwinderman, A.H.; et al. The cholesteryl ester transfer protein (CETP) TaqIB polymorphism in the cholesterol and recurrent events study: No interaction with the response to pravastatin therapy and no effects on cardiovascular outcome: A prospective analysis of the CETP TaqIB polymorphism on cardiovascular outcome and interaction with cholesterol-lowering therapy. J. Am. Coll. Cardiol. 2004, 43, 854–857. [Google Scholar] [PubMed]
- Bhathena, A.; Wang, Y.; Kraft, J.B.; Idler, K.B.; Abel, S.J.; Holley-Shanks, R.R.; Robieson, W.Z.; Spear, B.; Redden, L.; Katz, D.A. Association of dopamine-related genetic loci to dopamine D3 receptor antagonist ABT-925 clinical response. Transl. Psychiatry 2013, 3, e245. [Google Scholar] [CrossRef] [PubMed]
- Turner, S.T.; Chapman, A.B.; Schwartz, G.L.; Boerwinkle, E. Effects of endothelial nitric oxide synthase, α-adducin, and other candidate gene polymorphisms on blood pressure response to hydrochlorothiazide. Am. J. Hypertens. 2003, 16, 834–839. [Google Scholar] [CrossRef]
- Kumar, S.S.; Kumar, A.S.; Padmapriya, R.; Chandrasekaran, A. Effect of eNOS polymorphisms on salbutamol evoked endothelium dependent vasodilation in South Indian healthy subjects. Indian J. Pharmacol. 2013, 45, 9–12. [Google Scholar] [CrossRef] [PubMed]
- De Magalhães, J.P.; Wuttke, D.; Wood, S.H.; Plank, M.; Vora, C. Genome-environment interactions that modulate aging: Powerful targets for drug discovery. Pharmacol. Rev. 2012, 64, 88–101. [Google Scholar] [CrossRef] [PubMed]
- Bailey, D.G.; Malcolm, J.; Arnold, O.; Spence, J.D. Grapefruit juice-drug interactions. Br. J. Clin. Pharmacol. 1998, 46, 101–110. [Google Scholar] [CrossRef] [PubMed]
- Zevin, S.; Benowitz, N.L. Drug interactions with tobacco smoking. Clin. Pharmacokinet. 1999, 36, 425–438. [Google Scholar] [CrossRef] [PubMed]
- Ma, Q.; Lu, A.Y. Pharmacogenetics, pharmacogenomics, and individualized medicine. Pharmacol. Rev. 2011, 63, 437–459. [Google Scholar] [CrossRef] [PubMed]
- Becquemont, L.; Alfirevic, A.; Amstutz, U.; Brauch, H.; Jacqz-Aigrain, E.; Laurent-Puig, P.; Molina, M.A.; Niemi, M.; Schwab, M.; Somogyi, A.A.; et al. Practical recommendations for pharmacogenomics-based prescription: 2010 ESF-UB Conference on Pharmacogenetics and Pharmacogenomics. Pharmacogenomics 2011, 12, 113–124. [Google Scholar] [CrossRef] [PubMed]
- Wishart, D.S. Emerging applications of metabolomics in drug discovery and precision medicine. Nat. Rev. Drug Discov. 2016, 15, 473–484. [Google Scholar] [CrossRef] [PubMed]
- Jain, K.K. Role of proteomics in the development of personalized medicine. Adv. Protein Chem. Struct. Biol. 2016, 102, 41–52. [Google Scholar] [CrossRef] [PubMed]
- Chapal, N.; Molina, L.; Molina, F.; Laplanche, M.; Pau, B.; Petit, P. Pharmacoproteomic approach to the study of drug mode of action, toxicity, and resistance: Applications in diabetes and cancer. Fundam. Clin. Pharmacol. 2004, 18, 413–422. [Google Scholar] [CrossRef] [PubMed]
- Krönke, J.; Udeshi, N.D.; Narla, A.; Grauman, P.; Hurst, S.N.; McConkey, M.; Svinkina, T.; Heckl, D.; Comer, E.; Li, X.; et al. Lenalidomide causes selective degradation of IKZF1 and IKZF3 in multiple myeloma cells. Science 2014, 343, 301–305. [Google Scholar] [CrossRef] [PubMed]
- Everett, J.R.; Loo, R.L.; Pullen, F.S. Pharmacometabonomics and personalized medicine. Ann. Clin. Biochem. 2013, 50, 523–545. [Google Scholar] [CrossRef] [PubMed]
- Bernini, P.; Bertini, I.; Luchinat, C.; Nepi, S.; Saccenti, E.; Schäfer, H.; Schütz, B.; Spraul, M.; Tenori, L. Individual human phenotypes in metabolic space and time. J. Proteome Res. 2009, 8, 4264–4271. [Google Scholar] [CrossRef] [PubMed]
- Seeger, K. Metabolic changes in autoimmune diseases. Curr. Drug Discov. Technol. 2009, 6, 256–261. [Google Scholar] [CrossRef] [PubMed]
- Goonewardena, S.N.; Prevette, L.E.; Desai, A.A. Metabolomics and atherosclerosis. Curr. Atheroscler. Rep. 2010, 12, 267–272. [Google Scholar] [CrossRef] [PubMed]
- Bezabeh, T.; Somorjai, R.L.; Smith, I.C. MR metabolomics of fecal extracts: Applications in the study of bowel diseases. Magn. Reson. Chem. 2009, 47, 54–61. [Google Scholar] [CrossRef] [PubMed]
- Islam, S.I. Pharmacogenomics and therapeutic drug monitoring: The challenge in drug safety. Int. J. Integr. Biol. 2008, 4, 62–66. [Google Scholar]
- Gross, A.S. Best practice in therapeutic drug monitoring. Br. J. Clin. Pharmacol. 2001, 52, 5–10. [Google Scholar] [CrossRef]
- Grundmann, M.; Kacirova, I.; Urinovska, R. Therapeutic drug monitoring of atypical antipsychotic drugs. Acta Pharm. 2014, 64, 387–401. [Google Scholar] [CrossRef] [PubMed]
- Scordo, M.G.; Pengo, V.; Spina, E.; Dahl, M.L.; Gusella, M.; Padrini, R. Influence of CYP2C9 and CYP2C19 genetic polymorphisms on warfarin maintenance dose and metabolic clearance. Clin. Pharmacol. Ther. 2002, 72, 702–710. [Google Scholar] [CrossRef] [PubMed]
- El Desoky, E.; Klotz, U. Value, limitations and clinical impact of therapeutic drug monitoring in adults. Drug Investig. 1993, 6, 127–136. [Google Scholar] [CrossRef]
- Holmes, E.; Wilson, I.D.; Nicholson, J.K. Metabolic phenotyping in health and disease. Cell 2008, 134, 714–717. [Google Scholar] [CrossRef] [PubMed]


| Techniques | Advantages | Disadvantages | References | |
|---|---|---|---|---|
| Nuclear magnetic resonance spectroscopy (NMR) |
| Low sensitivity, only several tens of metabolites with a relatively high concentration can be detected | Robertson et al. [27] Lindon et al. 2003 [28] Lindon et al. 2005 [29] | |
| Mass spectrometry (MS) | Gas chromatography–MS (GC–MS) |
|
| German et al. [35] |
| Liquid chromatography–MS (LC–MS) |
|
| Liu et al. [30] Chen et al. [31] Kristal et al. [32] Beal et al. [33] Ogawa et al. [34] | |
| Direct-infusion mass spectrometry (DIMS) |
|
| Musharraf et al. [36] Lokhov et al. [37] Drexler et al. [38] | |
© 2018 by the authors. Licensee MDPI, Basel, Switzerland. This article is an open access article distributed under the terms and conditions of the Creative Commons Attribution (CC BY) license (http://creativecommons.org/licenses/by/4.0/).
Share and Cite
Balashova, E.E.; Maslov, D.L.; Lokhov, P.G. A Metabolomics Approach to Pharmacotherapy Personalization. J. Pers. Med. 2018, 8, 28. https://doi.org/10.3390/jpm8030028
Balashova EE, Maslov DL, Lokhov PG. A Metabolomics Approach to Pharmacotherapy Personalization. Journal of Personalized Medicine. 2018; 8(3):28. https://doi.org/10.3390/jpm8030028
Chicago/Turabian StyleBalashova, Elena E., Dmitry L. Maslov, and Petr G. Lokhov. 2018. "A Metabolomics Approach to Pharmacotherapy Personalization" Journal of Personalized Medicine 8, no. 3: 28. https://doi.org/10.3390/jpm8030028
APA StyleBalashova, E. E., Maslov, D. L., & Lokhov, P. G. (2018). A Metabolomics Approach to Pharmacotherapy Personalization. Journal of Personalized Medicine, 8(3), 28. https://doi.org/10.3390/jpm8030028