
Bioinformatics Workflow for Clinical Whole Genome Sequencing at Partners HealthCare Personalized Medicine

 ,
,
Abstract
:1. Introduction
2. Results
2.1. Bioinformatics Validation
2.2. Known Regions of Poor Coverage
2.3. Cost Analysis and Scalability
3. Discussion
4. Methods and Materials
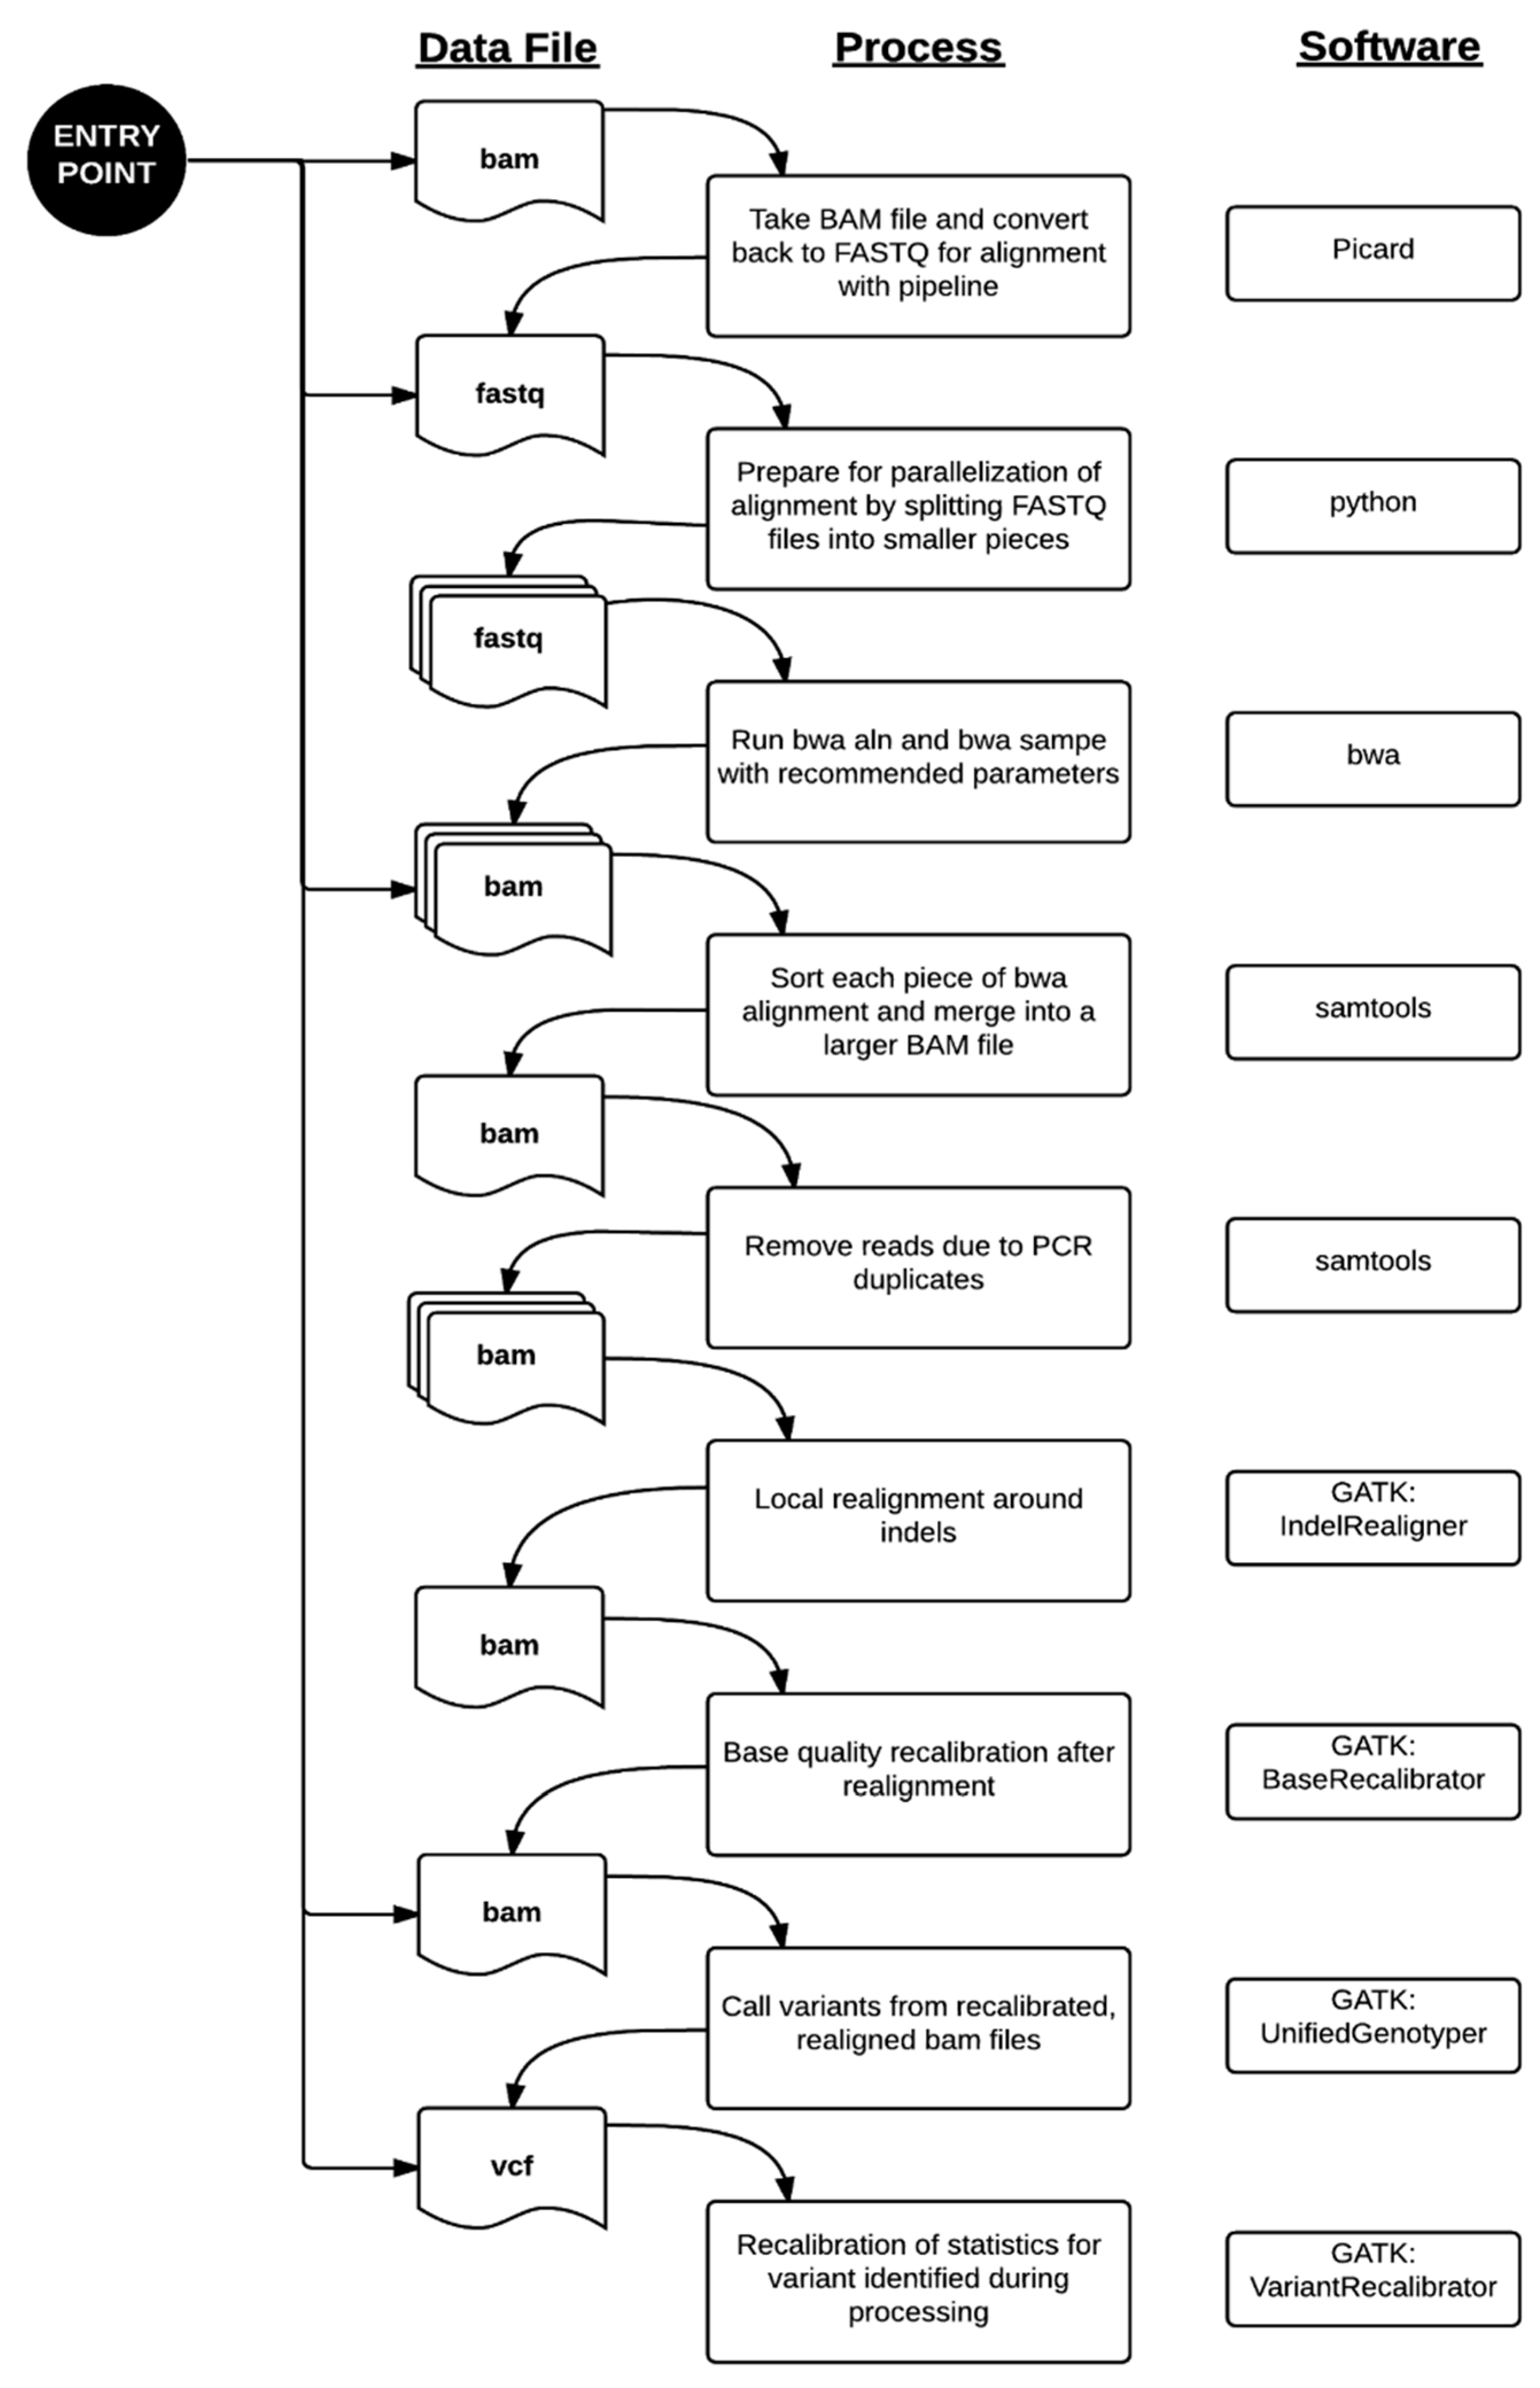
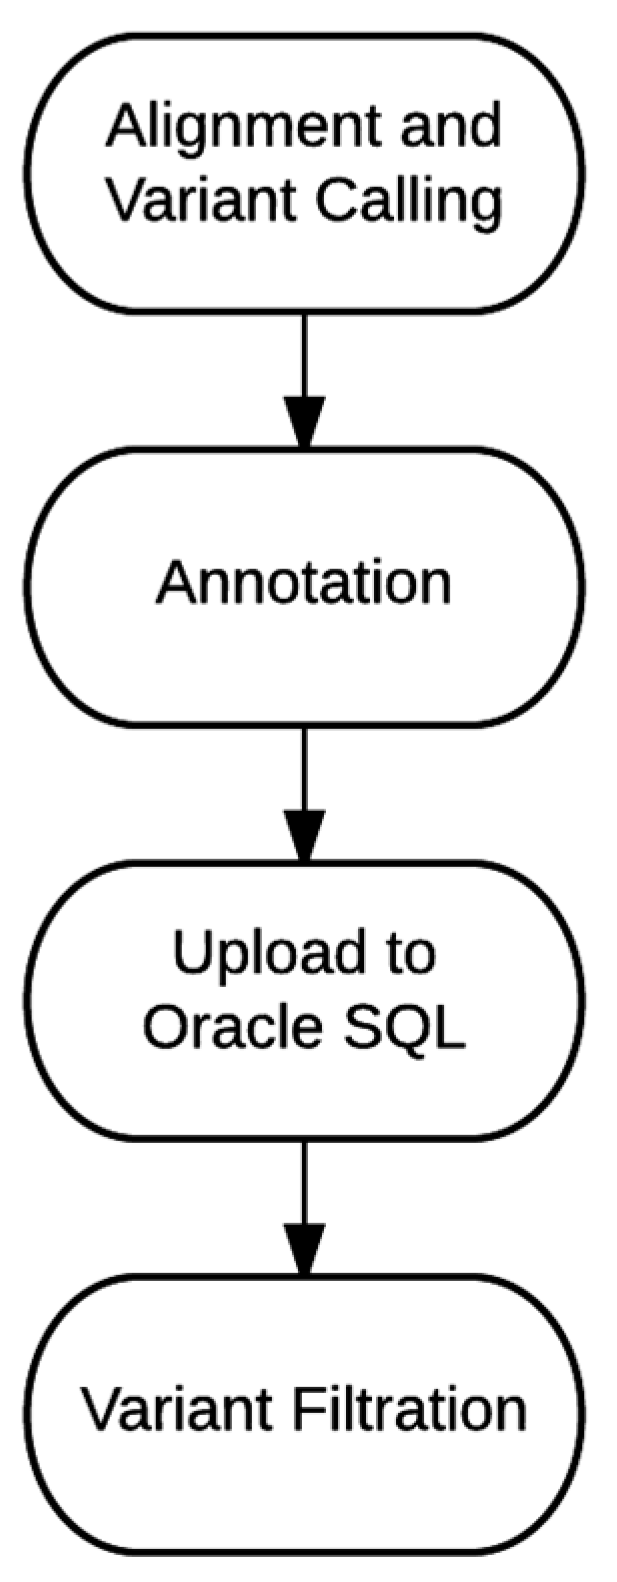
4.1. Bioinformatics Pipeline
4.2. Bioinformatics Validation
4.3. Characterization of Poorly-Covered Regions
4.4. Cost Analysis and Scalability
5. Conclusions
Supplementary Materials
Acknowledgments
Author Contributions
Conflicts of Interest
References
- Collins, F.S.; Varmus, H. A new initiative on precision medicine. N. Engl. J. Med. 2015, 372, 793–795. [Google Scholar] [CrossRef] [PubMed]
- Alfares, A.A.; Kelly, M.A.; McDermott, G.; Funke, B.H.; Lebo, M.S.; Baxter, S.B.; Shen, J.; McLaughlin, H.M.; Clark, E.H.; Babb, L.J.; et al. Results of clinical genetic testing of 2,912 probands with hypertrophic cardiomyopathy: Expanded panels offer limited additional sensitivity. Genet. Med. Off. J. Am. Coll. Med. Genet. 2015, 17, 880–888. [Google Scholar] [CrossRef] [PubMed]
- Harismendy, O.; Ng, P.C.; Strausberg, R.L.; Wang, X.; Stockwell, T.B.; Beeson, K.Y.; Schork, N.J.; Murray, S.S.; Topol, E.J.; Levy, S.; et al. Evaluation of next generation sequencing platforms for population targeted sequencing studies. Genome Biol. 2009, 10. [Google Scholar] [CrossRef] [PubMed]
- Biesecker, L.G.; Mullikin, J.C.; Facio, F.M.; Turner, C.; Cherukuri, P.F.; Blakesley, R.W.; Bouffard, G.G.; Chines, P.S.; Cruz, P.; Hansen, N.F.; et al. The clinseq project: Piloting large-scale genome sequencing for research in genomic medicine. Genome Res. 2009, 19, 1665–1674. [Google Scholar] [CrossRef] [PubMed]
- Dewey, F.E.; Grove, M.E.; Pan, C.; Goldstein, B.A.; Bernstein, J.A.; Chaib, H.; Merker, J.D.; Goldfeder, R.L.; Enns, G.M.; David, S.P.; et al. Clinical interpretation and implications of whole-genome sequencing. JAMA 2014, 311, 1035–1045. [Google Scholar] [CrossRef] [PubMed]
- Jiang, Y.H.; Yuen, R.K.; Jin, X.; Wang, M.; Chen, N.; Wu, X.; Ju, J.; Mei, J.; Shi, Y.; He, M.; et al. Detection of clinically relevant genetic variants in autism spectrum disorder by whole-genome sequencing. Am. J. Hum. Genet. 2013, 93, 249–263. [Google Scholar] [CrossRef] [PubMed]
- Lupski, J.R.; Reid, J.G.; Gonzaga-Jauregui, C.; Rio Deiros, D.; Chen, D.C.; Nazareth, L.; Bainbridge, M.; Dinh, H.; Jing, C.; Wheeler, D.A.; et al. Whole-genome sequencing in a patient with charcot-marie-tooth neuropathy. N. Engl. J. Med. 2010, 362, 1181–1191. [Google Scholar] [CrossRef] [PubMed]
- MacArthur, D.G.; Balasubramanian, S.; Frankish, A.; Huang, N.; Morris, J.; Walter, K.; Jostins, L.; Habegger, L.; Pickrell, J.K.; Montgomery, S.B.; et al. A systematic survey of loss-of-function variants in human protein-coding genes. Science 2012, 335, 823–828. [Google Scholar] [CrossRef] [PubMed]
- Zook, J.M.; Chapman, B.; Wang, J.; Mittelman, D.; Hofmann, O.; Hide, W.; Salit, M. Integrating human sequence data sets provides a resource of benchmark snp and indel genotype calls. Nat. Biotechnol. 2014, 32, 246–251. [Google Scholar] [CrossRef] [PubMed]
- Li, H. Picard. Available online: http://picard.sourceforge.net (acessed on 22 October 2015).
- Li, H.; Durbin, R. Fast and accurate short read alignment with burrows-wheeler transform. Bioinformatics 2009, 25, 1754–1760. [Google Scholar] [CrossRef] [PubMed]
- Li, H.; Handsaker, B.; Wysoker, A.; Fennell, T.; Ruan, J.; Homer, N.; Marth, G.; Abecasis, G.; Durbin, R. The sequence alignment/map format and samtools. Bioinformatics 2009, 25, 2078–2079. [Google Scholar] [CrossRef] [PubMed]
- Van der Auwera, G.A.; Carneiro, M.O.; Hartl, C.; Poplin, R.; Del Angel, G.; Levy-Moonshine, A.; Jordan, T.; Shakir, K.; Roazen, D.; Thibault, J.; et al. From fastq data to high confidence variant calls: The genome analysis toolkit best practices pipeline. Curr. Protoc. Bioinform. 2013, 11. [Google Scholar] [CrossRef]
- McLaughlin, H.M.; Ceyhan-Birsoy, O.; Christensen, K.D.; Kohane, I.S.; Krier, J.; Lane, W.J.; Lautenbach, D.; Lebo, M.S.; Machini, K.; MacRae, C.A.; et al. A systematic approach to the reporting of medically relevant findings from whole genome sequencing. BMC Med. Genet. 2014, 15, 134. [Google Scholar] [CrossRef] [PubMed]
- Chopra, S.S.; Leshchiner, I.; Duzkale, H.; McLaughlin, H.; Giovanni, M.; Zhang, C.; Stitziel, N.; Fingeroth, J.; Joyce, R.M.; Lebo, M.; et al. Inherited chst11/mir3922 deletion is associated with a novel recessive syndrome presenting with skeletal malformation and malignant lymphoproliferative disease. Mol. Genet. Genom. Med. 2015, 3, 413–423. [Google Scholar] [CrossRef] [PubMed]
- Choudhary, A.; Mambo, E.; Sanford, T.; Boedigheimer, M.; Twomey, B.; Califano, J.; Hadd, A.; Oliner, K.S.; Beaudenon, S.; Latham, G.J.; et al. Evaluation of an integrated clinical workflow for targeted next-generation sequencing of low-quality tumor DNA using a 51-gene enrichment panel. BMC Med. Genom. 2014, 7, 62. [Google Scholar] [CrossRef] [PubMed]
- Miller, N.A.; Farrow, E.G.; Gibson, M.; Willig, L.K.; Twist, G.; Yoo, B.; Marrs, T.; Corder, S.; Krivohlavek, L.; Walter, A.; et al. A 26-hour system of highly sensitive whole genome sequencing for emergency management of genetic diseases. Genome Med. 2015, 7, 100. [Google Scholar] [CrossRef] [PubMed]
- Reid, J.G.; Carroll, A.; Veeraraghavan, N.; Dahdouli, M.; Sundquist, A.; English, A.; Bainbridge, M.; White, S.; Salerno, W.; Buhay, C.; et al. Launching genomics into the cloud: Deployment of mercury, a next generation sequence analysis pipeline. BMC Bioinform. 2014, 15, 30. [Google Scholar] [CrossRef] [PubMed]
- 1000 Genomes Project Consortium. An integrated map of genetic variation from 1092 human genomes. Nature 2012, 491, 56–65. [Google Scholar]
- Aronson, S.J.; Clark, E.H.; Babb, L.J.; Baxter, S.; Farwell, L.M.; Funke, B.H.; Hernandez, A.L.; Joshi, V.A.; Lyon, E.; Parthum, A.R.; et al. The geneinsight suite: A platform to support laboratory and provider use of DNA-based genetic testing. Hum. Mutat. 2011, 32, 532–536. [Google Scholar] [CrossRef] [PubMed]
- McLaren, W.; Pritchard, B.; Rios, D.; Chen, Y.; Flicek, P.; Cunningham, F. Deriving the consequences of genomic variants with the ensembl api and snp effect predictor. Bioinformatics 2010, 26, 2069–2070. [Google Scholar] [CrossRef] [PubMed]
- NHLBI GO Exome Sequencing Project. Exome Variant Server. Available online: http://evs.gs.washington.edu (acessed on 22 October 2015).
- Welter, D.; MacArthur, J.; Morales, J.; Burdett, T.; Hall, P.; Junkins, H.; Klemm, A.; Flicek, P.; Manolio, T.; Hindorff, L.; et al. The NHGRI GWAS Catalog, a curated resource of snp-trait associations. Nucleic Acids Res. 2014, 42, D1001–D1006. [Google Scholar] [CrossRef] [PubMed]
- Pugh, T.J.; Kelly, M.A.; Gowrisankar, S.; Hynes, E.; Seidman, M.A.; Baxter, S.M.; Bowser, M.; Harrison, B.; Aaron, D.; Mahanta, L.M.; et al. The landscape of genetic variation in dilated cardiomyopathy as surveyed by clinical DNA sequencing. Genet. Med. Off. J. Am. Coll. Med. Genet. 2014, 16, 601–608. [Google Scholar] [CrossRef] [PubMed]
- Zimmerman, R.S.; Cox, S.; Lakdawala, N.K.; Cirino, A.; Mancini-DiNardo, D.; Clark, E.; Leon, A.; Duffy, E.; White, E.; Baxter, S.; et al. A novel custom resequencing array for dilated cardiomyopathy. Genet. Med. Off. J. Am. Coll. Med. Genet. 2010, 12, 268–278. [Google Scholar] [CrossRef] [PubMed]
- Landrum, M.J.; Lee, J.M.; Riley, G.R.; Jang, W.; Rubinstein, W.S.; Church, D.M.; Maglott, D.R. Clinvar: Public archive of relationships among sequence variation and human phenotype. Nucleic Acids Res. 2014, 42, D980–D985. [Google Scholar] [CrossRef] [PubMed]


| Variant Type | FP (before Thresholds) | FP (after Thresholds) |
|---|---|---|
| SNVs | 20 | 1 |
| Indels | 1 | 0 |
| Variant Type | # | FN | Sensitivity | 95% Cl |
|---|---|---|---|---|
| SNVs | 410 | 0 | 100% | 99.1%–100% |
| Indels | 15 | 0 | 100% | 79.6%–100% |
| Variant Type | 1K Genomes Variants | Present in NGS Calls | % Present in NGS Calls | Present in NGS Calls with Matched Genotypes | % Present in NGS Calls with Matched Genotypes |
|---|---|---|---|---|---|
| SNVs | 2,762,933 | 2,735,592 | 99.01% | 2,730,826 | 98.84% |
| Indels | 3,27,474 | 299,300 | 91.39% | 285,401 | 87.15% |
| Total | 3,090,407 | 3,034,892 | 98.20% | 3,016,227 | 97.60% |
| Gene | # Clinically Significant Variants | % Callable | Disease | Disease Prevalence |
|---|---|---|---|---|
| STRC | 8 | 20 | Sensorineural hearing loss | Common |
| ADAMTSL2 | 5 | 32 | Geleophysic dysplasia | Rare |
| CYP21A2 | 13 | 44 | Congenital adrenal hyperplasia | Common |
| ARX | 19 | 45 | X-linked infantile spasm syndrome | Rare |
| MECP2 | 250 | 53 | Rett syndrome | Common |
| GJB1 | 16 | 53 | Charcot-Marie-Tooth disease | Common |
| ABCD1 | 33 | 57 | X-linked adrenoleukodystrophy | Moderate |
| EMD | 11 | 57 | Emery-Dreifuss muscular dystrophy | Moderate |
| G6PD | 16 | 58 | Glucose-6-phosphate dehydrogenase deficiency | Common |
| GATA1 | 12 | 60 | Dyserythropoietic anemia and thrombocytopenia | Rare |
| AVPR2 | 15 | 62 | Nephrogenic diabetes insipidus | Rare |
| EDA | 37 | 63 | Hypohidrotic ectodermal dysplasia | Moderate |
| SLC16A2 | 11 | 63 | Allan-Herndon-Dudley syndrome | Rare |
| FLNA | 42 | 64 | Otopalatodigital syndrome | Rare |
| EBP | 24 | 64 | X-linked chondrodysplasia punctata | Rare |
| RPGR | 17 | 64 | Retinitis pigmentosa | Common |
| TAZ | 17 | 64 | Barth syndrome | Rare |
| IDS | 16 | 64 | Hunter syndrome | Moderate |
| FGD1 | 8 | 64 | Aarskog-Scott syndrome | Rare |
| GPR143 | 6 | 65 | Ocular albinism | Moderate |
| Storage Type | Genome/Month ($) | Genome/Year ($) | Genome/5 Years ($) |
|---|---|---|---|
| Primary | 4.42 | 53.04 | 265.20 |
| Secondary | 3.48 | 41.76 | 208.80 |
| Total | 7.90 | 94.80 | 474.00 |
| Filter Name | Parameter | Description |
|---|---|---|
| Frequency | X (e.g., 0.01 or 0.05) | Keep variants that have frequencies in ESP or 1000 Genomes ≤ X |
| Loss-of-Function | Keep variants that may implicate loss of gene function, including those annotated with the following Sequence Ontology keywords: frameshift_variant, stop_gained, stop_lost, splice_acceptor_variant, initiator_codon_variant, splice_donor_variant. | |
| Gene List | Gene list (in HGNC nomenclature) | Gene filtration is based on selecting variants that are within particular genes. We check if a variant is annotated with a gene symbol of interest within a clinical region of interest |
| Reported Pathogenic | Select variants that are classified as Pathogenic or Likely pathogenic in variant databases, including ClinVar | |
| GeneInsight | Select variants that are classified as Pathogenic or Likely pathogenic in our internal GeneInsight database | |
| Compound Heterozygous | Select LOF and missense variants if there are at least two alterations in the gene that may impact function of both alleles |
© 2016 by the authors; licensee MDPI, Basel, Switzerland. This article is an open access article distributed under the terms and conditions of the Creative Commons by Attribution (CC-BY) license (http://creativecommons.org/licenses/by/4.0/).
Share and Cite
Tsai, E.A.; Shakbatyan, R.; Evans, J.; Rossetti, P.; Graham, C.; Sharma, H.; Lin, C.-F.; Lebo, M.S. Bioinformatics Workflow for Clinical Whole Genome Sequencing at Partners HealthCare Personalized Medicine. J. Pers. Med. 2016, 6, 12. https://doi.org/10.3390/jpm6010012
Tsai EA, Shakbatyan R, Evans J, Rossetti P, Graham C, Sharma H, Lin C-F, Lebo MS. Bioinformatics Workflow for Clinical Whole Genome Sequencing at Partners HealthCare Personalized Medicine. Journal of Personalized Medicine. 2016; 6(1):12. https://doi.org/10.3390/jpm6010012
Chicago/Turabian StyleTsai, Ellen A., Rimma Shakbatyan, Jason Evans, Peter Rossetti, Chet Graham, Himanshu Sharma, Chiao-Feng Lin, and Matthew S. Lebo. 2016. "Bioinformatics Workflow for Clinical Whole Genome Sequencing at Partners HealthCare Personalized Medicine" Journal of Personalized Medicine 6, no. 1: 12. https://doi.org/10.3390/jpm6010012
APA StyleTsai, E. A., Shakbatyan, R., Evans, J., Rossetti, P., Graham, C., Sharma, H., Lin, C.-F., & Lebo, M. S. (2016). Bioinformatics Workflow for Clinical Whole Genome Sequencing at Partners HealthCare Personalized Medicine. Journal of Personalized Medicine, 6(1), 12. https://doi.org/10.3390/jpm6010012