A Systematic Review and Meta-Analysis of Mobile Devices and Weight Loss with an Intervention Content Analysis

Abstract
:| Table of Content | 312 |
| 1. Introduction | 315 |
| 1.1. Background and Epidemiology | 315 |
| 1.2. Morbidity and Mortality | 316 |
| 1.3. Economic Costs | 316 |
| 1.4. Global Strategies | 316 |
| 1.5. Diet and Physical Activity Targets | 316 |
| 1.6. Health Psychology | 317 |
| Health Psychology Theories | 317 |
| 1.7. Behaviour Change Techniques | 317 |
| 1.8. Mobile Technology Definition | 318 |
| 1.9. Mobile Technology Usage and Public Health Applications | 318 |
| 1.10. Research on Mobile Devices and Weight Loss | 318 |
| 1.11. Aims and Research Questions | 319 |
| 2. Methods | 320 |
| 2.1. Overview | 320 |
| 2.2. Databases Searched | 320 |
| 2.3. Search Limiters | 320 |
| 2.4. Search Terminology | 320 |
| 2.5. Inclusion and Exclusion Criteria | 321 |
| 2.6. Data Extraction | 322 |
| 2.7. Study Quality Assessment | 322 |
| 2.8. Data Coding | 322 |
| 2.9. Data Synthesis | 322 |
| 2.10. Data Analysis | 323 |
| 3. Results Part A: Systematic Review with Meta-Analysis | 323 |
| 3.1. General Search Results | 323 |
| 3.2. General Descriptive | 323 |
| 3.3. Mobile Device Intervention Media | 324 |
| 3.4. Target Behaviour and Weight Loss | 324 |
| 3.5. Dietary Measures | 343 |
| 3.6. Dietary Changes Overview | 343 |
| 3.6.1. Dietary Changes in Fruit and Vegetable Intake | 343 |
| 3.6.2. Dietary Changes in Sugar and Fat Intake | 344 |
| 3.6.3. Dietary Changes in Daily Caloric Intake | 344 |
| 3.6.4. Changes in EBI and ED Scores | 344 |
| 3.7. Physical Activity Measures | 345 |
| 3.8. Physical Activity Overview | 345 |
| 3.8.1. Perceived Physical Activity Goal Adherence | 345 |
| 3.8.2. Changes in Physical Activity Levels | 345 |
| 3.9. Weight Measures | 346 |
| 3.10. Weight Loss Overview | 346 |
| 3.10.1. Changes in Weight Mobile Phones | 346 |
| 3.10.2. Changes in Weight Other Mobile Devices | 347 |
| 3.10.3. Weight Loss and Adherence | 347 |
| 3.11. Changes in BMI | 347 |
| 3.12. Changes in Waist Circumference | 347 |
| 3.13. Changes in Body Fat Percentage | 348 |
| 3.14. Study Quality | 348 |
| 3.15. Risk of Bias Grading | 349 |
| 3.16. Meta-Analysis Weight Loss (kg) | 353 |
| 3.16.1. Overview | 353 |
| 3.16.2. Results | 353 |
| 3.16.3. Heterogeneity | 353 |
| 3.16.4. Publication Bias | 354 |
| 3.16.5. Sensitivity Analysis | 354 |
| 4. Results Part B: Intervention Content Analysis; Use of Theory and Behavior Change Techniques | 355 |
| 4.1. Theoretical Base | 355 |
| 4.2. Predictors/Constructs | 356 |
| 4.2.1. Intentions and Sense of Control | 356 |
| 4.2.2. Positive Affect | 356 |
| 4.2.3. Self-Efficacy | 356 |
| 4.2.4. Elaboration and Reduced Cognitive Load | 356 |
| 4.3. Intervention Components | 357 |
| 4.3.1. Text Message and App Component | 357 |
| 4.3.2. Health Education Component | 357 |
| 4.3.3. Professional Support Component | 357 |
| 4.3.4. Web Component | 362 |
| 4.3.5. Technological Components | 362 |
| 4.3.6. Comparator | 362 |
| 4.4. Behaviour Change Techniques | 362 |
| 4.4.1. Goal Setting, Self-Monitoring and Feedback | 362 |
| 4.4.2. Social Support | 363 |
| 4.4.3. Prompt Practice | 363 |
| 4.4.4. Stress Management and Relapse Prevention | 363 |
| 4.4.5. Graded Tasks | 363 |
| 4.4.6. Modelling/Demonstrating behaviour | 363 |
| 4.4.7. Social Comparison | 363 |
| 4.4.8. Barrier Identification | 364 |
| 4.4.9. Provision of Encouragement | 364 |
| 4.4.10. Contingent Awards | 364 |
| 4.4.11. Prompt Intention Formation | 364 |
| 4.4.12. Follow-Up Prompts | 364 |
| 4.4.13. Provide Instructions | 364 |
| 4.4.14. Prompt Practice | 364 |
| 5. Discussion Part A: Implications of Mobile Device Interventions for Weight Loss | 365 |
| 5.1. Changes in Weight | 365 |
| 5.2. Changes in BMI, Body Fat Percentage, and Waist Circumference | 365 |
| 5.3. Changes in Diet and Physical Activity Levels | 366 |
| 5.4. Intervention Feature Complexity | 366 |
| 5.5. Clinical Significance | 366 |
| 5.6. Implications of Negative Findings | 367 |
| 5.7. Importance of Comparator | 367 |
| 6. Discussion Part B: The Implications of Theory and Behaviour Change Techniques | 367 |
| 6.1. Theory | 367 |
| 6.2. Predictors | 370 |
| 6.3. Interaction with Predictors | 370 |
| 6.4. Research on Physiological Pathways | 370 |
| 6.5. Applied Theories Informing Intervention Design | 370 |
| 6.5.1. Common Theories | 370 |
| 6.5.2. Less Frequent Theories | 371 |
| 6.5.3. Implicit Theory | 371 |
| 6.6. Behaviour Change Techniques | 372 |
| 6.6.1. Key Adopted Behaviour Change Techniques | 372 |
| 6.6.2. Diverse Media of BCT Delivery | 375 |
| 6.7. Connection of Behavioural Change Techniques with Theory | 375 |
| 7. Summary of Discussions Part A and B | 376 |
| 7.1. Synopsis | 376 |
| 7.2. Strengths and Limitations | 377 |
| 7.2.1. Strengths | 377 |
| 7.2.2. Limitations | 377 |
| 7.3. Future Directions | 378 |
| 8. Conclusions | 378 |
| 8.1. Primary Central Research Objective | 378 |
| 8.2. Secondary Research Objective | 379 |
| Acknowledgements | 380 |
| Conflicts of Interest | 380 |
| References | 381 |
| Appendix | 384 |
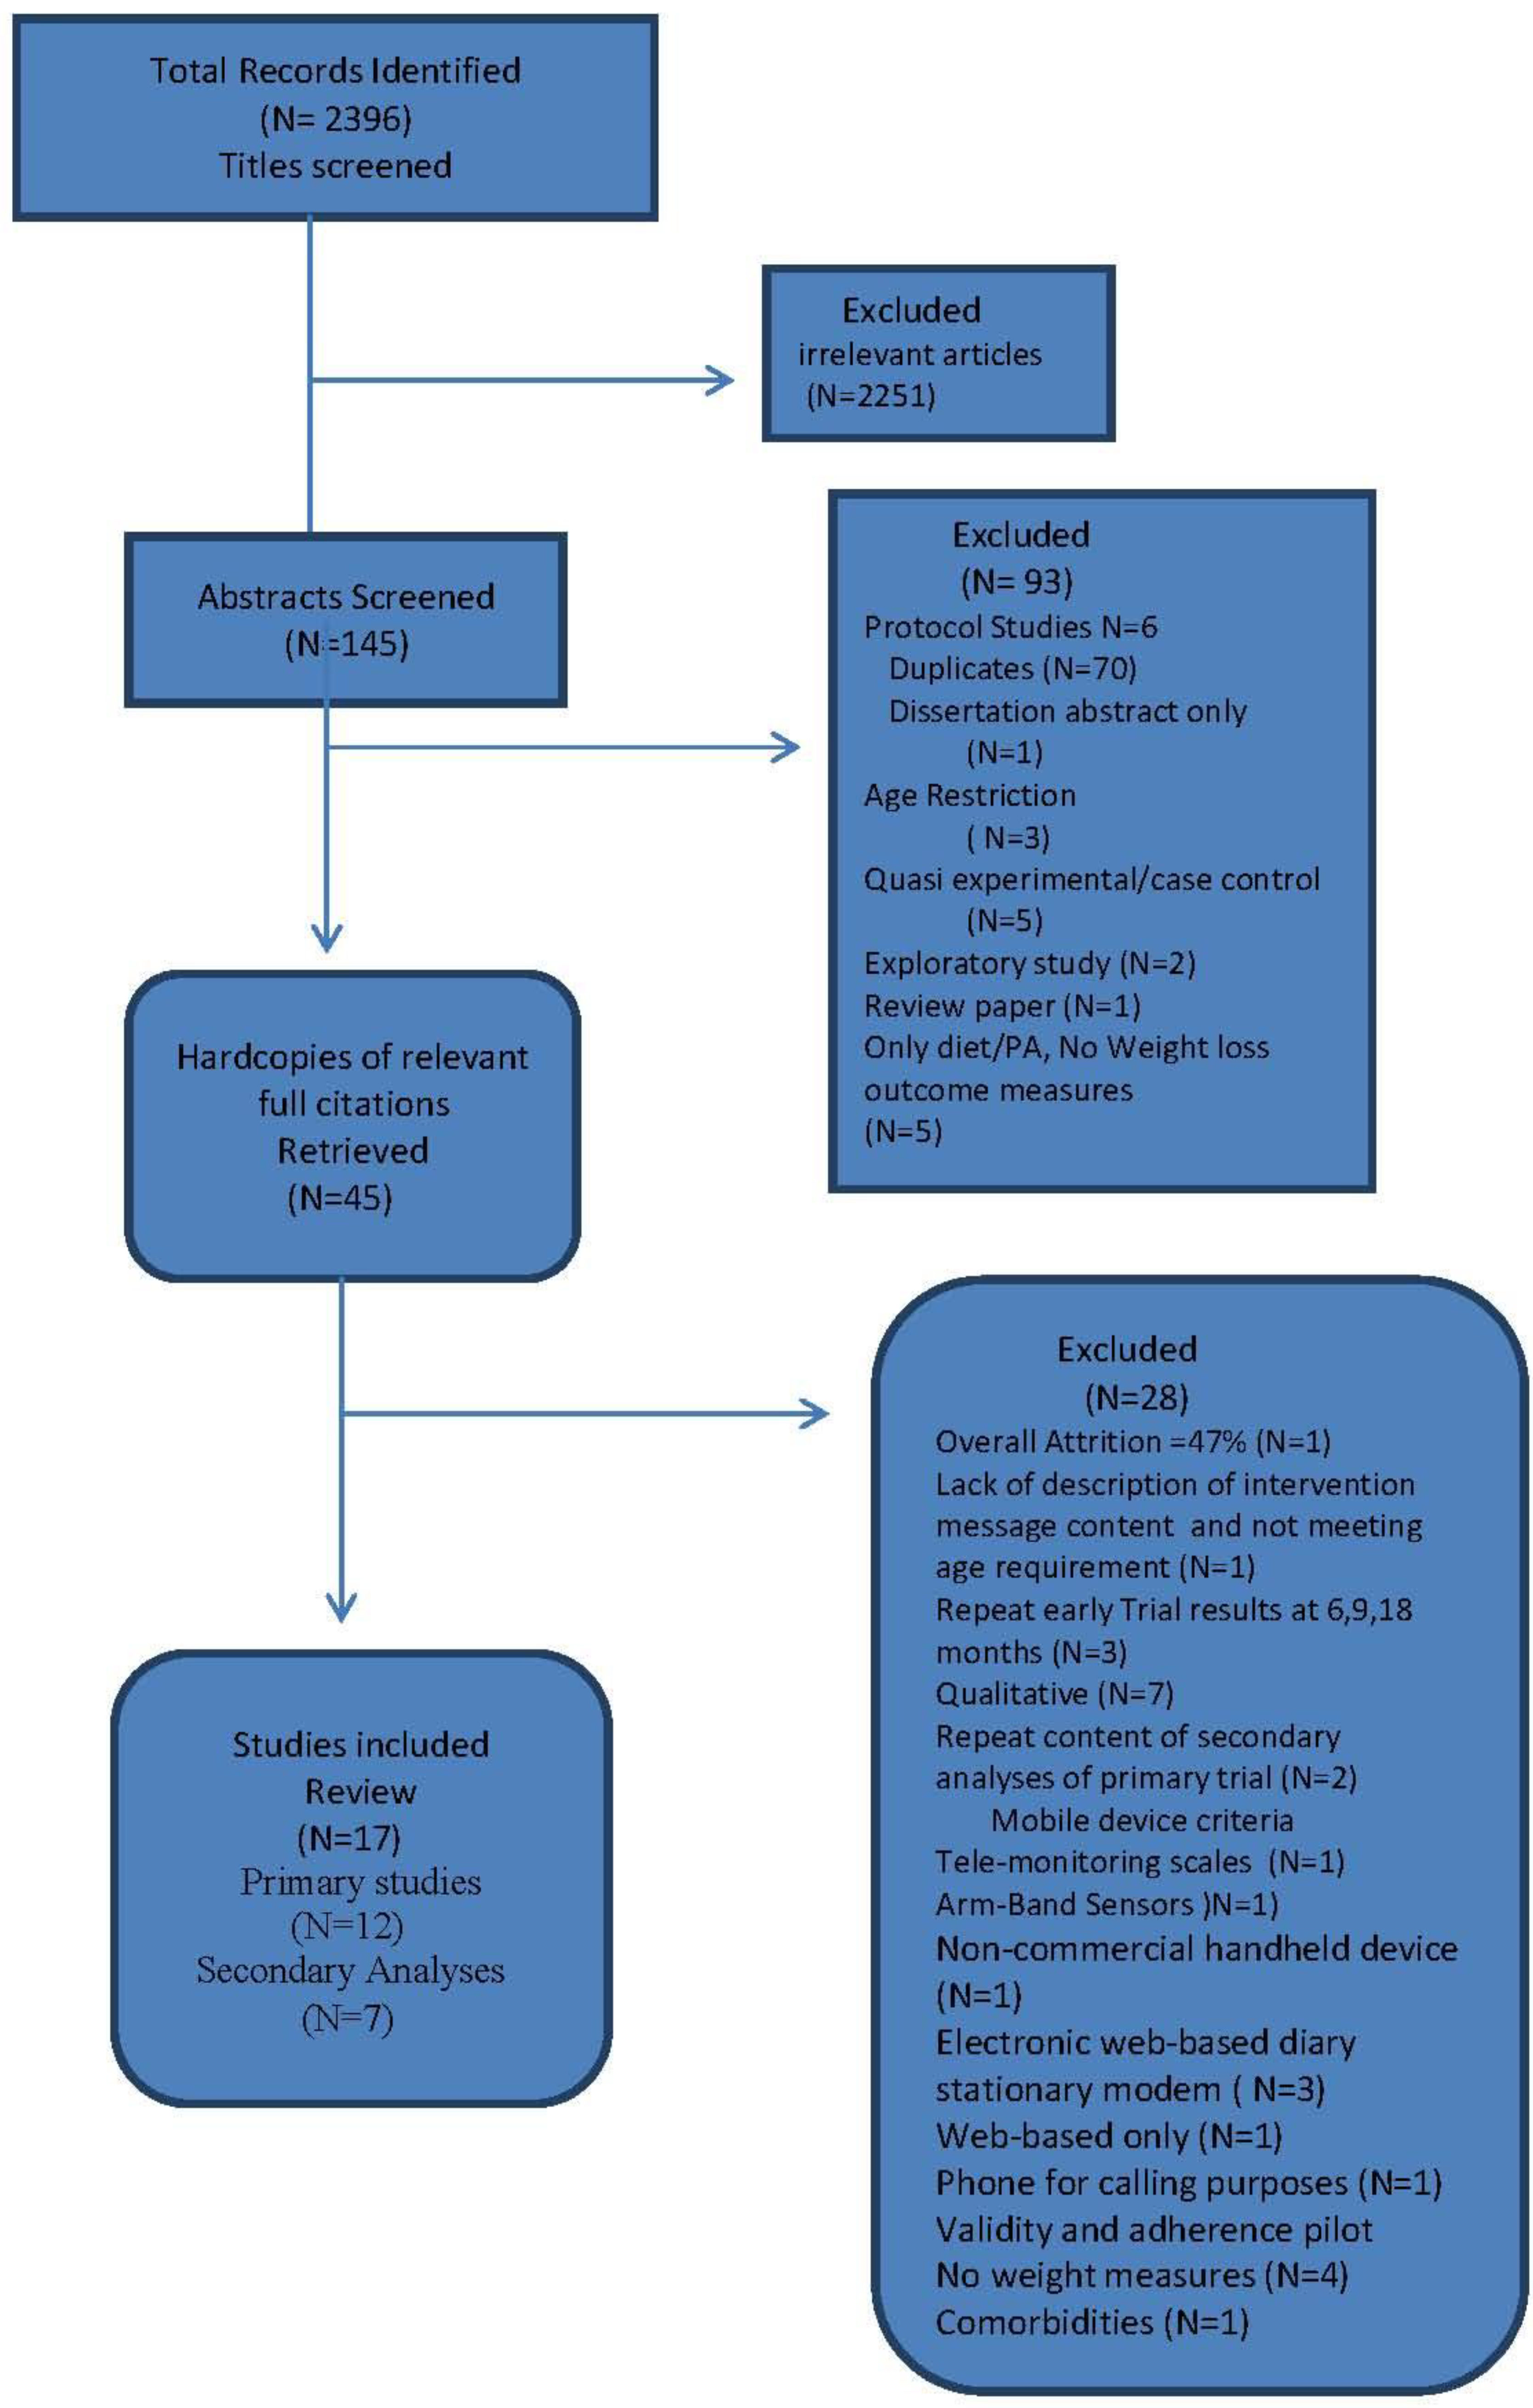
| Figure 1. Flow Chart of Search | 325 |
| Table 1. Study Characteristics of Mobile Phone Interventions | 326 |
| Table 2. Critical Appraisal Trial Quality Rating | 350 |
| Table 3. Risk of Bias Grading , Adapted from the Cochrane Hanbook Higgins et al | 352 |
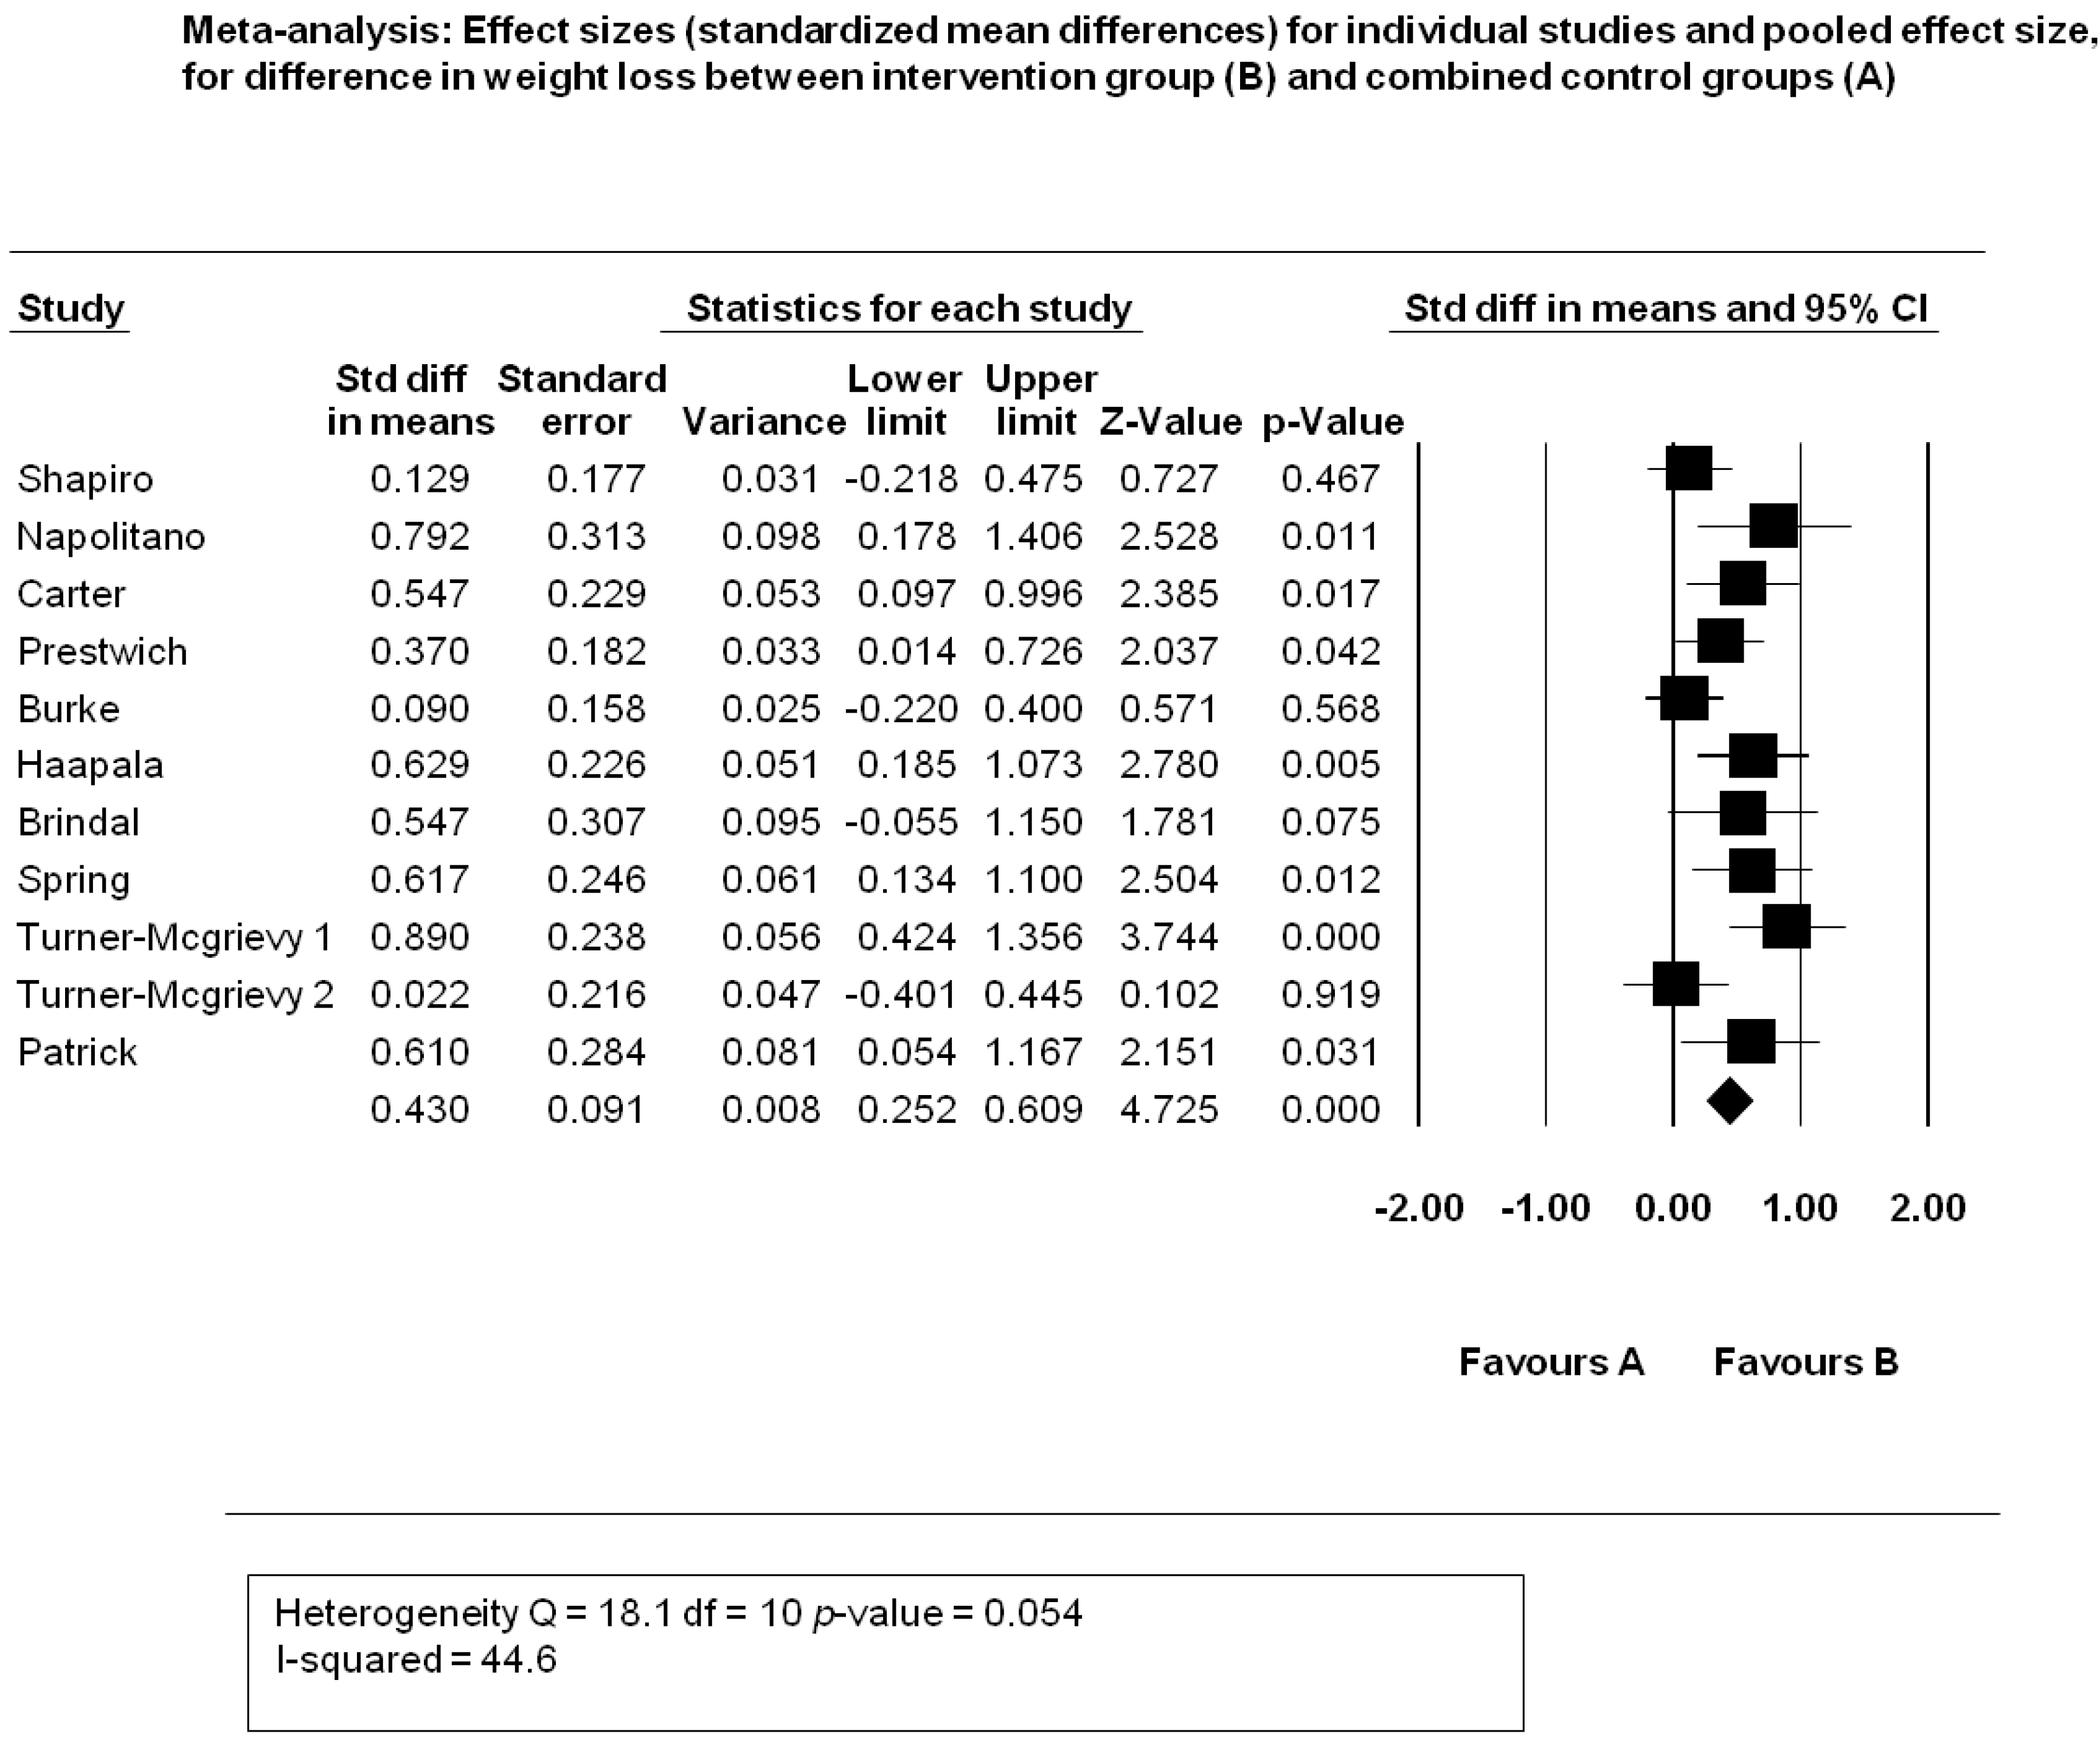
| Figure 2. Mobile Devices and Weight Loss Meta-analysis | 353 |
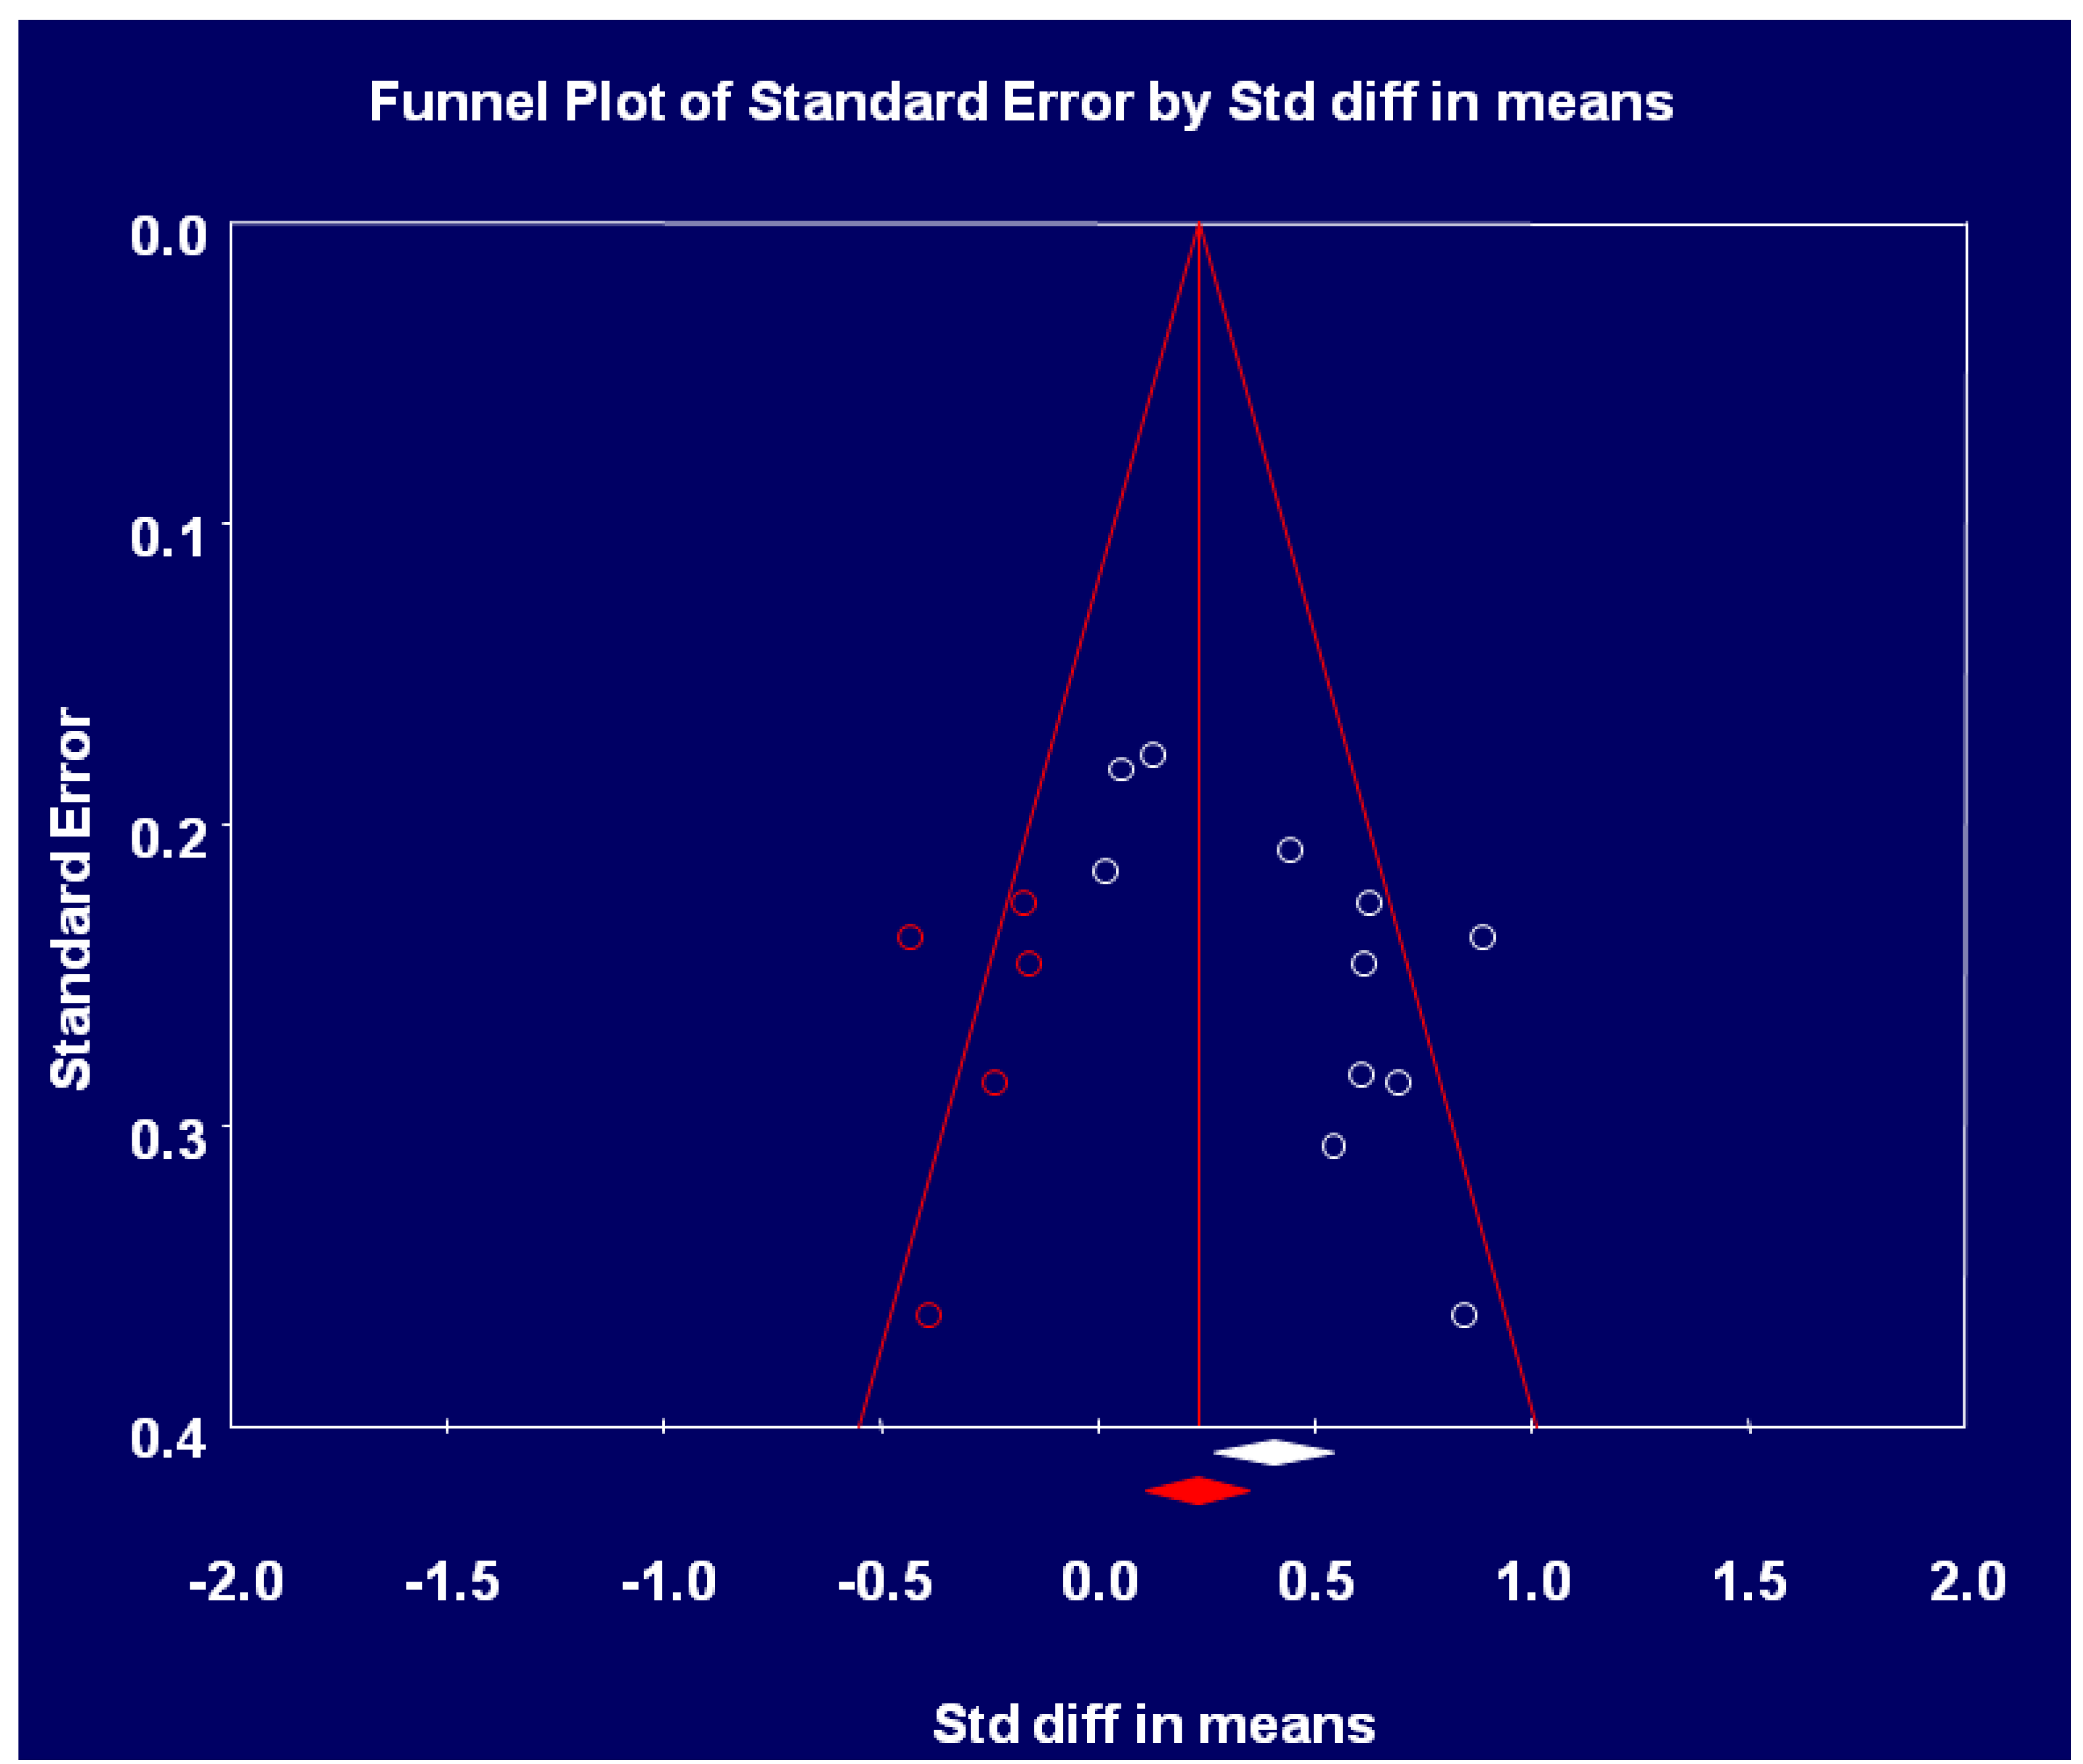
| Figure 3. Funnel Plot for Publication Bias | 354 |
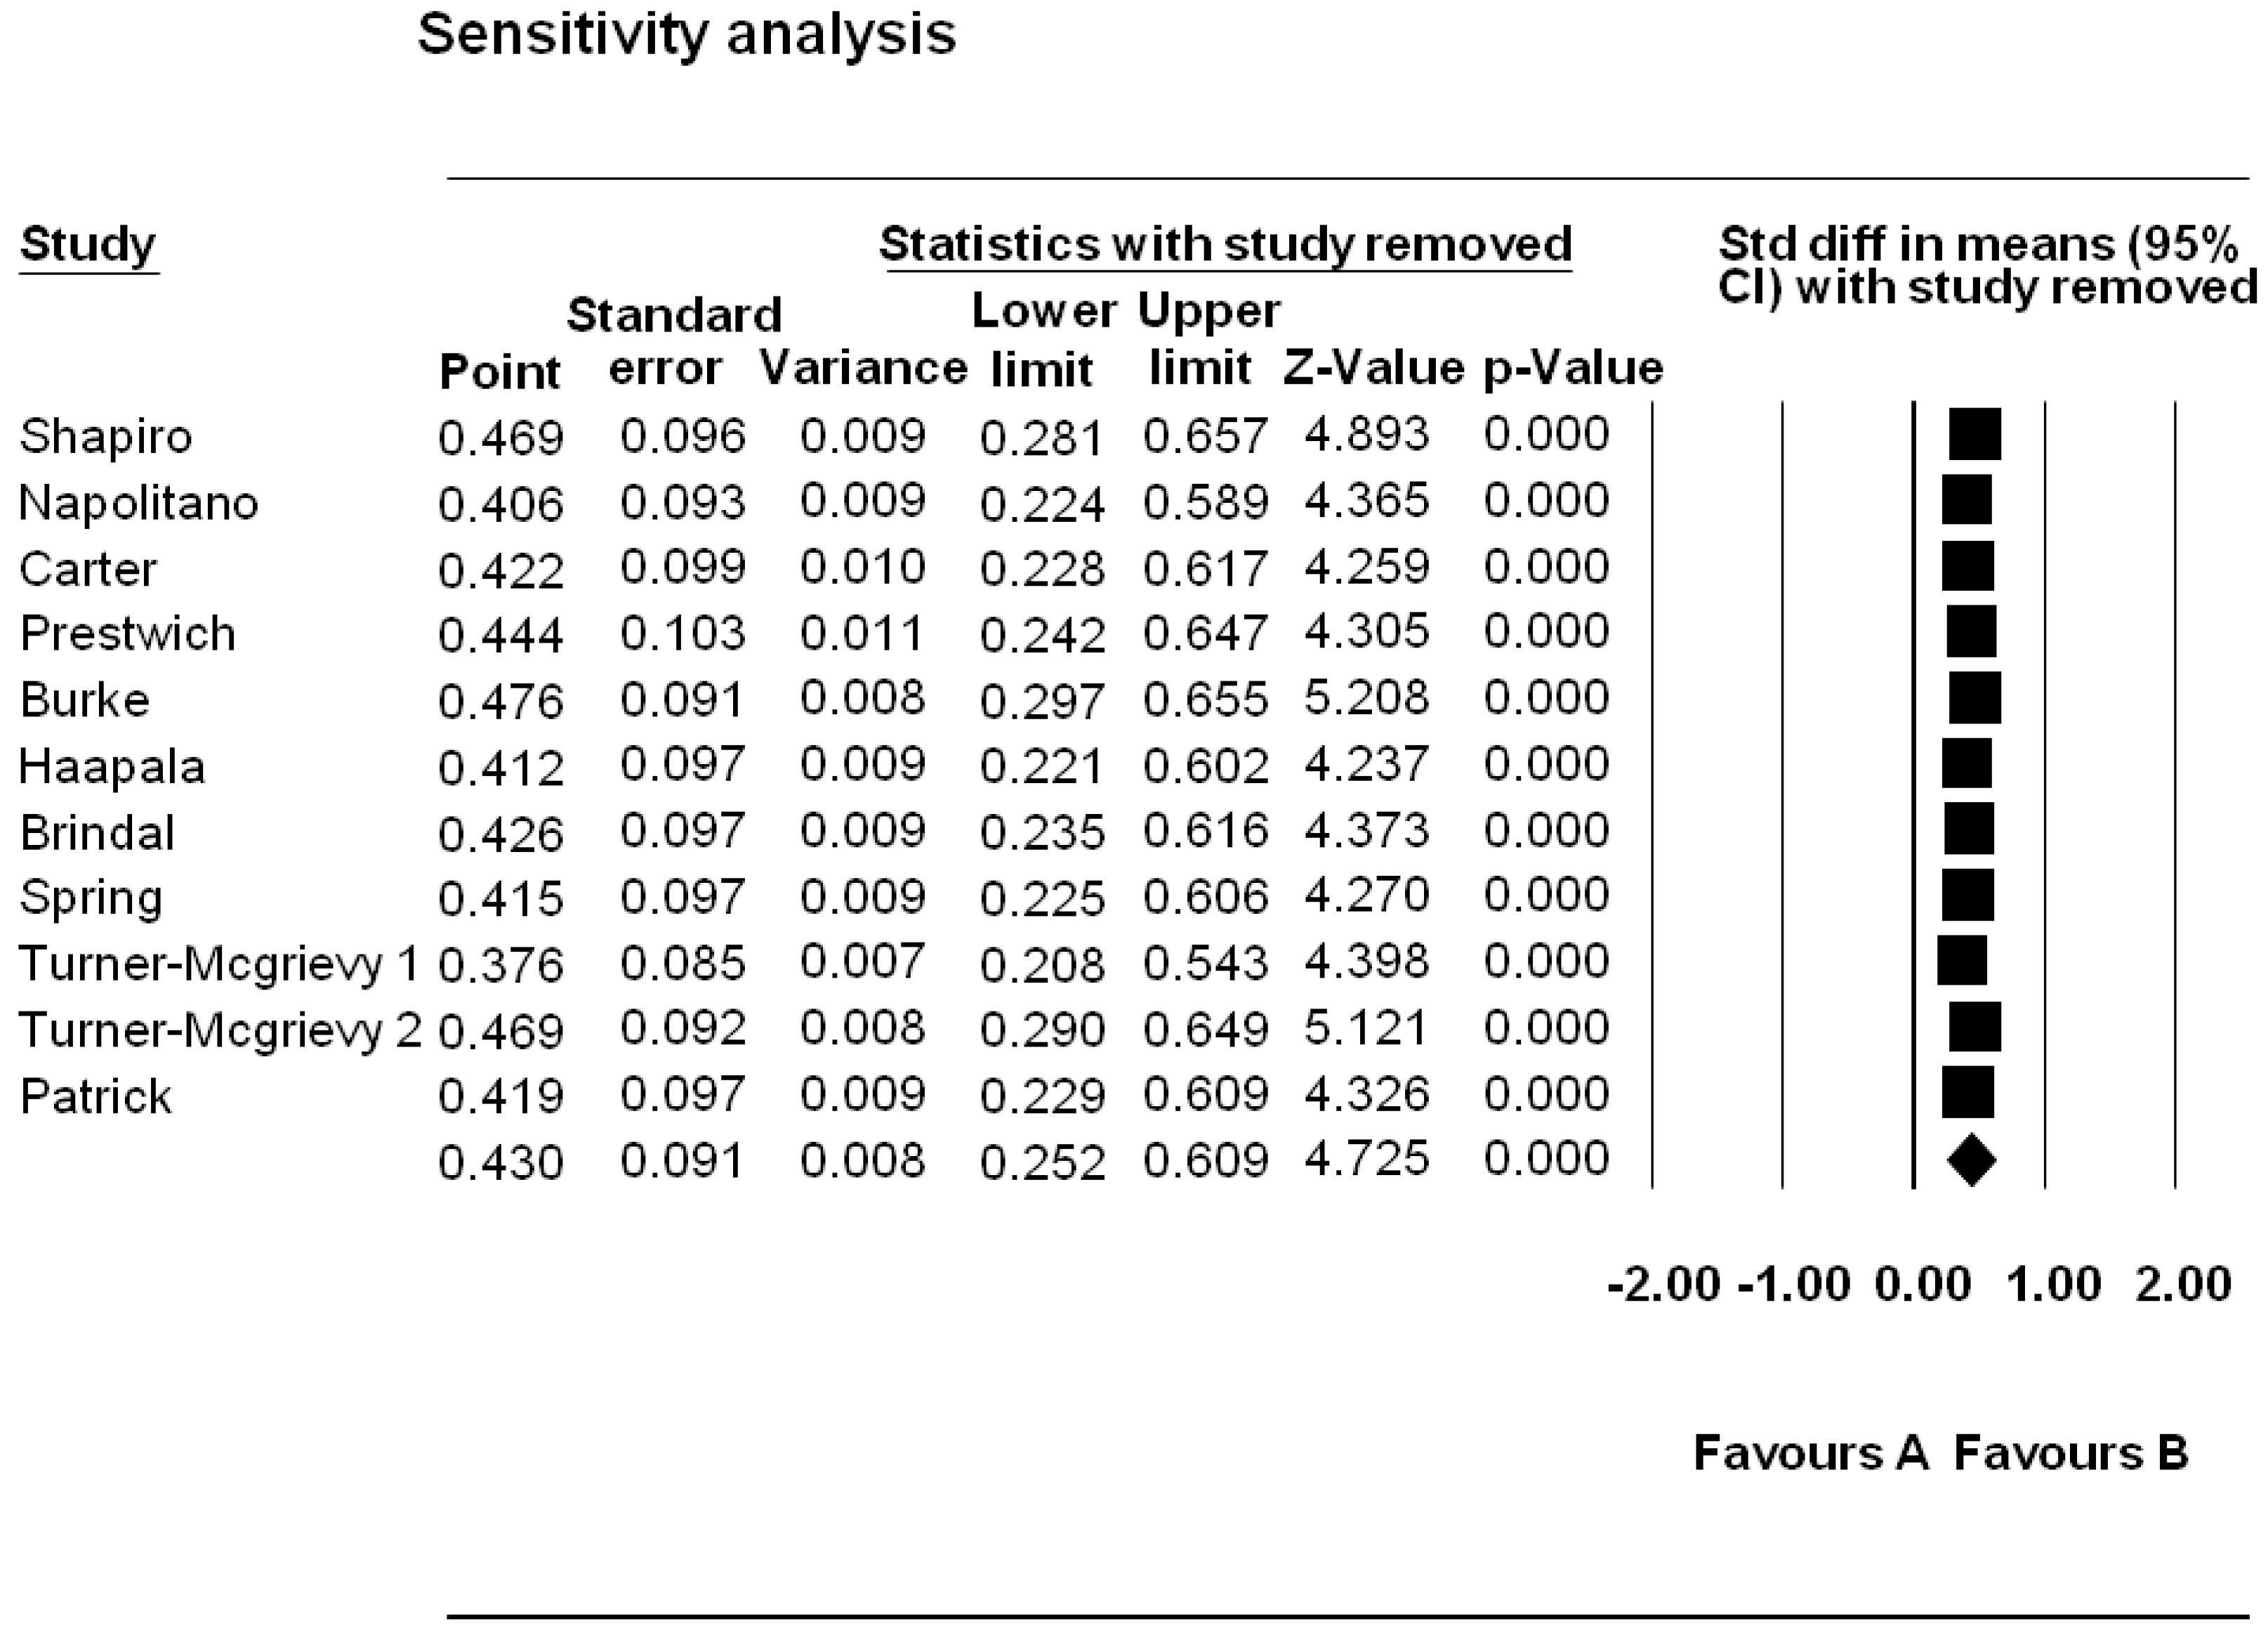
| Figure 4. Sensitivity Analysis | 355 |
| Table 4. Intervention Components | 358 |
| Table 5. Theory adapted from Michie and Prestwich Theory Coding and Michie and Abraham Illustrative Theory Techniques | 368 |
| Table 6. Application of Abraham and Michie et al. (2007) 26 Item Coding Manual for Behaviour Change Techniques | 373 |
| Figure 5. BCT and Theory Connection in Reviewed Trials | 376 |
| Table A1. Summary of CINAHL Search via EbscoHost | 384 |
1. Introduction
1.1. Background and Epidemiology
1.2. Morbidity and Mortality
1.3. Economic Costs
1.4. Global Strategies
1.5. Diet and Physical Activity Targets
1.6. Health Psychology
Health Psychology Theories
1.7. Behaviour Change Techniques
1.8. Mobile Technology Definition
1.9. Mobile Technology Usage and Public Health Applications
1.10. Research on Mobile Devices and Weight Loss
1.11. Aims and Research Questions
2. Methods
2.1. Overview
2.2. Databases Searched
2.3. Search Limiters
2.4. Search Terminology
2.5. Inclusion and Exclusion Criteria
- (1)
- Randomized controlled trials on weight loss and mobile devices in overweight and obese adults without specified co-morbidities
- (2)
- Weight as a primary or secondary outcome. Studies examining changes in diet and physical activity were included if weight was measured as a secondary outcome
- (3)
- Studies published until May 2013
- (4)
- New generation use mobile devices that are commercially available, including:
- ▪
- Mobile phones and smartphones ( iPhones, Android phones, and Blackberries)
- ▪
- Modern commercially available portable devices such as iPads, iPods, and MP3 players
- ▪
- Personal Digital assistants (PDA’s). PDA’s were included if they were of newer generation with updated feedback thermometers installed to ensure relevance and modernity en par with newer generation devices.
- (5)
- Studies measuring weight using validated weighing scales
- (6)
- Studies published in the English language
- (7)
- Open access peer reviewed journals
- (8)
- Studies with pre and post intervention weight measures
- (9)
- Clear description of intervention content including:
- ▪
- Content of messages
- ▪
- Techniques used
- (1)
- Case studies and quasi experimental studies
- (2)
- Studies on diet or physical activity without weight either as a primary or secondary outcome measure
- (3)
- Studies focusing on specific groups with pre-existing diseases and comorbidities in addition to overweight and obese patient status
- (4)
- Studies in subjects <18 years of age
- (5)
- Studies using Tele-monitoring devices alone such as weighing scales and accelerometers without additional mobile components such as a phone or PDA
- (6)
- PDA’s without updated feedback thermometers installed
- (7)
- Older generation handheld tablets not specified as PDA’s or any of the above listed devices, and not commercially available for wide population use
- (8)
- Studies examining weight change by using the phone for phone calling purposes without employing mobile smartphone features
- (9)
- Purely web-based interventions without a mobile device component
- (10)
- Stationary electronic devices such as computers
- (11)
- Laptops
- (12)
- Studies published in languages other than English
- (13)
- Studies employing subject self-report of weight change without objective validated measures
- (14)
- Studies without a clear description of intervention content and techniques used
2.6. Data Extraction
2.7. Study Quality Assessment
2.8. Data Coding
2.9. Data Synthesis
2.10. Data Analysis
3. Results Part A: Systematic Review with Meta-Analysis
3.1. General Search Results
3.2. General Descriptive
3.3. Mobile Device Intervention Media
3.4. Target Behaviour and Weight Loss

| Study | Location | Sample | Trial Length | Design/ Recruitment | Target Behaviour | Experimental Group | Control Group | Measures | Results |
|---|---|---|---|---|---|---|---|---|---|
| Haapala et al. 2009 [30] | Finland | N = 125 F = 78% M = 21% Mean BMI = 26.3 kg/m2 Range = 19–30 kg/m2 Mean Age = 38 Range = 25–44 women = 80% White = 75% | 12 months | Two Group RCT Newspaper, Phone screening | Diet, PA | Mobile phone programme Weight Balance Calculates PA/Energy Expenditure + Tailored Daily Target Goal Text Messages, Time left for target reach Weight loss targeted at 2 kg/month | No Intervention | Self- administered questionnaires on Diet + PA + Monthly weight recorded by Nurse Waist circumference measures in cm via tape | Weight Loss EG = 4.5 kg over 12 months p-value vs. CG = 1.1 kg over 12 months (p-value for group differences = 0.006) |
| Hurling et al. 2007 [31] | Bedfordshire UK | N = 77 EG = 47 CG = 30 Mean Age = 40.4 Range = 30–55 Mean BMI = 26 kg/m2 Range = 19–30 kg/m2 | 9 Weeks | Two Group RCT Randomization = Random Stratification Market Research Agency Recruitment + Phone Screening | PA | Mobile phone and internet Weekly PA sessions with reminders Via phone /email Automated Feedback on PA levels + tailored solutions texts for barriers | No Intervention | Wrist Accelerometer Bluetooth Actiwatch + Self-Report of PA Weight- Bio-Electrical Impedance Scales | Primary Outcomes- EG = increase over baseline perceived control (p-value < 0.001) + Intent to exercise (p-value < 0.001 PA levels EG = increase in moderate PA (p-value = 0.03) Mean increase PA relative to control = 2 h 18 min per week Secondary Outcome- Weight Loss EG = 2.18% body fat(SD = 0.59) CG = 0.17% body fat loss (SD = 0.81) (p-value = 0.04) |
| Norman et al. 2013 [43] | San Diego California USA | N = 93 EG = 65 CG = 33 Mean Age = 45 Range = 25–55 Mean BMI =32.2 kg/m2 Range =25–39.9 kg/m2 F = 80% M = 20% | Four Months | Secondary Analysis of above study; Patrick et al. 2009 [32] Two Group RCT Simple Randomization Recruitment via Flyers, newspapers, adds, announcement on Craigslist | Nutrition, Fruit + Vegetable Intake, Eating Behaviour Change | Printed Monthly Materials Weight Control Brief Monthly Phone Calls from Counsellor 5–15 min Tailored and Interactive SMS + MMS | Printed Monthly materials on weight control | Nutrition intake via multiple 24 h food recall Eating Behaviour Inventory Score Changes (EBI) | EG baseline EBI score = 70.88( SD = 6.2) 4 month after = 79.62 (8.11) Total Change = 8.73 (SD = 6.23) (p-value ≤ 0.001) EG Fruit + Veg intake Baseline score = 4.60 (SD = 3.01) 4 months after = 5.08 (SD = 3.48) Total Change = 0.49 (2.33) (p-value = 0.297) CG baseline EBI score = 72.19 (SD = 7.57) 4 months after = 74.23 (SD = 6.58) Total Change = 2.04 (SD = 0.02) (p-value = 0.140) Baseline Fruit Veg intake = 5.84 (SD = 3.04) 4 months after = 4.33 (SD = 2.69) Total Change = −1.52 reduction (SD = 4.22) (p-value = 0.079) |
| Carter et al. 2012 [38] | Leeds UK | N = 128 Age-18–65 Mean age = 41 F = 68.8% Mean BMI = 34 kg/m2 (SD = 5) F = 77% M = 23% | 6 months | 3 Arm Parallel RCT Random process of Minimization Recruitment- Email Newsletter, Internet, Posters, from Large Local Employer | PA + Diet | Smartphone App My Meal Mate Diary App stores food photos incorporates Goal Setting, Self-Monitoring, and feedback Via weekly mobile text messages | Either Website or Diary (without App and mobile components) | Portable Weight Scales Weight Watchers 89584 Model | Primary Outcome Adherence EG = increased adherence relative to control 92 days (SD = 67) vs. control 35 days (SD44) Secondary Outcome Weight BMI kg/m2 smartphone EG group reduction = −1.6 kg/m2 reduction (95% CI = −2.2–1.1) CG Web group = BMI reduction −0.5 kg/m2 (95% CI = −0.9–0.0) CG Diary Group = BMI reduction −1.0 kg/m2 (95% C = −1.6–0.4) Body fat EG Smartphone % reduction = −1.3% reduction (95% CI = −1.7–0.8) CG Diary Group = % body fat reduction −0.09% (95% CI = −1.5–0.4) CG Website group = −0.5% reduction Body fat (95% CI =−0.90–0) Mean Weight Change (from baseline) EG smartphone reduction = −4.6 kg (95% CI = −6.2–3.0) CG Diary Group = Mean weight change reduction = −2.9 kg (95% CI = −4.7–1.1) CG Website Group = Mean Weight reduction = −1.3(−2.7–0.1) |
| Study | Location | Sample | Trial Length | Recruitment | Target Behaviour | Intervention | Controls | Measures | Outcome |
| Shapiro et al. 2012 [33] | San Diego California | N = 170 F = 67 M = 64 Mean Age = 41.9 Range = 25–69 Mean BMI = 32.2 kg/m2 Range = 25–39.9 kg/m2 | 12 months | 2 Group RCT Recruitment- Magazine, online advertising | Primarily PA, diet secondary | Mobile phone SMS + MMS personalized + interactive Frequency 4× day/12 months with feedback (graphical step feedback) Messages tailored based on online baseline survey Message content— self-monitoring PA, diet, sugar sweetened beverages, Knowledge questions, tips, educational facts, portion control | Monthly newsletters | Yamax Digi-Walker CW Series 600 Pedometer Weight measures -Digital Weight Scale | No group differences in weight loss at 6 months CG weight reduction = 1.53 lb. EG weight reduction 3.72 lb. 12 months CG weight reduction 2.27 lb vs. 3.64 lb. EG Adherence = 60%–69% |
| Increased adherence = greater weight loss at 6 months (p-value- = 0.039 and 12 months (p-value = 0.023) | |||||||||
| EG group step counts increased to 3000 step/day (p-value < 0.05) | |||||||||
| Increased step count = increased weight loss (p-value < 0.05) | |||||||||
| Study | Location | Sample | Trial Duration | Recruitment | Target Behaviour | Intervention | Control | Measures | Outcome |
| Turner-Mcgrievy et al. 2011 [34] | Raleigh Durham, North Carolina USA | N = 96 EG = 47 CG = 49 Age Range = 18–60 Mean Age = 38 Mean BMI = 32.6 kg/m2 Range 25–45 kg/m2 73% = female 78% = White | 6 months | 2 Group RCT Computerized random number generator randomization Recruitment- T.V advertisement, email | PA + diet | Podcast on Diet + PA information, goal setting, soap opera, audio blog of a man/woman losing weight founded on earlier study using social cognitive theory + Mobile component with PA App (iPhone, iPod, Blackberry), interacting on Twitter with study participants and counsellors Frequency = 2 podcasts per week for three months 15 min each + 2 mini podcasts per week for 3–6 months 5 min each Study coordinator sent 2 messages a day to study group | Podcast only on diet + PA designed on earlier study using social cognitive theory Received handbook on calorie content of food Podcast frequency 2 podcasts per week for three months 15 min each with 2 mini podcasts per week for 3–6 months 5 min each | Body Weight scale Fat Secret Calorie Counter Scale | Weight Loss did not differ by groups (p-value = 0.98) Mean weight loss % EG = −2.7% (SD = 5.6) CG = −2.7% (SD = 5.1) EG 3× more likely than CG to use app to self-monitor diet (p-value = 0.01) Number of podcasts download correlated with weight loss Pearson’s r = −0.46 (p-value = 0.001) EG has increased sense of self control at 3 months vs. controls (p-value = 0.02), but not at 6 months (p-value = 0.06) CG relied more on friends for support (p-value = 0.045) 28% vs. EG relied on social groups online for support (p-value = 0.001) 25% EG vs. 0% CG |
| *Turner-Mcgrievy 2013 [44] Secondary analysis of Turner-Mcgrievy 2011 study [34] | Raleigh Durham area North Carolina USA | N = 96 BMI = 25–45 kg/m2 Age 18–60 Mean = 38 | 6 months | Post-Hoc Secondary Analysis of RCT (Mcgrievy et al. 2011 [34]) Recruited via email, televisions adds, and newspapers | PA | PA App With podcasts | No App Only podcast Paper Journal and Website Controls | Body Weight scale Fat Secret Calorie Counter Scale | EG self-monitored more frequently relative to CG = 2.6 (SD 0.5) days/week vs. 1.2 (0.5) days/week CG (p-value < 0.001) EG had increased intentional PA relative to CG = 196.4 (SD = 45.9) kcal/day vs. 100.9 (SD = 45.1) (p-value = 0.02) BMI EG lower at 6 months relative to controls = 31.5 (SD = 0.5) kg/m2, CG = 32.5 (0.5) kg/m2 (p-value = 0.02) No group difference in frequency of self-monitoring (p-value = 0.63) EG consumed less energy relative to controls 1437 (SD = 188) kcal/day vs. CG paper journal 2049 (SD = 175) kcal/day (p-value = 0.01) |
| Turner-Mcgrievy 2009 [35] | Raleigh Durham Area North Carolina | N = 78 BMI = 25–45 kg/m2 Mean age EG = 37.7 Mean Age CG = 39.6 Female = 80% White = 71% | 12 weeks | 2 Group RCT Recruitment via newspapers + University | PA, Diet | 24 enhanced podcast episodes designed on social cognitive theory Frequency 2 podcasts per week Mean Length 15 min 42 s Delivery via MP3 player Content targeted 5 areas of social cognitive theory – expectancies, expectation, self-efficacy behavioural capability Using health education on nutrients/PA + soap opera podcast, information of benefits of weight loss, podcast discussing expectations during weight loss+ strategies and end of podcast goal setting with self-monitoring Groups given book on calorie content of food items | 24 standard podcast episodes based on commercial weight loss program Frequency 2 podcasts per week Mean Length18 min 34 s Delivery via mp3 player Content used cognitive restructuring to avoid over-eating focused on how to lose weight conducted by 2 hosts Including stimulus control to avoid snacking and positive psychology to improve body image Groups given book on calorie content of food items | Body weight scale measured in study office baseline + follow-up Self-report PA Nutritional intake assessed using Prime Screen Questionnaire, averaging intake fruit, vegetables, and fat Likert scale used to assess level of control + elaboration | Enhanced podcast Group Weight loss −2.9 kg (SD = 3.5) vs. Control standard podcast = −0.3 (SD = 2.1) BMI change Enhanced Podcast Group = −1.0 kg/m2 (SD = 1.2); Control standard podcast group = −0.1 (0.7) kg/m2 Between group difference p-value ≤ 0.001 Enhanced podcast group Fruit and vegetable intake increase = 0.4 (SD = 0.7) fruit 0.2 (SD = 0.9) vegetable intake Control standard podcast fruit+ veg intake increase = 0.01 (SD = 0.4) fruitDecrease vegetable intake of = −0.2 (SD = 0.7) p-value between group differences ≤ 0.005 Increase in reported vigorous activity enhanced podcast group = 0.8 (SD = 0.9) days per week vs. control decrease of vigorous activity = −0.4 (SD = 1.4) p-value between groups ≤ 0.01 No difference in high fat food intake between groups Increase in knowledge scores for enhanced podcast group |
| Study | Location | Sample | Trial Length | Design/ Recruitment | Target Behaviour | Intervention | Control | Measures | Outcome |
| Prestwich et al. 2010 [39] | United Kingdom | N = 149 Mean age = 24.44 F = 64% M = 36% BMI N/A | 4 weeks | 3 Group RCT Recruitment via email Allocation sequence based on computer generation randomization used (no stratification or block methods) | PA | Group 1 = Implementation and intentions + SMS plan Tailored text messages reminding to initiate plan according to participant determined scheduling Required to plan 30 min 5 days a week of walking(at least bouts of 10 min brisk walking) in specific achievable environments/situations Frequency = 1 text per plan, scheduled at same time of plan behaviour Group 2 = Implementation + SMS goal Same requirements as group 1 But did not receive plan reminder text, instead goal reminder of brisk walking time of texts individually tailored by determining timing All groups Provided with Government recommended guidelines of 30 min moderate to vigorous physical activity and information on brisk walking for 30/min day on 5 or more days/week End of task given plan recall + goal recall task | Control Group 3 did not receive any text messages + no requirement to form implementation intentions Goal recall task end of study | Self-Reported PA levels Physiological measures taken BMI at study site using digital scale at baseline + follow-up | Primary outcome- physical activity 42% in the Intentions + goal reminder group increased brisk walking for 2 more days a week 45% in the Intentions+ plan group increased brisk walking for 2 more days/week relative to 22% of controls p values ≤ 0.01 Secondary outcomes Weight loss: Implementation Intention+ goal reminder lost 0.53 kg Vs. Implementation Intention+ plan group = 0.10 kg (p-value group difference = 0.03 95% CI = 0.04–0.91), when comparing intention+ goal group with intention+ plan and control effect remains significant = p-value 0.046 (95% 0.03–0.72) Control group = 0.14 kg Impact on other PAIntention +plan group increased other types of activity vs. control (p-value < 0.03) but not relative to the other group (p-value 0.12) Plan recall higher in intention +plan group relative to intention +goal group (p-value < 0.01) |
| Study | Location | Sample | Trial Length | Recruitment/ Randomization | Target Behaviour | Intervention | Control | Measures | Outcome |
| Brindall et al. 2013 [36] | Australia | N = 53 BMI = 26–34 kg/m2 Mean BMI = 34 kg/m2 100% female Age 19–63 Mean age = 42 | 8 weeks | 2 group RCT randomization using a computer generated sequence Recruitment = Newspaper add and established volunteer database | Diet+ PA | iPhone required commercially available partial meal replacement programme Intervention group given Meal replacement App Instructed on MRPP celebrity slim app App replaces meals 2× a day with shakes (does not count calories, only restricts energy intake) Intervention support app with the following over control app: Rewards positive behavioural change prompts self-monitoring with reminders + tailored feedback | iPhone required commercially available partial meal replacement programme Control given Static App based on info in the MRP App Instructed on Meal replacement (MRP) app celebrity slim App replaces meals 2× a day with formulated shakes does not count calories, only restricts energy intake | Self-report of weight In person weight recording at study office with body weight scale + stadiometer for height | Mean difference in weight loss between EG + CG was not significant EG mean weight loss difference = 3.2% (SD = 0.38) CG mean weight loss difference = 2.2% (SD = 0.37) (p-value = 0.08) Week 8 = 23% CG and 21% EG lost 5% body weight 95% support app found it helpful with maintaining scheduled goals vs. 9% in standard app group Mean increase in positive affect in group with support app = 0.48 increase (SD = 0.14) vs. decrease in the standard app CG = −0.01 (SD = 0.13) |
| Contains trophy room for rewards, goals/tasks to finish, Meal calendar, weight recorder + health information Prompting generated using Apple Push Notification Service frequency 3 × day during meal times and leisure PA times Individually tailored to schedule Meal Calendar on iPhone used for self-monitoring and caloric/energy expenditure feedback Message board on iPhone provides motivational messages | |||||||||
| Study | Location | Sample | Trial Length | Recruitment | Target Behaviour | Intervention | Control | Measures | Results |
| Napolitano et al. 2013 [40] | Eastern United States (large urban University | N = 52 students Age = 18–29 Mean age = 20.47 BMI = 25–50 kg/m2 Mean BMI = 31.36 kg/m2 Female = 86.5% | 8 weeks | 3 arm RCT (pilot) Recruitment = Emails, listervs, online newspapers, flyers, Facebook, university student organizations | Diet +PA | Group 1 = Facebook only Weekly hand outs and podcasts /videos on health education topics( planning +nutrition, PA, hunger triggers, social support, dinning out, relapse prevention) Physical activity and eating healthy event invitations Targets gradually increase PA to 250 min/week Caloric intake 1200–1800 kcal/week according to weight Group 2 = Facebook + mobile phone text messaging Received same components as group 1 except belonged to a different Facebook group and text messages on goal setting, self-monitoring + social support, positive reinforcement + brief feedback | Control group wailing list | Body weight measured using calibrated weight scale at 4 and 8 weeks + height measured via stadiometer Calorie Counter, Pedometer, Digital scale for in person recording | 8 weeks weight loss Facebook Plus texting group = −2.5 kg (SD = 2.4)Facebook group =−0.63 (SD = 2.4) Waiting list Control = −0.24 (SD = 2.6) Changes stat sig between groups (p-value = 0.05) Program helpfulness = 97% agree 100% recommend programme 81.3% found videos + hand outs helpful |
| Study | Location | Sample | Trial Length | Recruitment | Target Behaviour | Experimental Group | Control Group | Measures | Results |
| Messages topics differed each day 3 types—self monitoring, prompting to self-monitor, and texts tailored according to individual barriers Personalized feedback provided via summary reports Contained Buddy component for peer support Given a pedometer, calorie counter book, and digital scale Weight goals = max 2 pounds loss/month set by staff | |||||||||
| Study | Location | Sample | Trial Length | Design | Target Behaviour | Experimental Group | Control Group | Measures | Results |
| Spring et al. 2013 [37] | Midwestern VA Hospital USA | N = 69 Mean Age = 57 85% Male | 12 months | 2 group RCT Recruitment by contacting all outpatients | Diet + PA | EG received PDA to monitor diet+ PA with thermometer providing automated feedback With mobile phone coaching calls for 6 months 10–15 min advice, providing tailored timely feedback Attended same Move sessions as controls Calorie goals tailored to baseline weight +activity goals 5%–10% weight loss goal | Bi-weekly weight loss groups (Move sessions) in person VA outpatient clinic Duration = 1.5 h led by psychologists, nutritionists, and dieticians | Calibrated weight scale used to measure weight at study sites | EG 3/9 kg (3.1%) more weight loss relative to control (95% CI 2.2–5.5) No evidence treatment varied across time (p-value = 0.44) OR 5% weight loss EG to CG = 6.46 (95% CI 2.5–18.6) With no variation across time (p-value = 0.13) |
| Study | Location | Sample | Trial Length | Design | Targets Behaviour | Experimental Group | Control Group | Data Collection | Results |
| Burke et al. [41,42] 2011; 2012 (repeat analyses of SMAR TRIAL) | Pittsburgh Pennsylvania USA | N = 210 Mean age = 46.8 Mean BMI = 27 kg/m2 84% female | 24 months | SMART Trial 3 group RCT | Diet+ PA | Group 1 = PDA+ Feedback Group 2 = PDA only All groups had weekly groups sessions 1–4 months, bi-weekly months 5- components goal setting self-monitoring dietary intake + nutritional goals, weekly exercise goalsdietary goals 1200–1800 Calories per day, with no more than 25% calories from fat Increase PA to 180 min over 6 months, with 30 min increases in concurrent months | Group 3 control = differed in self-monitoring method-paper diary All groups had weekly groups sessions 1–4 months, bi-weekly months 5–12 components goal setting self-monitoring dietary intake + nutritional goals, weekly exercise goals dietary goals 1200–1800 Calories per day, with no more than 25% calories from fat Increase PA to 180 min over 6 months, with 30 min increases in concurrent months | Digital scale to measure weight by study staff Self-reported PA 2 unannounced 24 h dietary recalls | Waist circumference decreased more in PDA groups relative to paper group (p-value = 0.02) Energy + saturated fat intake decreased in PDA groups relative to paper group (p-value = 0.05) Only PDA +FB lost significant weight = –2.32(95% CI = −4.29–0.35) (p-value = 0.02) Paper Group = −1.94 (95% CI = −3.88–0.01) PDA Group = −1.38 (95% CI = −3.38–0.62 Increased weight loss for more adherent >60% vs. less adherent <30 (p-value < 0.001) |
| Study | Location | Sample | Trial Length | Design | Targets | Experimental Group | Control Group | Measures | Outcome |
| Archaya et al. 2011 [45] Secondary Analysis of Burke et al. [41,42] | Pittsburgh Pennsylvania USA | N = 210 Mean age = 46.8 Mean BMI = 27.4 kg/m2 84% female | 24 months | SMART Trial 3 group RCT Secondary analysis | Diet+ PA | Group 1 = PDA+ Feedback Group 2 = PDA only All groups had weekly groups sessions 1-4 months, bi-weekly months 5- components goal setting self-monitoring dietary intake + nutritional goals, weekly exercise goals dietary goals 1200-1800 Calories per day, with no more than 25% calories from fat Increase PA to 180 min over 6 months, with 30 min increases in concurrent months | Group 3 control = differed in self-monitoring method-paper diary All groups had weekly groups sessions 1-4 months, bi-weekly months 5-12 components goal setting self-monitoring dietary intake + nutritional goals, weekly exercise goals dietary goals 1200-1800 Calories per day, with no more than 25% calories from fat Increase PA to 180 min over 6 months, with 30 min increases in concurrent months | Digital scale to measure weight by study staff Self-reported PA 2 unannounced 24 h dietary recalls | PDA groups increased fruit consumption relative to controls (p-value = 0.02) and vegetable consumption relative to controls (p-value < 0.01) Frequent self-monitoring associated with total sugar (p-value = 0.02) in both groups Interaction between self-monitoring in both PDA groups and changes in fat intake (p-value = 0.02), trans-fatty acids (p-value = 0.04), mono saturated fats (p-value = 0.002) |
| Study | Location | Sample | Trial Duration | Design | Targets | Experimental Group | Control Group | Measures | Outcome |
| Conroy et al. 2011 [46] Secondary analysis of Burke et al. 2011 [41,42] | Pittsburgh Pennsylvania USA | N = 210 Mean age = 46.8 Mean BMI = 27.4 kg/m2 84% female | 24 months | SMART Trial 3 group RCT | Diet+ PA | Group 1 = PDA+ Feedback Group 2 = PDA only All groups had weekly groups sessions 1–4 months, bi-weekly months 5- components goal setting self-monitoring dietary intake + nutritional goals, weekly exercise goals dietary goals 1200–1800 Calories per day, with no more than 25% calories from fat Increase PA to 180 min over 6 months, with 30 min increases in concurrent months | Group 3 control = differed in self-monitoring method-paper diary All groups had weekly groups sessions 1–4 months, bi-weekly months 5–12 components goal setting self-monitoring dietary intake + nutritional goals, weekly exercise goals dietary goals 1200–1800 Calories per day, with no more than 25% calories from fat Increase PA to 180 min over 6 months, with 30 min increases in concurrent months | Digital scale to measure weight by study staff Self-reported PA 2 unannounced 24 h dietary recalls | PDA_+FB mean number of self-monitoring entries greater than PR arm (3.4 vs. 2.4) (p-value = 0.003) More likely to maintain high adherence to PA goals overtime than PDA (p-value = 0.02) or PR arm (p-value = 0.0003) |
3.5. Dietary Measures
3.6. Dietary Changes Overview
3.6.1. Dietary Changes in Fruit and Vegetable Intake
3.6.2. Dietary Changes in Sugar and Fat Intake
3.6.3. Dietary Changes in Daily Caloric Intake
3.6.4. Changes in EBI and ED Scores
3.7. Physical Activity Measures
3.8. Physical Activity Overview
3.8.1. Perceived Physical Activity Goal Adherence
3.8.2. Changes in Physical Activity Levels
3.9. Weight Measures
3.10. Weight Loss Overview
3.10.1. Changes in Weight Mobile Phones
3.10.2. Changes in Weight Other Mobile Devices
3.10.3. Weight Loss and Adherence
3.11. Changes in BMI
3.12. Changes in Waist Circumference
3.13. Changes in Body Fat Percentage
3.14. Study Quality
3.15. Risk of Bias Grading
| Study | Randomization Method Clear + Appropriate? | Allocation Concealment? | No Significant Baseline Difference in Characteristics? | Assessors / Caregivers Blind to intervention? | Methods of data collection Valid? | Minimal attrition? Differences between groups? | Sample Size/Power Calculation | Subjects blind to intervention? | Intention to treat analysis? |
|---|---|---|---|---|---|---|---|---|---|
| Shapiro et al. 2012 [33] | N/A | √ | √ | - No | √ | √ | √ | - No | √ |
| Study | Randomization Method Appropriate + Clear? | Allocation Concealment? | No Significant Differences in Baseline Characteristics? | Assessors/CaregiversBlind to Intervention? | Methods of Data Collection Valid? | Minimal Attrition? Differences between groups? | Sample Size/ Power Calculation? | Subjects Blind to Intervention? | Analysis by Assignment? |
| Turner-Mcgrievy et al. 2011 [34] | √ | √ | √ | -No | √ | √ | √ | -No | √ |
| Author | Patrick [32] | Haapala [30] | Hurling [31] | Brindal [36] | Turner-Mcgrievy [1] | Turner- Mcgrievy [2] | Prestwich [39] | Spring [37] | Burke [42] | Shapiro [33] | Carter |
|---|---|---|---|---|---|---|---|---|---|---|---|
| Random Sequence Generation | √ | ? | √ | √ | √ | ? | √ | √ | √ | ? | √ |

3.16. Meta-Analysis Weight Loss (kg)
3.16.1. Overview
3.16.2. Results
3.16.3. Heterogeneity
3.16.4. Publication Bias

3.16.5. Sensitivity Analysis

4. Results Part B: Intervention Content Analysis; Use of Theory and Behavior Change Techniques
4.1. Theoretical Base
4.2. Predictors/Constructs
4.2.1. Intentions and Sense of Control
4.2.2. Positive Affect
4.2.3. Self-Efficacy
4.2.4. Elaboration and Reduced Cognitive Load
4.3. Intervention Components
4.3.1. Text Message and App Component
4.3.2. Health Education Component
4.3.3. Professional Support Component
| Study | Text Message Component? | App Component? | Health Education Diet/PA Component? | Self-Monitoring with Feedback? | Prompting/ Priming motivation, positive behavioural beliefs, or self- efficacy? | Professional Support Component? | Web-Component? | Comparator group without Intervention? | Use of single Intervention/ technology? |
|---|---|---|---|---|---|---|---|---|---|
| Carter et al. 2013 [38] | √ | √ | No | √ | √ | No | √ | No Controls with diary or website interventionBut no mobile phone technology | √ |
| Shapiro et al. 2012 [33] | √ | No | √ | Self-monitoring with pedometer, feedback with step graphical MMS charts | √ | No | √ | √ | No, besides mobile phone intervention—access to e-newsletters |
| Turner-Mcgrievy et al. 2011 [34] | No text message component | √ | √ | Goal setting activity podcast Self-monitoring app Feedback via Twitter | √ | √ | √ | No, given podcast | No, podcast and mobile intervention for experimental group |
| Study | Text message Component? | App Component? | Health Education Component? | Self-Monitoring with Feedback combined? | Positive Message Prompts or Motivational Component | Professional Support Component? | Web Component? | Comparator without Intervention? | Single technological component? |
| Patrick et al. 2009 [32] | √ | No | Education on Portion Control, Eating Out, meal planning, calorie education, strength training, exercise environments+Printed health education materials on diet + PA | √ | √ | √ | No | No, Control group had printed monthly health education but not technology | No, experimental group had professional consultation phone calls and printed health education in additional to mobile phone intervention |
| Haapala et al. 2009 [30] | √ | √ | √ | √ | No | No | √ | √ | √ |
| Hurling et al. 2009 [31] | √ | No | No | √ | √ | No | √ | √ | No |
| Turner-Mcgrievy et al. 2009 [35] | No Text Messaging | No | √ | No | √ | No | No | No controls given standard podcast | √ |
| Prestwich et al. 2010 [39] | √ | No | √ | No | No | No | No | √ | √ |
| Study | Text Message Component? | App Component? | Health Education Component? | Self-Monitoring with Feedback? | Motivational Component? | Professional Support Component? | Web Component? | Control without intervention? | Single Technological Component? |
| Brindall et al. 2013 [36] | No text messaging But app messages tailored to schedule | √ | √ | √ | √ | No | No | No given standard APP | √ |
| Napolitano et al. 2013 [40] | Tailored according to barriers | No app | √ | √ | Positive reinforcing text messages | No Buddy social support | √ | √ | No included Facebook intervention combined with text messaging |
| Spring et al. 2013 [37] | No | No | √ | √ | No technology based motivational messages; over phone coach counselling | √ | No | No controls had Move sessions | No, phone counselling and group sessions |
| Burke et al. 2011, 2012 [41,42] | No | No | √ | √ | No motivational messages | No | No | No controls had either paper diary or PDA without feedback (group 2) | No group sessions with self-monitoring method |
4.3.4. Web Component
4.3.5. Technological Components
4.3.6. Comparator
4.4. Behaviour Change Techniques
4.4.1. Goal Setting, Self-Monitoring and Feedback
4.4.2. Social Support
4.4.3. Prompt Practice
4.4.4. Stress Management and Relapse Prevention
4.4.5. Graded Tasks
4.4.6. Modelling/Demonstrating behaviour
4.4.7. Social Comparison
4.4.8. Barrier Identification
4.4.9. Provision of Encouragement
4.4.10. Contingent Awards
4.4.11. Prompt Intention Formation
4.4.12. Follow-Up Prompts
4.4.13. Provide Instructions
4.4.14. Prompt Practice
5. Discussion Part A: Implications of Mobile Device Interventions for Weight Loss
5.1. Changes in Weight
5.2. Changes in BMI, Body Fat Percentage, and Waist Circumference
5.3. Changes in Diet and Physical Activity Levels
5.4. Intervention Feature Complexity
5.5. Clinical Significance
5.6. Implications of Negative Findings
5.7. Importance of Comparator
6. Discussion Part B: The Implications of Theory and Behaviour Change Techniques
6.1. Theory
| Study | Explicit Theory informing intervention? | Explicit Single Theory? | Theory predictors used to select recipients? | Target/Construct of Theory Mentioned? | Adequate Description of how construct predicts behaviour? | Health behaviour predictor measured baseline and follow-up | Change in construct predicting health behaviour in support of Theory? | Techniques adopted specific to target construct? |
|---|---|---|---|---|---|---|---|---|
| Prestwich [39] | Yes | Yes Implementation Intentions | No | Yes Intentions Goal and Plan Recall | Yes | Yes | Yes Increased Recall in SMS groups | Yes |
6.2. Predictors
6.3. Interaction with Predictors
6.4. Research on Physiological Pathways
6.5. Applied Theories Informing Intervention Design
6.5.1. Common Theories
6.5.2. Less Frequent Theories
6.5.3. Implicit Theory
6.6. Behaviour Change Techniques
6.6.1. Key Adopted Behaviour Change Techniques
| Behaviour Change Technique | Haapala et al. [30] | Prestwich et al. [39] | Patrick et al. [32] | Turner-Mcgrievy et al. 2009 [35] | Turner Mcgrievy et al. 2011 [34] | Napolitano et al. 2013 [40] | Brindal et al. [36] | Shapiro et al. [33] | Carter et al. [39] | Hurling et al. [31] | Burke et al [42] | Spring et al. [37] | Author |
|---|---|---|---|---|---|---|---|---|---|---|---|---|---|
| Provide General Information on Behaviour Health Link or Health Education | √ | √ | √ | √ | √ | √ | √ | √ | |||||
| Provide Information on Consequences | + | ||||||||||||
| Provide Information about other’s ‘Approval | |||||||||||||
| Prompt Intention Formation | √ | √ | √ | √ | √ | ||||||||
| Prompt Barrier Identification | √ | √ | √ | √ | |||||||||
| Provide General Encouragement | √ | √ | √ | √ | √ | √ | |||||||
| Provide Instruction or tips | √ | √ | √ | √ | |||||||||
| Graded tasks | √ | √ | √ | ||||||||||
| Model/ Demonstrate the Behaviour | √ | √ | |||||||||||
| Prompt Specific Goal Setting | √ | √ | √ | √ | √ | √ | √ | √ | √ | √ | √ | √ | √ |
| Prompt Review of Behavioural Goals | √ | ||||||||||||
| Techniques | Haapala | Prestwich | Patrick | Turner-Mcgrievy1 | Turner-Mcgrievy-2 | Napolitano | Brindal | Shapiro | Carter | Hurling | Burke | Spring | |
| Prompt Self-Monitoring of Behaviour | √ | √ | √ | √ | √ | √ | √ | √ | √ | √ | √ | √ | |
| Provide Feedback on Performance | √ | √ | √ | √ | √ | √ | √ | √ | √ | ||||
| Provide Contingent Rewards | √ | ||||||||||||
| Teach to use Prompt Cues | |||||||||||||
| Agree Behavioural Contract | √ | ||||||||||||
| Prompt Practice | √ | √ | √ | √ | √ | √ | √ | √ | |||||
| Use of Follow-up Prompts | √ | ||||||||||||
| Provide Opportunity for Social Comparison | √ | √ | √ | ||||||||||
| Plan Social Support/Social Change | √ | √ | √ | √ | |||||||||
| Prompt Identification as a Role Model/Position Advocate | |||||||||||||
| Prompt Self Talk | √ | ||||||||||||
| Relapse Prevention | √ | ||||||||||||
| Stress Management | √ | ||||||||||||
| Time Management |
6.6.2. Diverse Media of BCT Delivery
6.7. Connection of Behavioural Change Techniques with Theory

7. Summary of Discussions Part A and B
7.1. Synopsis
7.2. Strengths and Limitations
7.2.1. Strengths
7.2.2. Limitations
7.3. Future Directions
8. Conclusions
Do mobile devices induce weight loss and favourable changes in diet and physical activity when compared to baseline weight and scores? Do they induce weight loss when compared with standard controls receiving no intervention and or when compared with controls receiving non-mobile weight loss interventions?
8.1. Primary Central Research Objective
What health psychology theories and psychological behaviour change techniques inform mobile device weight loss intervention design and are theoretical constructs along the causal pathway leading to weight loss improved post-intervention?
8.2. Secondary Research Objective
Acknowledgements
Conflicts of Interest
References
- The World Health Organization. Global Health Observatory. Obesity situation and trends. Available online: http://www.who.int/gho/ncd/risk_factors/obesity_text/en/ (accessed on 20 June 2013).
- Kelly, T.; Yang, W.; Chen, C.S.; Reynolds, K.; He, J. Global burden of obesity in 2005 and projections to 2030. Int. J. Obes. 2008, 32, 1431–1437. [Google Scholar] [CrossRef]
- The Global Burden of Disease Study 2010. Lancet. 2012, 380, p. 9589. Available online: http://www.thelancet.com/themed/global-burden-of-disease (accessed on 10 January 2013).
- The World Health Organization. Promoting fruit and vegetable consumption around the world. 2013. Available online: http://www.who.int/dietphysicalactivity/diet/en/index.html (accessed on 20 June 2013).
- The World Health Organization. Physical activity. 2013. Available online: http://www.who.int/dietphysicalactivity/pa/en/index.html (accessed on 20 June 2012).
- Withrow, D.; Alter, D.A. The economic burden of obesity worldwide: A systematic review of the direct costs of obesity. Obes. Rev. 2011, 12, 131–141. [Google Scholar] [CrossRef]
- Vadon, R. Cost of obesity overestimated. BBC news. 2007. Available online: http://news.bbc.co.uk/1/hi/health/7106219.stm (accessed on 25 June 2013).
- The World Health Organization. Global strategy on diet, physical activity, and health. 2004. Available online: http://www.who.int/dietphysicalactivity/en/ (accessed on 20 June 2013).
- The World Health Organization. Global recommendations on physical activity for health. 2004. Available online: http://www.who.int/dietphysicalactivity/publications/9789241599979/en/index.html (accessed on 20 June 2013).
- Food Standards Agency. FSA nutrient and food based guidelines for UK institutions. Available online: http://www.food.gov.uk/ (accessed 20 June 2013).
- Webb, T.L.; Sniehotta, F.F.; Michie, S. Using theories of behaviour change to inform Interventions for addictive behaviours. Addiction 2010, 105, 1879–1892. [Google Scholar] [CrossRef]
- Volkow, N.D.; Wise, R.A. How can drug addiction help us understand obesity? Nat. Neurosci. 2005, 8, 555–560. [Google Scholar] [CrossRef]
- Tones, K.; Green, J. Mass Communication and Community Action. In Health Promotion: Planning and Strategies, 1st ed.; SAGE Publications Ltd: London, UK, 2004; pp. 240–268. [Google Scholar]
- Zimmerman, G.L.; Olsen, C.G.; Bosworth, M.S. Stages of change approach to helping patients change behaviour. Am. Fam. Physician 2000, 61, 1409–1416. [Google Scholar]
- Michie, S.; Richardson, M.; Johnston, M.; Abraham, C.; Francis, J.; Hardeman, W. The behaviour change technique taxonomy (v1) of 93 hierarchically clustered techniques: Building on international consensus for the reporting of behaviour change interventions. Ann. Intern. Med. 2013, 46, 81–95. [Google Scholar]
- Abraham, C.; Michie, S. A taxonomy of behaviour change techniques used in interventions. Health Psychol. 2007, 27, 379–387. [Google Scholar] [CrossRef]
- Burke, L.; Wang, J.; Sevick, M.A. Self-monitoring in weight loss: A systematic review of the literature. J. Am. Diet Assoc. 2011, 111, 92–102. [Google Scholar] [CrossRef]
- Michie, S.; Abraham, C.; Whittington, C.; Mcateer, J. Effective techniques in healthy eating and physical activity interventions: A meta-regression. Health Psychol. 2009, 28, 690–701. [Google Scholar] [CrossRef]
- Coons, M.; Roehrig, M.; Spring, B. The potential of virtual reality technologies to improve adherence to weight loss behaviours. J. Diabetes Sci. Technol. 2002, 5, 340–344. [Google Scholar] [CrossRef]
- Lefebre, C. Integrating cell phone and mobile technologies into public health practice a social marketing perspective. Health Promot. Pract. 2009, 10, 490–494. [Google Scholar] [CrossRef]
- ITU World Telecommunications. The world in 2010. The rise of 3G. 2010. Available online: http://www.itu.int/ITU-D/ict/material/FactsFigures2010.pdf (accessed on 2 June 2013).
- Whittaker, R.; Mcrobie, H.; Bullen, C.; Borland, R.; Rodgers, A.; Gu, Y. Mobile-based interventions for smoking cessation. Cochrane Database Syst. Rev. 2012. [Google Scholar] [CrossRef]
- Shaw, R.; Bosworth, H. Short message service (SMS) text messaging as an intervention medium for weight loss: A literature review. Health Inform. J. 2012, 18, 235–250. [Google Scholar] [CrossRef]
- Fanning, J.; Mullen, S.P.; McAuley, F. Increasing physical activity with mobile devices: A meta-analysis. J. Med. Internet Res. 2012, 14, e161. [Google Scholar] [CrossRef]
- Bacigalupo, R.; Cudd, P.; Littlewood, P.C.; Bissell, M.S.; Hawley, S.; Buckley Woods, H. Interventions employing mobile technology for overweight and obesity: An early systematic review of randomized controlled trials. Obes. Rev. 2012, 14, 279–291. [Google Scholar]
- Bird, E.L.; Olgivie, D.; Powell, J.; Baker, G.; Mutrie, N.; Sahlqvist, S. Behaviour change techniques used to promote walking and cycling: A systematic review. Health Psychol. 2013, 32, 829–838. [Google Scholar] [CrossRef]
- Michie, S.; Prestwich, A. Are interventions theory-based? Development of a theory coding scheme. Health Psychol. 2010, 29, 1–8. [Google Scholar] [CrossRef]
- Higgins, R.; Altman, D.G.; Gotzsche, P.C.; Juni, P.; Moher, D. The Cochrane Collaboration’s tool for assessing risk of bias in randomized trials. Br. Med. J. 2011, 343, d5928. [Google Scholar] [CrossRef]
- Higgins, J.P.T.; Green, S. (Eds.) Cochrane Handbook for Systematic Reviews of Interventions. Version 5.1.0. The Cochrane Collaboration, 2011. Available online: http://www.cochrane-handbook.org (accessed on 10 May 2013).
- Haapala, I.; Barengo, N.; Biggs, S.; Surakka, L.; Manninen, P. Weight loss by mobile phone: A 1-year effectiveness study. Public Health Nutr. 2009, 12, 2382–2391. [Google Scholar] [CrossRef]
- Hurling, R.; Catt, M.; de Boni, M.; Fairley, B.W.; Hurst, T.; Murray, P.; Richardson, A.; Sodhi, J.S. Using internet and mobile phone technology to deliver an automated physical activity program: Randomized controlled trial. J. Med. Res. 2007, 9, e7. [Google Scholar]
- Patrick, K.; Raab, F.; Adams, M.A.; Dillon, A.; Zabinski, M.; Rock, C.L.; Griswold, W.G.; Norman, G. A text-based intervention for weight loss. A randomized controlled trial. J. Med. Internet Res. 2009, 11, e1. [Google Scholar]
- Shapiro, J.R.; Koro, T.; Doran, N.; Thompson, S.; Sallis, F.J.; Calfas, K.; Patrick, K. Text4diet: A randomized controlled study using text messaging for weight loss behaviours. Preventive Med. 2012, 55, 412–417. [Google Scholar] [CrossRef]
- Turner-McGrievy, G.; Tate, D. Tweets apps and pods: Results of the 6-month mobile pounds off digitally (mobile pod) randomized weight-loss intervention among adults. J. Med. Internet Res. 2011, 13, e120. [Google Scholar] [CrossRef]
- Turner-McGrievy, G.; Campbell, M.K.; Crosby, L. Pounds off Digitally: A randomized Podcasting weight loss intervention. Am. J. Preventive Med. 2009, 37, 283–289. [Google Scholar]
- Brindall, E.; Hendrie, G.; Freyne, J.; Coombe, M.; Berkovsky, S.; Noakes, M. Design and pilot results of a mobile phone weight-loss application for women starting a meal replacement programme. J. Telemed. Telecare 2013, 19, 166–174. [Google Scholar] [CrossRef]
- Spring, B.; Duncan, J.; Janke, A.; Kozak, A.T.; Mcfadden, G.; DeMott, A.; Pictor, A.; Epstein, L.; Siddique, J.; Pellegrini, C.; et al. Integrating technology into standard weight loss treatment: A randomized controlled trial. JAMA Internal Med. 2013, 173, 105–111. [Google Scholar] [CrossRef]
- Carter, M.C.; Burley, V.J.; Nykjaer, C.; Cade, J.E. Adherence to a smartphone application for weight loss compared to website and paper diary: Pilot randomized controlled trial. Med. Internet Res. 2013, 15, e32. [Google Scholar] [CrossRef]
- Prestwich, A.; Perugini, M.; Hurling, R. Can implementation intentions and text messages promote brisk walking? A randomized trial. Health Psychol. 2010, 29, 40–49. [Google Scholar] [CrossRef]
- Napolitano, M.A.; Hayes, S.; Bennette, G.G.; Ives, A.K.; Foster, G.D. Using Facebook and text messaging to deliver a weight loss program to college students. Obesity 2013, 21, 25–31. [Google Scholar] [CrossRef]
- Burke, L.; Styn, M.A.; Sereika, S.M.; Conroy, M.B.; Ye, L.; Glanz, K.; Sevick, M.A.; Ewing, L.J. Using mHealth technology to enhance self-monitoring for weight loss a randomized Controlled trial. Am. J. Preventive Med. 2012, 43, 20–26. [Google Scholar] [CrossRef]
- Burke, L.E.; Conroy, M.B.; Sereika, S.; Elci, O.U.; Styn, M.A.; Archaya, S.D.; Sevick, M.A.; Ewing, L.J.; Glanz, K. The effects of electronic self-monitoring on weight loss and dietary intake: A randomized behavioural weight loss trial. Obesity 2011, 19, 338–344. [Google Scholar] [CrossRef]
- Norman, G.J.; Kolodziejczyk, J.K.; Adams, M.A.; Patrick, K.; Marshall, S.J. Fruit and vegetable intake and eating behaviours mediate the effect of a randomized text-message based weight loss program. Preventive Med. 2013, 56, 3–7. [Google Scholar] [CrossRef]
- Turner-McGrievy, G.; Beets, M.W.; Moore, J.B.; Kaczynski, A.T.; Barr-Anderson, D.J.; Tate, D.F. Comparison of traditional versus mobile app self-monitoring of dietary intake and physical activity among overweight and obese adults participating in the mhealth weight loss program. Am. J. Med. Inform. Assoc. 2013, 20, 513–518. [Google Scholar] [CrossRef]
- Archaya, S.D.; Elci, O.U.; Sereika, S.M.; Styn, M.A.; Burke, L.E. Using a personal digital assistant for self-monitoring influences diet quality in comparison to a standard paper record among overweight and obese adults. J. Am. Diet Assoc. 2011, 11, 583–588. [Google Scholar]
- Conroy, M.B.; Yang, K.; Elci, O.U.; Gabrielle, K.P.; Styn, M.A.; Wang, J.; Kriska, A.M.; Sereika, S.M.; Burke, L.E. Physical activity self-monitoring and weight loss: 6 month results of the SMART trial. Med. Sci. Exerc. 2011, 43, 1568–1574. [Google Scholar] [CrossRef]
- McGough, J.M.; Faraone, S. Estimating the size of treatment effects. Moving beyond p values. Psychiatry 2009, 6, 21–29. [Google Scholar]
- Michie, S.; Prestwich, A.; de Bruin, M. Importance of the nature of the comparison conditions for testing theory-based interventions: Reply. Health Psychol. 2013, 29, 468–470. [Google Scholar] [CrossRef]
- Turner-McGrievy, G.; Kalyanaram, S.; Campbell, K. Delivering health information via podcast or web: Media effects on psychosocial and physiological respnses. Health Commun. 2013, 28, 101–109. [Google Scholar]
- Webb, T.L.; Joseph, J.; Yardley, L.; Michie, S. Using the internet to promote health behaviour change: A systematic review and meta-analysis of the impact of theoretical basis, use of behaviour change techniques, and mode of delivery on efficacy. J. Med. Internet Res. 2010, 17, e4. [Google Scholar]
- Emedicine. Barriers to Healthy Eating. 2013. Available online: http://www.emedicinehealth.com/healthy_eating-health/page5_em.htm (accessed on 1 July 2013).
- Abraham, C.; Michie, S.; Whittington, C.; McAteer, J. Specifying self-regulation intervention techniques in the context of healthy eating. Int. J. Psychol. 2008, 43, S575. [Google Scholar]
- Lyzwinski, L.N. An examination of obesity and eating disorder prevention programmes in schools. Educ. Health 2013, 31, 12–16. [Google Scholar]
- Dalhgren, M.; Whitehead, M. developing the policy response to inequities in health. A global perspective. In Challenging Inequities in Healthcare: From Ethics to Action; Oxford University Press: New York, NY, USA, 2001; pp. 302–309. [Google Scholar]
- Adams, S. Tax unhealthy foods or else half will be obese by 2030. Available online: http://www.telegraph.co.uk/health/8722709/Tax-unhealthy-foods-or-half-will-be-obese-by-2030.html/ (accessed on 21 June 2013).
- Public Health England. Parks and green spaces. 2013. Available online: http://www.noo.org.uk/LA/tackling/greenspace (accessed on 6 July 2013).
- Marteau, T.; Olgivie, D.; Roland, M.; Suhrcke, M.; Kelly, M.P. Judging nudging: Can nudging improve population health? Br. Med. J. 2011, 342. Available online: http://dx.doi.org/10.1136/bmj.d228.
Appendix
| PICO Definition Population–Humans > 18 years of age overweight or obese Intervention–Mobile Devices Control–standard treatment or no intervention Outcome–Weight Loss (Kg) or (lbs.) Study Design–Randomized Controlled Trial Search Options: Limiters-Linked Full Text; References Available; Scholarly (Peer Reviewed) Journals; Population Group: Human; Publication Type: Peer Reviewed Journal; English; Language: English; Population Group: Human; Document Type: Journal Article; Publication Type: Academic Journal; Document Type: Article; Language: English Narrow by Subject Age 0: adulthood (18 years and older) Search modes: Boolean phrase Device:
Full Large Search String (1 and 2 and 3 and 4 and 5) mobile phone OR smartphone OR cellular phone AND text message* OR short message service OR SMS OR mobile device AND PDA OR personal digital assistant OR palmtop AND Weight loss OR weight control OR weight reduction AND obesity OR overweight Search Options: Limiters–Linked Full Text; References Available; Scholarly (Peer Reviewed) Journals; Population Group: Human; Publication Type: Peer Reviewed Journal; English; Language: English; Population Group: Human; Document Type: Journal Article; Publication Type: Academic Journal; Document Type: Article; Language: English Narrow by Subject Age 0: adulthood (18 years and older) Search modes : Boolean/Phrase Results (N = 1162) Databases searched: PsychInfo (N = 1126) PyschArticles (N = 456) Library Information Science and Technology Abstracts (N = 57) |
© 2014 by the authors; licensee MDPI, Basel, Switzerland. This article is an open access article distributed under the terms and conditions of the Creative Commons Attribution license (http://creativecommons.org/licenses/by/3.0/).
Share and Cite
Lyzwinski, L.N. A Systematic Review and Meta-Analysis of Mobile Devices and Weight Loss with an Intervention Content Analysis. J. Pers. Med. 2014, 4, 311-385. https://doi.org/10.3390/jpm4030311
Lyzwinski LN. A Systematic Review and Meta-Analysis of Mobile Devices and Weight Loss with an Intervention Content Analysis. Journal of Personalized Medicine. 2014; 4(3):311-385. https://doi.org/10.3390/jpm4030311
Chicago/Turabian StyleLyzwinski, Lynnette Nathalie. 2014. "A Systematic Review and Meta-Analysis of Mobile Devices and Weight Loss with an Intervention Content Analysis" Journal of Personalized Medicine 4, no. 3: 311-385. https://doi.org/10.3390/jpm4030311
APA StyleLyzwinski, L. N. (2014). A Systematic Review and Meta-Analysis of Mobile Devices and Weight Loss with an Intervention Content Analysis. Journal of Personalized Medicine, 4(3), 311-385. https://doi.org/10.3390/jpm4030311