Impact of Information Technology on the Therapy of Type-1 Diabetes: A Case Study of Children and Adolescents in Germany

Abstract
:1. Introduction
2. Experimental
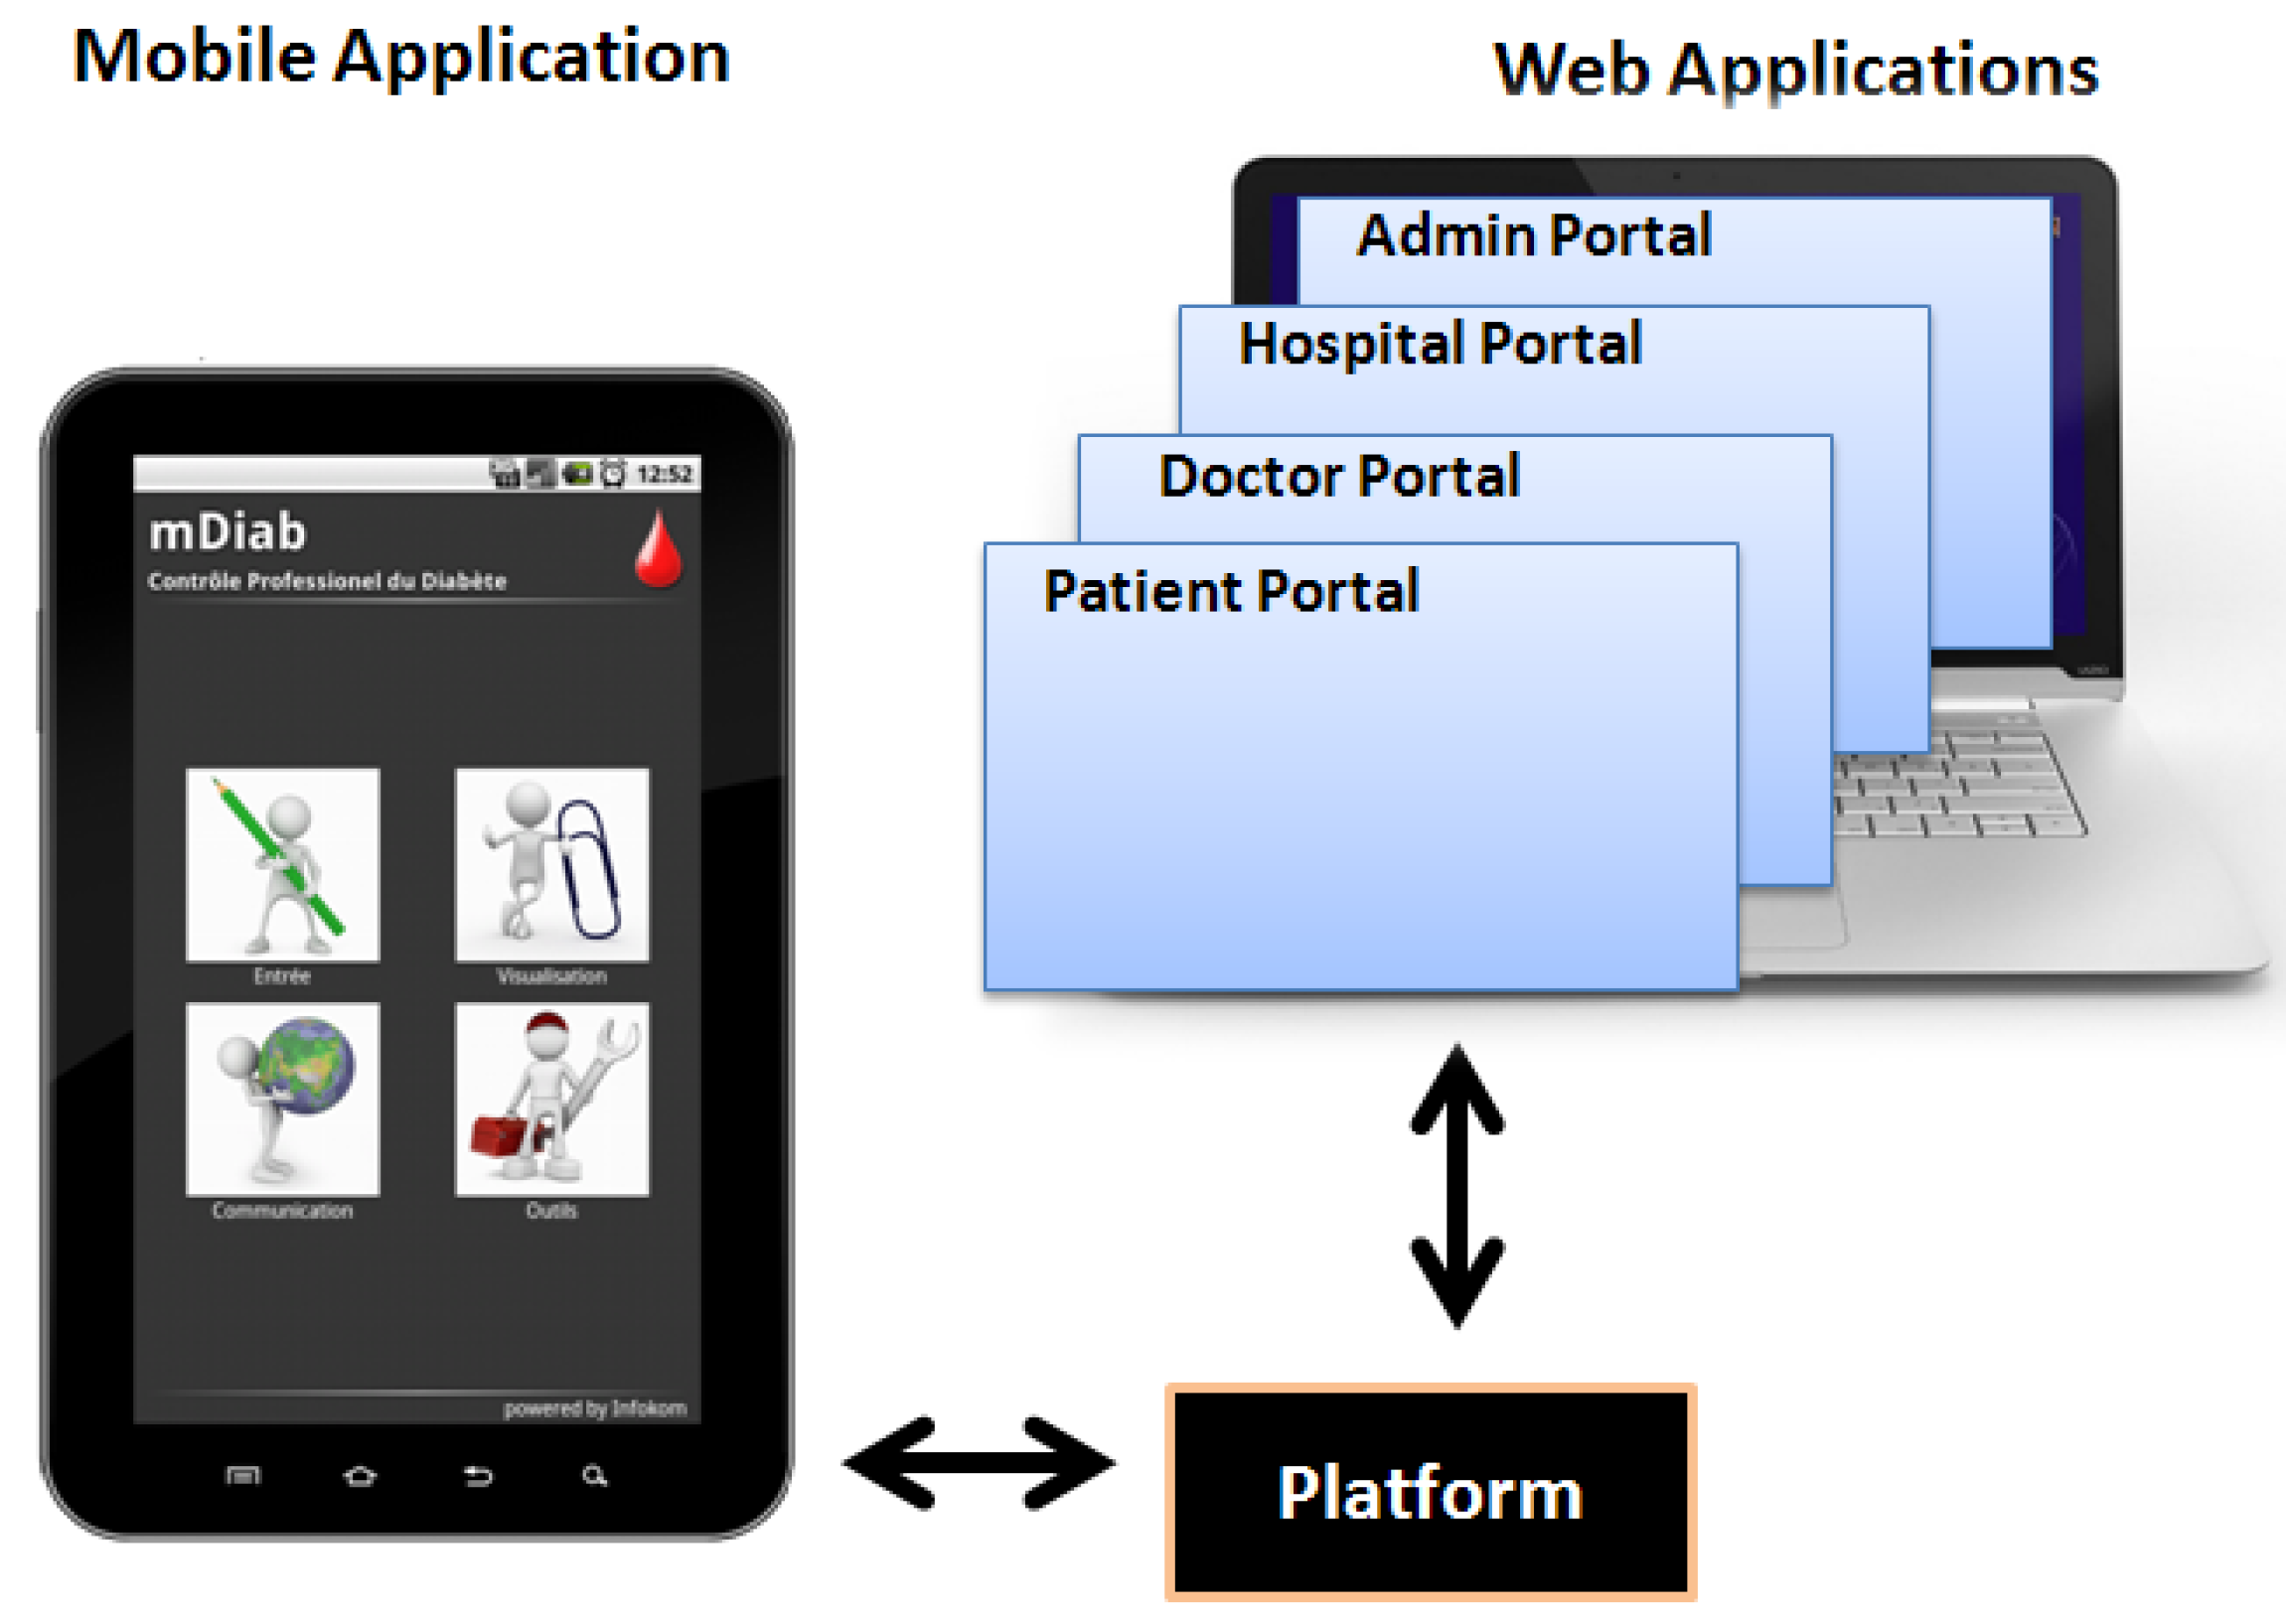
2.1. “Mobil Diab” System

2.2. Web-Based Applications of “Mobil Diab”
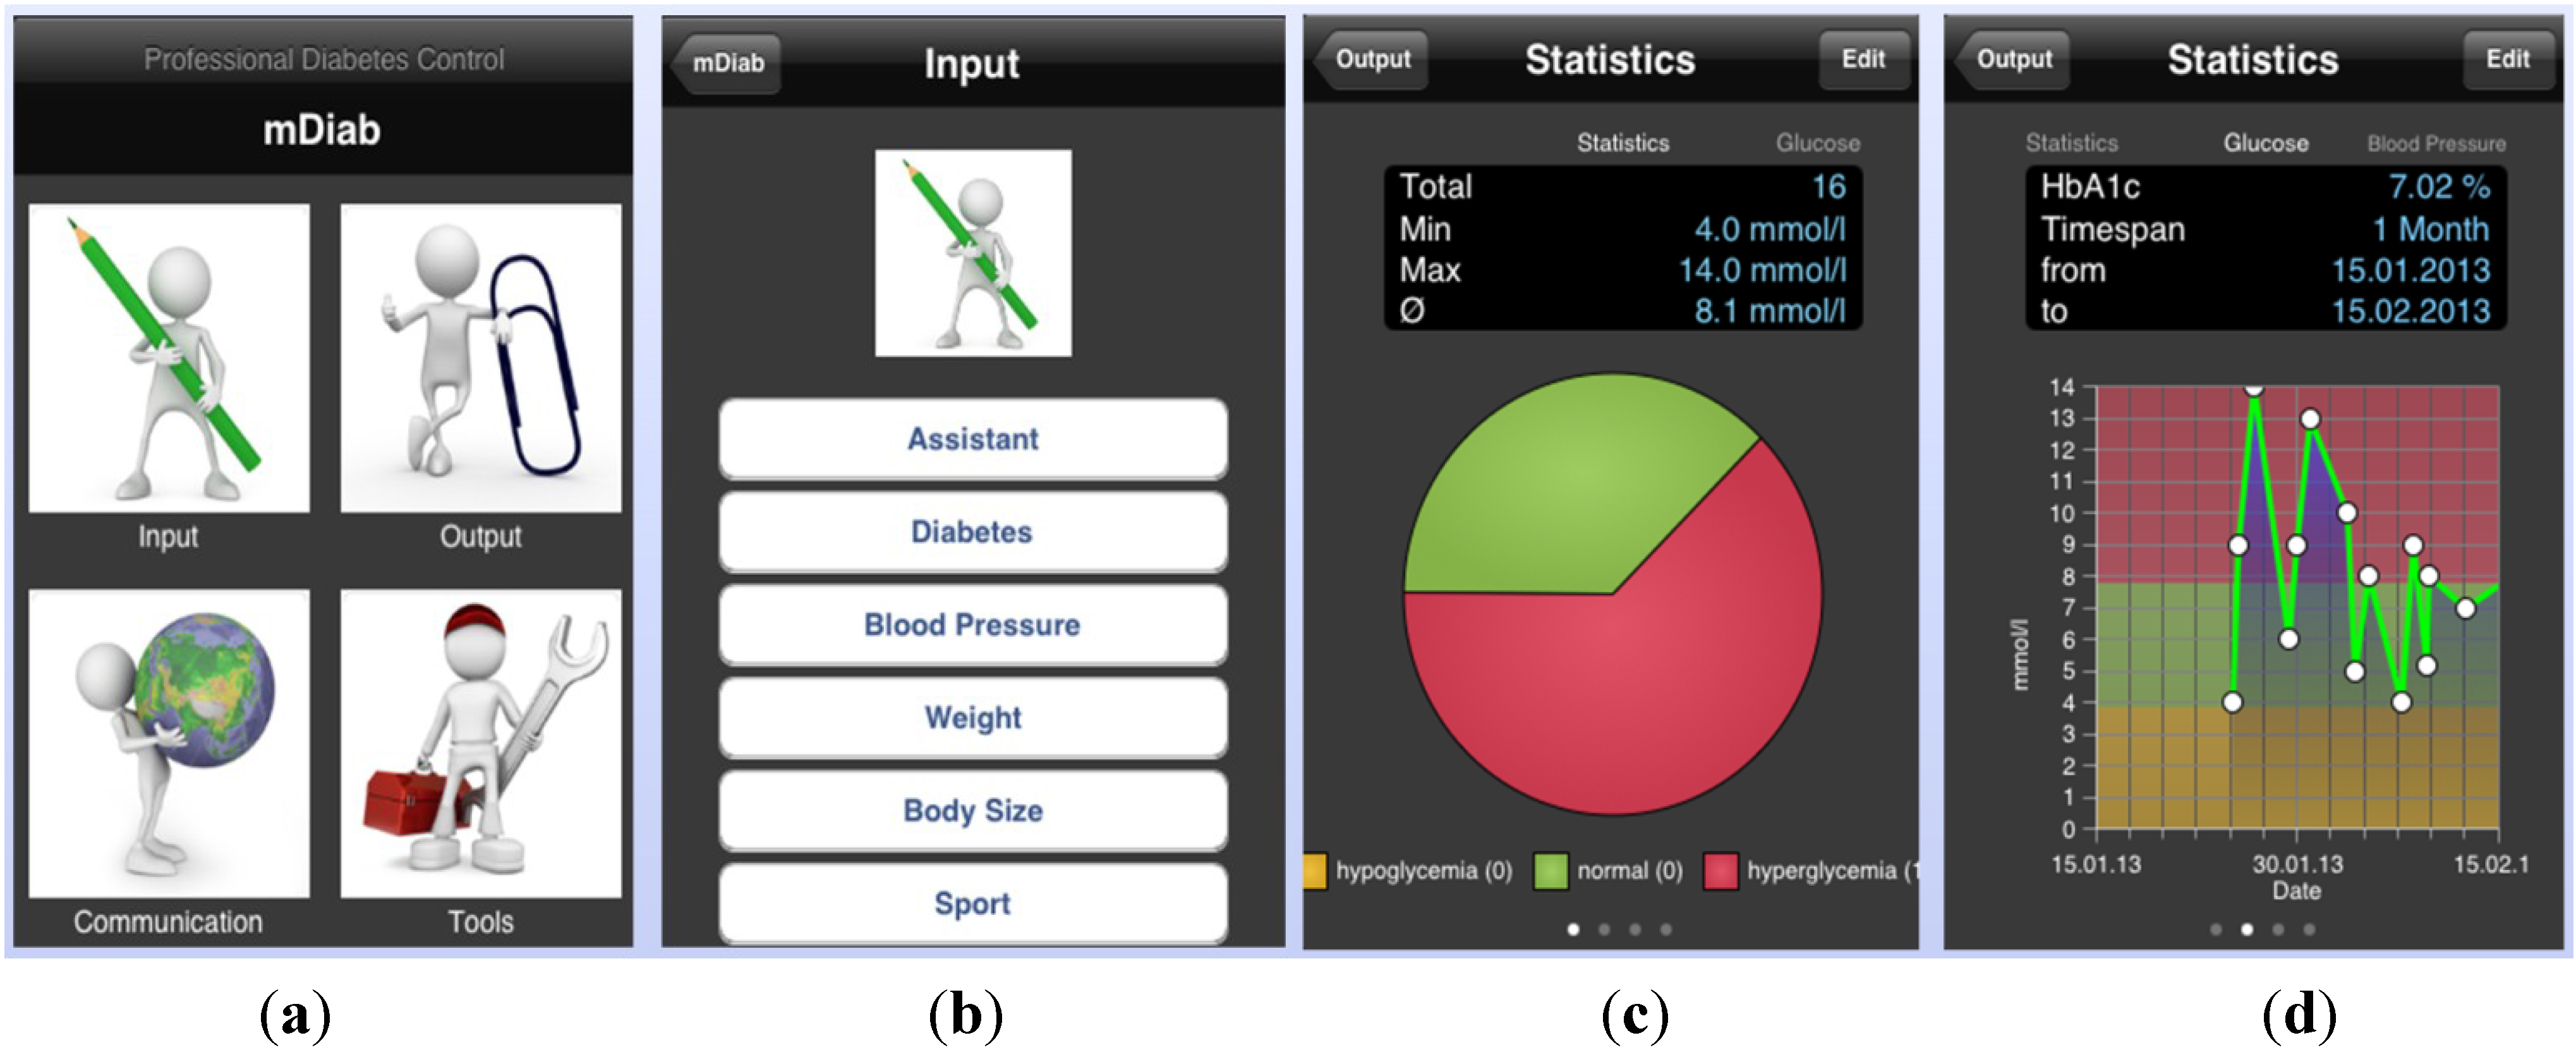
2.3. Mobile Application of “Mobil Diab”

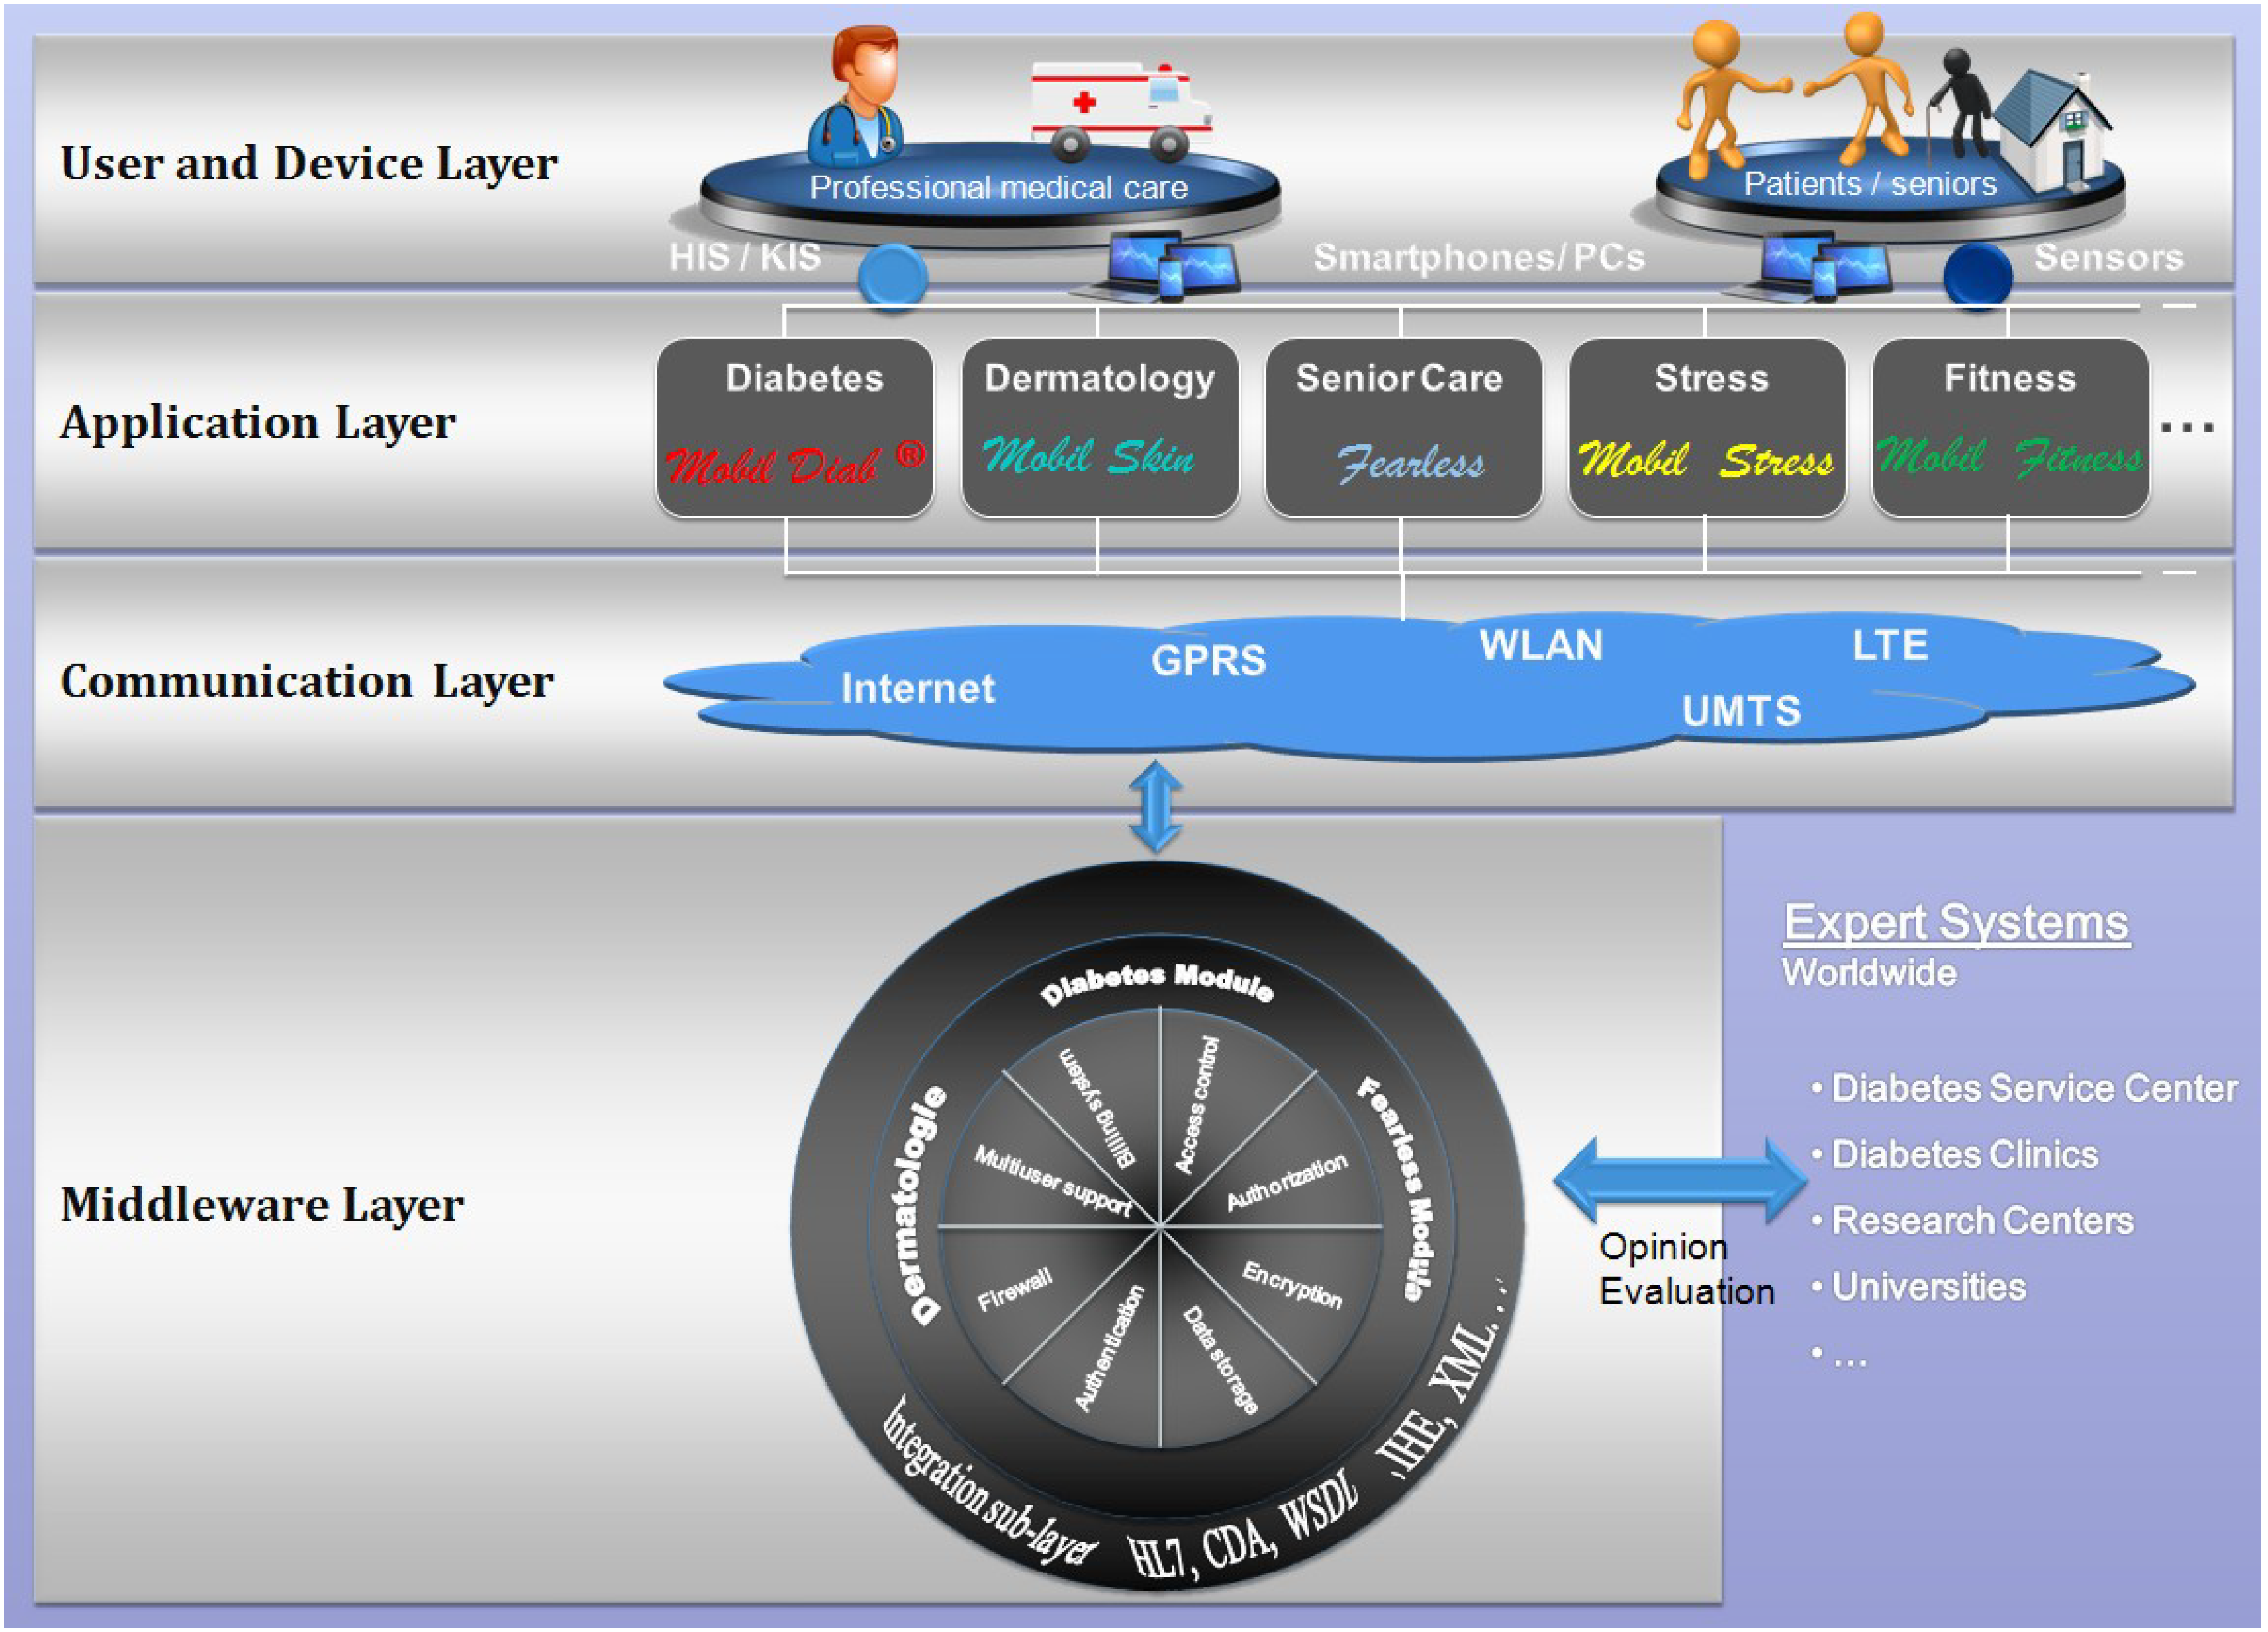
2.4. Architecture of the “Mobil Diab” Platform
- Authentication: methods and mechanisms which allow an entity to prove its identity to a remote end.
- Authorization: access control mechanisms and the ability of an entity to access shared resources.
- Data integrity: mechanisms which ensure that when there is an interchange of data between two peer entities, the received data and the original ones are the same, and that no intermediate alteration has occurred.
- Data confidentiality: it assures that stored or transmitted data are well protected from possible disclosure. A means used to achieve data confidentiality is through cryptographic mechanisms.
- Privacy: which can be defined as an entity’s ability to control how, when, and to what extent personal information about the entity will be communicated to third parties.
- Secure data communication and storage.
- Data availability: data can be accessed by authorized users irrespective of time and location.

2.5. Ethical Approval for the Study
2.6. Inclusion/Exclusion Criteria for Subject Enrollment/Randomization

| Parameter | Control group Mean ± SD | Intervention group Mean ± SD | p-value |
|---|---|---|---|
| Number (n) | 34 | 34 | / |
| Females (n/%) | 14 (44%) | 13 (38%) | 0.63 |
| Age (year) | 13.2 ± 2.9 | 12.9 ± 2.0 | 0.56 |
| Body height (m) | 1.57 ± 0.15 | 1.62 ± 0.15 | 0.19 |
| Body weight (kg) at the beginning | 53.8 ± 13.9 | 53.7 ± 15.6 | 0.99 |
| Body weight (kg) at the end | 54.7 ± 14.3 | 53.5 ± 15.5 | 0.75 |
| Body-mass Index (BMI) (kg/m2) at the beginning | 21.8 ± 5.2 | 20.2 ± 3.5 | 0.14 |
| Body-mass Index (BMI) (kg/m2) at the end | 22.2 ± 5.7 | 20.1 ± 3.5 | 0.07 |
| Diabetes duration (years) | 5.3 ± 4.0 | 5.0 ± 3.7 | 0.75 |
| Blood sugar at empty stomach during the day at the beginning (mmol/L) | 8.3 ± 3.7 | 7.6 ± 3.2 | 0.38 |
| Mean of blood glucose excursions during the first 3 days at beginning (mmol/L) | 10.7 ± 3.4 | 8.3 ± 3.2 | 0.003 |
| Mean of blood glucose excursions during the last 3 days before the end (mmol/L) | 9.6 ± 3.5 | 8.5 ± 2.7 | 0.16 |
| Patient with at least one insulin analog (n/%) | 11 (32%) | 9 (27%) | 0.33 |
| Number of (n) blood glucose self-tests per week | 34.1 ± 8.6 | 36.2 ± 10.1 | 0.37 |
| Strategy of the insulin therapy at the beginning (n/%): | 0.60 | ||
| Strategy of the insulin therapy at the end (n/%): | 1.0 | ||
| HbA1c (%) at the beginning | 9.0 ± 2.2 | 8.8 ± 1.7 | 0.81 |
| HbA1c (%) at the end | 8.0 ± 1.3 | 8.1 ± 1.1 | 0.65 |
| Insulin dose (I.U.) at the beginning | 47.3 ± 18.3 | 45.5 ± 24.2 | 0.73 |
| Insulin dose per kg body weight (I.U./kg body weight) at the beginning | 0.89 ± 0.33 | 0.86 ± 0.44 | 0.74 |
| Insulin dose (I.U.) at the end | 46.3 ± 17.8 | 47.0 ± 24.4 | 0.89 |
| Insulin dose per kg body weight (I.U./kg body weight) at the end | 0.88 ± 0.32 | 0.86 ± 0.44 | 0.91 |
| Number of all hypoglycemic episodes during the last month (n)* | 12 (Range, 0-60) | 8 (Range, 0-52) | 0.24 |
| Number of patients with at least one hypoglycemic episode during the last month (n) | 33 | 30 | 0.23 |
| Number of severe hypoglycemic episodes requiring help during the last month (n) * | 0 | 0 | 0.32 |
| Number of patients with at least one severe hypoglycemic episode requiring help during the last month (n) | 1 | 0 | 0.33 |
| Number of severe hypoglycemic episodes with loss of consciousness during the last month (n) * | 1 | 0 | 0.32 |
| Number of patients with at least one severe hypoglycemic episode with loss of consciousness during the last month (n) * | 1 | 0 | 0.32 |
| Number of ketoacidosis with hospital admission during the last month (n) * | 0 | 0 | 1.0 |
| Diabetes-related knowledge (points) | 17.9 ± 4.0 | 17.9 ± 3.6 | 0.95 |
| Blood pressure systolic (mmHg) | 109.6 ± 12.2 | 107.9 ± 11.8 | 0.58 |
| Blood pressure diastolic (mmHg) | 68.6 ± 9.3 | 65.9 ± 9.3 | 0.25 |
2.7. Experimental Settings
- Q1: How often could you successfully use the system?
- Q2: How easy was it for you to cope with the application?
- Q3: How do you evaluate the input options and design of the application?
- Q4: How do you evaluate the output options and visualization possibilities?
- Q5: How do you evaluate the design of the application?
- Q6: Do you find the system as a tool which motivates you in the control of your diabetes?
- Q7: Did feedbacks (messages, therapy) from doctors help in the diabetes management process?
- Q8: Would you wish to continue using Mobil Diab® for managing your diabetes?
- Q9: Would you recommend the system to other users?
| Control group | Intervention group | |||||||
|---|---|---|---|---|---|---|---|---|
| Parameter | At the beginning of the study Mean ± SD | At the end of the study Mean ± SD | Difference Δ Range Variance | p-value | At the beginning of the study Mean ± SD | At the end of the study Mean ± SD | Difference Δ Range Variance | p-value |
| Number (n) | 34 | 34 | / | / | 34 | 34 | / | / |
| Body weight (kg) | 53.8 ± 13.9 | 54.7 ± 14.3 | 0.91 ± 2.40 10.6 5.7 | 0.035 | 53.7 ± 15.6 | 53.5 ± 15.5 | −0.19 ± 1.59 7.3 2.5 | 0.501 |
| Body-mass Index (BMI) (kg/m2) | 21.8 ± 5.2 | 22.2 ± 5.7 | 0.40 ± 1.04 4.6 1.1 | 0.033 | 20.2 ± 3.7 | 20.1 ± 3.5 | −0.09 ± 0.58 2.6 0.3 | 0.379 |
| Mean amplitude of blood glucose excursions (mmol/L) | 10.7 ± 3.4 | 9.6 ± 3.5 | −1.12 ± 4.23 18.9 17.9 | 0.132 | 8.3 ± 3.2 | 8.5 ± 2.7 | 0.29 ± 3.03 14.9 9.2 | 0.580 |
| HbA1c (%) | 8.96 ± 2.23 | 7.99 ± 1.26 | −0.98 ± 1.45 7.7 2.2 | 0.001 | 8.84±1.71 | 8.12±1.10 | −0.72±1.48 6.0 1.2 | <0.001 |
| Insulin dose (I.U.) | 47.3±18.3 | 46.3±17.8 | −0.99±10.37 41.5 107.5 | 0.581 | 45.5±24.2 | 47.0 ± 24.4 | 1.57 ± 15.84 88.5 251.1 | 0.646 |
| Insulin dose per kg body weight (I.U./kg body weight) | 0.89 ± 0.33 | 0.88 ± 0.32 | −0.02 ± 0.04 0.16 0.001 | 0.008 | 0.86 ± 0.44 | 0.87 ± 0.44 | 0.002 ± 0.03 0.18 0.001 | 0.566 |
| Control group | Intervention group | |||||||
|---|---|---|---|---|---|---|---|---|
| Parameter | At the beginning of the study Mean ± SD | At the end of the study Mean ± SD | Difference Δ Range Variance | p-value | At the beginning of the study Mean ± SD | At the end of the study Mean ± SD | Difference Δ Range Variance | p-value |
| Number (n) | 34 | 34 | / | / | 34 | 34 | / | / |
| Quality of life–Impact | 1.89 ± 0.35 | 1.97 ± 0.47 | 0.08 ± 0.48 2.6 0.2 | 0.308 | 2.09 ± 0.35 | 2.06 ± 0.38 | −0.04 ± 0.38 1.8 0.1 | 0.572 |
| Quality of life–Worry | 1.98 ± 0.56 | 1.99 ± 0.62 | 0.01 ± 0.42 1.9 0.2 | 0.883 | 2.14 ± 0.55 | 2.06 ± 0.53 | −0.05 ± 0.43 1.8 0.2 | 0.476 |
| Quality of life–Treatment satisfaction | 3.25 ± 0.68 | 3.46 ± 0.43 | 0.21 ± 0.64 3.7 0.4 | 0.059 | 3.14 ± 0.44 | 3.18 ± 0.78 | 0.04 ± 0.72 4.1 0.5 | 0.764 |
| Quality of life–Life satisfaction | 3.70 ± 0.74 | 3.80 ± 0.62 | 0.10 ± 0.64 3.9 0.4 | 0.384 | 3.84 ± 0.43 | 3.64 ± 0.83 | −0.20 ± 0.98 5.1 1.0 | 0.241 |
| Diabetes Self-Efficacy Scale | 7.22 ± 1.64 | 7.65 ± 1.24 | 0.43 ± 1.67 9.4 2.8 | 0.143 | 7.54 ± 0.85 | 8.04 ± 1.22 | 0.49 ± 1.30 5.0 1.7 | 0.035 |
| Assessment | |
|---|---|
| “very good” (1.0) | n = 6 (17%) |
| “good” (2.0) | n = 14 (41%) |
| “average” (3.0) | n = 5 (15%) |
| “not good” (4.0) | n = 5 (15%) |
| missing entries from | n = 4 (12%) |
3. Results
3.1. Comparison Control vs. Intervention Group
3.2. Changes in the Quality of Metabolic Control and Psychological Parameters
3.3. Usability and Acceptance of “Mobil Diab”
- Benefits for the patients include among others: unimpeded patient mobility, data input via smart phones and/or via web, regular self-control of diabetes-related data enables the right care to be administrated at the right time, potential to improve care process and quality of service, improvement of patients’ motivation through their involvement in the therapy process, reduced check-up frequency to doctors, use of mobile health technologies encourages diabetes patients to change their behavior/lifestyle and improve their health.
- Benefits for the health care staff involves among others the following: complete and regular data input, which is helpful for individual therapy plan, minimization of errors caused by lack of information about the disease history, improvement of the care process quality, getting specialist opinions, access to patients’ data worldwide independent from time and location, automatic alarm message in case of critical data from a patient.
- Benefits for the health system include among others the following: delay and reduce diabetes complications, minimize hospitalization rates due to diabetes complications, reduce death rates from diabetes, speed up the transition of patients from hospitals to their own homes which leads to a reduction in costs, enable the organization of health information through a structured gathering of all relevant data in one central place.
- Patients and medical staff were satisfied with the security features implemented to the system. Access to the web and mobile applications was secured by an individual password. Authorization and access to different sectors of the data was determined by the category of the user. A member of the medical staff could only coach and see patients who were allocated to him.
- A single drawback according to the users was the fact that internet connection is needed for data transfer from mobile devices to the central platform. But this was not critical, since data can be recorded several days offline and be sent when a connection is available.
4. Discussions
5. Conclusions
Author Contributions
Conflicts of Interest
References
- Lim, S.; Kang, S.M.; Shin, H.; Lee, H.J.; Won Yoon, J.; Yu, S.H.; Kim, S.Y.; Yoo, S.Y.; Jung, S.H.; Park, K.S.; et al. Improved glycemic control without hypoglycemia in elderly diabetic patients using the ubiquitous healthcare service, a new medical information system. Diabetes Care 2011, 34, 308–313. [Google Scholar] [CrossRef]
- Lyles, C.R.; Harris, L.T.; Le, T.; Flowers, J.; Tufano, J.; Britt, D.; Hoath, J.; Hirsch, I.B.; Goldberg, H.I.; Ralston, J.D. Qualitative evaluation of a mobile phone and web-based collaborative care intervention for patients with type-2 diabetes. Diabetes Technol. Ther. 2011, 13, 563–569. [Google Scholar] [CrossRef]
- Tatara, N.; Arsand, E.; Nilsen, H.; Hartvigsen, G. A review of mobile terminal-based applications for self-management of patients with diabetes. In Proceedings of the Conference on eHealth, Telemedicine, and Social Medicine, 2009, Cancun, Mexico, 1–7 February 2009; pp. 166–175.
- Kouris, I.; Mougiakakou, S.; Scarnato, L.; Iliopoulou, D.; Diem, P.; Vazeou, A.; Koutsouris, D. Mobile phone technologies and advanced data analysis towards the enhancement of diabetes self-management. Int. J. Electron. Healthc. 2010, 5, 386–402. [Google Scholar] [CrossRef]
- Ramadas, A.; Quek, K.F.; Chan, C.K.; Oldenburg, B. Web-based interventions for the management of type-2 diabetes mellitus: A systematic review of recent evidence. Int. J. Med. Inform. 2011, 80, 389–405. [Google Scholar] [CrossRef]
- Raiff, B.R.; Dallery, J. Internet-based contingency management to improve adherence with blood glucose testing recommendations for teens with type-1 diabetes. J. Appl. Behav. Anal. 2010, 43, 487–491. [Google Scholar] [CrossRef]
- Årsand, E.; Tatara, N.; Østengen, G.; Hartvigsen, G. Wireless and Mobile Technologies Improving Diabetes Self-Management: Handbook of Research on Mobility and Computing: Evolving Technologies and Ubiquitous Impacts; IGI Global: Hershey, PA, USA, 2011. [Google Scholar]
- Clar, C.; Barnard, K.; Cummins, E.; Royle, P.; Waugh, N. Self-monitoring of blood glucose in type-2 diabetes: Systematic review. Health Technol. Assess. 2010, 14, 1–140. [Google Scholar]
- Lim, S.; Kim, S.Y.; Kim, J.I.; Kwon, M.K.; Min, S.J.; Yoo, S.Y.; Kang, S.M.; Kim, H.I.; Jung, H.S.; Parket, K.S.; et al. A survey on ubiquitous healthcare service demand among diabetic patients. Diabetes Metab. J. 2011, 35, 50–57. [Google Scholar] [CrossRef]
- Liang, X.; Wang, Q.; Yang, X.; Cao, J.; Chen, J.; Mo, X.; Huang, J.; Wang, L.; Gu, D. Effect of mobile phone intervention for diabetes on glycaemic control: A meta-analysis. Diabet. Med. 2011, 28, 455–463. [Google Scholar] [CrossRef]
- Giménez-Pérez, G.; Gallach, M.; Acera, E.; Prieto, A.; Carro, O.; Ortega, E.; González-Clemente, J.M.; Mauricio, D. Evaluation of accessibility and use of new communication technologies in patients with type-1 diabetes mellitus. J. Med. Internet Res. 2002, 4, E16. [Google Scholar] [CrossRef]
- Smith, J.C.; Schatz, B.R. Feasibility of mobile phone-based management of chronic illness. AMIA Annu. Symp. Proc. 2010, 2010, 757–761. [Google Scholar]
- Kollmann, A.; Riedl, M.; Kastner, P.; Schreier, G.; Ludvik, B. Feasibility of a mobile phone-based data service for functional insulin treatment of type-1 diabetes mellitus patients. J. Med. Internet Res. 2007, 9, e36. [Google Scholar]
- Avdal, E.U.; Kizilci, S.; Demirel, N. The effects of web-based diabetes education on diabetes care results: A randomized control study. Comput. Inform. Nurs. 2011, 29, TC29–TC34. [Google Scholar]
- Farmer, A.J.; Gibson, O.J.; Dudley, C.; Bryden, K.; Hayton, P.M.; Tarassenko, L.; Neil, A. A randomized controlled trial of the effect of real-time telemedicine support on glycemic control in young adults with type-1 diabetes (ISRCTN 46889446). Diabetes Care 2005, 28, 2697–2702. [Google Scholar] [CrossRef]
- Seto, E.; Istepanian, R.S.; Cafazzo, J.A.; Logan, A.; Sungoor, A. UK and Canadian perspectives of the effectiveness of mobile diabetes management systems. Conf. Proc. IEEE Eng. Med. Biol. Soc. 2009, 2009, 6584–6587. [Google Scholar]
- Lutes, K.D.; Baggili, I.M. Diabetic e-management system (DEMS). In Proceedings of the IEEE Computer Society, Third International Conference on Information Technology: New Generations, Las Vegas, NV, USA, 10–12 April 2006; pp. 619–624.
- Quinn, C.C.; Gruber-Baldini, A.L.; Shardell, M.; Weed, K.; Clough, S.S.; Peeples, M.; Terrin, M.; Bronich-Hall, L.; Barr, E.; Lender, D. Mobile diabetes intervention study: Testing a personalized treatment/behavioral communication intervention for blood glucose control. Contemp. Clin. Trials 2009, 30, 334–346. [Google Scholar] [CrossRef]
- Faridi, Z.; Liberti, L.; Shuval, K.; Northrup, V.; Ali, A.; Katz, D.L. Evaluating the impact of mobile telephone technology on type-2 diabetic patients’ self-management: The NICHE pilot study. J. Eval. Clin. Pract. 2008, 14, 465–469. [Google Scholar] [CrossRef]
- Davidson, M.B. Evaluation of self monitoring of blood glucose in non-insulin-treated diabetic patients by randomized controlled trials: Little bang for the buck. Rev. Recent Clin. Trials 2010, 5, 138–142. [Google Scholar] [CrossRef]
- St. Vincent Group. Diabetes care and research in Europe. The Saint Vincent Declaration. Diabet. Med. 1990. [Google Scholar] [CrossRef]
- Schiel, R.; Sämann, A.; Kloos, C.; Müller, R.; Beltschikow, W.; Müller, U.A. Strukturierte behandlungs- und schulungsprogram für patienten mit diabetes mellitus. Historischer überblick und gegenwärtiger stand. Diab. Stoffw. 2005, 14, 207–216. [Google Scholar]
- Simmons, J.H.; Chen, V.; Miller, K.M.; McGill, J.B.; Bergenstal, R.M.; Goland, R.S.; Harlan, D.M.; Largay, J.F.; Massaro, E.M.; Beck, R.W. Differences in the management of type-1 diabetes among adults under excellent control compared with those under poor control in the T1D exchange clinic registry. Diabet. Care 2013. [Google Scholar] [CrossRef]
- Matthaei, S.; Bierwirth, R.; Fritsche, A.; Gallwitz, B.; Häring, H.U.; Kellerer, M.; Kloos, C.; Kunt, T.; Nauck, M.; Schernthaner, G.; et al. Behandlung des Diabetes mellitus Typ 2. Diabetologie 2011, 6, S131–S136. [Google Scholar] [CrossRef]
- Neu, A.; Beyer, P.; Bürger-Büsing, J.; Danne, T.; Etspüller, J.; Heidtmann, B.; Holl, R.W.; Karges, B.; Kiess, W.; Knerr, I.; et al. Therapie und Verlaufskontrolle des Diabetes melitus im Kindes- und Jugendalter. Diabetologie 2012, 7, 152–162. [Google Scholar] [CrossRef]
- Nolte, E.; McKee, M. Caring for People with Chronic Conditions: A Health System Perspective. World Health Organization on Behalf of the European Observatory on HealthSystems and Policies; Open University Press: New York, NY, USA, 2008. [Google Scholar]
- Gesundheitsberichterstattung des Bundes. Available online: http://www.gbe-bund.de/ (accessed on 14 December 2013).
- DesRoches, C.M.; Campbell, E.G.; Rao, S.R.; Donelan, K.; Ferris, T.G.; Jha, A.; Kaushal, R.; Levy, D.E.; Rosenbaum, S.; Shields, A.E.; et al. Electronic health records in ambulatory care—A national survey of physicians. N. Engl. J. Med. 2008, 359, 50–60. [Google Scholar] [CrossRef]
- Shekelle, P.G.; Morton, S.C.; Keeler, E.B. Costs and Benefits of Health Information Technology. In Evidence Report/Technology Assessment No. 06-E006; Southern California Evidence-based Practice Center: Santa Monica, CA, USA, 2006; Volume 132, pp. 1–71. [Google Scholar]
- Deutsche Ärzteblatt. (Editorial. 2011c). Available online: http://www.aerzteblatt.de/ (accessed on 10 December 2013).
- Schiel, R.; Kaps, A.; Bieber, G.; Kramer, G.; Seebach, H.; Hoffmeyer, A. Identification of determinants for weight reduction in overweight and obese children and adolescents. J. Telemed. Telecare 2010, 16, 368–373. [Google Scholar] [CrossRef]
- Schiel, R.; Kaps, A.; Bieber, G. Electronic health technology for the assessment of physical activity and eating habits in children and adolescents with overweight and obesity. IDA = Identification of determinants for obesity (Adipositas). Appetite 2012, 58, 432–437. [Google Scholar] [CrossRef]
- Telemedicine System Especially for Chronic Diseases. WIPO Patent WO/2008/043341, 17 April 2008.
- Berndt, R.-D.; Takenga, M.C.; Kuehn, S.; Preik, P.; Sommer, G.; Berndt, S. SaaS-platform for mobile health applications. In Proceedings of the 9th International Multi-Conference on Systems, Signals and Devices (SSD), Chemniz, Germany, 20–23 March 2012; pp. 1–4.
- Statistical Analysis Program G-Power 3. Available online: http://www.psycho.uni-duesseldorf.de/abteilungen/aap/gpower3 (accessed on 31 March 2010).
- Ingersoll, G.M.; Marrero, D.G. A modified quality-of-life measure for youths: Psychometric properties. Diabetes Educ. 1991, 17, 114–118. [Google Scholar] [CrossRef]
- Rubin, R.; Young-Hyma, D.; Peyrot, M. Parent-child responsibility and conflict in diabetes care. Diabetes 1989, 38, 7A. [Google Scholar]
- Jerusalem, M.; Schwarzer, R. (1981, rev. 1999): Allgemeine Selbstwirksamkeit. Available online: http://userpage.fuberlin.de/~gesund/skalen/Allgemeine_Selbstwirksamkeit/hauptteil_allgemeine_selbstwirksamkeit.htm (accessed on 28 July 2013).
- Stanford Patient Education Research Center: Diabetes self-efficacyscale. Available online: http://patienteducation.stanford.edu/research/sediabetes.html (accessed on 28 July 2013).
- Achenbach, T. Manual for the Child Behavior Checklist/4–18 and 1991Profile; University of Vermont: Burlington, VT, USA, 1991. [Google Scholar]
- CFT 20-R. Grundintelligenztest Skala 2; Revision 1; Auflage; Hogrefe: Göttingen, Lower Saxony, Germany, 2006. [Google Scholar]
© 2014 by the authors; licensee MDPI, Basel, Switzerland. This article is an open access article distributed under the terms and conditions of the Creative Commons Attribution license (http://creativecommons.org/licenses/by/3.0/).
Share and Cite
Berndt, R.-D.; Takenga, C.; Preik, P.; Kuehn, S.; Berndt, L.; Mayer, H.; Kaps, A.; Schiel, R. Impact of Information Technology on the Therapy of Type-1 Diabetes: A Case Study of Children and Adolescents in Germany. J. Pers. Med. 2014, 4, 200-217. https://doi.org/10.3390/jpm4020200
Berndt R-D, Takenga C, Preik P, Kuehn S, Berndt L, Mayer H, Kaps A, Schiel R. Impact of Information Technology on the Therapy of Type-1 Diabetes: A Case Study of Children and Adolescents in Germany. Journal of Personalized Medicine. 2014; 4(2):200-217. https://doi.org/10.3390/jpm4020200
Chicago/Turabian StyleBerndt, Rolf-Dietrich, Claude Takenga, Petra Preik, Sebastian Kuehn, Luise Berndt, Herbert Mayer, Alexander Kaps, and Ralf Schiel. 2014. "Impact of Information Technology on the Therapy of Type-1 Diabetes: A Case Study of Children and Adolescents in Germany" Journal of Personalized Medicine 4, no. 2: 200-217. https://doi.org/10.3390/jpm4020200
APA StyleBerndt, R.-D., Takenga, C., Preik, P., Kuehn, S., Berndt, L., Mayer, H., Kaps, A., & Schiel, R. (2014). Impact of Information Technology on the Therapy of Type-1 Diabetes: A Case Study of Children and Adolescents in Germany. Journal of Personalized Medicine, 4(2), 200-217. https://doi.org/10.3390/jpm4020200