Systematic Review

Single-Nucleotide Polymorphisms Related to Glioblastoma Risk and Worldwide Epidemiology: A Systematic Review and Meta-Analysis

by
Giovanna Gilioli da Costa Nunes
1,2,*,
Francisco Cezar Aquino de Moraes
1,2,
Rita de Cássia Calderaro Coelho
1,
Marianne Rodrigues Fernandes
1,
Sidney Emanuel Batista dos Santos
3 and
Ney Pereira Carneiro dos Santos
1
1
Research Center of Oncology, Federal University of Pará Belém, Belém 66073-000, Brazil
2
Faculty of Medicine, Federal University of Pará Belém, Belém 66073-000, Brazil
3
Laboratory of Human and Medical Genetics, Institute of Biological Science, Federal University of Pará, Belém 66077-830, Brazil
*
Author to whom correspondence should be addressed.
J. Pers. Med. 2025, 15(9), 401; https://doi.org/10.3390/jpm15090401 (registering DOI)
Submission received: 1 November 2024 / Revised: 20 November 2024 / Accepted: 25 November 2024 / Published: 1 September 2025
(This article belongs to the Section Disease Biomarker)

Abstract

Background/Objectives: Glioblastomas are a part of adult-type diffuse gliomas, the most common and most aggressive primary brain tumors in adults (glioblastoma, IDH-wildtype). The identification of the genetic factors associated with glioblastoma could be an important contribution to the diagnosis and early prevention of this disease. We compiled data from the global literature and analyzed clinically relevant variants implicated in glioblastoma risk. Methods: PubMed, Web of Science, and Scopus were used as databases. Associations between the SNPs and glioblastoma risk were calculated as a measure of pooled odds ratios (ORs) and 95% confidence intervals. Pearson’s analysis was used for epidemiological correlation (only p-values less than 0.05 were statistically significant), and data were obtained from the World Health Organization platform and the 1000 Genomes Project. Statistical analysis was performed using Review Manager (RevMan) 5.4 and BioEstat 5.0. Results: CCDC26 rs891835 G/T, G/G, and G/T-G/G genotypes were analyzed and determined to increase glioblastoma risk (G/T OR = 1.96, 95% CI: 1.38–2.77, p = 0.0002, I2 = 0%; G/G OR = 1.33, 95% CI: 0.46–3.85, p = 0.60, I2 = 0%; G/T − G/G OR = 1.96, 95% CI: 1.39–2.76, p = 0.0001, I2 = 0%). Epidemiological correlation also demonstrated that the higher the frequency of the CCDC26 rs891835 variant, the higher the incidence of that variant in the European population. Conclusions: CCDC26 rs891835 may serve as a predictive biomarker for glioblastoma, IDH-wildtype risk and may influence higher glioblastoma incidence rates in the European population.

Graphical Abstract

1. Introduction

Brain tumors represent a diverse group of neoplasms, encompassing over 50 distinct entities. The fifth edition of the WHO Classification of Tumors of the Central Nervous System (WHO CNS5) categorizes gliomas, glioneuronal tumors, and neuronal tumors into six families. Among these, adult-type diffuse gliomas are the most prevalent and aggressive primary brain tumors in adults, with glioblastoma, IDH-wildtype being a notable example. A significant advancement in the latest update of the WHO CNS tumor classification is the incorporation of molecular findings into the diagnostic framework for adult-type diffuse gliomas, moving beyond sole reliance on morphological characteristics and integrating specific genetic modifiers [1].
Glioblastoma, IDH-wildtype (GBM), arises from astrocytic glial cells and represents the highest-grade malignant glioma. The average annual age-adjusted incidence rate for all primary brain tumors is approximately 24.25 per 100,000, with malignant tumors at 6.94 and non-malignant tumors at 17.88 [2]. These tumors are typically associated with a dismal prognosis and poor quality of life. This disease is most common in individuals aged 65 years and older, with factors such as extensive necrosis and MGMT promoter methylation status—primarily linked to predicting therapeutic response—playing significant roles [3].
Previous investigations have demonstrated that factors such as familial cancer history, which accounts for approximately 5% of cases, serve as risk factors for glioma; however, these account for only a minor proportion of glioma cases [4]. The majority of glioma cases occur in individuals without a family history of glioma; a significant genetic component, marked by the co-inheritance of several low-risk genetic variants, also contributes to the susceptibility to glioma [5].
The diagnosis of GBM is particularly challenging due to its frequent intratumoral morphological heterogeneity. Moreover, the brain's susceptibility to damage from conventional therapies makes GBM highly resistant to treatment, often resulting in a poor prognosis for patients. Many systemic cancer drugs are unable to cross the blood–brain barrier, and complete tumor resection during surgery remains difficult [6].
Identifying the genetic factors associated with GBM could significantly contribute to improving diagnosis and enabling early prevention of this disease. In this context, we focus on a comprehensive evaluation of key genes implicated in glioblastoma susceptibility, including IL-4R, CCDC26, GSTP1, AURKB, AURKC, STAT5B, CHEK2, IL-3, IL-10, PARP1, PRKDC, MLH1, ERCC2, FLT3, XRCC5, NFIL3, TP53, BRCA1, and EGFR.
The aim of this study is to compile data from the global literature and analyze clinically relevant variants and genes implicated in the heightened risk and increased susceptibility to GBM. Furthermore, the study seeks to establish correlations between these variants and the worldwide epidemiology of brain and central nervous system cancer.

2. Materials and Methods

2.1. Protocol and Registration

This systematic review followed the Preferred Reporting Items for Systematic Reviews and Meta-Analysis (PRISMA) guidelines [7]. The protocol was registered in the International Prospective Register of Systematic Reviews (PROSPERO) with registration identification CRD42024601104.

2.2. Search Strategy

A comprehensive literature search was performed to identify relevant studies published up to 11 March 2024, using the PubMed, Scopus, and Web of Science databases. The search strategy, including MeSH terms, is detailed in Table S2 of the Supplementary Material. To include additional studies, references from the selected articles and systematic reviews were also examined, and alerts were set up in each database to notify of any newly published studies matching the search criteria. Identified articles were imported into the reference management software (EndNote®, version X7, Thomson Reuters, Philadelphia, PA, USA), and duplicates were removed both automatically and manually. Titles and abstracts were independently screened by two reviewers (G.G.d.C.N. and F.C.A.d.M.), with disagreements resolved through consensus between the two reviewers and the senior author (N.P.C.S.).

2.3. Study Selection

The PECOS model (Population, Exposure, Comparator, Outcomes, and Study Design) was applied to select potential studies: P (Population), patients diagnosed with GBM (glioma IV); E (Exposure) and C (Comparator), SNPs associated with GBM risk and different genotypes; O (Outcomes), susceptibility or increased risk of developing GBM; and S (Study Design), observational studies (cohort, case-control, or cross-sectional). Exclusion criteria included conference abstracts, preprints, theses, dissertations, and studies relying on biobanks. Two reviewers (G.G.d.C.N. and F.C.A.d.M.) independently screened the titles and abstracts of the citations to identify potentially relevant studies. Full-text articles were then retrieved and reviewed independently by the same two reviewers based on the inclusion criteria, with a third reviewer (R.d.C.C.C.) resolving any disagreements or uncertainties. The screening process was conducted using Rayyan QCRI, a free web-based tool designed to support researchers in systematic reviews.

2.4. Data Extraction

The following data were extracted by three independent reviewers (G.G.d.C.N, F.C.A.d.M., and R.d.C.C.C.) using standardized sheets in Microsoft Excel, Version 2016: authors; publication year; country where the study was conducted; total number, gender, ethnicity, mean age, and mean age at diagnosis of participants with GBM; genotyping method; histologically confirmed GBM; and the authors’ main findings. Disagreements were resolved through discussion with the senior author (N.P.C.S.).

2.5. Quality Assessment

The Newcastle–Ottawa Scale (NOS) [8] was utilized to assess the methodological quality and risk of bias of the studies. This evaluation was conducted independently by two reviewers (G.G.d.C.N. and F.C.A.d.M.), with disagreements resolved through discussion with a third reviewer (R.d.C.C.C.). The NOS examines three key domains: selection, comparability, and exposure, with maximum scores of 4, 2, and 3 stars, respectively, allowing a total possible score of 9. Additionally, the quality of reporting in the included studies was evaluated using the Strengthening the Reporting of Genetic Association (STREGA) guidelines [9]. These guidelines cover five major aspects: genotyping methods and errors, population stratification, haplotype variation, Hardy–Weinberg equilibrium, and replication. The first category includes five specific items, such as genotyping platform, error and call rates, batch processing, genotyping laboratories, and the number of successfully genotyped individuals. Each study was assessed across nine items, with one point assigned per item, resulting in a score range from 0 to 9, where higher scores reflect superior genetic study quality. This assessment was performed by three independent reviewers (G.G.d.C.N., F.C.A.d.M., and R.d.C.C.C.), with any disagreements resolved by the senior author (N.P.C.S.).

2.6. Data Analysis

Statistical analyses were conducted using Review Manager (Rev Man), version 5.4.1 (The Cochrane Collaboration, Oxford, UK). Associations between the SNPs and GBM risk were calculated as a measure of pooled odds ratios (ORs) and 95% confidence intervals (CIs). We consider OR > 1 favoring increased risk of GBM and OR < 1 favoring decreased risk of GBM. Pooled OR was analyzed by the Mantel–Haenszel method (fixed-effect). The I2 range of 60–75% I2 was considered significant, indicating substantial heterogeneity. An I2 > 75% was considered to represent considerable heterogeneity.

2.7. Epidemiological Data Correlation

The incidence and mortality rates of brain and central nervous system cancers were obtained from the World Health Organization (WHO) platform, available through the Global Cancer Observatory [10]. Allele frequencies of genetic variants in continental populations were analyzed using data from the 1000 Genomes Project, specifically for Europe (EUR), Africa (AFR), East Asia (EAS), South Asia (SAS), and the Americas (AMR). The WHO population data were compared with the continental populations included in Phase 3 of the 1000 Genomes Project database (URL https://www.internationalgenome.org/, accessed on 4 October 2024). As per the Consortium of the 1000 Genomes Project, populations are grouped based on the predominant component of their ancestry. Consequently, our study correlated the epidemiological data from the WHO with the genetic data of the EUR, AFR, EAS, SAS, and AMR populations.
Pearson’s correlation was used for the brain, central nervous system cancer incidence, and allele frequencies of the variants. The data were evaluated with previously described groups, using the “cor. test” function of the “stats” package of the R programming language. Thereafter, and after passing the Bonferroni correction p-value threshold, the values of the r, r2, p-value, and 95% CI were obtained. All the plots were created using the “ggplot2” graphics package. It considered only p-value less than 0.05 (p ≤ 0.05) as statistically significant.

3. Results

3.1. Search Results

The electronic search identified 631 potentially relevant records. After removing duplicates, 489 records remained. Finally, after reviewing titles and abstracts, twelve articles were selected for full-text examination. Of these, only four met the inclusion criteria for the review (Jin Tian-Bo et al., 2013; Wei et al., 2014; Schwartzbaum et al., 2005; Li Bin et al., 2017) [11,12,13,14]. No relevant studies were identified from the reference lists of the included studies. Figure 1 presents a flowchart of the literature search process.

3.2. Characteristics of Studies, Genes/SNPs, and Participants

The characteristics of the 12 studies are listed in Table 1. All the studies were published between 2005 and 2021. Data were collected from April 2020 to February 2022. In addition, the articles included populations from different countries; participants were from Europe (two studies), Asia (seven studies), North America (two studies), and Brazil (one study). The number of participants with GBM ranged from 72 to 1000. The predominant method used in studies for the genotyping was real-time reverse transcriptase-polymerase chain reaction. Total number of participants, number of GBM patients, gender, ethnicity, mean age and mean age at diagnosis, genotyping method, histologically confirmed GBM, and authors’ main finds were also shown in Table 1. A total of 22 SNPs related to 19 genes were collected, as shown in Table 2. Two SNPs were examined in two or more studies (IL-4R rs1801275 and CCDC26 rs891835).

3.3. Quality Assessment

The methodological quality of the 12 studies, evaluated using the Newcastle–Ottawa Scale (NOS), is presented in Table 3. Total scores ranged from four to nine stars, with the lowest score of 7 awarded to studies by Jin Tian-Bo et al. (2013), Li Bin et al. (2017), and Al-Khatib et al. (2020) [14,21,22], and the highest score of 9 given to studies by Liu et al. (2014), Custódio et al. (2010), Jin Tianbo et al. (2013), and McKean-Cowdin et al. (2009) [11,16,17,19]. All studies received a star for items 1, 2, 3, and 4 in the “selection” domain, as well as for items 1 and 2 in the “exposure” domain. The “comparability” domain, which evaluates whether confounding factors between case and control groups were identified and adjusted in the analysis, allows a maximum of two stars. Five studies achieved the maximum score in this domain. The quality of reporting, assessed using the STREGA guidelines, is summarized in Table 4. Scores ranged from four to eight points, with McKean-Cowdin et al. (2009) and Mesic et al. (2021) [15,19] obtaining the highest scores, while Schwartzbaum et al. (2005) [13] received the lowest score.

3.4. Meta-Analysis

Only four of the twelve studies were selected for meta-analyses (Jin Tian-Bo et al., 2013; Wei et al., 2014; Schwartzbaum et al., 2005; Li Bin et al., 2017) [11,12,13,14].The studies by Mesic et al. (2021), Liu et al. (2014), Custódio et al. (2010), Dong et al. (2014), McKean-Cowdin et al. (2009), Rodriguez-Hernandez et al. (2013), Jin Tian-Bo et al. (2013), and Al-Khatib et al. (2020) [15,16,17,18,19,20,21,22] were not included because the investigated SNPs were not studied by other authors (Table 2).
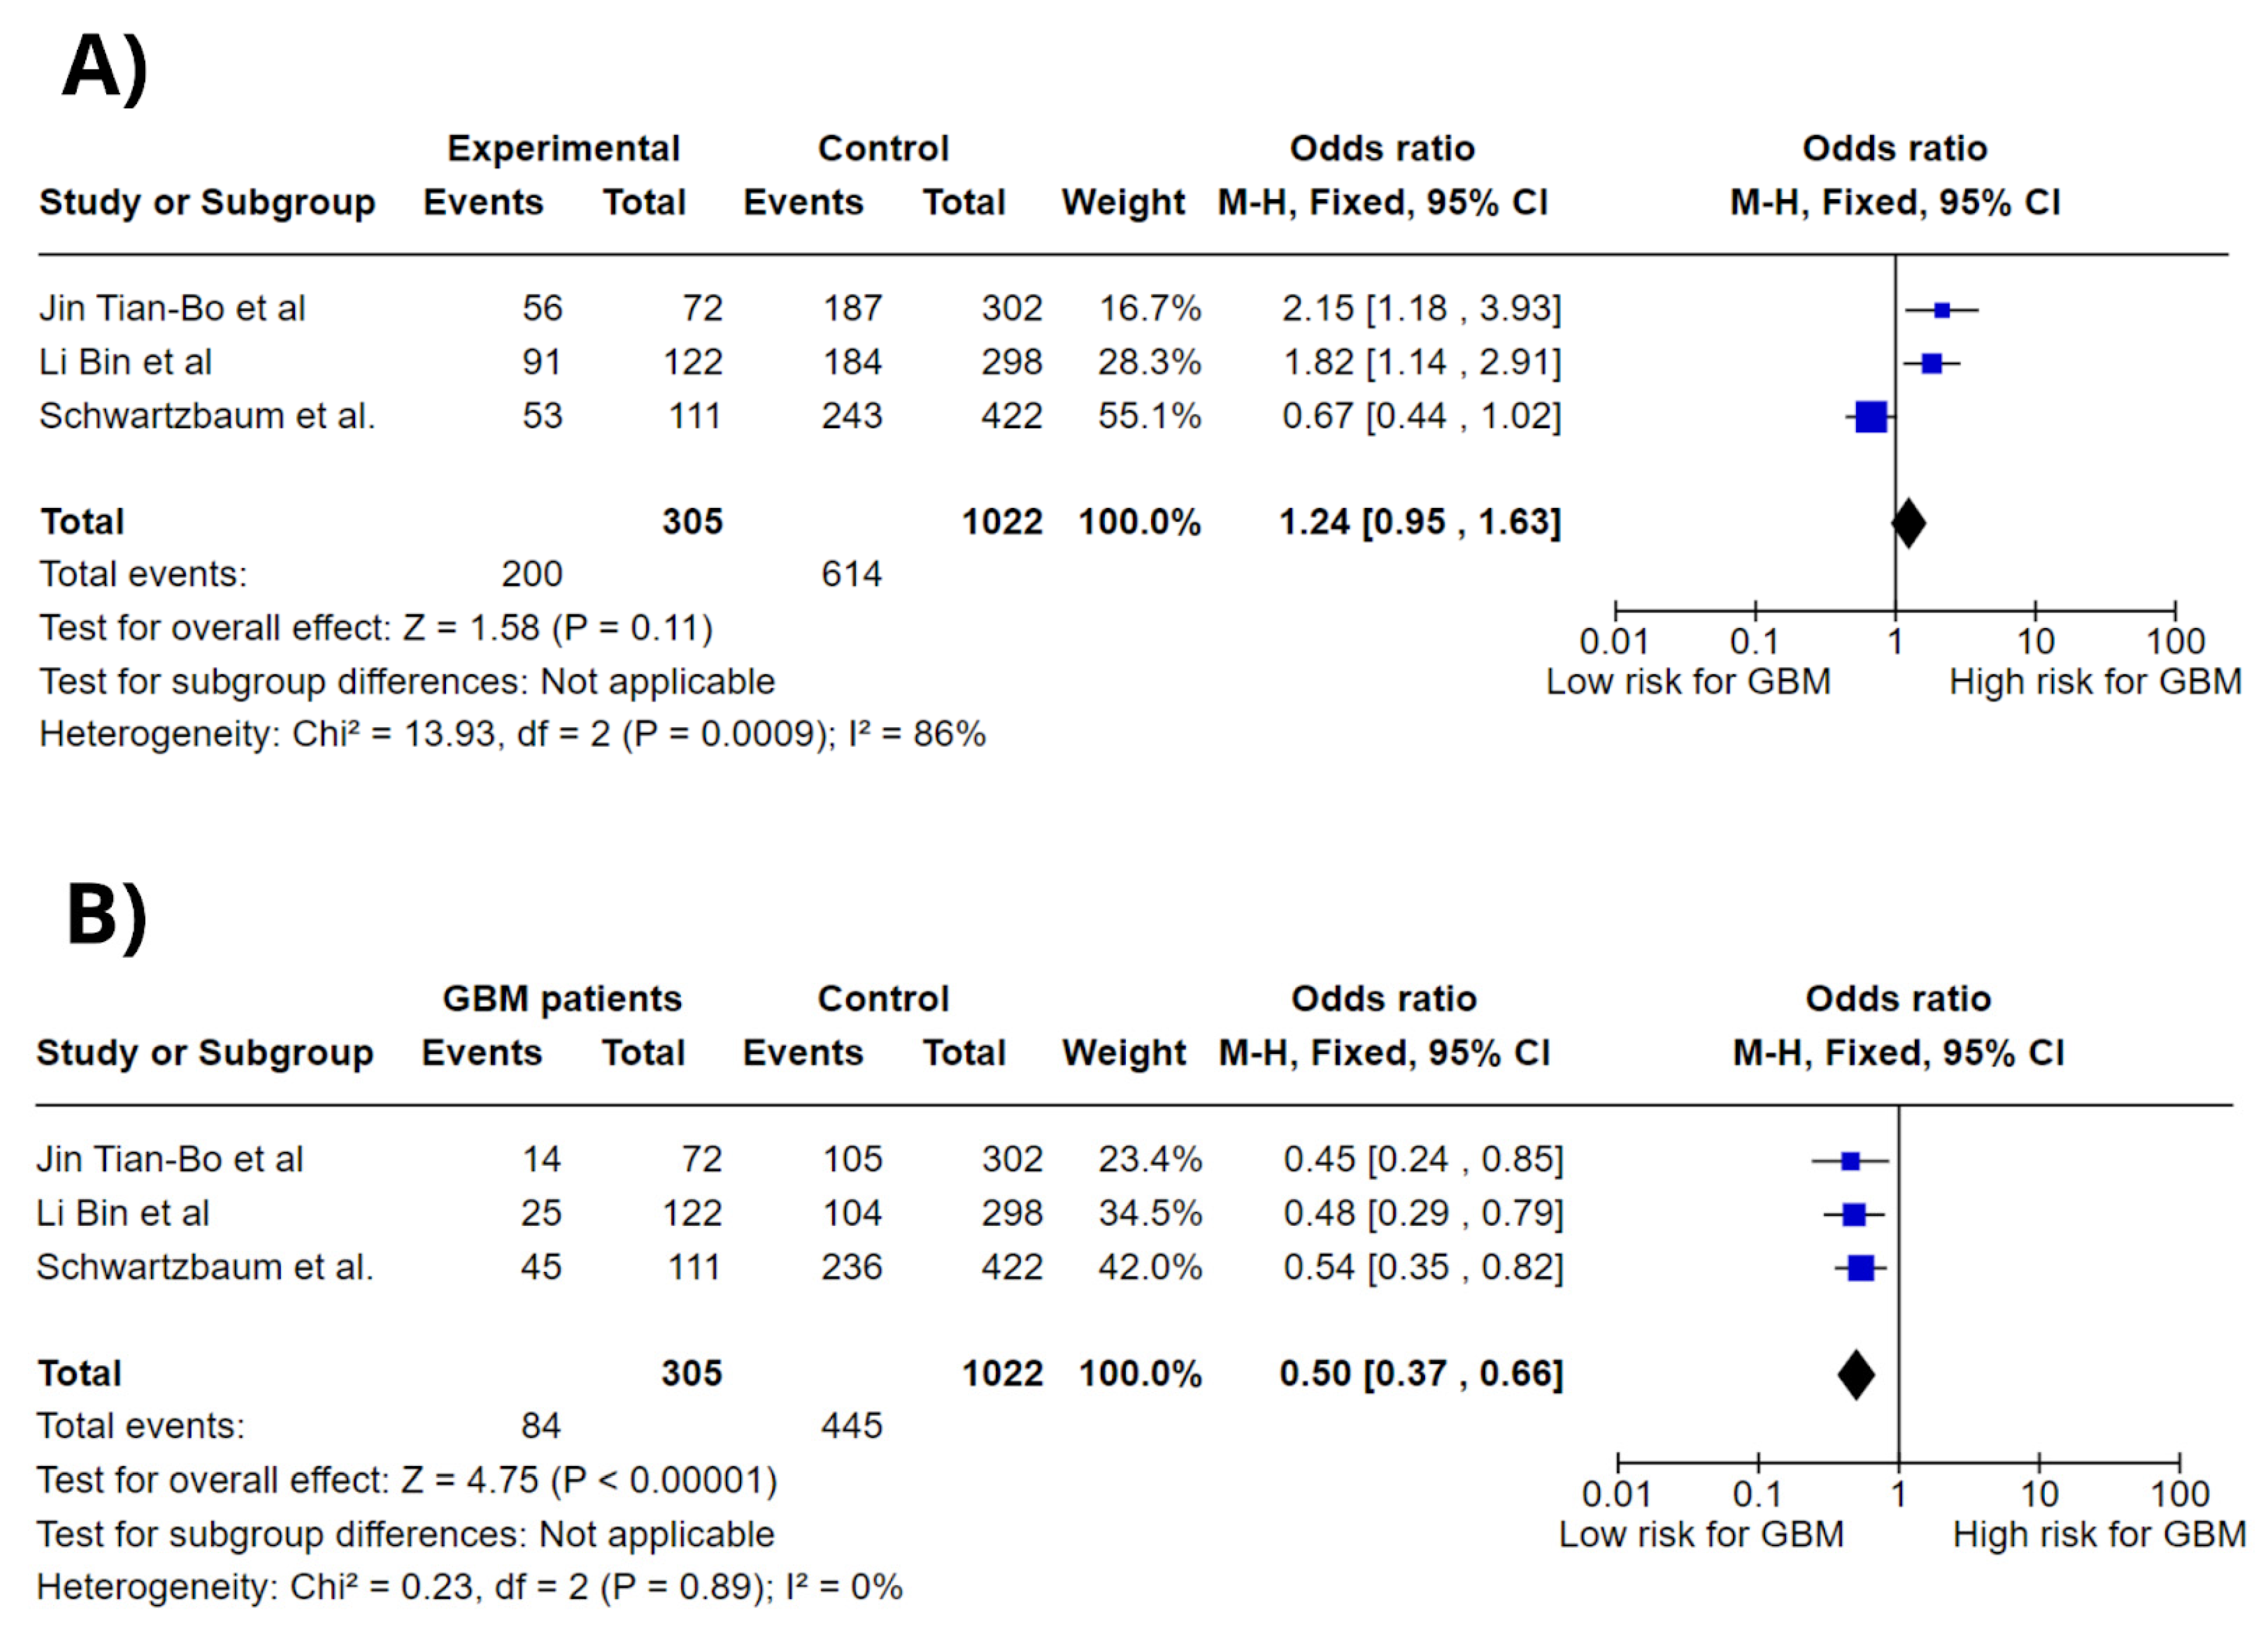
Figure 2 shows forest plots of the association between IL-4R rs1801275 different genotypes and glioblastoma risk; the genotypes analyzed were A/A, A/G, and G/G, all in a codominant model. Meta-analysis showed an association between IL-4R rs1801275 A/A genotype and increased GBM risk (OR = 1.24; 95% CI: 0.95–1.63; p = 0.11; I2 = 0%). However, IL-4R rs1801275 A/G genotype was not associated with high GBM risk (OR = 0.50; 95% CI: 0.37–0.66; p < 0.00001; I2 = 0%). Overall, IL-4R rs1801275 showed no significant association with increased GBM risk.
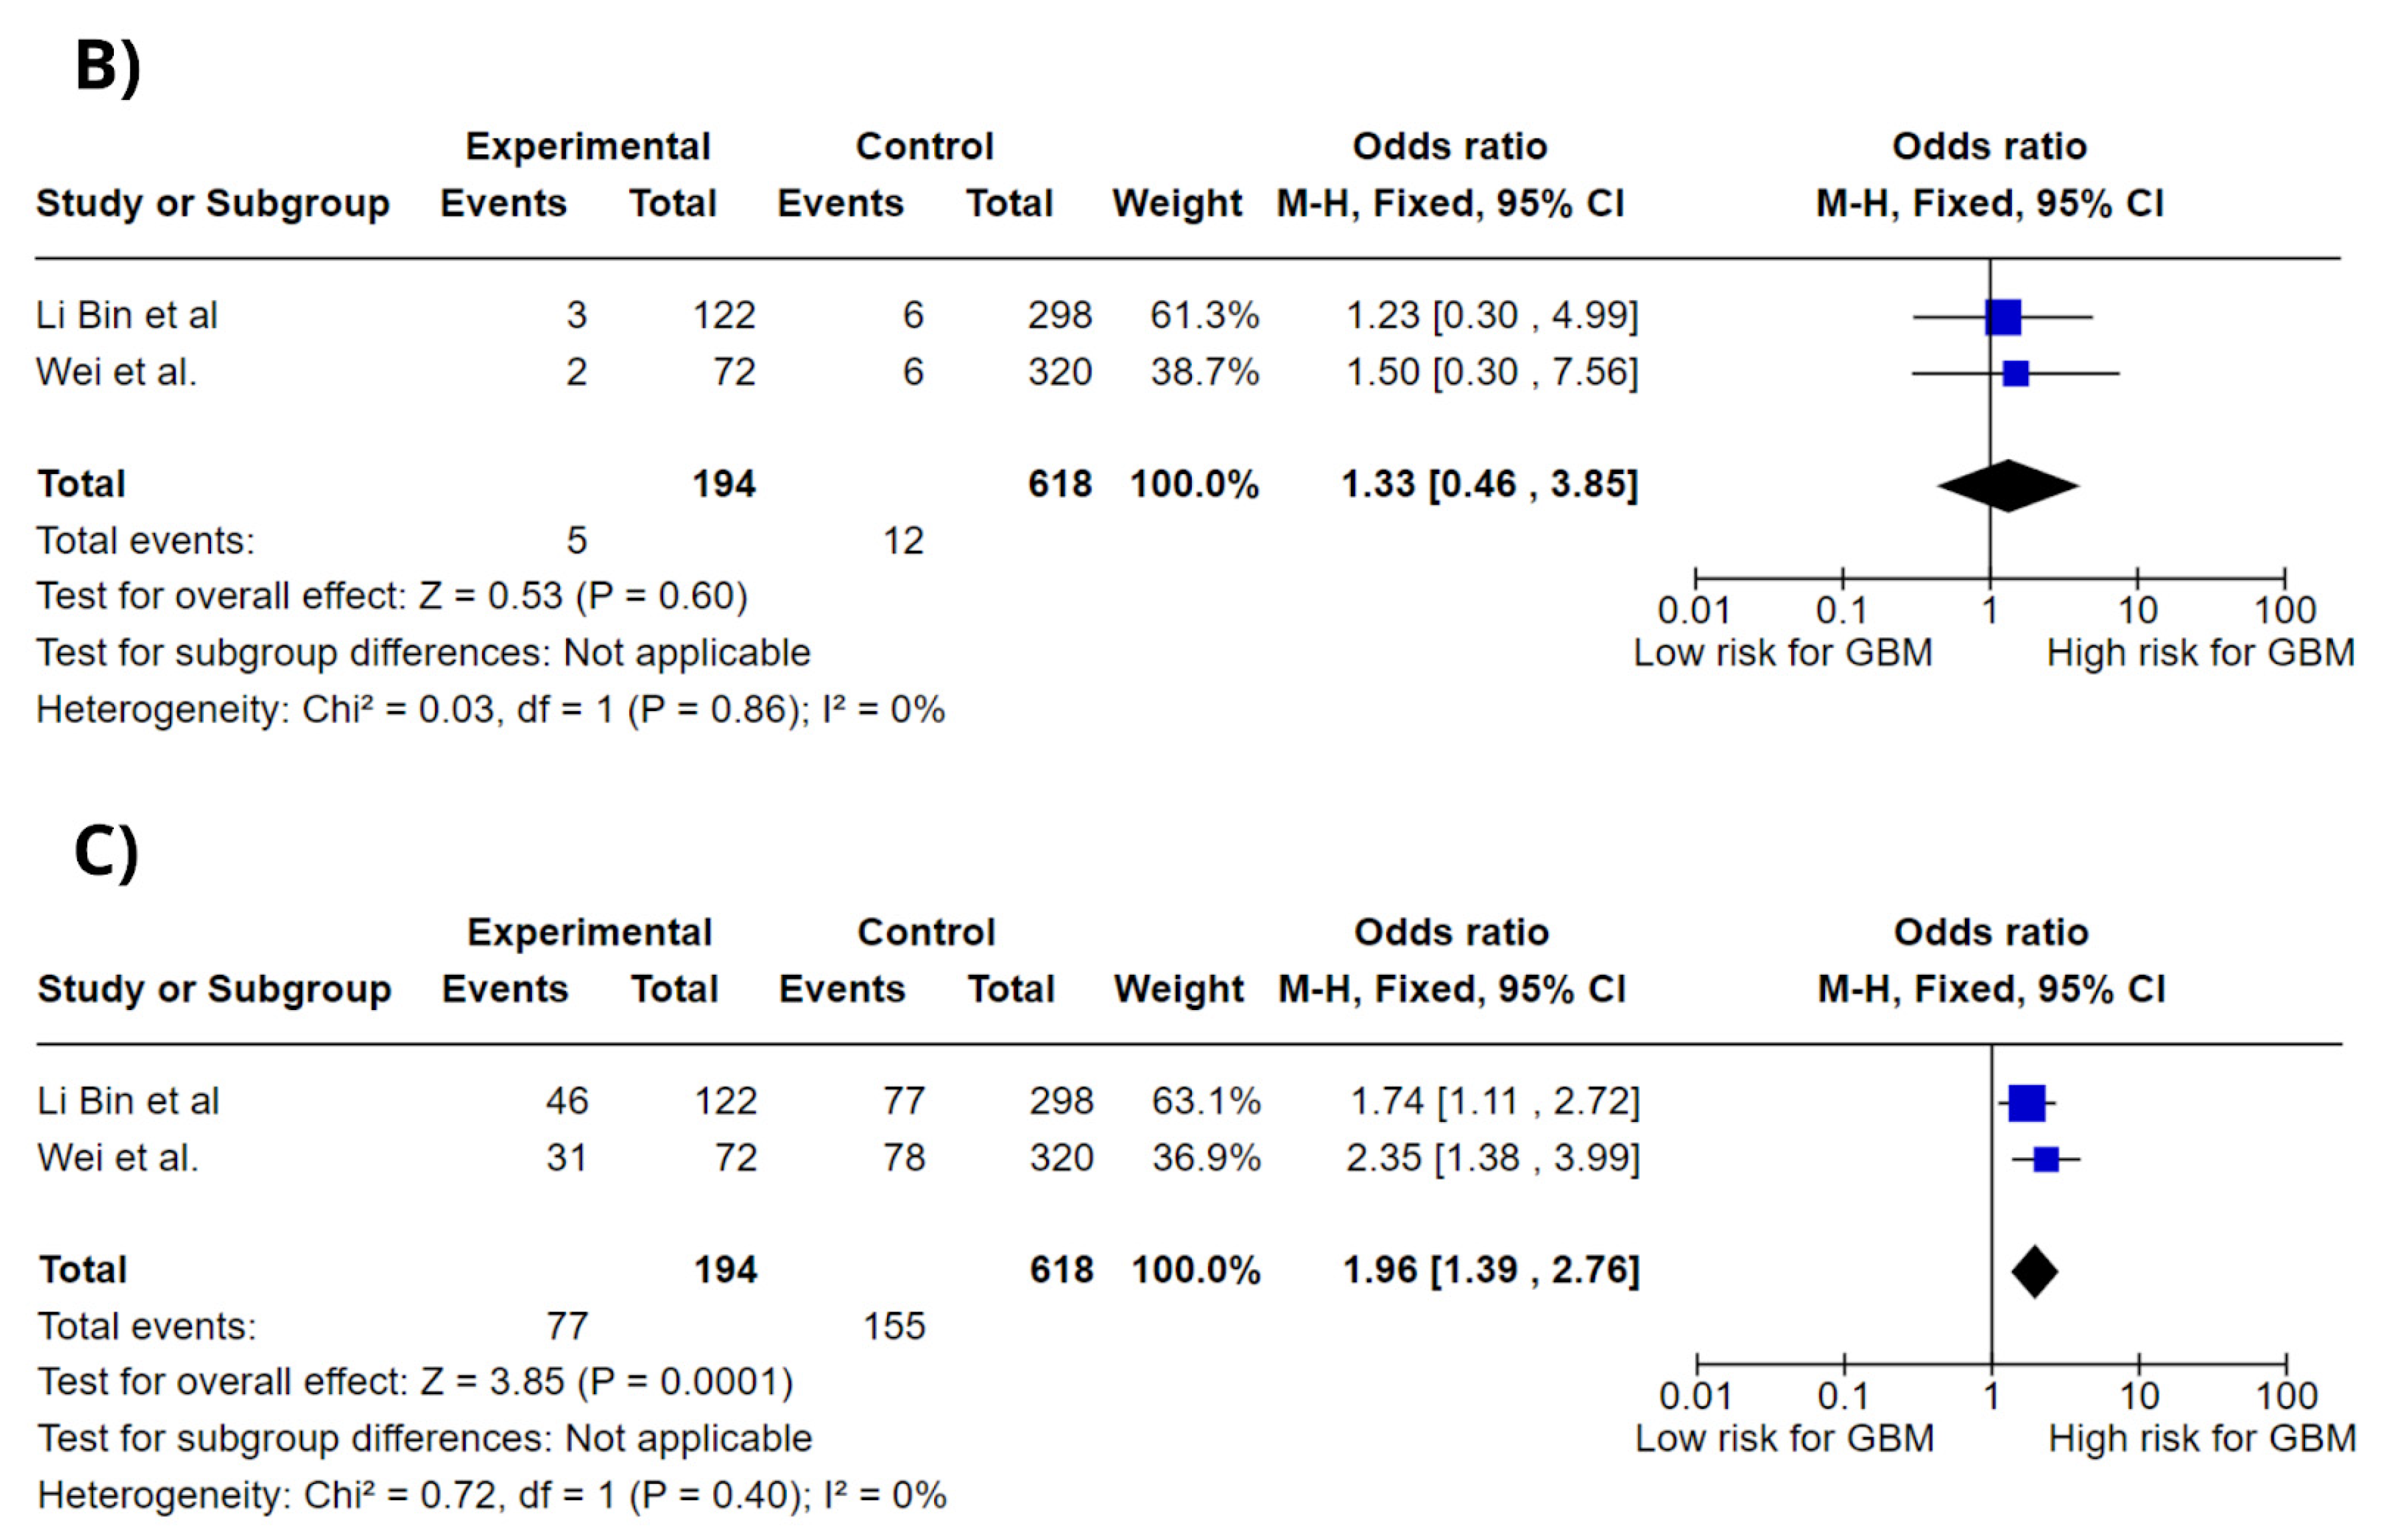
Figure 3 shows forest plots of the association between CCDC26 rs891835 different genotypes and glioblastoma risk; the genotypes analyzed were G/T and G/G in a codominant model and G/T–G/G in a dominant model. Meta-analysis showed a significant association between all genotypes analyzed and increased GBM risk, CCDC26 rs891835 G/T genotype (OR = 1.96; 95% CI: 1.38–2.77; p = 0.0002; I2 = 0%), G/G genotype (OR = 1.33; 95% CI: 0.46–3.85; p = 0.60; I2 = 0%), and G/T–G/G genotype (OR = 1.96; 95% CI: 1.39–2.76; p = 0.0001; I2 = 0%).

3.5. Epidemiological Correlation

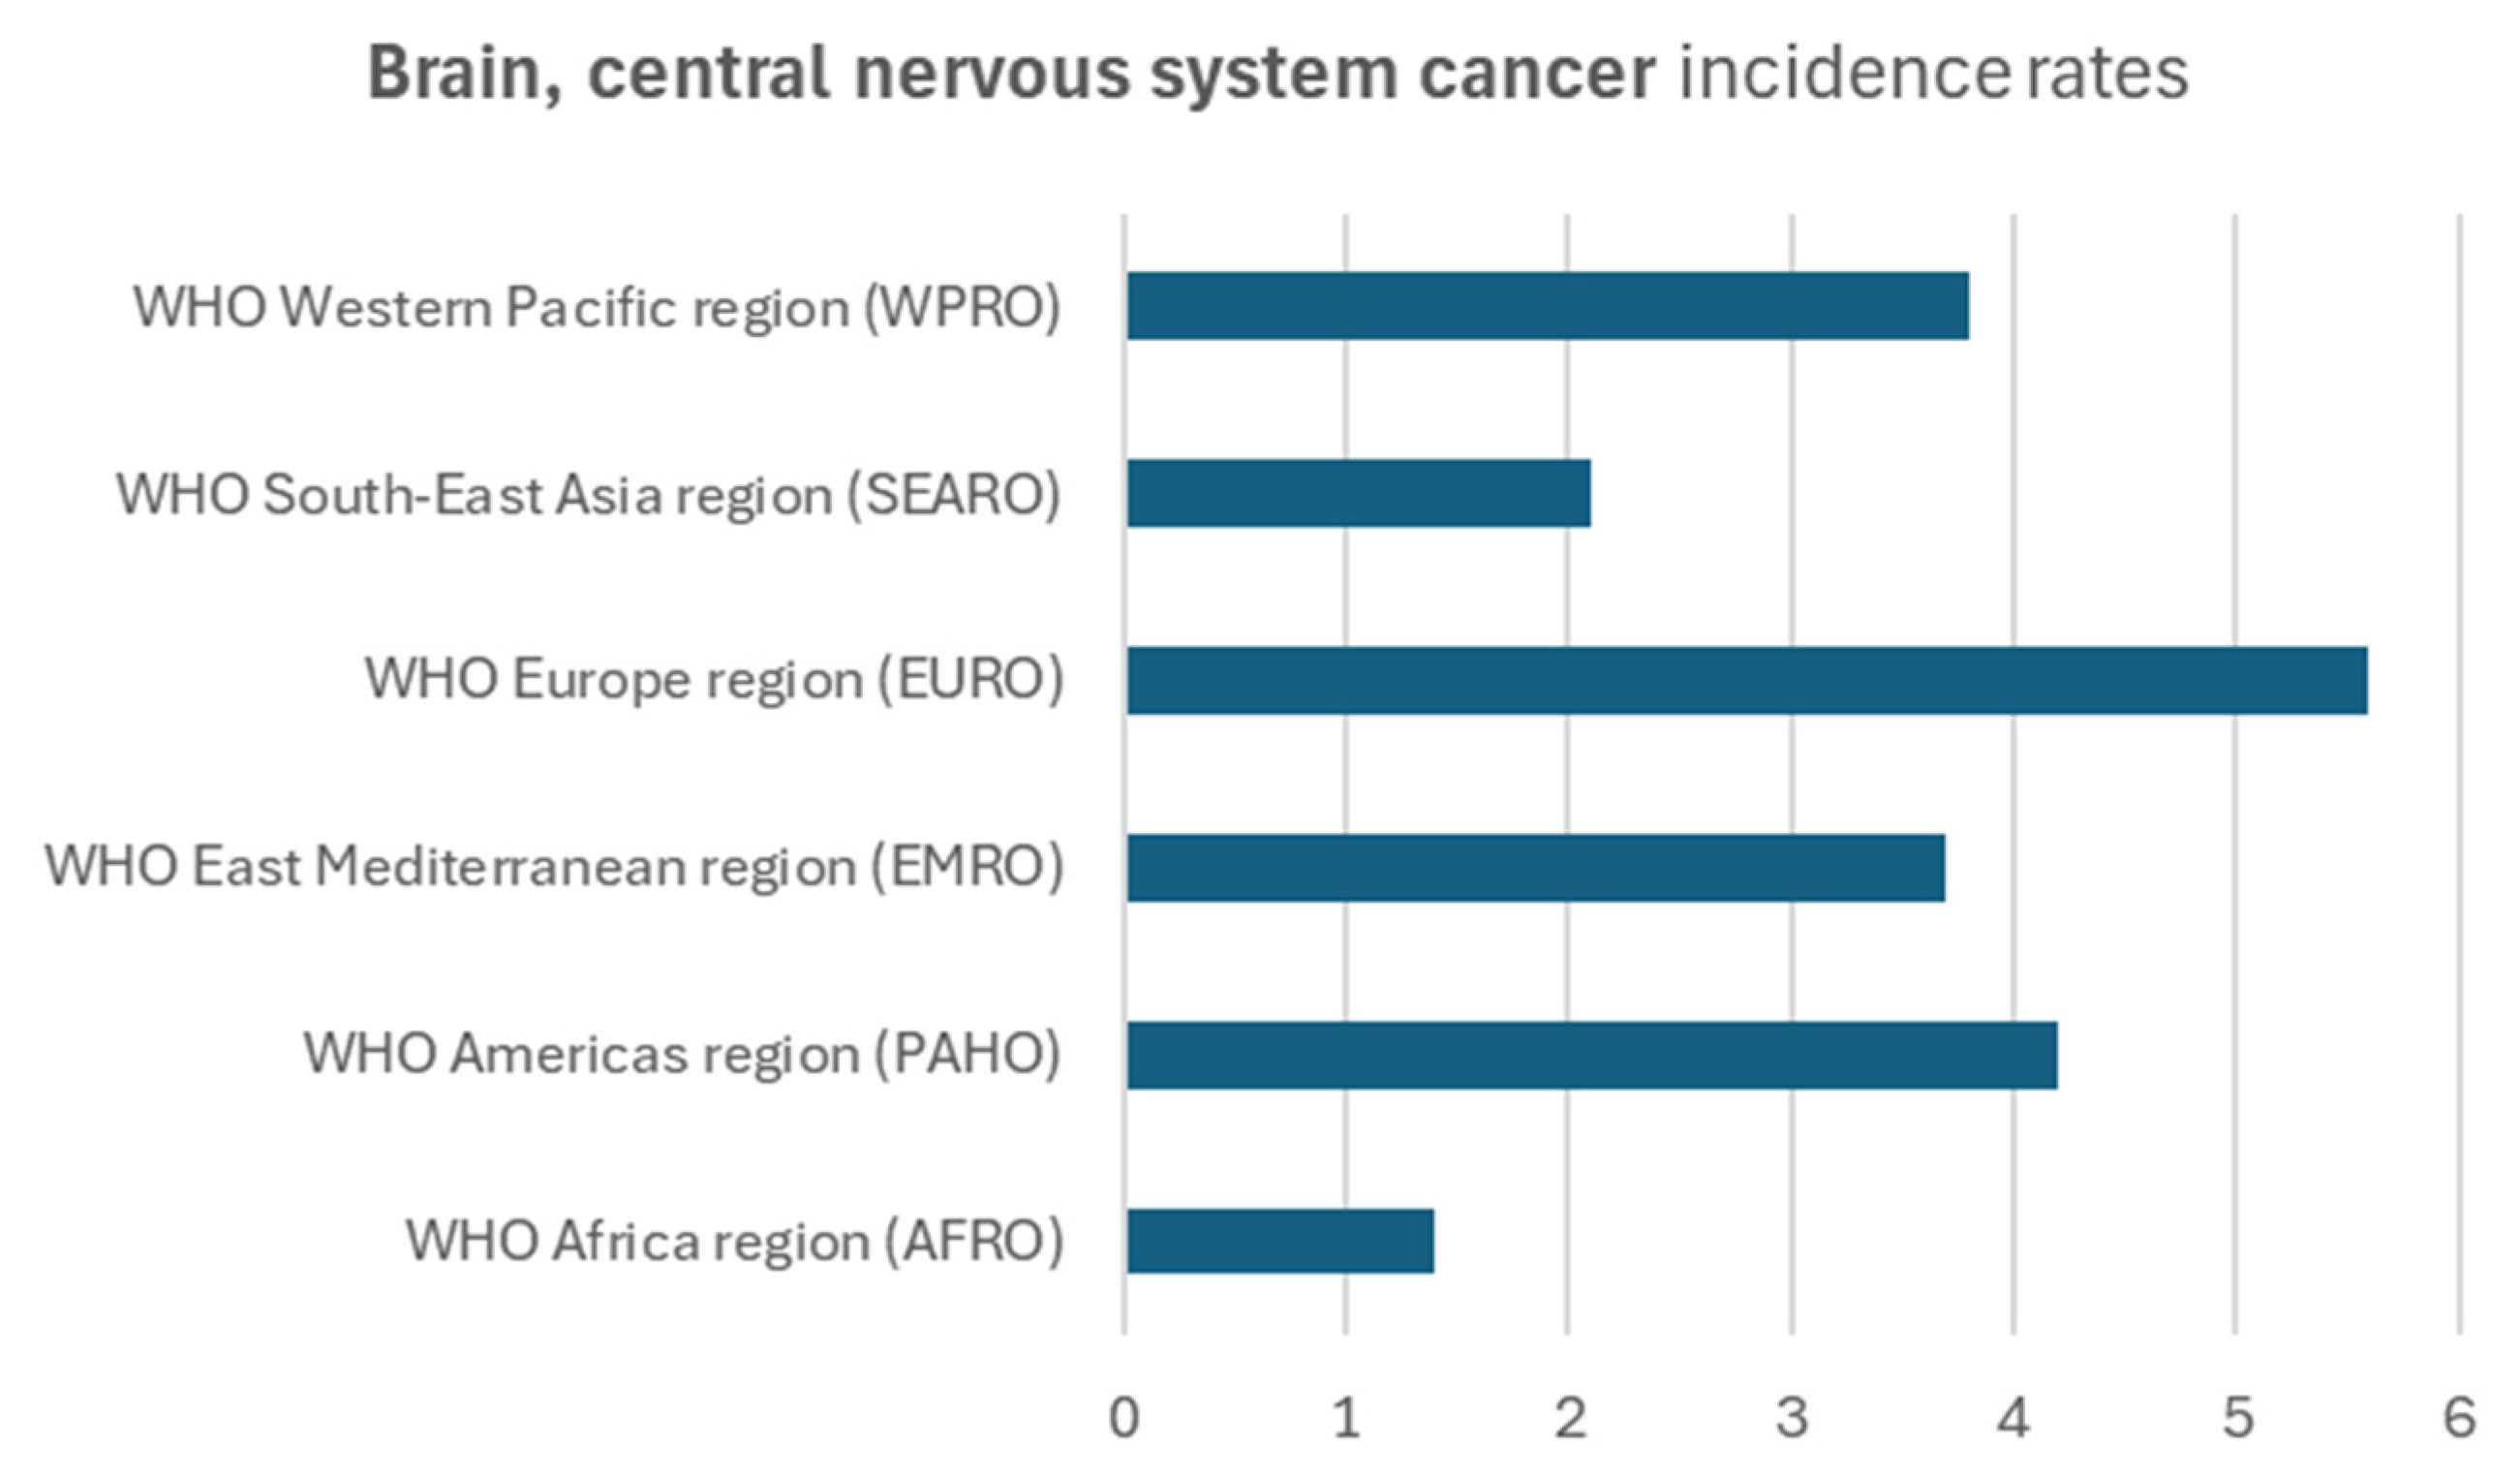
The Age-Standardized Incidence Rate (ASIR) for brain, central nervous system cancer indicates the frequency of new diagnoses of brain, central nervous system cancer within a defined timeframe, considering the distribution of age in the population. The incidence rate (ASIR) of brain, central nervous system cancer was 5.6 per 100,000, both sexes, in the European population, followed by the American (4.2), as shown in Figure 4.
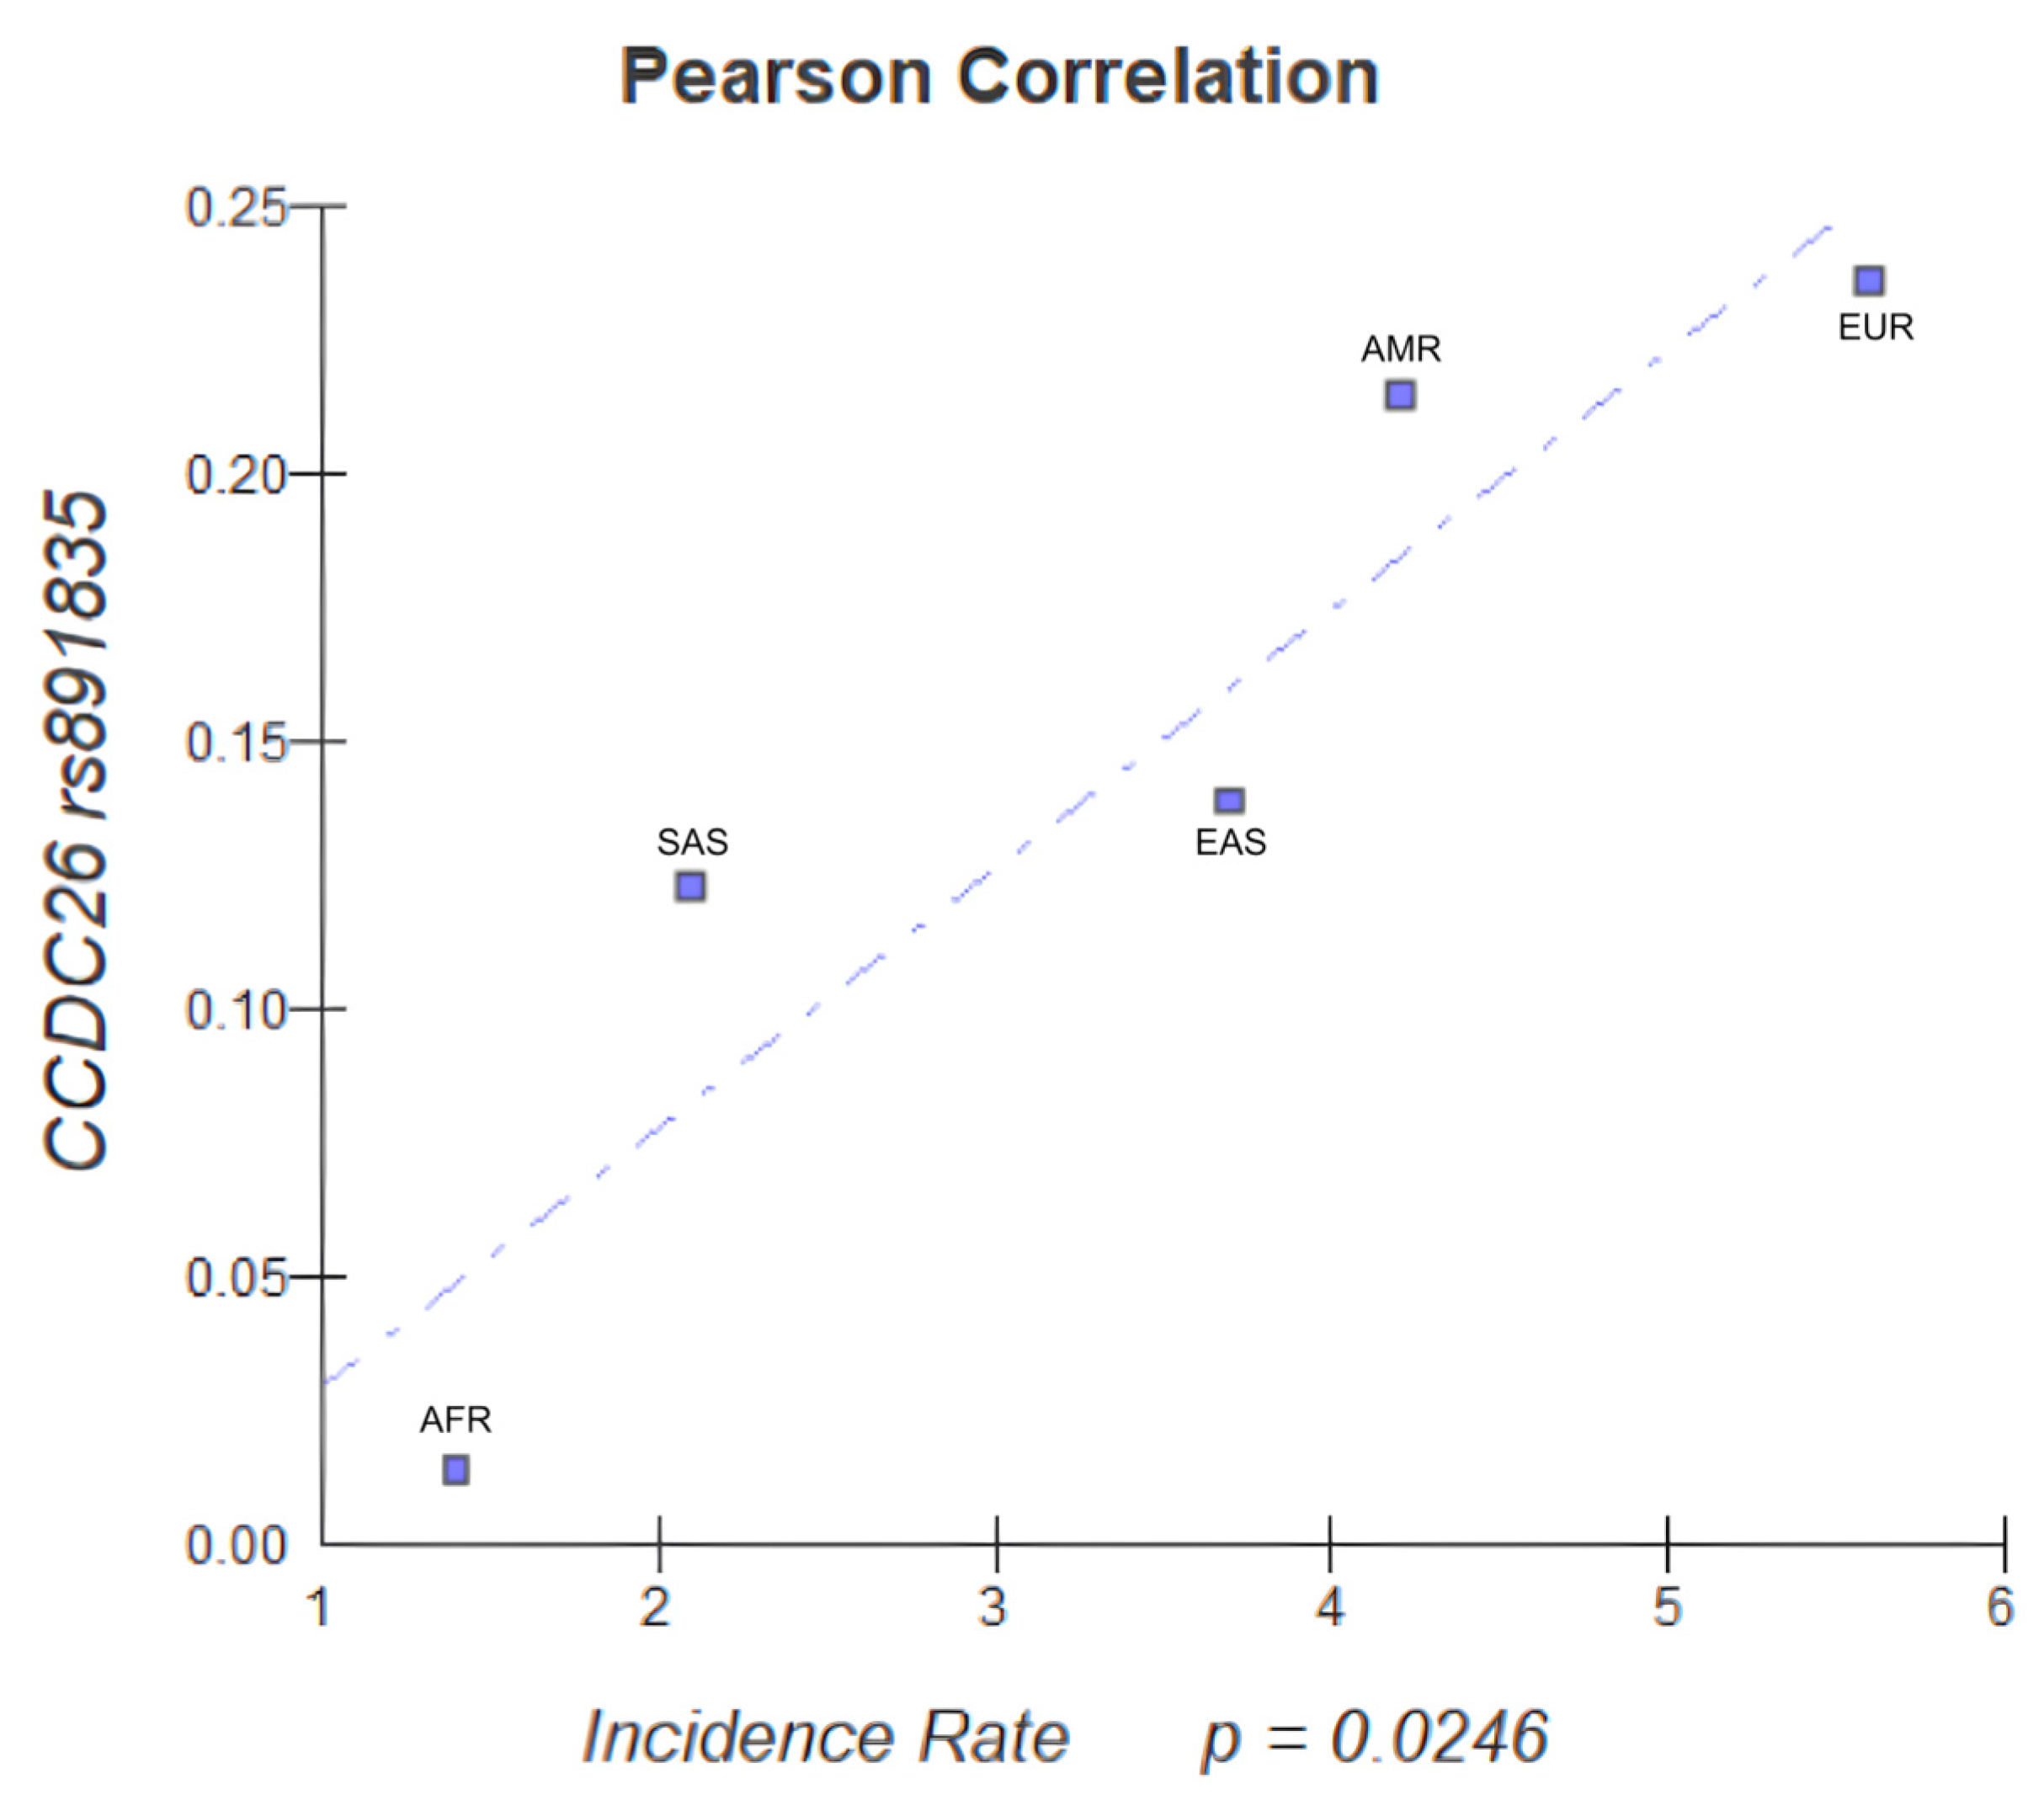
The variant CCDC26 rs891835 was described as directly correlated in the Pearson Correlation Analysis (p value = 0.0246), as shown in Figure 5, and demonstrated that the higher the frequency of the variant, the higher the incidence of that variant in certain populations, especially in the European population. From this, we can observe an association between the frequency of the variant and higher incidence rates in the European population, a correlation that demonstrates that the variant rs891835, already identified in the meta-analysis as a relevant biomarker for glioblastoma risk, could serve as a screening marker in the European population.

4. Discussion

This is the first systematic review and meta-analysis to associate literature data with clinically significant variants and genes related to increased glioblastoma risk. It is also a pioneering study in correlating genetic variants with the global epidemiology of this brain tumor. Based on previous studies, we selected variants and genes potentially related to glioblastoma development.
Our analyses revealed a significant association between the IL-4R gene variant rs1801275 (A/A genotype) and glioblastoma susceptibility. Furthermore, the CCDC26 gene variant rs891835 demonstrated an association with the disease. All genotypes of this variant (G/T, G/G, and G/T–G/G) were significantly associated with an increased risk of glioblastoma.
Studies have shown that the IL-4 receptor-α (IL-4Rα) is overexpressed in glioma-infiltrating myeloid cells, playing a key role in driving their immunosuppressive functions. This overexpression is associated with the granulocyte-macrophage colony-stimulating factor (GM-CSF), which elevates IL-4Rα levels and enhances the activity of myeloid-derived suppressor cells (MDSCs), ultimately suppressing T-cell responses [23]. Studies show that this gene, along with the rs1801275 variant, is related to the likelihood of developing glioblastoma. Our results confirmed that the rs1801275 variant, particularly the A/G genotype, is strongly associated with an increased risk of glioblastoma in a superdominant model [21]. These data support the association of rs1801275 with glioblastoma susceptibility. However, in our analyses, only the A/A genotype of the IL-4R gene was associated with glioblastoma development.
The CCDC26 gene, located on chromosome 8q24, has emerged as a significant player in various cancers, particularly gliomas and acute myeloid leukemia (AML). Research indicates that structural variations and polymorphisms in CCDC26 are associated with tumorigenesis, influencing both the expression of oncogenes and patient prognosis [24]. Additionally, structural variations in CCDC26 have been linked to pediatric gliomas, such as diffuse intrinsic pontine glioma (DIPG), where they contribute to elevated gene expression and tumor proliferation [25]. Studies show that the rs891835 variant in this gene increases glioblastoma susceptibility [12,14,26]. These findings are consistent with our analyses, which also identified a significant association between the rs891835 SNP in the CCDC26 gene and increased glioblastoma risk, with higher frequency and incidence of this variant observed in populations of European descent.

5. Conclusions

The present study suggests that CCDC26 rs891835 may serve as a predictive biomarker for GBM risk and may influence higher GBM incidence rates in the European population. While this study provides valuable insights, some aspects warrant consideration. The focus on previously reported SNPs could overlook unexplored genetic variants, and population heterogeneity might influence the generalizability of the findings. Future research could address these aspects by conducting larger longitudinal studies, exploring additional genetic variants and SNP–environment interactions, and investigating the molecular mechanisms underlying the role of these SNPs in glioblastoma pathogenesis.

Supplementary Materials

The following supporting information can be downloaded at: https://www.mdpi.com/article/10.3390/jpm15090401/s1, Table S1: Single-nucleotide Polymorphisms (SNPs) selected from the global literature; Table S2: Search strategies.

Author Contributions

Conceptualization, G.G.d.C.N. and F.C.A.d.M.; methodology, G.G.d.C.N. and F.C.A.d.M.; software, F.C.A.d.M.; validation, G.G.d.C.N., F.C.A.d.M. and R.d.C.C.C.; formal analysis, G.G.d.C.N.; investigation, G.G.d.C.N., F.C.A.d.M. and R.d.C.C.C.; resources, G.G.d.C.N., F.C.A.d.M., R.d.C.C.C. and N.P.C.d.S.; data curation, G.G.d.C.N. and F.C.A.d.M.; writing—original draft preparation, G.G.d.C.N.; writing—review and editing, G.G.d.C.N. and R.d.C.C.C.; visualization, G.G.d.C.N.; supervision, N.P.C.d.S., M.R.F. and S.E.B.d.S.; project administration, N.P.C.d.S., M.R.F. and S.E.B.d.S. All authors have read and agreed to the published version of the manuscript.

Funding

This research was funded by the Conselho Nacional de Desenvolvimento Científico e Tecnológico (CNPq), the Coordenação de Aperfeiçoamento de Pessoal de Nível Superior (CAPES), and the Pró-Reitoria de Pesquisa e Pós-Graduação da UFPA (PROPESP).

Institutional Review Board Statement

Not applicable.

Informed Consent Statement

Not applicable.

Data Availability Statement

No new data were created or analyzed in this study. Data sharing is not applicable to this article.

Acknowledgments

We thank the Federal University of Pará (UFPA) and the Research Center in Oncology (NPO/UFPA). The design of the study, sample collection, data analysis, interpretation, and manuscript writing were conducted independently of any influence or involvement from the funding agencies.

Conflicts of Interest

The authors declare no conflicts of interest.

References

  1. Weller, M.; Lim, M.; Ashby, L.S.; Reardon, D.A.; Bendszus, M. Glioblastoma Nature Reviews Disease Primers. Neuro Oncol. 2021, 23, 1617–1637. [Google Scholar]
  2. Ostrom, Q.T.; Price, M.; Neff, C.; Cioffi, G.; A Waite, K.; Kruchko, C.; Barnholtz-Sloan, J.S. CBTRUS Statistical Report: Primary Brain and Other Central Nervous System Tumors Diagnosed in the United States in 2016-2020. Neuro-Oncol. 2023, 25, iv1–iv99. [Google Scholar] [CrossRef]
  3. Orasanu, C.I.; Aschie, M.; Deacu, M.; Bosoteanu, M.; Vamesu, S.; Enciu, M.; Bălţătescu, G.I.; Cozaru, G.C.; Mitroi, A.F.; Voda, R.I. Implications of Cellular Immaturity in Necrosis and Microvascularization in Glioblastomas IDH-Wild-Type. Clin. Pract. 2022, 12, 1054–1068. [Google Scholar] [CrossRef] [PubMed]
  4. Walsh, K.; Ostrom, Q.; Byun, J.; Wimberly, C.; Armstrong, G.; Amos, C.; GICC Collaborators; Bondy, M. Epid-18. the genomic architecture of glioblastoma predisposition is highly polygenic in patients with a positive family history of glioma. Neuro-Oncol. 2023, 25, v119. [Google Scholar] [CrossRef]
  5. Nurminen, R.; Afyounian, E.; Paunu, N.; Katainen, R.; Isomäki, M.; Nurminen, A.; Scaravilli, M.; Tolppanen, J.; Fey, V.; Kivinen, A.; et al. Previously reported CCDC26 risk variant and novel germline variants in GALNT13, AR, and MYO10 associated with familial glioma in Finland. Sci. Rep. 2024, 14, 11562. [Google Scholar] [CrossRef]
  6. Lim, M.; Xia, Y.; Bettegowda, C.; Weller, M. Current state of immunotherapy for Glioblastoma. Nat. Rev. Clin. Oncol. 2018, 15, 422–442. [Google Scholar] [CrossRef]
  7. Sundar, R.; Cho, B.-C.; Brahmer, J.R.; Soo, R.A. Nivolumab in NSCLC: Latest evidence and clinical potential. Ther. Adv. Med Oncol. 2015, 7, 85–96. [Google Scholar] [CrossRef]
  8. Wells, G.A.; Shea, B.; O'Connell, D.; Peterson, J.; Welch, V.; Losos, M.; Tugwell, P. The Newcastle-Ottawa Scale (NOS) for Assessing the Quality of Nonrandomized Studies in Meta-Analyses. Ottawa Hospital Research Institute. Available online: http://www.ohri.ca/programs/clinical_epidemiology/oxford.asp (accessed on 25 November 2024).
  9. Little, J.; Higgins, J.P.; Ioannidis, J.P.; Moher, D.; Gagnon, F.; von Elm, E.; Khoury, M.J.; Cohen, B.; Davey-Smith, G.; Grimshaw, J.; et al. Strengthening the reporting of genetic association studies (STREGA): An extension of the STROBE statement. PLOS Med. 2009, 6, e1000022. [Google Scholar] [CrossRef]
  10. Global Cancer Observatory. Cancer Today: Global Cancer Observatory Statistics on Brain and CNS Cancers; International Agency for Research on Cancer: Lyon, France, 2020. [Google Scholar]
  11. Jin, T.; Li, X.; Zhang, J.; Wang, H.; Geng, T.; Li, G.; Gao, G.; Chen, C. Genetic association between selected cytokine genes and Glioblastoma in the Han Chinese population. BMC Cancer 2013, 13, 236. [Google Scholar] [CrossRef]
  12. Wei, X.-B.; Jin, T.-B.; Li, G.; Geng, T.-T.; Zhang, J.-Y.; Chen, C.-P.; Gao, G.-D.; Chen, C.; Gong, Y.-K. CCDC26 gene polymorphism and Glioblastoma risk in the Han Chinese population. Asian Pac. J. Cancer Prev. 2014, 15, 3629–3633. [Google Scholar] [CrossRef]
  13. Schwartzbaum, J.; Ahlbom, A.; Malmer, B.; Lönn, S.; Brookes, A.J.; Doss, H.; Debinski, W.; Henriksson, R.; Feychting, M. Polymorphisms associated with asthma are inversely related to Glioblastoma multiforme. Cancer Res. 2005, 65, 6459–6465. [Google Scholar] [CrossRef] [PubMed]
  14. Li, B.; Li, Y.; Yan, M.; Li, J.; Li, J.; Du, S.; Jin, T.; Gong, Y. Association of NFIL3, XRCC5 polymorphisms with Glioblastoma in Han Chinese population. Int. J. Clin. Exp. Pathol. 2017, 10, 4838–4846. [Google Scholar]
  15. Mesic, A.; Rogar, M.; Hudler, P.; Bilalovic, N.; Eminovic, I.; Komel, R. Genetic variations in AURORA cell cycle kinases are associated with Glioblastoma multiforme. Sci. Rep. 2021, 11, 17444. [Google Scholar] [CrossRef] [PubMed]
  16. Liu, Y.L.; Liu, P.F.; Liu, H.E.; Ma, L.X.; Li, G. Association between STAT5 polymorphisms and Glioblastoma risk in Han Chinese population. Pathol. Res. Pract. 2014, 210, 582–585. [Google Scholar] [CrossRef]
  17. Custodio, A.C.; Almeida, L.O.D.; Pinto, G.R.; Santos, M.J.D.; Almeida, J.R.; Clara, C.A.; Rey, J.A.; Casartelli, C. GSTP1 Ile105Val polymorphism in astrocytomas and Glioblastomas. Genet. Mol. Res. 2010, 9, 2328–2334. [Google Scholar] [CrossRef]
  18. Dong, Y.-S.; Hou, W.-G.; Li, X.-L.; Jin, T.-B.; Li, Y.; Feng, D.-Y.; Liu, D.-B.; Gao, G.-D.; Yin, Z.-M.; Qin, H.-Z. Genetic association of CHEK2, GSTP1, and ERCC1 with Glioblastoma in the Han Chinese population. Tumour Biol. 2014, 35, 4937–4941. [Google Scholar] [CrossRef]
  19. McKean-Cowdin, R.; Barnholtz-Sloan, J.; Inskip, P.D.; Ruder, A.M.; Butler, M.; Rajaraman, P.; Razavi, P.; Patoka, J.; Wiencke, J.K.; Bondy, M.L.; et al. Associations between polymorphisms in DNA repair genes and Glioblastoma. Cancer Epidemiol. Biomark. Prev. 2009, 18, 1118–1126. [Google Scholar] [CrossRef]
  20. Rodriguez-Hernandez, I.; Perdomo, S.; Santos-Briz, A.; Garcia, J.L.; Gomez-Moreta, J.A.; Cruz, J.J.; Gonzalez-Sarmiento, R. Analysis of DNA repair gene polymorphisms in Glioblastoma. Gene 2014, 536, 79–83. [Google Scholar] [CrossRef]
  21. Jin, T.-B.; Li, X.-L.; Yang, H.; Jiri, M.; Shi, X.-G.; Yuan, D.-Y.; Kang, L.-L.; Li, S.-Q. Association of polymorphisms in FLT3, EGFR, ALOX5, and NEIL3 with Glioblastoma in the Han Chinese population. Med. Oncol. 2013, 30, 718. [Google Scholar] [CrossRef]
  22. Al-Khatib, S.M.; Abdo, N.; Al-Eitan, L.N.; Al-Mistarehi, A.-H.W.; Zahran, D.J.; Al Ajlouni, M.; Kewan, T.Z. The Impact of the Genetic Polymorphism in DNA Repair Pathways on Increased Risk of Glioblastoma Multiforme in the Arab Jordanian Population: A Case-Control Study. Appl. Clin. Genet. 2020, 13, 115–126. [Google Scholar] [CrossRef]
  23. Kohanbash, G.; McKaveney, K.; Sakaki, M.; Ueda, R.; Mintz, A.H.; Amankulor, N.; Fujita, M.; Ohlfest, J.R.; Okada, H. GM-CSF Promotes the Immunosuppressive Activity of Glioma-Infiltrating Myeloid Cells through Interleukin-4 Receptor-α. Cancer Res. 2013, 73, 6413–6423. [Google Scholar] [CrossRef] [PubMed]
  24. Chen, C.; Wang, P.; Mo, W.; Zhang, Y.; Zhou, W.; Deng, T.; Zhou, M.; Chen, X.; Wang, S.; Wang, C. lncRNA-CCDC26, as a novel biomarker, predicts prognosis in acute myeloid leukemia. Oncol. Lett. 2019, 18, 2203–2211. [Google Scholar] [CrossRef] [PubMed]
  25. Zou, L. Recurrent structural variations of lncRNA gene CCDC26 in diffuse intrinsic pontine glioma. bioRxiv 2021. [Google Scholar] [CrossRef]
  26. Li, S.; Jin, T.; Zhang, J.; Lou, H.; Yang, B.; Li, Y.; Chen, C.; Zhang, Y. Polymorphisms of TREH, IL-4R and CCDC26 genes associated with risk of glioma. Cancer Epidemiol. 2012, 36, 283–287. [Google Scholar] [CrossRef]
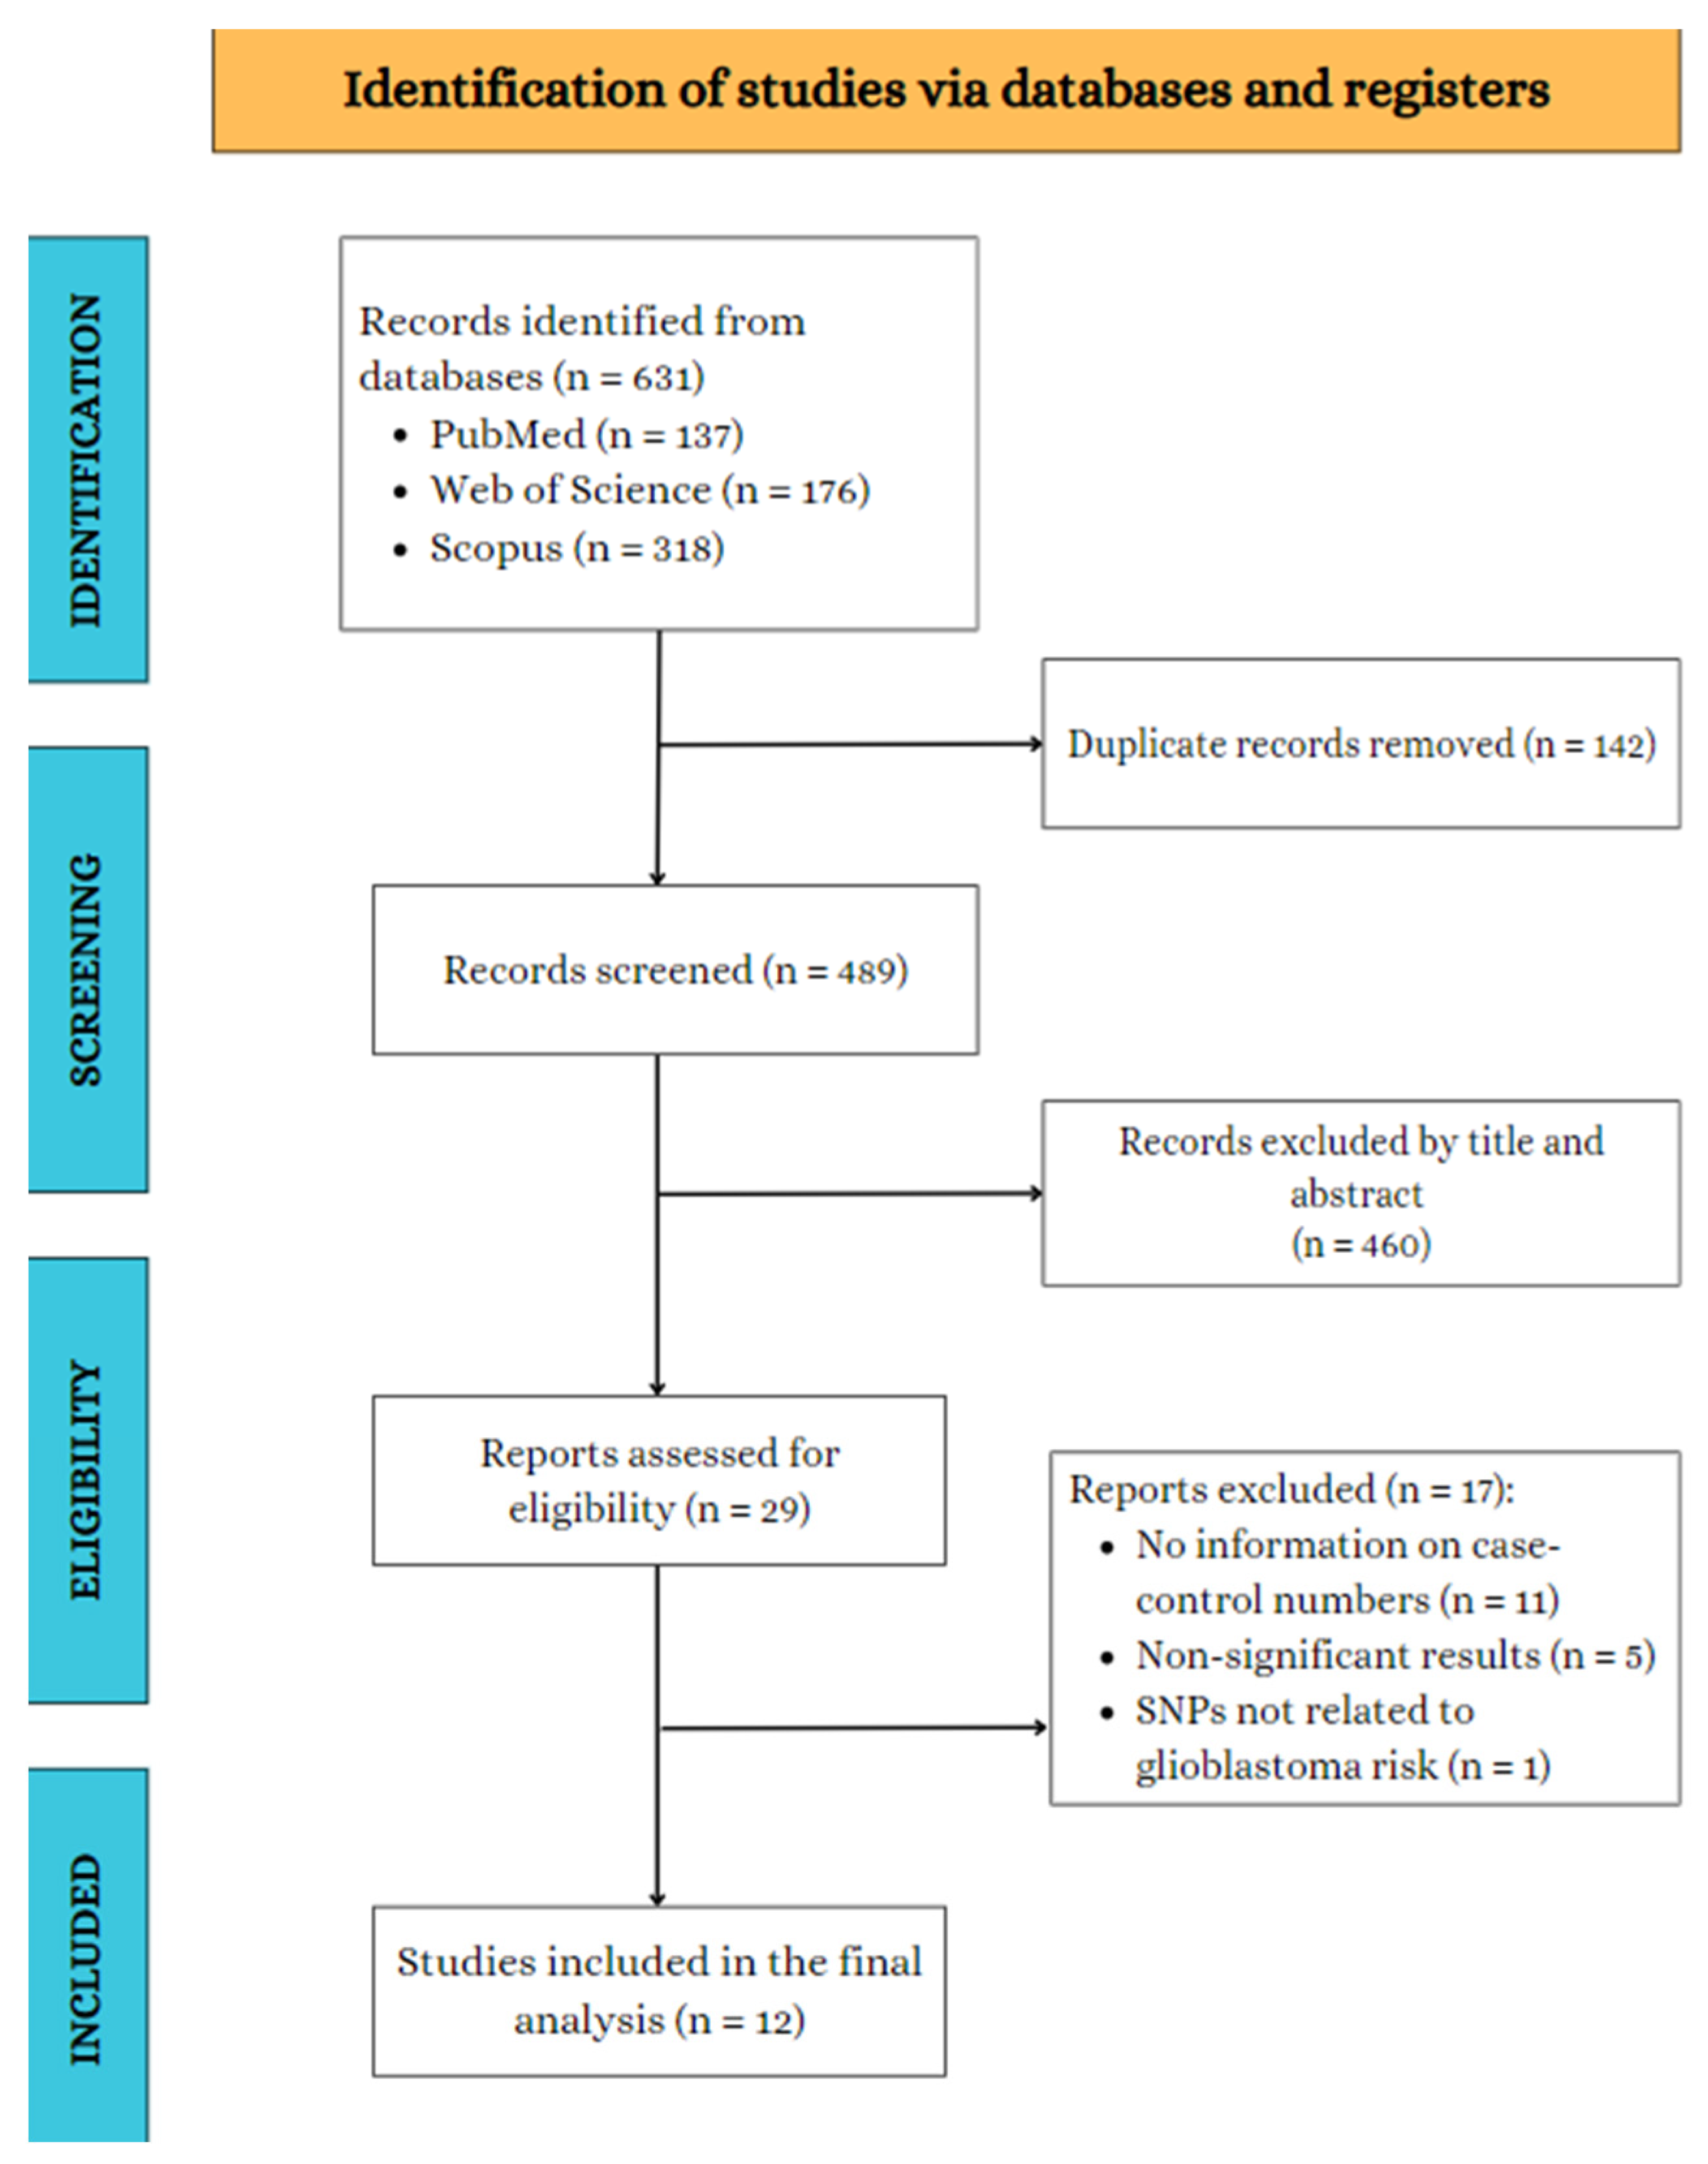
Figure 1. Study selection flowchart through literature search.
Jpm 15 00401 g001
Figure 2. Forest plots of association between IL-4R gene polymorphisms and GBM risk. (A) IL-4R rs1801275 A/A codominant genotype. (B) IL-4R rs1801275 A/G codominant genotype [13,14,21].
Jpm 15 00401 g002
Figure 3. Forest plots of association between CCDC26 gene polymorphisms and GBM risk. (A) CCDC26 rs891835 G/T codominant genotype. (B) CCDC26 rs891835 G/G codominant genotype. (C) CCDC26 rs891835 G/T–G/G codominant genotype [12,14].
Jpm 15 00401 g003aJpm 15 00401 g003b
Figure 4. Brain, central nervous system cancer incidence rates per 100,000 habitants from the World Health Organization International Agency for Research on Cancer in different populations.
Jpm 15 00401 g004
Figure 5. Pearson Correlation Analysis.
Jpm 15 00401 g005
Table 1. Characteristics of included studies and participants.
Authors, YearCountryParticipants (Male/Female)Mean AgeMean Age at Diagnosis (Years)Genotyping MethodGBM Histologically ConfirmedEthnicityMain Results
Mesic et al., 2021 [15] Bosnia and Herzegovina129 (68/61)50 (19–81)58castPCRYesEuropeanrs2289590 in AURKB and rs11084490 in AURKC were associated with a reduced GBM risk
Liu et al., 2014 [16]China115 (58.5%/41.5%)45.342.9PCRYesChineseSTAT5b rs2293157 G/T was associated with increased GBM risk
Custódio et al., 2010 [17]Brazil80 (52/28)45NRPCR-RFLPNRBrazilianGSTP1 rs947894 polymorphism was associated with increased GBM risk
Dong et al., 2014 [18]China72 (28/44)44 ± 15NRlocus-specific PCRYesChineseGene polymorphisms in CHEK2, GSTP1, and ERCC1 may be involved in GBM in the Han Chinese population
Jin Tianbo et al., 2013 [11]China72 (28/44)NR44 ± 15locus-specific PCRYesChinesePolymorphisms within FLT3, EGFR, NEIL3, and ALOX5 may contribute to the occurrence of GBM in the Han Chinese population
Wei et al., 2014 [12]China72 (28/44)44 ± 1541 ± 18locus-specific PCRYesChineseGenetic contribution of CCDC26 to GBM progression among Han Chinese
McKean-Cowdin et al., 2009 [19]United States of America1015 (619/396)56.3 ± 12.656 castPCRYesNorth AmericanThe C allele of the PARP1 rs1136410 variant was associated with decreased GBM risk, G allele of the PRKDC rs7003908 was associated with increased GBM risk
Schwartzbaum et al., 2005 [13]United States of America111 (59.18% male)5665DASH PCRNRNorth AmericanIL-4RA rs1805015 TC, CC and IL-4RA rs1801275 AG, AA were positively associated with GBM while IL-13 rs1800925 CT, TT was negatively associated with GBM
Rodriguez-Hernandez et al., 2013 [20]Spain115 (59.1% male)63.2 ± 10.1NRcastPCRNREuropeanMLH1 rs1800734 and ERCC2 rs13181 polymorphisms might constitute glioblastoma susceptibility factors
Jin Tian-Bo et al., 2013 [21]China72 (28/44)NR44 ± 15locus-specific PCRYesChinesers12645561 in NEIL3 and rs2291427 in ALOX5 were associated with increased GBM risk
Li Bin et al., 2017 [14]China122 (70/52)46.89NRlocus-specific PCRNRChineseNFIL3, XRCC5, CCDC26, TP53 and IL-4R genes associated with the risk of glioblastoma
Al-Khatib et al., 2020 [22]Jordan84 (60% male)45.4NRlocus-specific PCRYesArabicBRCA1 SNPs rs1799966 and rs799917 are associated with the risk of developing GBM in the Arab Jordanian population
NR: Not Reported.
Table 2. Investigated genes and polymorphisms.
GeneSNPsStudy 123456789101112Total
IL-4Rrs1801275 X X X 3
IL-4Rrs1805015 X 1
CCDC26rs891835 X X 2
CCDC26rs6470745 X 1
GSTP1rs1695 X 1
GSTP1rs947894 X 1
AURKBrs2289590X 1
AURKCrs11084490X 1
STAT5brs2293157 X 1
CHEK2rs2267130 X 1
IL-3rs20541 X 1
IL-10rs1800871 X 1
PARP1rs1136410 X 1
PRKDCrs7003908 X 1
MLH1rs1800734 X 1
ERCC2rs13181 X 1
FLT3rs3829382 X 1
XRCC5rs9288516 X 1
NFIL3rs7021746 X 1
TP53rs1042522 X 1
BRCA1rs799917 X1
EGFRrs9642393 X 1
Study 1: Mesic et al., 2021; Study 2: Liu et al., 2014; Study 3: Custódio et al., 2010; Study 4: Dong et al., 2014; Study 5: Jin Tianbo et al., 2013; Study 6: Wei et al., 2014; Study 7: McKean-Cowdin et al., 2009; Study 8: Schwartzbaum et al., 2005; Study 9: Rodriguez-Hernandez et al., 2013; Study 10: Jin Tian-Bo et al., 2013; Study 11: Li Bin et al., 2017; Study 12: Al-Khatib et al., 2020 [11,12,13,14,15,16,17,18,19,20,21,22].
Table 3. Methodological quality of the studies based on the Newcastle–Ottawa Scale (NOS).
StudiesSelectionItem 2Item 3Item 4ComparabilityItem 1bExposureItem 2Item 3Total Score
Item 1Item 1aItem 1
Mesic et al., 2021 [15] ***** ***8
Liu et al., 2014 [16] *********9
Custódio et al., 2010 [17] *********9
Dong et al., 2014 [18] ******** 8
Jin Tianbo et al., 2013 [11] *********9
Wei et al., 2014 [12] ***** ***8
McKean-Cowdin et al., 2009 [19] *********9
Schwartzbaum et al., 2005 [13] ***** ***8
Rodriguez-Hernandez et al., 2013 [20] ***** ***8
Jin Tian-Bo et al., 2013 [21] ***** ** 7
Li Bin et al., 2017 [14] ***** ** 7
Al-Khatib et al., 2020 [22] ***** ** 7
* Selection—Item 1: Is the case definition adequate?; Item 2: Representativeness of the cases; Item 3: Selection of controls; Item 4: Definition of controls. Comparability—Item 1a and 1b: Comparability of cases and controls based on the design or analysis. Exposure—Item 1: Ascertainment of exposure; Item 2: Same method of ascertainment for cases and controls; Item 3: Non-response rate.
Table 4. The quality of reporting using the Strengthening the Reporting of Genetic Association (STREGA) guideline.
StudiesDescription of Genotyping Methods and ErrorsDescription of Modeling Population StratificationDescription of Modeling Haplotype VariationHardy-Weinberg Equilibrium Was ConsideredStatement of Whether the Study is the First Report of a Genetic Association a Replication Effort, or BothScore
Genotyping Methods and PlatformsError Rates and Call RatesGenotyping in BatchesLaboratory/Center Where the Genotyping Was DoneThe Numbers of Individuals Was Successful Genotyping
Mesic et al., 2021 [15]YesYesNoYesYesYesYesYesYes8
Liu et al., 2014 [16]YesYesNoYesYesYesNoYesYes7
Custódio et al., 2010 [17] YesNoNoYesYesYesNoYesYes6
Dong et al., 2014 [18]YesNoNoYesYesYesNoYesYes6
Jin Tianbo et al., 2013 [11]YesYesNoYesYesYesNoYesYes7
Wei et al., 2014 [12]YesNoNoYesYesYesYesYesYes7
McKean-Cowdin et al., 2009 [19]YesYesNoYesYesYesYesYesYes8
Schwartzbaum et al., 2005 [13]YesYesNoYesYesNoNoNoNo4
Rodriguez-Hernandez et al., 2013 [20]YesNoNoYesYesYesYesYesYes7
Jin Tian-Bo et al., 2013 [21]YesYesNoYesYesNoNoYesYes6
Li Bin et al., 2017 [14]YesNoNoYesYesYesNoYesYes6
Al-Khatib et al., 2020 [22]YesNoNoYesNoNoNoYesYes4
Disclaimer/Publisher’s Note: The statements, opinions and data contained in all publications are solely those of the individual author(s) and contributor(s) and not of MDPI and/or the editor(s). MDPI and/or the editor(s) disclaim responsibility for any injury to people or property resulting from any ideas, methods, instructions or products referred to in the content.