
Prostate MRI Using Deep Learning Reconstruction in Response to Cancer Screening Demands—A Systematic Review and Meta-Analysis

 , , , ,
  ,
,
Abstract
1. Introduction
2. Materials and Methods
3. Results
3.1. Risk of Bias Assessment
3.2. Deep Learning Reconstruction
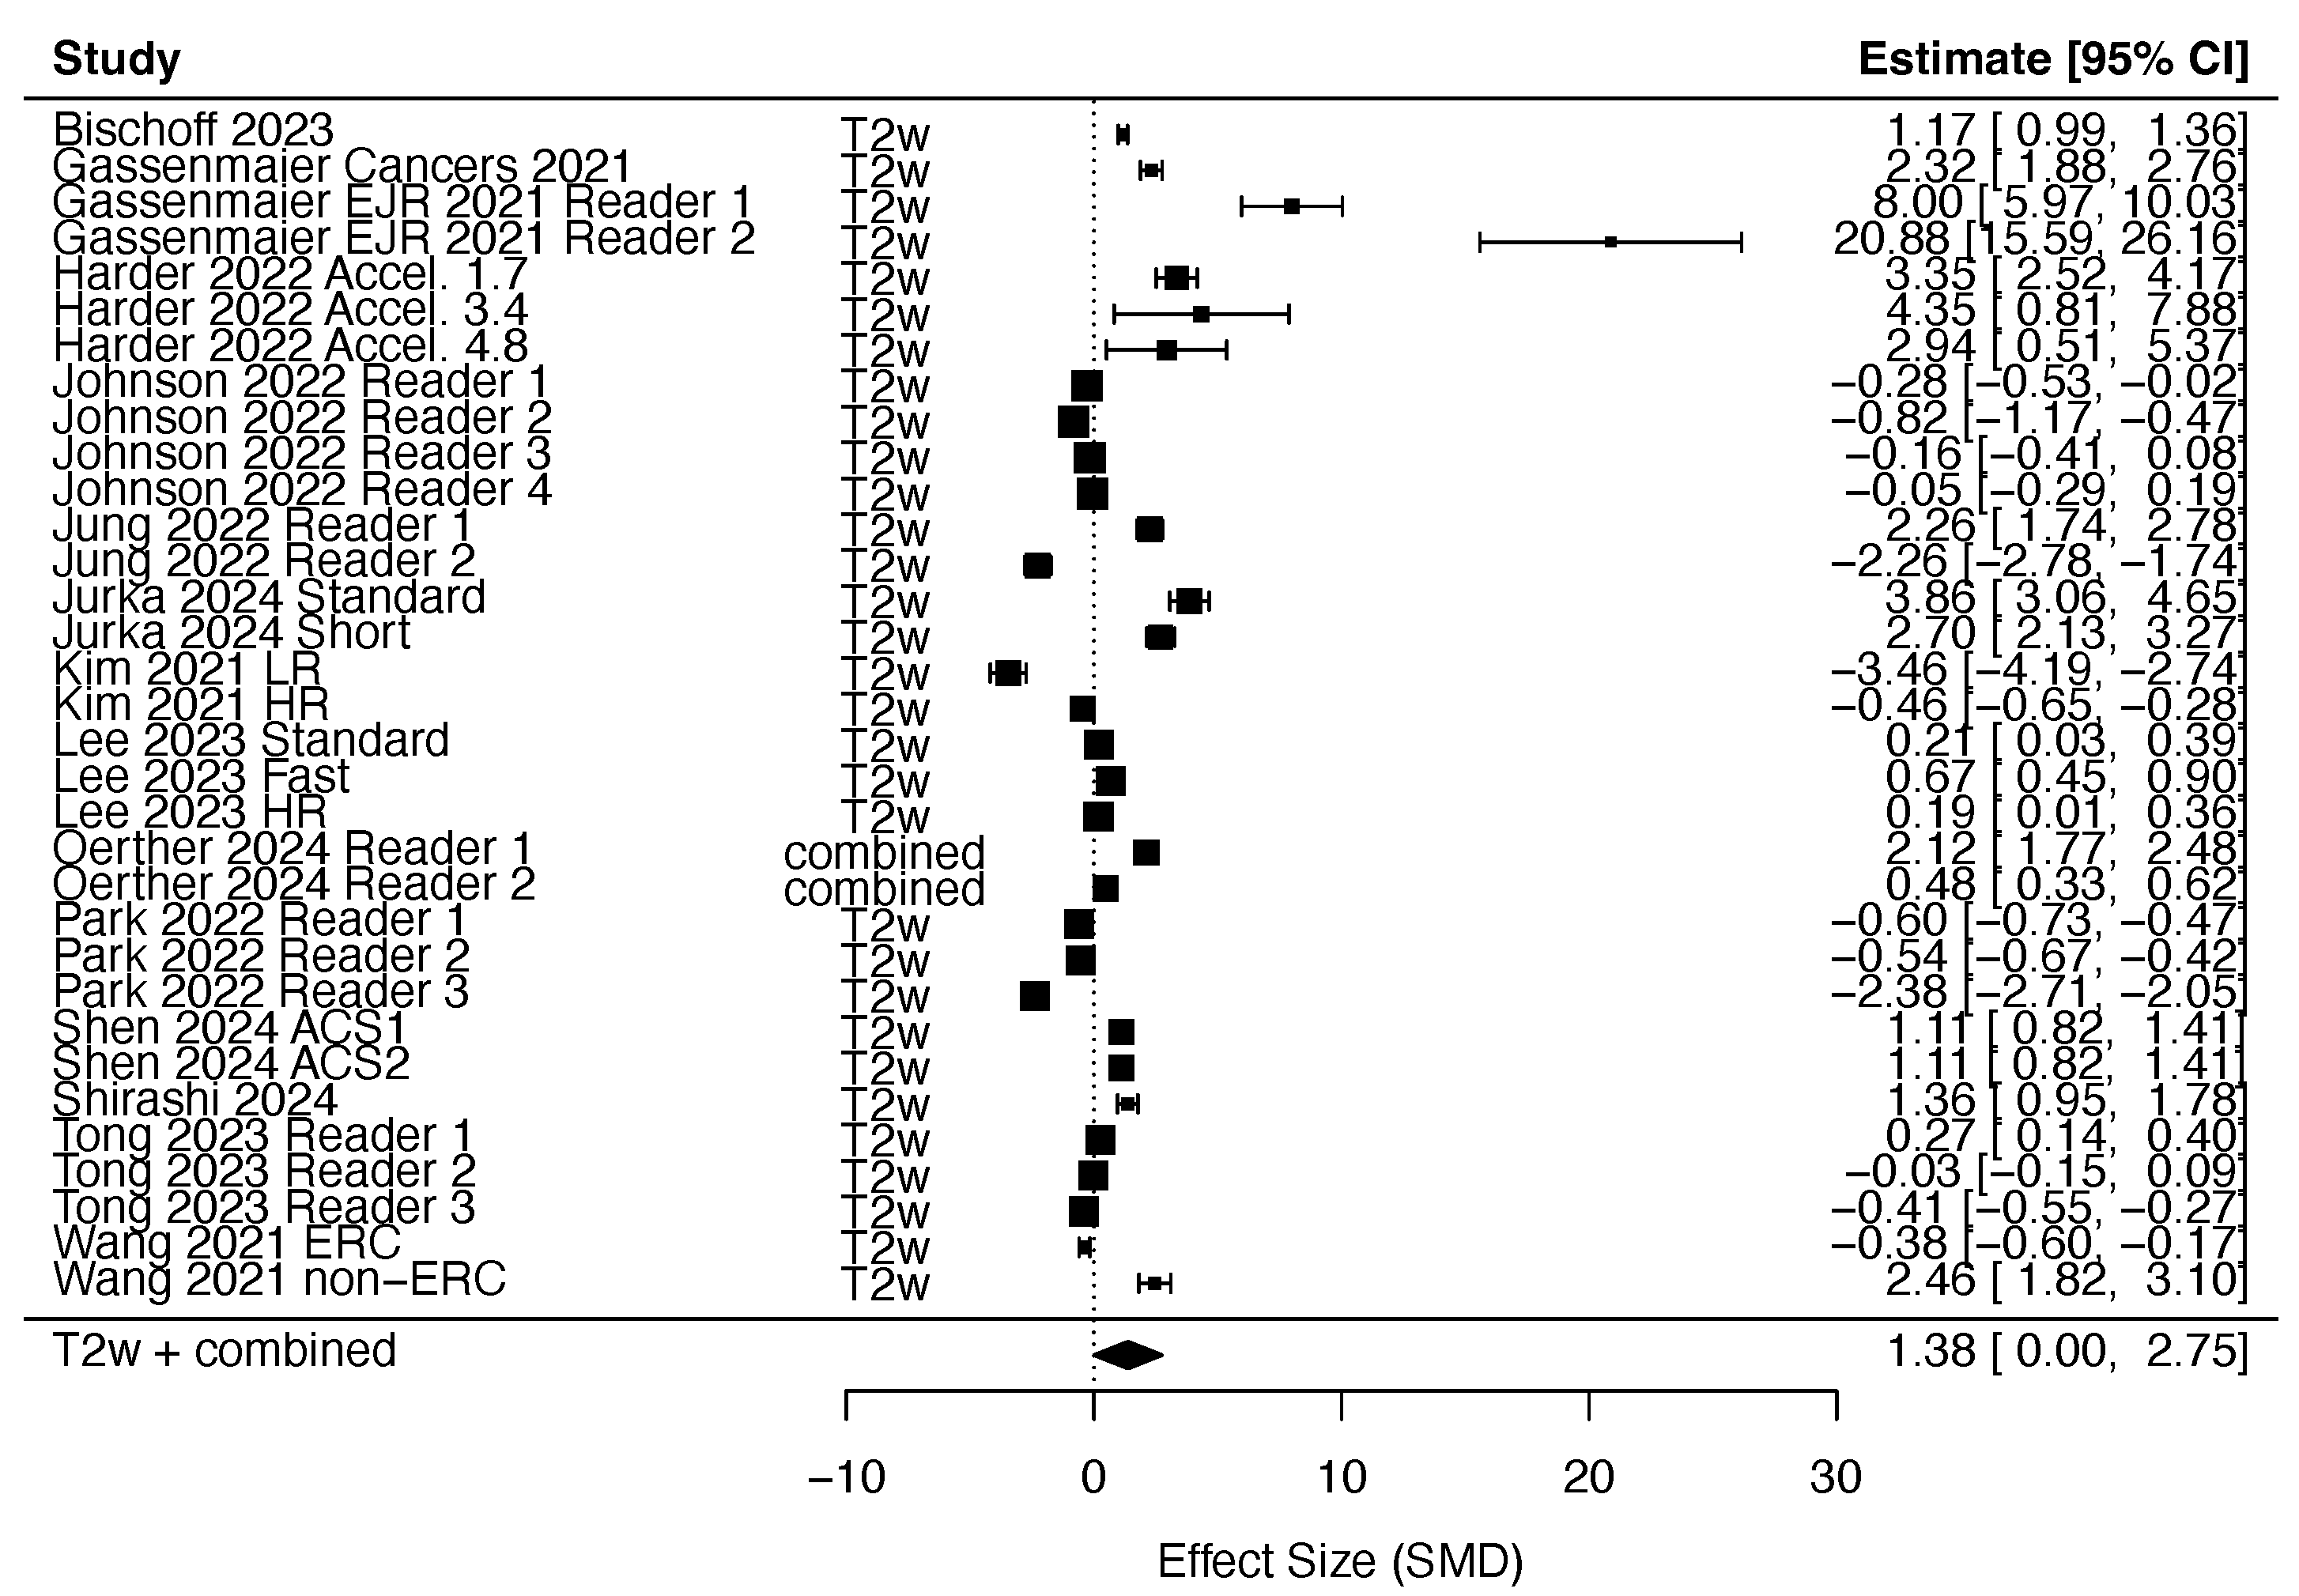
3.2.1. DLR in T2w Imaging
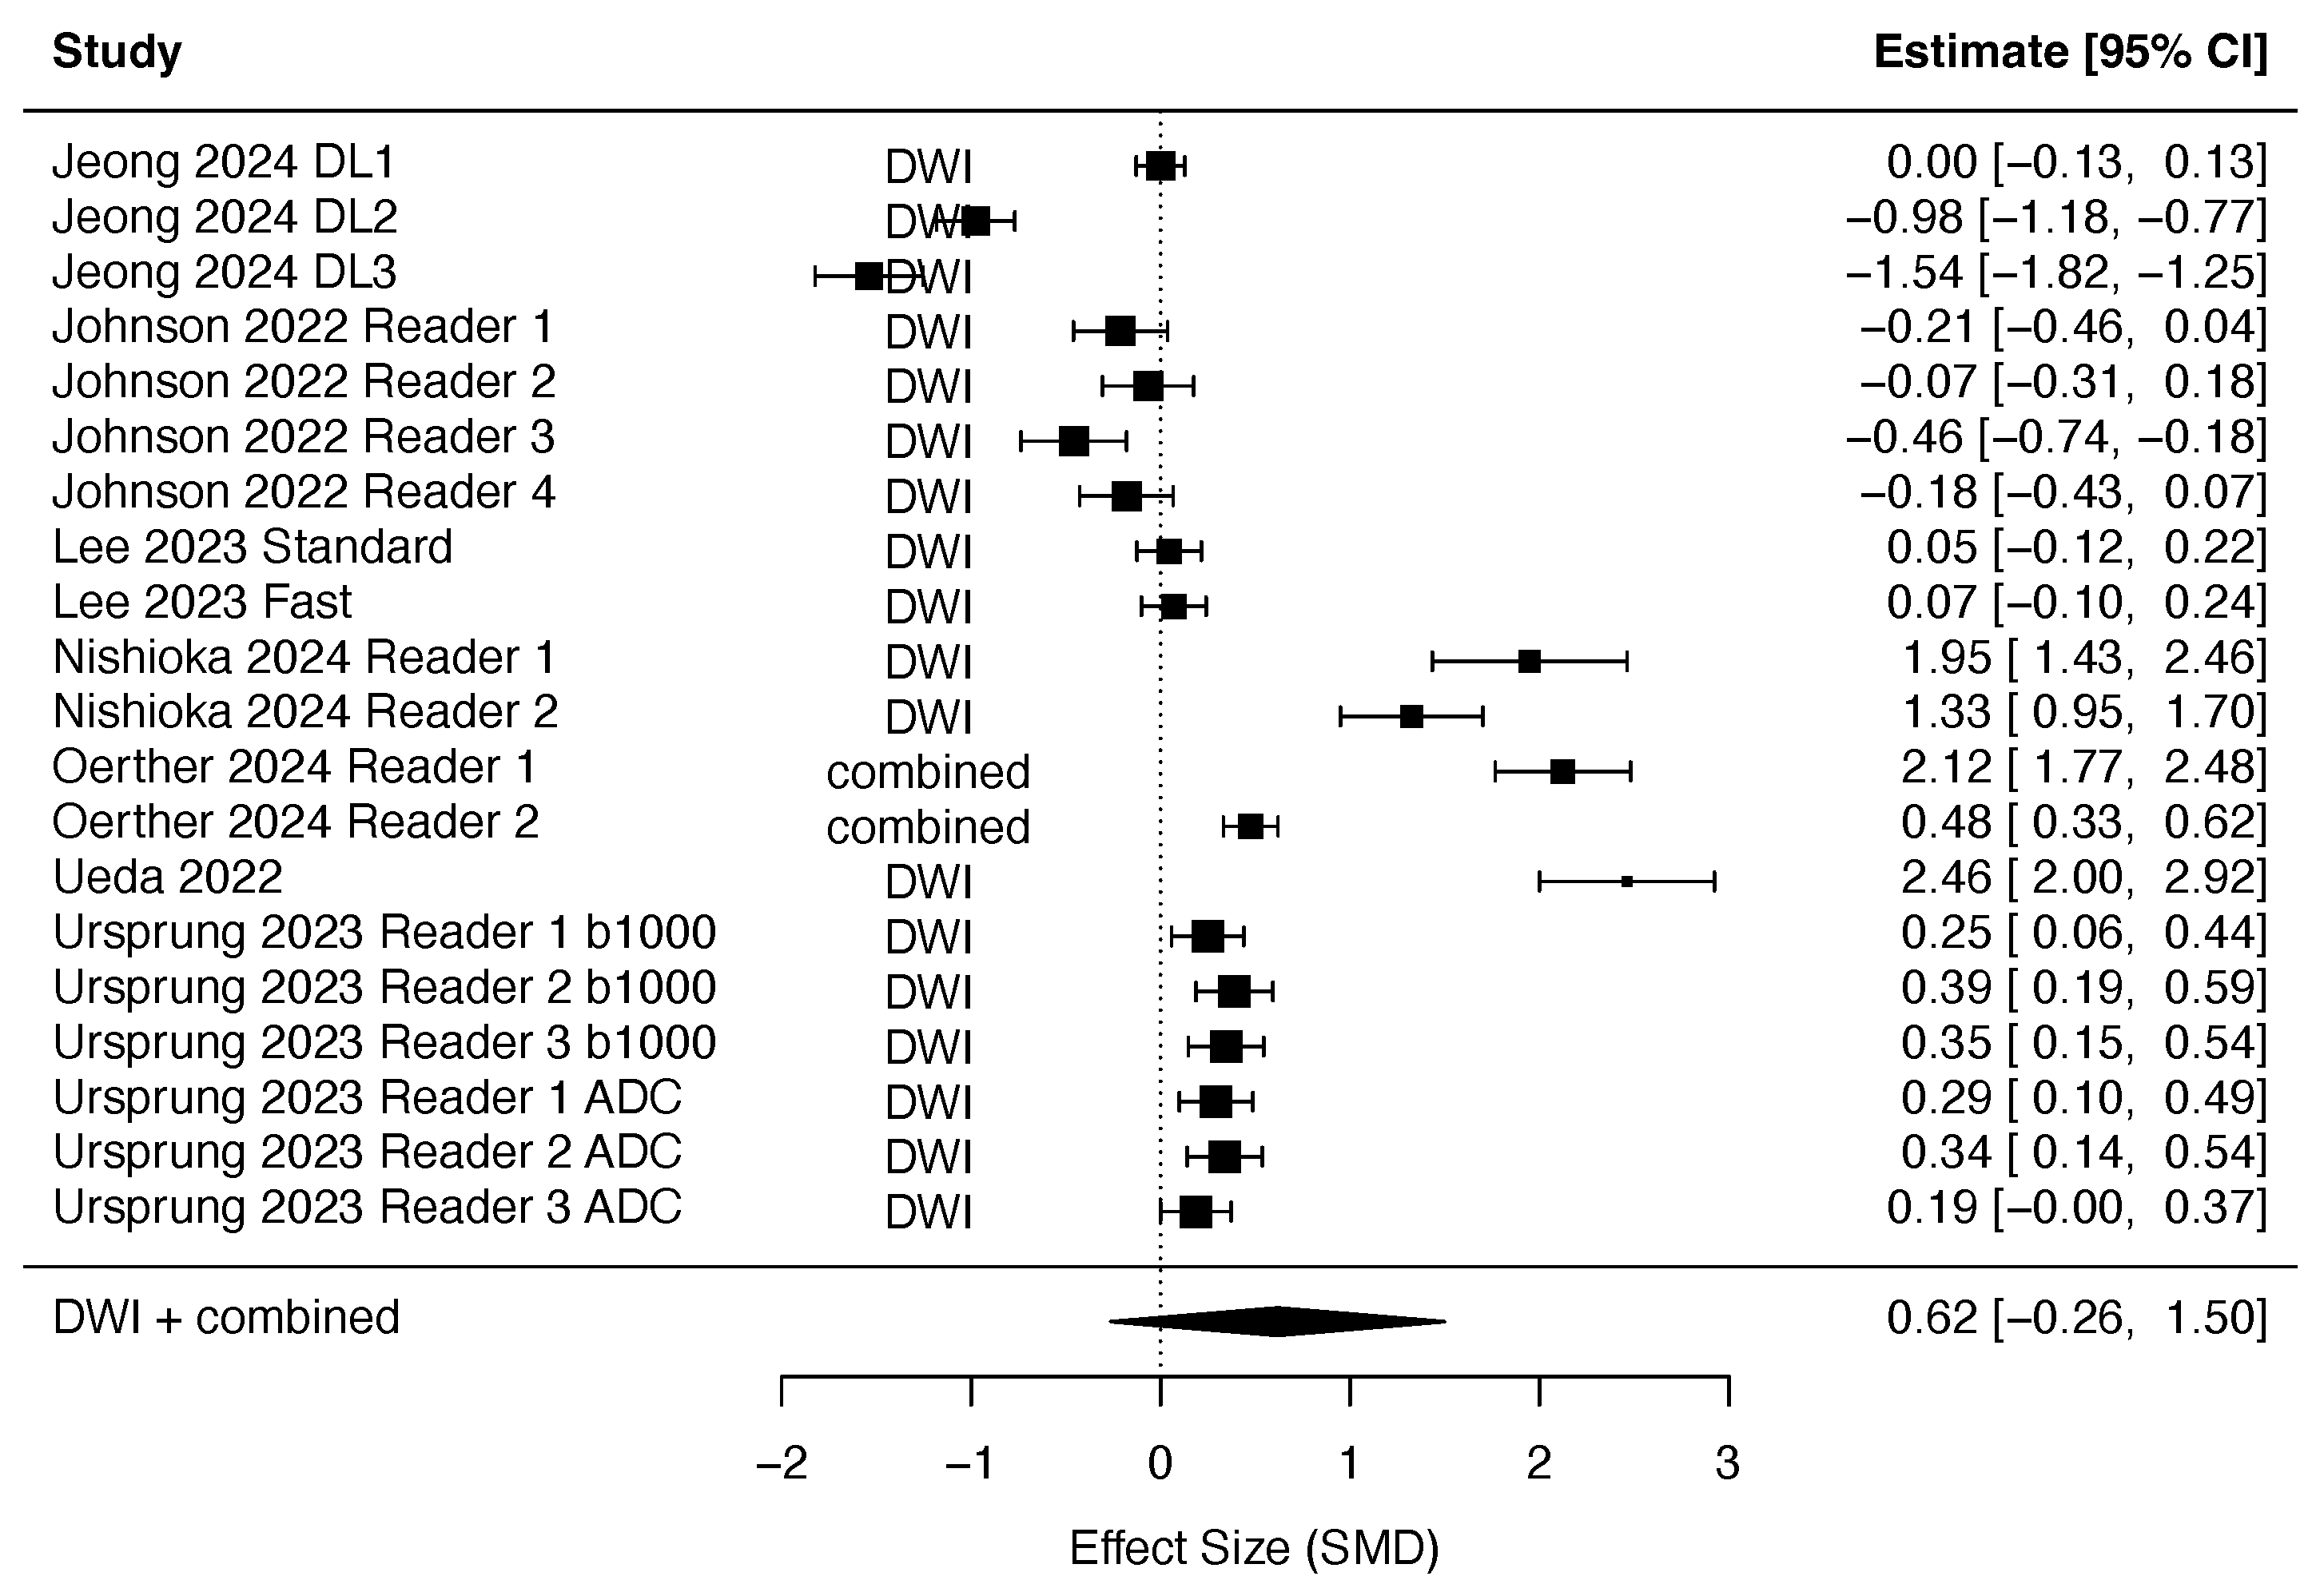
3.2.2. DLR in Diffusion-Weighted Imaging
3.2.3. DLR in AI-Accelerated Screening/Diagnostic Protocols
3.2.4. DLR in PI-RADS Assessment
3.3. Methods for Image Quality Assessment
3.3.1. Objective Image Quality Metrics
3.3.2. Subjective Image Quality Metrics
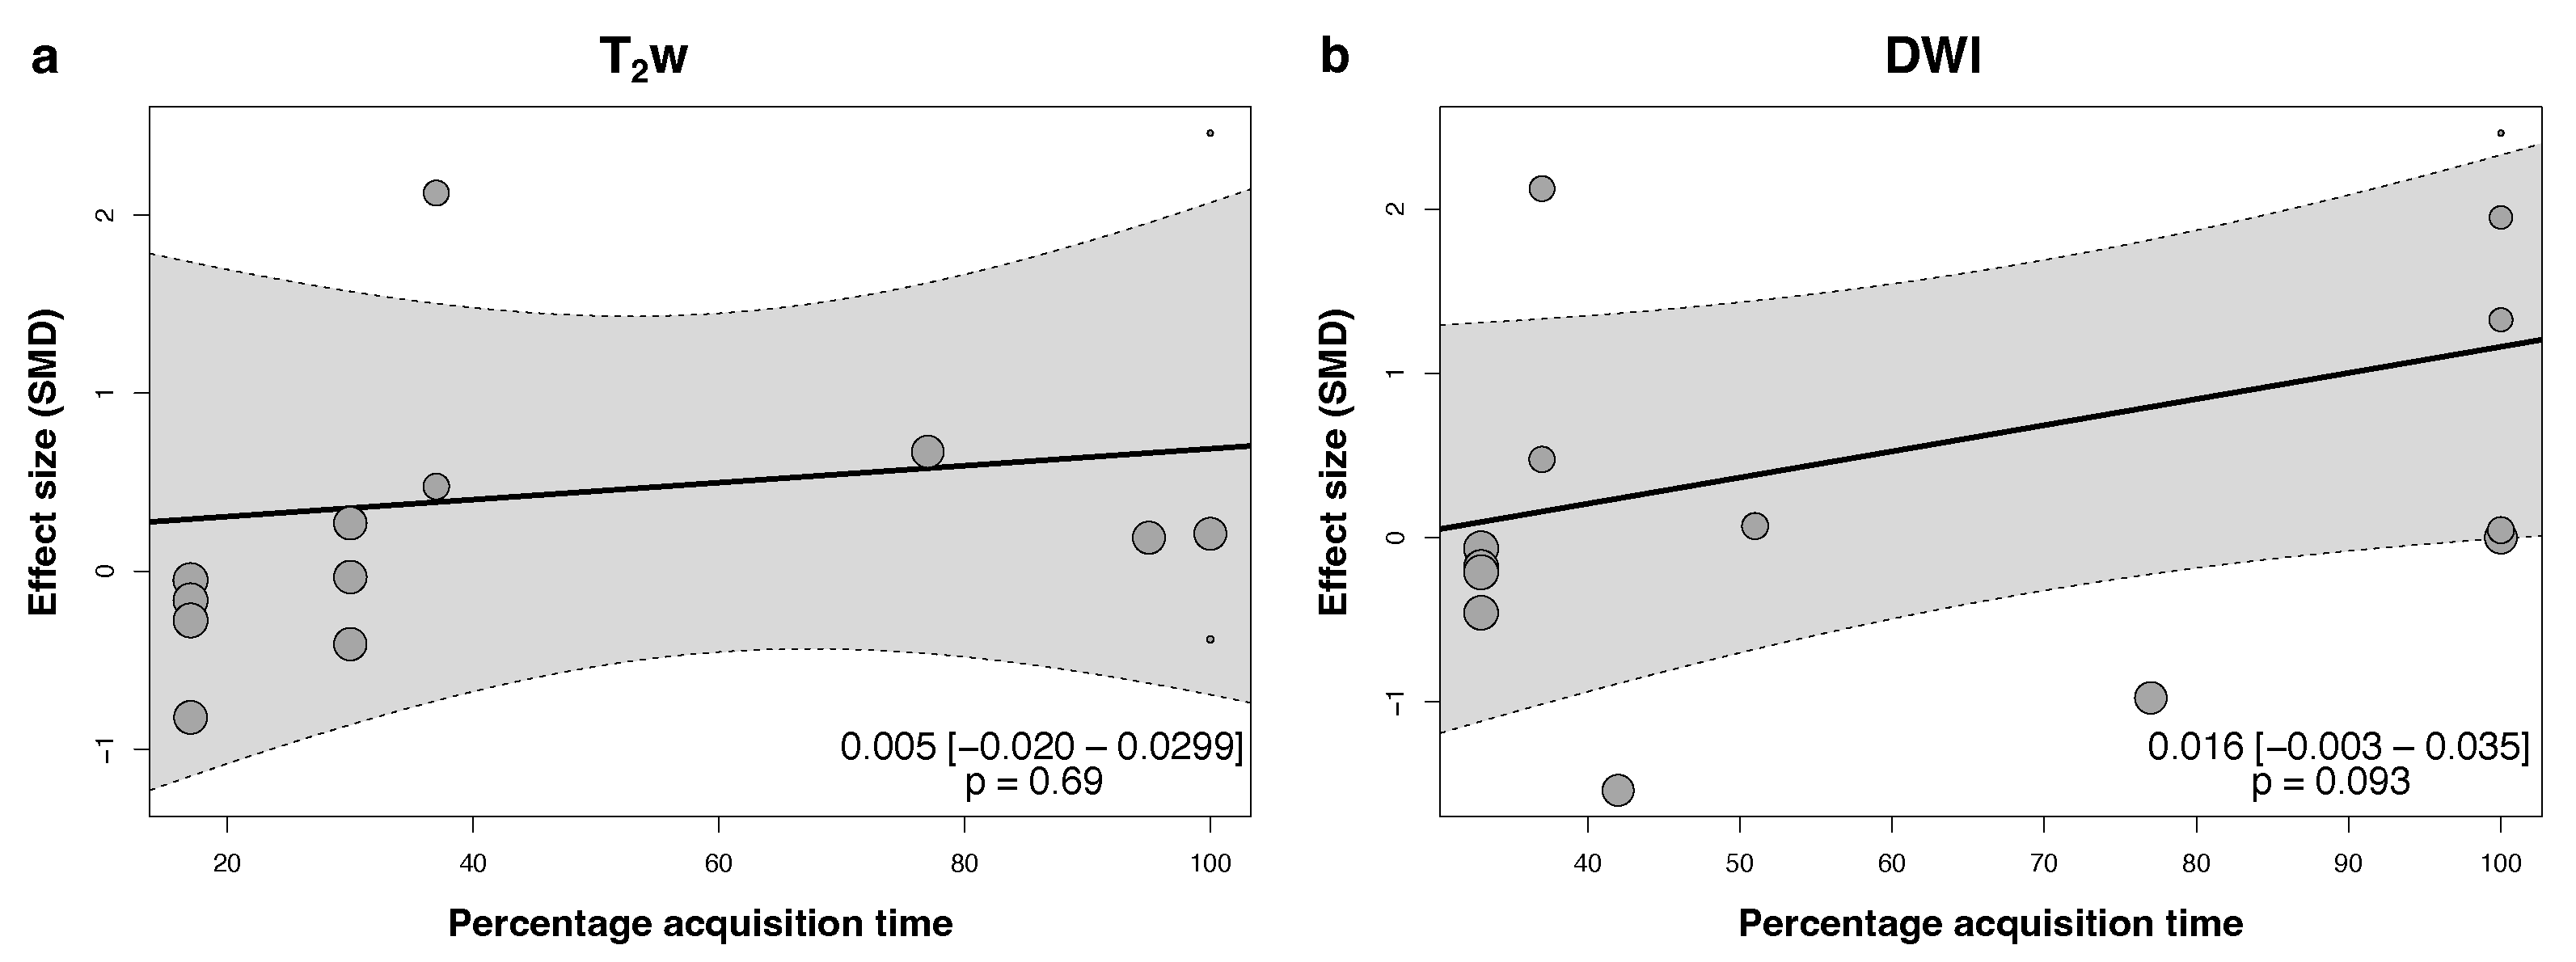
3.4. Quantitative Synthesis
4. Discussion
4.1. Benefits of DLR
4.2. Risks of DLR
4.3. Effect of DLR on PI-RADS Assessment and Downstream Clinical Tasks
4.4. Effect of DLR on Diagnostic AI
4.5. Heterogeneity in the Evaluation of DLR Image Quality
4.6. DLR Beyond Diagnosis
4.7. Limitations
4.8. Summary and Recommendations
- Non-accelerated DLR improves the subjective and objective image quality of T2w sequences, with maintained quality at 3-fold and stronger acceleration.
- DLR achieves a higher SNR in DWI sequences.
- Diagnostic AI performs invariably less well on DLR images, even if objective and subjective image quality metrics were higher.
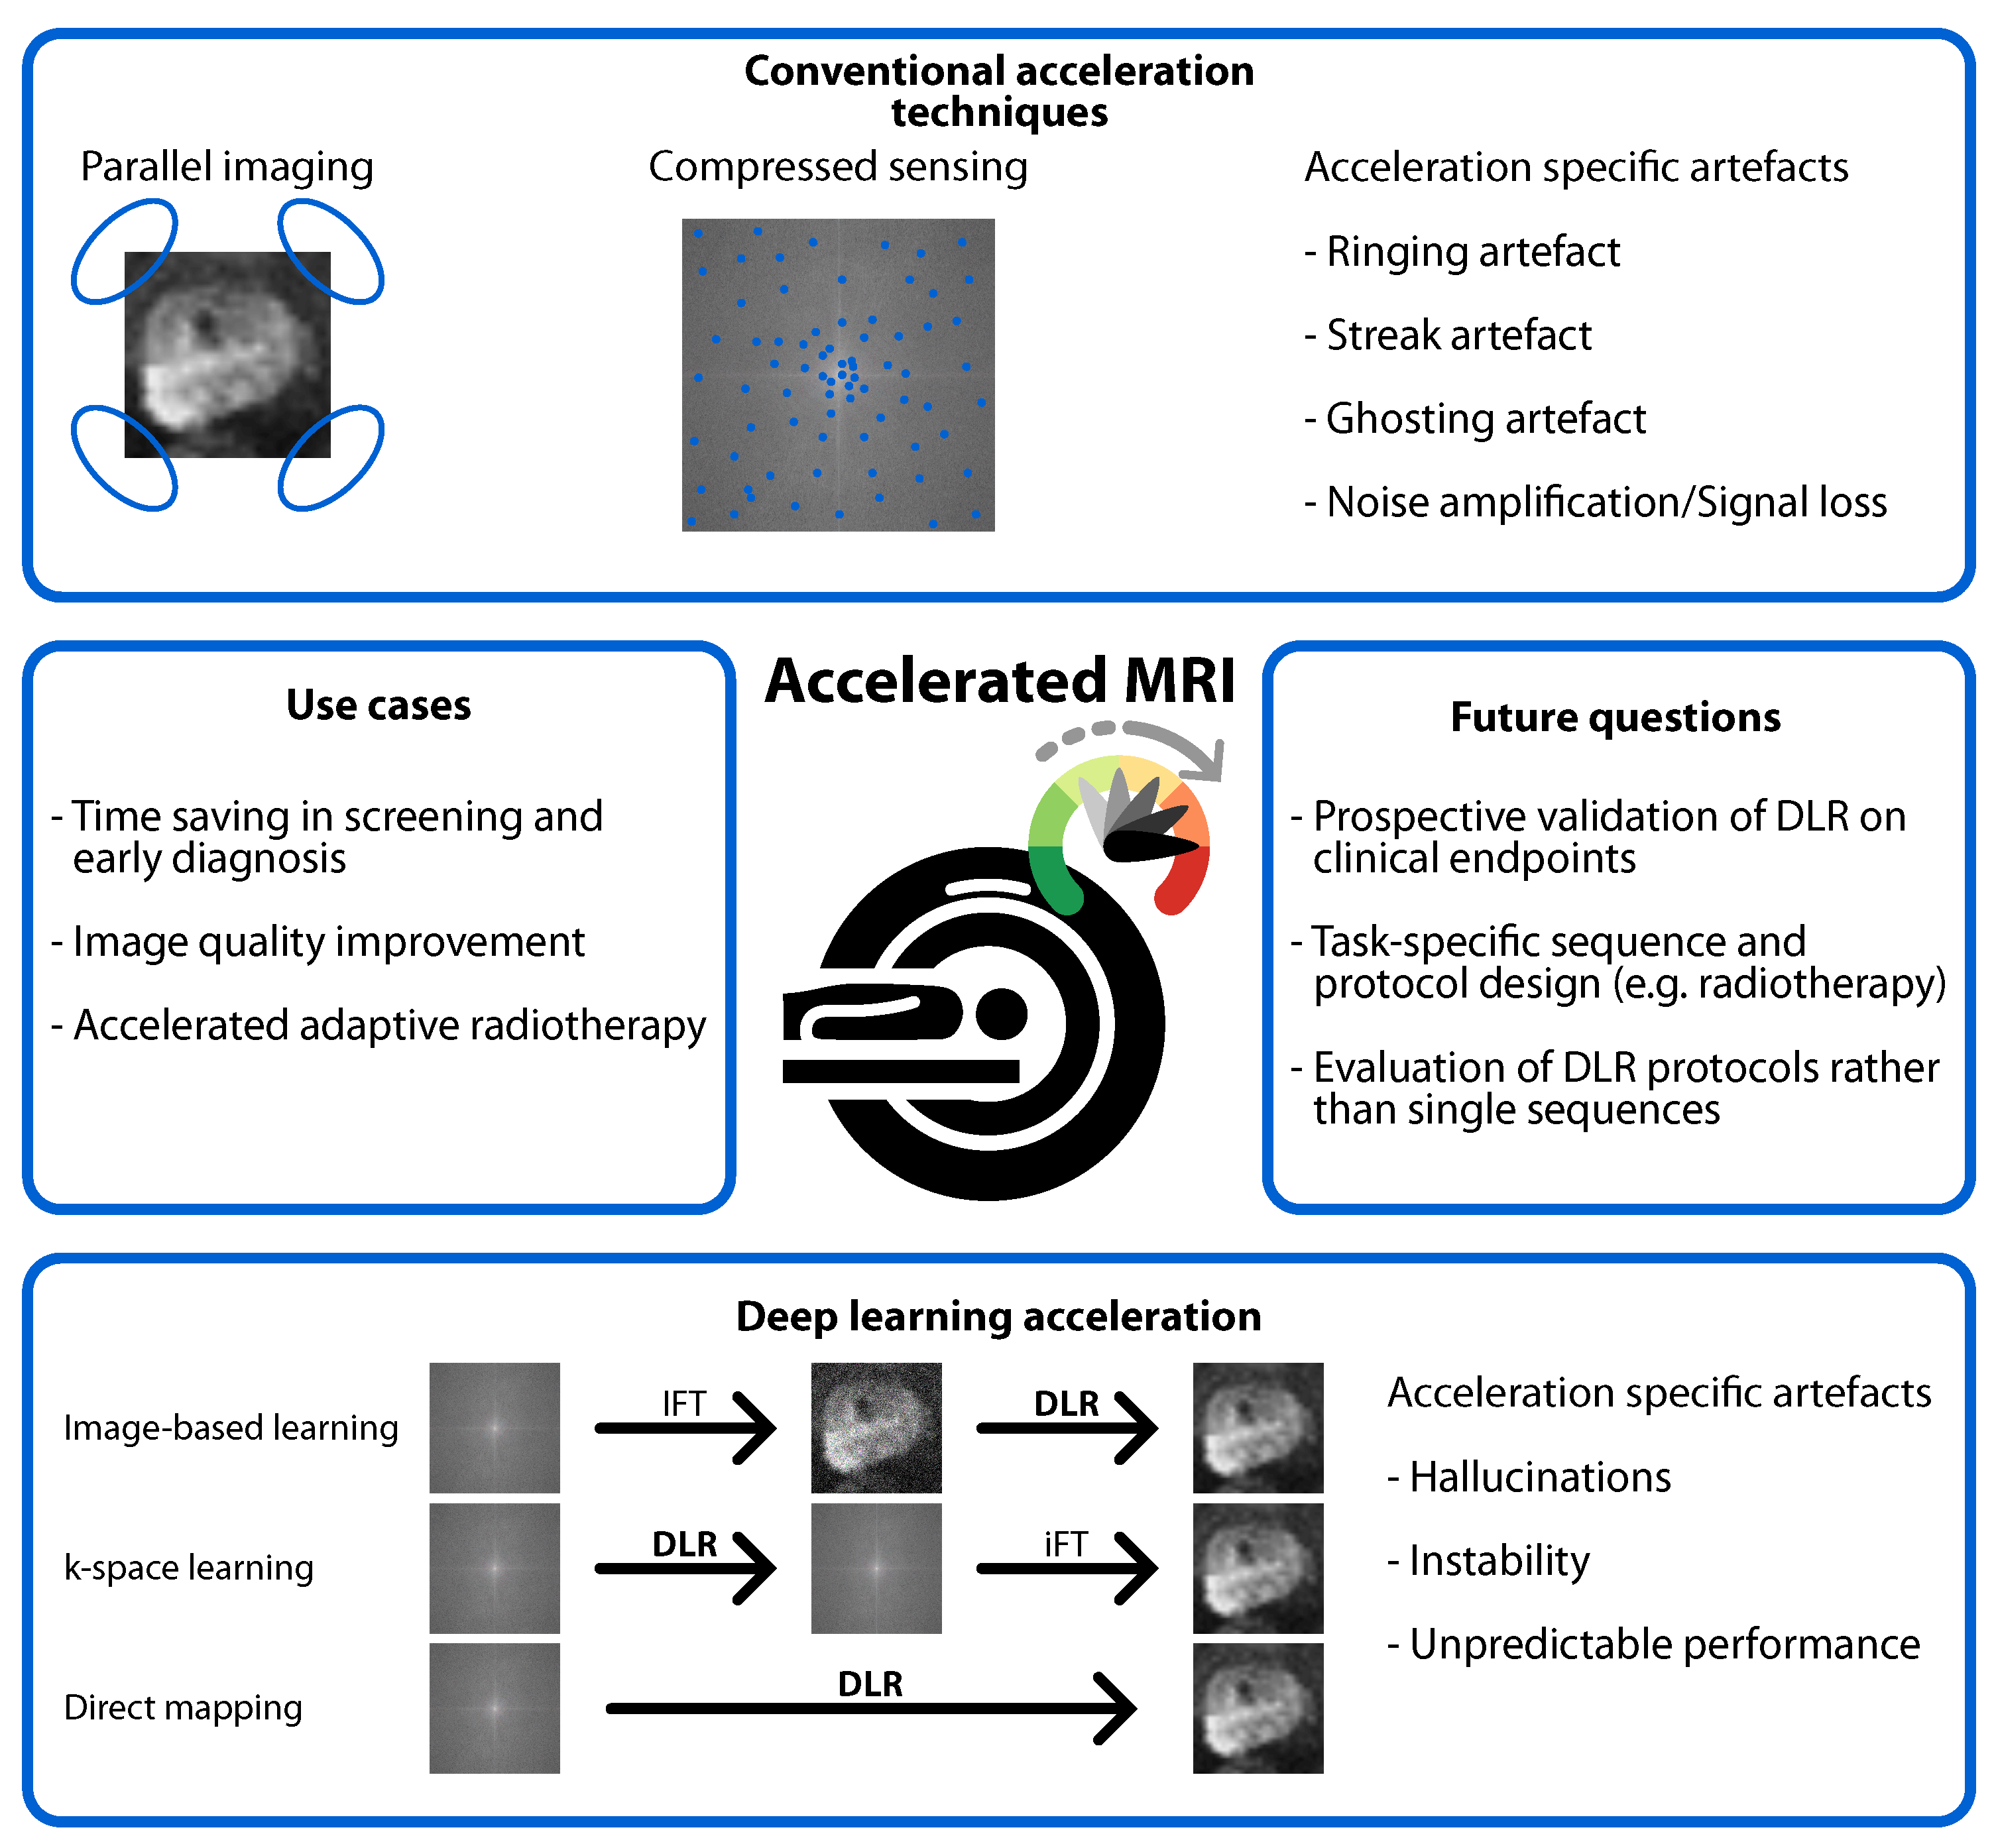
- DLR may reduce acquisition times without a loss in image quality.
- PI-RADS scoring is comparable between conventional and DLR sequences.
- Bi-parametric DLR protocols show similar diagnostic accuracy in small study cohorts.
- Common image quality metrics include no-reference and fully-referenced metrics (structural similarity index, peak SNR, and root mean square error).
- Subjective image quality metrics assess overall image quality, noise, artifacts, sharpness, conspicuity of structures, and diagnostic confidence.
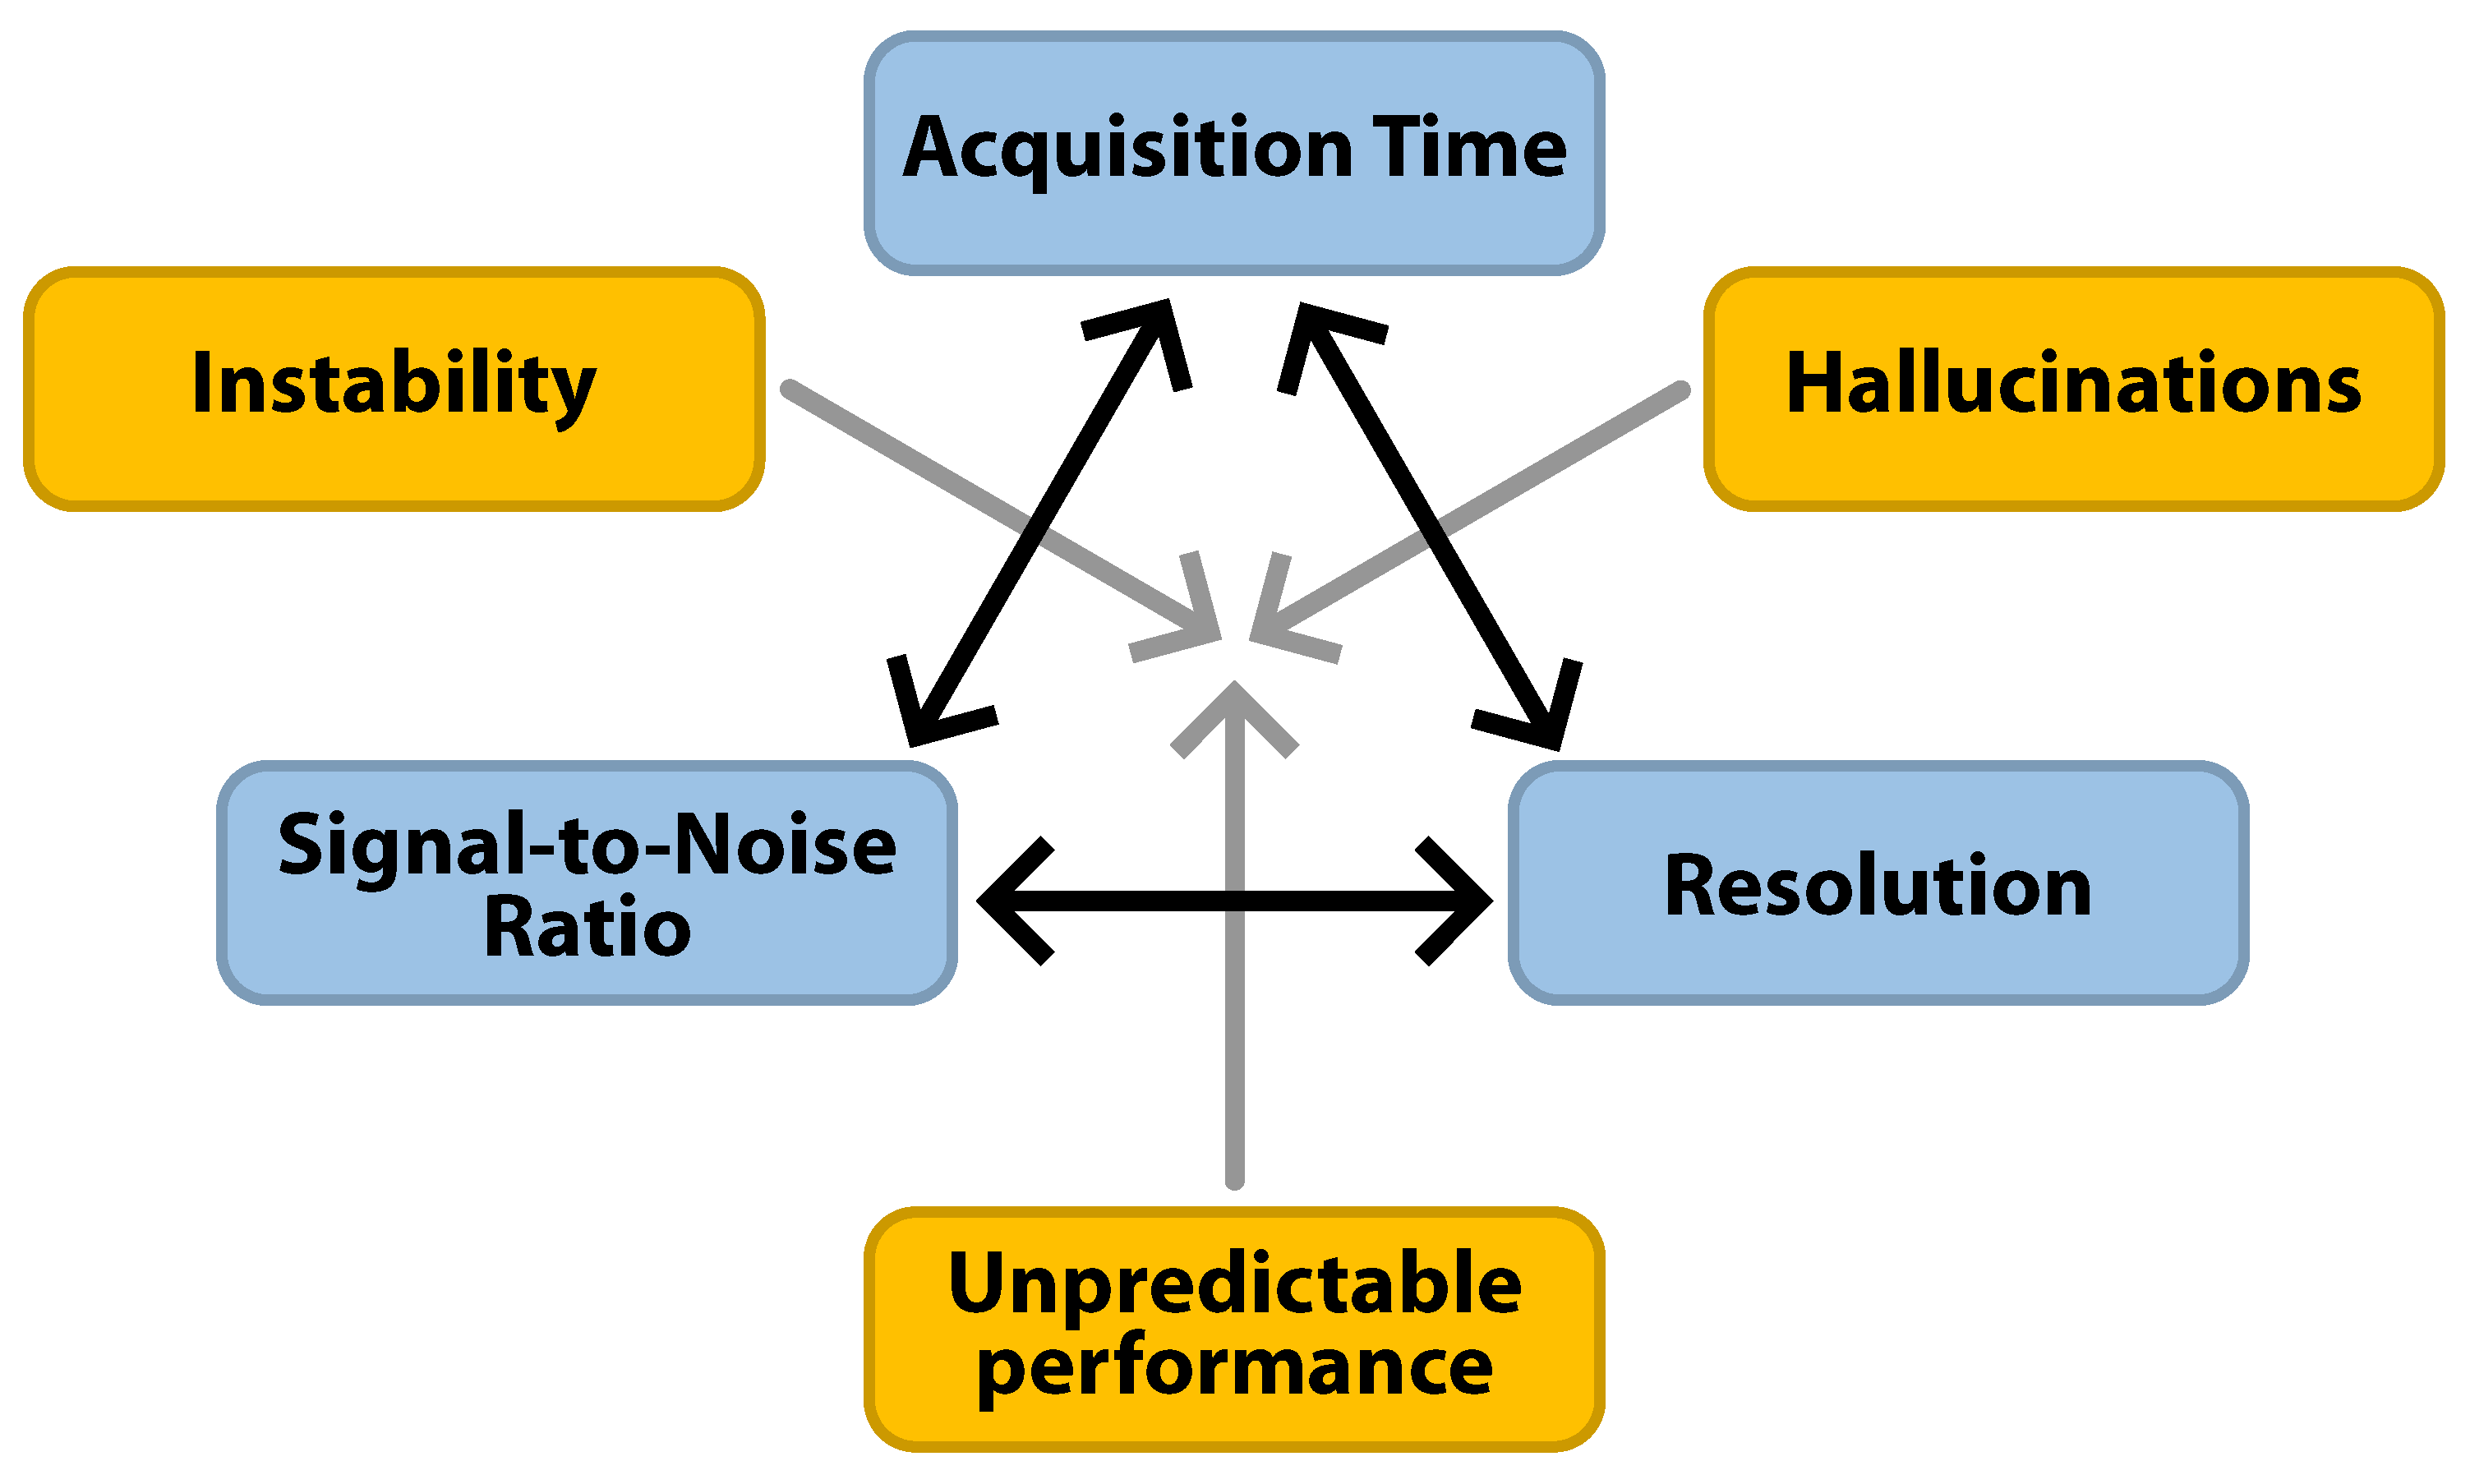
- Stronger acceleration increases the risk of hallucinations and instability.
- Perfect accuracy, stability, and hallucination-free reconstructions are not achievable with DLR, requiring caution in clinical implementation.
- Select the acceleration factor of DLR judiciously to balance the desired acquisition time savings with the risk of hallucinations and instability [56].
- Implement deep learning image reconstruction in coordination with the entire clinical team, including referring physicians if necessary, e.g., by means of side-by-side review sessions.
- Adapt DLR to the specific clinical context. The trade-off between image quality and acquisition time may vary between use cases [52].
- Monitor diagnostic performance and biopsy yield, especially when biopsy decision making transitions from conventional to DLR sequences [21].
- Implement DLR in a step-wise fashion rather than full DLR protocols.
- Implement DLR in addition to conventional sequences initially and while fine-tuning sequence parameters to achieve the desired diagnostic quality.
- Fully replace secondary sequences (coronal and sagittal T2w, axial T1w and DCE) before replacing axial T2w and DWI.
- Standardize parameters for image quality assessment or find a consensus on which one should be used.
- Investigate the effect DLR would have had on biopsy decisions in patients undergoing conventional and DLR imaging.
- Perform a comparative analysis of diagnostic AI using conventional and DLR-acquired images to assess consistency and potential performance shifts.
- Record the use of DLR in reports to facilitate audits and AI monitoring.
5. Conclusions
Author Contributions
Funding
Institutional Review Board Statement
Informed Consent Statement
Data Availability Statement
Conflicts of Interest
Abbreviations
| ADC | Apparent diffusion coefficient |
| AI | Artificial intelligence |
| CNR | Contrast-to-noise ratio |
| CS | Compressed sensing |
| DLR | Deep learning reconstruction |
| DWI | Diffusion-weighted imaging |
| EPE | Extra-prostatic extension |
| IFT | Inverse Fourier transform |
| IQR | Interquartile range |
| (mp)MRI | (multi-parametric) Magnetic resonance imaging |
| PCa | Prostate cancer |
| PI | Parallel imaging |
| PI-RADS | Prostate imaging reporting and data system |
| PSA | Prostate-specific antigen |
| SNR | Signal-to-noise ratio |
| T2w | T2-weighted |
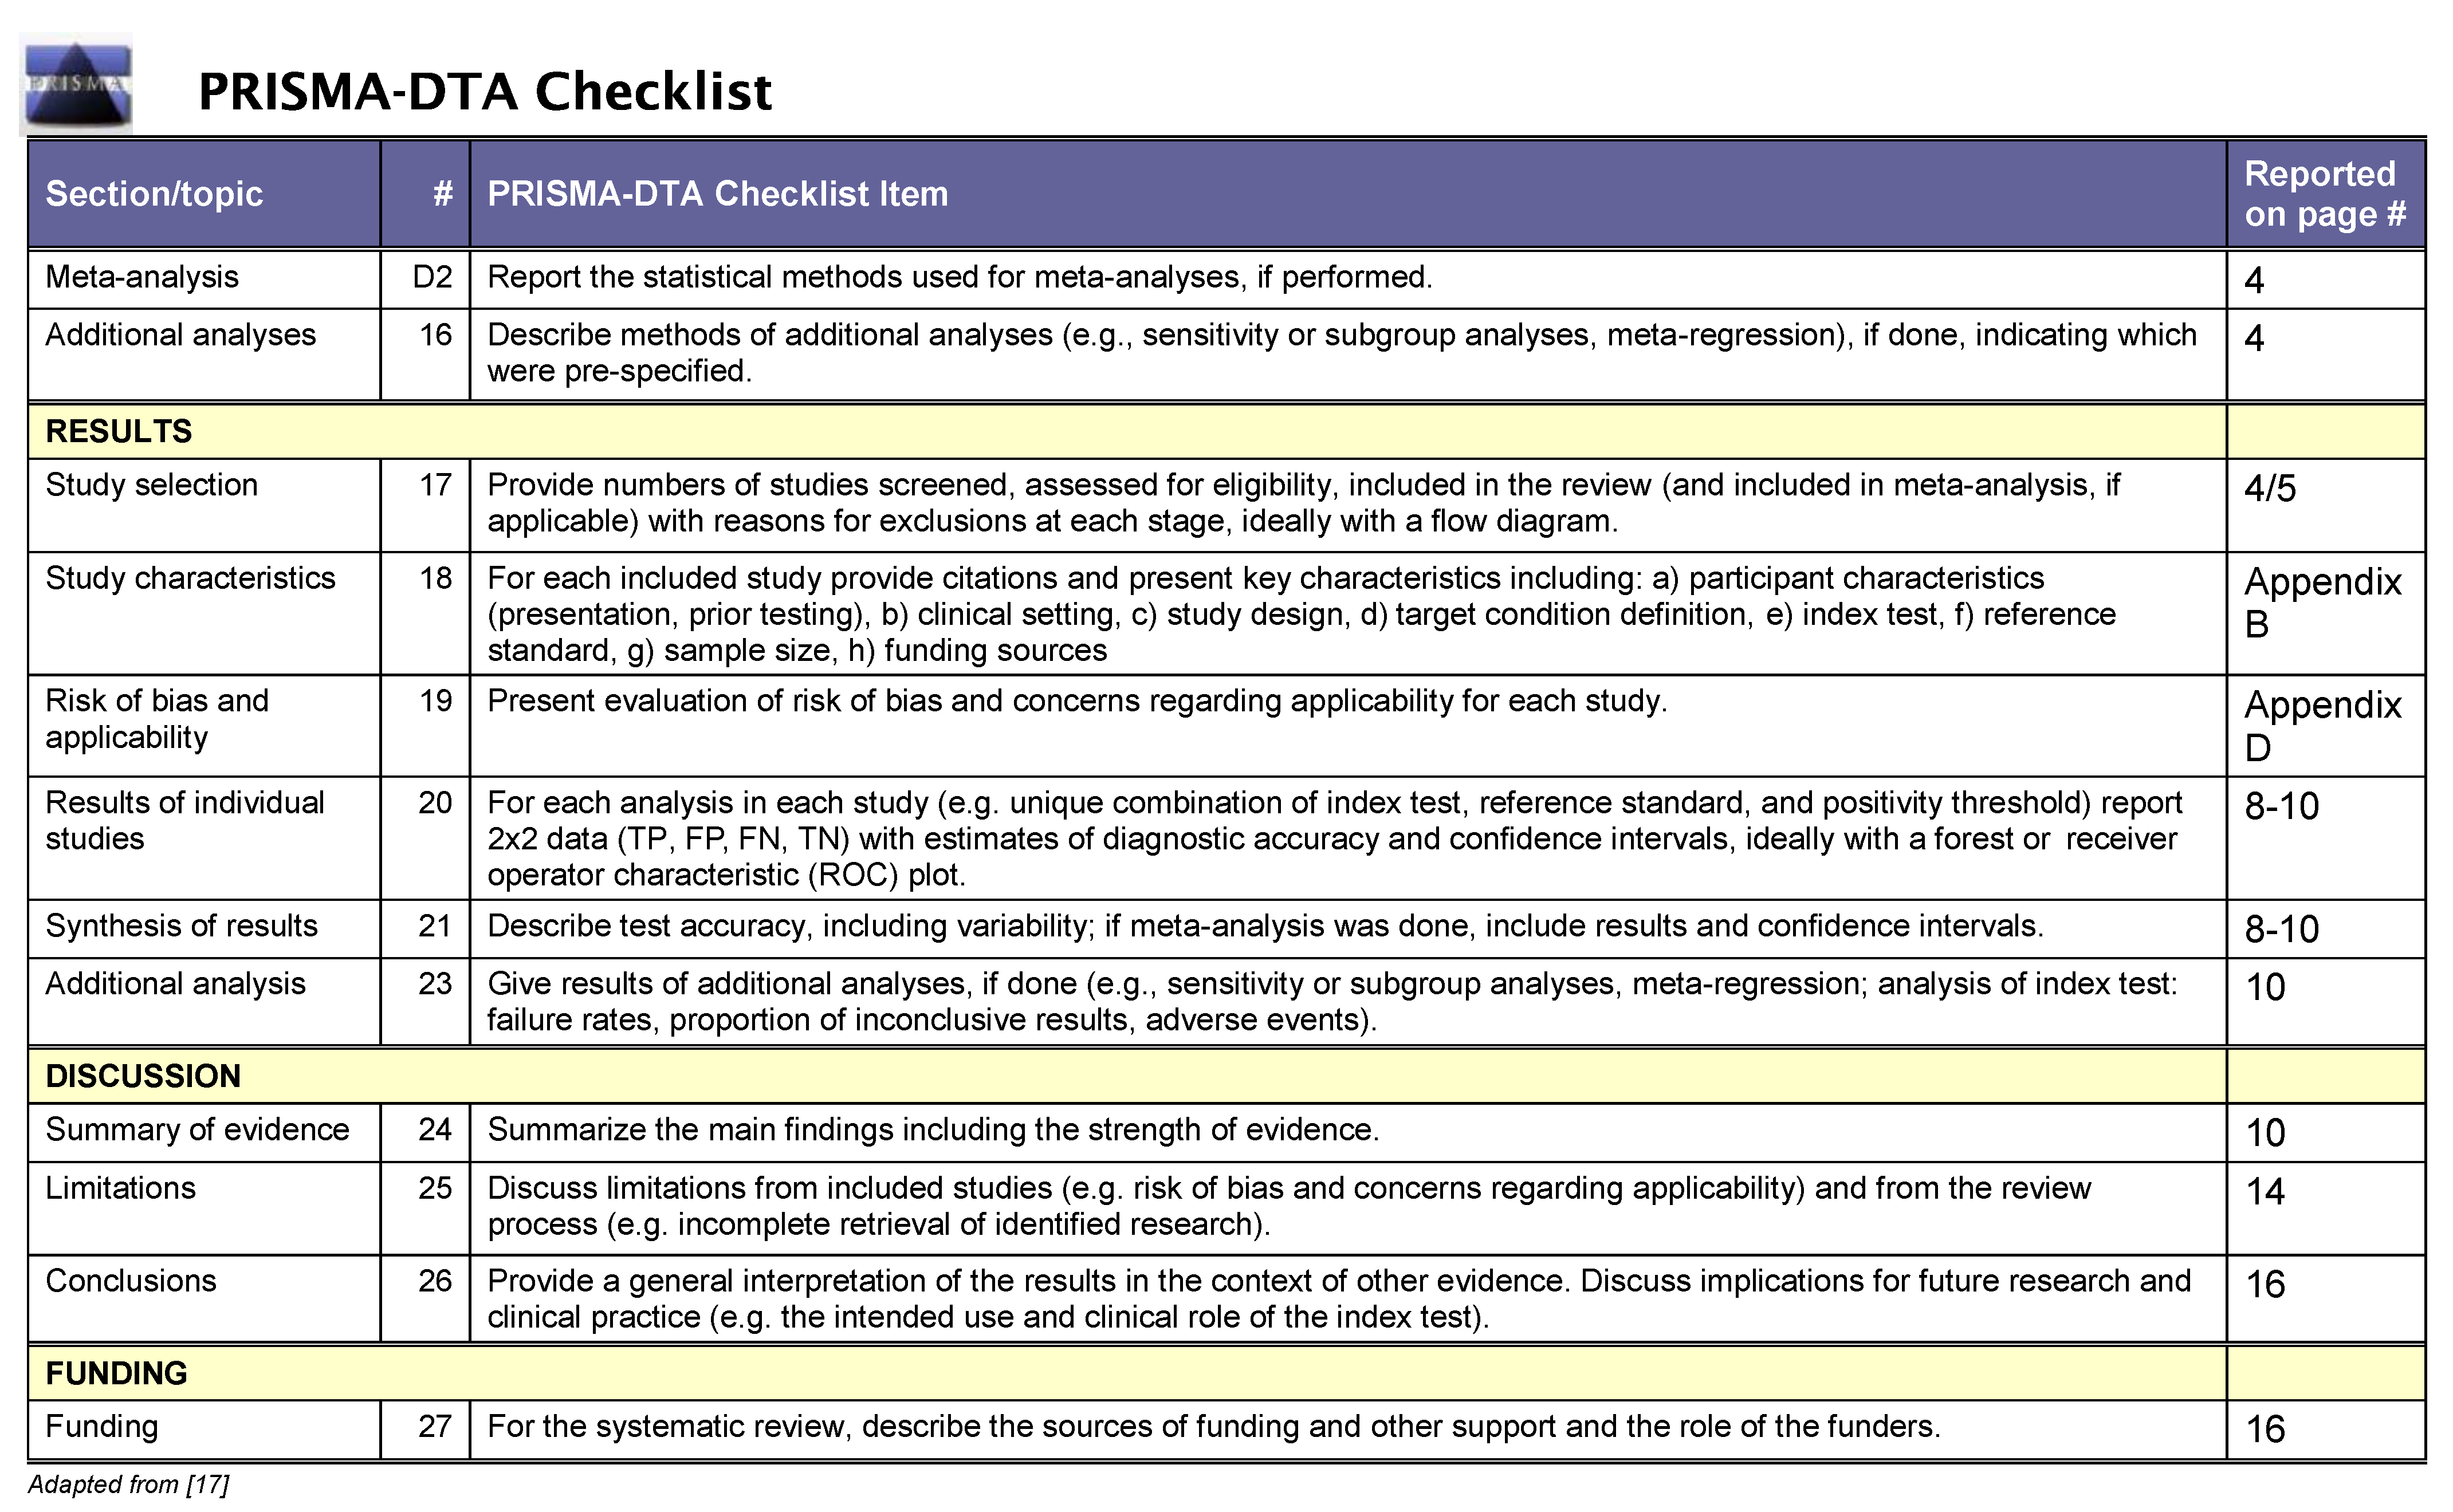
Appendix A. PRISMA Checklist

Appendix B. Data Extraction Instrument

| # | First Author | Journal | Year | Vendor | Field Strength |
|---|---|---|---|---|---|
| 1 | Belue | European Journal of Radiology | 2024 | Philips | 3 |
| 2 | Bischoff | Radiology | 2023 | Philips | 3 |
| 3 | Boschheidgen | Magnetic Resonance Imaging | 2025 | Siemens | 3 |
| 4 | Cochran | Clinical Imaging | 2025 | GE | 3 |
| 5 | Gassenmaier | Cancers | 2023 | Siemens | 3 |
| 6 | Gassenmaier | European Journal of Radiology | 2021 | Siemens | 3 |
| 7 | Gassenmaier | Cancers | 2021 | Siemens | 3 |
| 8 | Harder | Cancers | 2022 | Philips | 3 |
| 9 | Hu | Frontiers in Oncology | 2021 | Siemens | 3 |
| 10 | Jeong | Quantitative imagin in medicine and surgery | 2024 | Siemens | 3 |
| 11 | Johnson | Journal of Magnetic Resonance Imaging | 2022 | Siemens | 3 |
| 12 | Jung | British Journal of Radiology | 2022 | Siemens | 3 |
| 13 | Jurka | Quantitative imagin in medicine and surgery | 2024 | Philips | 3 |
| 14 | Kaye | Radiology: Artificial Intelligence | 2020 | GE | 3 |
| 15 | Kim | Cancers | 2024 | GE | 3 |
| 16 | Kim | Nature Scientifc Reports | 2024 | Siemens | 3 |
| 17 | Kim | European Journal of Radiology | 2021 | Siemens | 3 |
| 18 | Lee | European Journal of Radiology | 2023 | GE | 3 |
| 19 | Liu | Journal of Digital Imaging | 2021 | Siemens | 3 |
| 20 | Nishioka | European Journal of Radiology Open | 2024 | Philips | 3 |
| 21 | Oerther | European Radiology | 2024 | Siemens | 3 |
| 22 | Park | Journal of Magnetic Resonance Imaging | 2022 | GE | 3 |
| 23 | Pfaff | Nature Scientifc Reports | 2024 | Siemens | 0.55, 1.5 and 3 |
| 24 | Riederer | Abdominal Radiology | 2024 | GE | 3 |
| 25 | Sato | Radiological Physics and Technology | 2024 | Canon | 1.5 |
| 26 | Shen | Academic Radiology | 2024 | United Imaging | 3 |
| 27 | Shirashi | Magnetic Resonance Imaging | 2024 | Canon | 3 |
| 28 | Tong | Journal of Magnetic Resonance Imaging | 2023 | Siemens | 3 |
| 29 | Ueda | Radiology | 2022 | Canon | 3 |
| 30 | Ursprung | European Journal of Radiology | 2023 | Siemens | 3 |
| 31 | van Lohuizen | European Radiology | 2024 | NA | NA |
| 32 | Wang | Abdominal Radiology | 2021 | GE | 1.5 and 3 |
| 33 | Zhu | Radiation Oncology | 2023 | Elekta | 1.5 |
| # | Sequence | DL Type | Space | Direct Mapping | Participants |
|---|---|---|---|---|---|
| 1 Belue | T2w | in-house | Image | NA | 96 |
| 2 Bischoff | T2w | product | k-space | yes | 109 |
| 3 Boschheidgen | T2w | product | k-space | yes | 120 |
| 4 Cochran | DWI | product | k-space | no | 52 |
| 5 Gassenmaier | T2w | vendor research | k-space | yes | 30 |
| 6 Gassenmaier | T2w | vendor research | k-space | yes | 30 |
| 7 Gassenmaier | T2w | vendor research | k-space | yes | 60 |
| 8 Harder | T2w | product | k-space | yes | 33 |
| 9 Hu | DWI | in-house | Image | NA | Total 210, validation 60 |
| 10 Jeong | DWI | vendor research | k-space | yes | 70 |
| 11 Johnson | T2w and DWI | in-house | k-space | yes | Total 113, validation 20 |
| 12 Jung | T2w | in-house | Image | NA | 40 |
| 13 Jurka | T2w | vendor research | k-space | yes | 47 |
| 14 Kaye | DWI | in-house | Image | NA | Total 140, validation 37 |
| 15 Kim | T2w | product | k-space | no | 88 |
| 16 Kim | T2w | NA | NA | NA | 162 |
| 17 Kim | T2w | vendor research | k-space | yes | 46 |
| 18 Lee | T2w and DWI | product | k-space | no | 40 |
| 19 Liu | T2w | in-house | Image | NA | 346 |
| 20 Nishioka | DWI | product | k-space | yes | 32 |
| 21 Oerther | T2w and DWI | product | k-space | yes | 77 |
| 22 Park | T2w | product | k-space | no | 109 |
| 23 Pfaff | DWI | in-house | Image | NA | 409 training, 112 validation, 51 testing |
| 24 Riederer | T2w | product | k-space | no | 17 |
| 25 Sato | T2w | product | Image | NA | 13 |
| 26 Shen | T2w | product | Image | NA | 40 |
| 27 Shirashi | T2w | vendor research | Image | NA | 28 |
| 28 Tong | T2w | vendor research | k-space | yes | 80 |
| 29 Ueda | DWI | product | Image | NA | 60 |
| 30 Ursprung | DWI | vendor research | k-space | yes | 35 |
| 31 van Lohuizen | T2w | in-house | Image | NA | Total 1536, validation 306 |
| 32 Wang | T2w | product | k-space | no | 31 |
| 33 Zhu | T2w | in-house | Image | NA | 19 |
| # | Acceleration | Study Design | Clinical Setting |
|---|---|---|---|
| 1 Belue | NA | retrospective | Diagnostic prostate MRI |
| 2 Bischoff | acquired | prospective | Diagnostic prostate MRI |
| 3 Boschheidgen | acquired | prospective | Diagnostic prostate MRI |
| 4 Cochran | simulated k-space | retrospective | Diagnostic prostate MRI |
| 5 Gassenmaier | acquired | prospective | Diagnostic or biochemical recurrence |
| 6 Gassenmaier | acquired | retrospective | Diagnostic prostate MRI |
| 7 Gassenmaier | acquired | prospective | Diagnostic prostate MRI |
| 8 Harder | acquired | prospective | Biopsy proven prostate cancer |
| 9 Hu | NA | prospective | Diagnostic prostate MRI |
| 10 Jeong | acquired | retrospective | Biopsy proven prostate cancer |
| 11 Johnson | simulated k-space | retrospective | Any prostate MRI |
| 12 Jung | acquired and simulated | both | Diagnostic prostate MRI |
| 13 Jurka | acquired | prospective | Diagnostic prostate MRI |
| 14 Kaye | simulated k-space | retrospective | Any prostate MRI |
| 15 Kim | NA | prospective | Diagnostic prostate MRI |
| 16 Kim | acquired | retrospective | Diagnostic prostate MRI |
| 17 Kim | acquired | retrospective | Any prostate MRI |
| 18 Lee | acquired | prospective | Any prostate MRI |
| 19 Liu | NA | unclear | Diagnostic prostate MRI |
| 20 Nishioka | NA | retrospective | Diagnostic prostate MRI |
| 21 Oerther | acquired | prospective | Diagnostic prostate MRI |
| 22 Park | acquired | retrospective | Diagnostic prostate MRI |
| 23 Pfaff | simulated k-space | retrospective | Healthy volunteers + any prostate MRI |
| 24 Riederer | NA | prospective | Any prostate MRI |
| 25 Sato | NA | prospective | Healthy volunteers |
| 26 Shen | acquired | prospective | Any prostate MRI |
| 27 Shirashi | NA | retrospective | Any prostate MRI |
| 28 Tong | acquired | retrospective | Diagnostic or AS prostate MRI |
| 29 Ueda | NA | retrospective | Diagnostic prostate MRI |
| 30 Ursprung | simulated k-space | retrospective | Any prostate MRI |
| 31 van Lohuizen | simulated k-like space after FFT | retrospective | Diagnostic prostate MRI |
| 32 Wang | NA | prospective | Diagnostic prostate MRI |
| 33 Zhu | acquired | prospective | Radiotherapy MRI for adaptive treatment |
| # | # Readers | Acquisition Time Reduction |
|---|---|---|
| 1 Belue | 5 | 100% |
| 2 Bischoff | 2 | 64% |
| 3 Boschheidgen | 2 | 56–72% |
| 4 Cochran | 2 | 32–100% |
| 5 Gassenmaier | 2 | 110% |
| 6 Gassenmaier | 2 | 35% |
| 7 Gassenmaier | 2 | 37% |
| 8 Harder | 4 | 41–100% |
| 9 Hu | 1 | not specified |
| 10 Jeong | 2 | 42–100% |
| 11 Johnson | 4 | 18–27% |
| 12 Jung | 2 | 29–58% |
| 13 Jurka | 3 | 50% |
| 14 Kaye | 2 | 13% |
| 15 Kim | 2 | 100% |
| 16 Kim | 2 | 31% |
| 17 Kim | 2 | 24–31% |
| 18 Lee | 2 | For DWI: 51–100%, For T2w 67–100% |
| 19 Liu | 1 | 100% |
| 20 Nishioka | 2 | 100% |
| 21 Oerther | 2 | 37% |
| 22 Park | 3 | 63% |
| 23 Pfaff | NA | 58% |
| 24 Riederer | 3 | 100% |
| 25 Sato | 2 | 100% |
| 26 Shen | 2 | 47–53% |
| 27 Shirashi | 2 | 100% |
| 28 Tong | 3 | 30–50% |
| 29 Ueda | 2 | 100% |
| 30 Ursprung | 3 | 69% |
| 31 van Lohuizen | NA | 13–25% |
| 32 Wang | 3 | 100% |
| 33 Zhu | NA | 28% |
| # | Subjective Image Quality Metrics | ||||||||
|---|---|---|---|---|---|---|---|---|---|
| Motion | Artifacts | Sharpness | Noise | Lesion Conspicuity | Structural Conspicuity | Diagnostic Confidence | Overall Quality | Others | |
| 1 Belue | X | X | X | ||||||
| 2 Bischoff | X | X | X | X | X | ||||
| 3 Boschheidgen | X | X | X | X | |||||
| 4 Cochran | X | X | X | X | X | ||||
| 5 Gassenmaier | X | X | X | X | X | X | |||
| 6 Gassenmaier | X | X | X | X | X | X | |||
| 7 Gassenmaier | X | X | X | X | X | Natural impression | |||
| 8 Harder | X | X | X | X | X | X | |||
| 9 Hu | X | ||||||||
| 10 Jeong | X | X | X | ||||||
| 11 Johnson | X | X | X | ||||||
| 12 Jung | X | X | X | Perceived SNR | |||||
| 13 Jurka | X | X | X | X | X | Contrast | |||
| 14 Kaye | X | X | X | X | X | ||||
| 15 Kim | X | X | X | ||||||
| 16 Kim | |||||||||
| 17 Kim | X | X | X | X | |||||
| 18 Lee | X | X | |||||||
| 19 Liu | X | ||||||||
| 20 Nishioka | X | X | X | ||||||
| 21 Oerther | X | X | X | ||||||
| 22 Park | X | X | |||||||
| 23 Pfaff | |||||||||
| 24 Riederer | X | X | X | X | X | Subjective SNR | |||
| 25 Sato | X | X | X | X | |||||
| 26 Shen | X | X | X | X | X | ||||
| 27 Shirashi | X | X | X | X | Conrast | ||||
| 28 Tong | X | X | |||||||
| 29 Ueda | X | ||||||||
| 30 Ursprung | X | X | X | X | X | ||||
| 31 van Lohuizen | |||||||||
| 32 Wang | X | X | X | ||||||
| 33 Zhu | |||||||||
| # | Objective Image Quality Metrics | |||||||
|---|---|---|---|---|---|---|---|---|
| SNR | CNR | Intensity Gradient Metric | SSIM | pSNR | RMSE | AI | Others | |
| 1 Belue | X | |||||||
| 2 Bischoff | X | X | X | |||||
| 3 Boschheidgen | X | X | X | |||||
| 4 Cochran | X | |||||||
| 5 Gassenmaier | ||||||||
| 6 Gassenmaier | ||||||||
| 7 Gassenmaier | ||||||||
| 8 Harder | X | X | X | |||||
| 9 Hu | X | X | X | Feature similarity index | ||||
| 10 Jeong | X | X | ||||||
| 11 Johnson | ||||||||
| 12 Jung | X | X | X | |||||
| 13 Jurka | X | X | ||||||
| 14 Kaye | X | X | ||||||
| 15 Kim | X | X | ||||||
| 16 Kim | ||||||||
| 17 Kim | X | X | ||||||
| 18 Lee | X | X | ||||||
| 19 Liu | X | X | X | Perceptual index | ||||
| 20 Nishioka | X | X | ||||||
| 21 Oerther | ||||||||
| 22 Park | X | X | ||||||
| 23 Pfaff | Variance, Gaussian log-likelihood | |||||||
| 24 Riederer | ||||||||
| 25 Sato | X | X | ||||||
| 26 Shen | X | X | X | |||||
| 27 Shirashi | X | X | Contrast | |||||
| 28 Tong | X | |||||||
| 29 Ueda | X | X | ||||||
| 30 Ursprung | X | |||||||
| 31 van Lohuizen | X | X | X | |||||
| 32 Wang | Signal ratio | |||||||
| 33 Zhu | X | X | MAE, edge keeping distance | |||||
Appendix C. Study Categorization
| Data Space | ||
|---|---|---|
| Image | k-Space | k-Space w/ Direct Mapping |
| 1 Belue | 4 Cochran | 2 Bischoff |
| 9 Hu | 15 Kim | 3 Boschheidgen |
| 12 Jung | 18 Lee | 5 Gassenmaier |
| 14 Kaye | 22 Park | 6 Gassenmaier |
| 19 Liu | 24 Riederer | 7 Gassenmaier |
| 23 Pfaff | 32 Wang | 8 Harder |
| 25 Sato | 10 Jeong | |
| 26 Shen | 11 Johnson | |
| 27 Shirashi | 13 Jurka | |
| 29 Ueda | 17 Kim | |
| 31 van Lohuizen | 20 Nishioka | |
| 33 Zhu | 21 Oerther | |
| 28 Tong | ||
| 30 Ursprung | ||
| Sequence | ||
|---|---|---|
| T2w | DWI | DWI & T2w |
| 1 Belue | 4 Cochran | 11 Johnson |
| 2 Bischoff | 9 Hu | 18 Lee |
| 3 Boschheidgen | 10 Jeong | 21 Oerther |
| 5 Gassenmaier | 14 Kaye | |
| 6 Gassenmaier | 20 Nishioka | |
| 7 Gassenmaier | 23 Pfaff | |
| 8 Harder | 29 Ueda | |
| 12 Jung | 30 Ursprung | |
| 13 Jurka | ||
| 15 Kim | ||
| 16 Kim | ||
| 17 Kim | ||
| 19 Liu | ||
| 22 Park | ||
| 24 Riederer | ||
| 25 Sato | ||
| 26 Shen | ||
| 27 Shirashi | ||
| 28 Tong | ||
| 31 van Lohuizen | ||
| 32 Wang | ||
| 33 Zhu | ||
| Study Design | ||
|---|---|---|
| Prospective | Retrospective | |
| 2 Bischoff | 1 Belue | |
| 3 Boschheidgen | 4 Cochran | |
| 5 Gassenmaier | 6 Gassenmaier | |
| 7 Gassenmaier | 10 Jeong | |
| 8 Harder | 11 Johnson | |
| 9 Hu | 12 Jung | |
| 12 Jung | 14 Kaye | |
| 13 Jurka | 16 Kim | |
| 15 Kim | 17 Kim | |
| 18 Lee | 20 Nishioka | |
| 21 Oerther | 22 Park | |
| 24 Riederer | 23 Pfaff | |
| 25 Sato | 27 Shirashi | |
| 26 Shen | 28 Tong | |
| 32 Wang | 29 Ueda | |
| 33 Zhu | 30 Ursprung | |
| 31 van Lohuizen | ||
| Deep Learning Type | ||
|---|---|---|
| In-House Research | Vendor Research | Product |
| 1 Belue | 5 Gassenmaier | 2 Bischoff |
| 9 Hu | 6 Gassenmaier | 3 Boschheidgen |
| 11 Johnson | 7 Gassenmaier | 4 Cochran |
| 12 Jung | 10 Jeong | 8 Harder |
| 14 Kaye | 13 Jurka | 15 Kim |
| 19 Liu | 17 Kim | 18 Lee |
| 23 Pfaff | 27 Shirashi | 20 Nishioka |
| 31 van Lohuizen | 28 Tong | 21 Oerther |
| 33 Zhu | 30 Ursprung | 22 Park |
| 24 Riederer | ||
| 25 Sato | ||
| 26 Shen | ||
| 29 Ueda | ||
| 32 Wang | ||
| Acceleration | ||
|---|---|---|
| Simulated | Acquired | |
| 4 Cochran | 2 Bischoff | |
| 11 Johnson | 3 Boschheidgen | |
| 12 Jung | 5 Gassenmaier | |
| 14 Kaye | 6 Gassenmaier | |
| 23 Pfaff | 7 Gassenmaier | |
| 30 Ursprung | 8 Harder | |
| 31 van Lohuizen | 10 Jeong | |
| 12 Jung | ||
| 13 Jurka | ||
| 16 Kim | ||
| 17 Kim | ||
| 18 Lee | ||
| 21 Oerther | ||
| 22 Park | ||
| 26 Shen | ||
| 28 Tong | ||
| 33 Zhu | ||
| Clinical Validation | |||
|---|---|---|---|
| PI-RADS | EPE Detection | Diagnostic Performance | Diagnostic AI Performance |
| 2 Bischoff | 15 Kim | 10 Jeong | 28 Tong |
| 5 Gassenmaier | 16 Kim | 11 Johnson | 31 van Lohuizen |
| 6 Gassenmaier | 22 Park | 29 Ueda | |
| 7 Gassenmaier | |||
| 8 Harder | |||
| 10 Jeong | |||
| 11 Johnson | |||
| 12 Jung | |||
| 16 Kim | |||
| 18 Lee | |||
| 21 Oerther | |||
| 26 Shen | |||
| 27 Shirashi | |||
Appendix D. QUADAS-2 Assessment
| # | Objective Image Quality Metrics | Index Test | Reference Test | Flow and Timing | ||||
|---|---|---|---|---|---|---|---|---|
| Risk of Bias | Applicability | Risk of Bias | Applicability | Risk of Bias | Applicability | Risk of Bias | Applicability | |
| 1 Belue | ☺ | ☺ | ☺ | ☺ | ☺ | ☺ | ☺ | ☺ |
| 2 Bischoff | ☺ | ☺ | ☺ | ☺ | ☺ | ☺ | ☺ | ☺ |
| 3 Boschheidgen | 😐︎ | ☺ | ☺ | ☺ | ☺ | ☺ | ☺ | ☺ |
| 4 Cochran | ☺ | ☺ | 😐︎ | 😐︎ | 😐︎ | ☺ | ☺ | ☺ |
| 5 Gassenmaier | ☺ | ☺ | ☺ | ☺ | ☺ | ☺ | ☺ | ☺ |
| 6 Gassenmaier | ☺ | ☺ | ☺ | ☺ | ☺ | ☺ | ☺ | ☺ |
| 7 Gassenmaier | ☺ | ☺ | ☺ | ☺ | ☺ | ☺ | ☺ | ☺ |
| 8 Harder | ☺ | ☺ | ☺ | ☺ | ☺ | ☺ | ☺ | ☺ |
| 9 Hu | ☹ | ☹ | 😐︎ | ☺ | 😐︎ | ☺ | ☺ | ☺ |
| 10 Jeong | ☺ | ☺ | ☺ | ☺ | ☺ | ☺ | ☺ | ☺ |
| 11 Johnson | 😐︎ | 😐︎ | 😐︎ | 😐︎ | ☺ | ☺ | ☺ | ☺ |
| 12 Jung | ☺ | ☺ | ☺ | ☺ | ☺ | ☺ | ☺ | ☺ |
| 13 Jurka | ☺ | ☺ | ☺ | ☺ | ☺ | ☺ | ☺ | ☺ |
| 14 Kaye | 😐︎ | 😐︎ | 😐︎ | 😐︎ | ☺ | ☺ | ☺ | ☺ |
| 15 Kim | 😐︎ | ☹ | ☺ | ☺ | ☺ | ☺ | ☺ | ☺ |
| 16 Kim | 😐︎ | ☹ | 😐︎ | 😐︎ | 😐︎ | ☺ | ☺ | ☺ |
| 17 Kim | ☺ | ☺ | ☹ | ☺ | ☹ | ☺ | ☺ | ☺ |
| 18 Lee | 😐︎ | ☺ | ☺ | ☺ | ☺ | ☺ | ☺ | ☺ |
| 19 Liu | ☺ | ☺ | 😐︎ | 😐︎ | 😐︎ | 😐︎ | ☺ | ☺ |
| 20 Nishioka | ☹ | ☹ | 😐︎ | 😐︎ | 😐︎ | 😐︎ | ☺ | ☺ |
| 21 Oerther | ☺ | ☺ | ☺ | ☺ | 😐︎ | ☺ | ☺ | ☺ |
| 22 Park | 😐︎ | ☹ | ☺ | ☺ | ☺ | ☺ | ☺ | ☺ |
| 23 Pfaff | 😐︎ | 😐︎ | 😐︎ | ☺ | ☺ | ☺ | ☺ | ☺ |
| 24 Riederer | ☺ | ☺ | 😐︎ | ☺ | 😐︎ | ☺ | ☺ | ☺ |
| 25 Sato | ☺ | ☹ | ☺ | ☺ | ☺ | ☺ | ☺ | ☺ |
| 26 Shen | ☺ | ☺ | ☺ | ☺ | ☺ | ☺ | ☺ | ☺ |
| 27 Shirashi | ☺ | ☺ | 😐︎ | ☺ | 😐︎ | ☺ | ☺ | ☺ |
| 28 Tong | ☺ | ☺ | ☺ | ☺ | ☺ | ☺ | ☺ | ☺ |
| 29 Ueda | ☹ | ☹ | 😐︎ | ☺ | 😐︎ | ☺ | ☺ | ☺ |
| 30 Ursprung | ☺ | ☺ | 😐︎ | 😐︎ | ☺ | ☺ | ☺ | ☺ |
| 31 van Lohuizen | ☺ | ☺ | 😐︎ | 😐︎ | ☺ | ☺ | ☺ | ☺ |
| 32 Wang | ☺ | ☺ | ☺ | ☺ | ☺ | 😐︎ | ☺ | ☺ |
| 33 Zhu | ☺ | ☺ | ☺ | ☺ | ☺ | ☺ | ☺ | ☺ |
Appendix E. Statistical Methods
Appendix F. Supplementary Data Meta-Analysis
References
- Hofmann, B.; Haug, E.S.; Andersen, E.R.; Kjelle, E. Increased magnetic resonance imaging in prostate cancer management-What are the outcomes? J. Eval. Clin. Pract. 2023, 29, 893–902. [Google Scholar] [CrossRef] [PubMed]
- Hofmann, B.; Øfsti Brandsaeter, I.; Kjelle, E. Variations in wait times for imaging services: A register-based study of self-reported wait times for specific examinations in Norway. BMC Health Serv. Res. 2023, 23, 1287. [Google Scholar] [CrossRef] [PubMed]
- Hugosson, J.; Månsson, M.; Wallström, J.; Axcrona, U.; Carlsson, S.V.; Egevad, L.; Geterud, K.; Khatami, A.; Kohestani, K.; Pihl, C.G.; et al. Prostate Cancer Screening with PSA and MRI Followed by Targeted Biopsy Only. N. Engl. J. Med. 2022, 387, 2126–2137. [Google Scholar] [CrossRef] [PubMed]
- Hugosson, J.; Godtman, R.A.; Wallstrom, J.; Axcrona, U.; Bergh, A.; Egevad, L.; Geterud, K.; Khatami, A.; Socratous, A.; Spyratou, V.; et al. Results after Four Years of Screening for Prostate Cancer with PSA and MRI. N. Engl. J. Med. 2024, 391, 1083–1095. [Google Scholar] [CrossRef]
- Nordström, T.; Annerstedt, M.; Glaessgen, A.; Carlsson, S.; Clements, M.; Abbadi, A.; Grönberg, H.; Jäderling, F.; Eklund, M.; Discacciati, A. Repeated Prostate Cancer Screening Using Prostate-Specific Antigen Testing and Magnetic Resonance Imaging: A Secondary Analysis of the STHLM3-MRI Randomized Clinical Trial. JAMA Netw. Open 2024, 7, E2354577. [Google Scholar] [CrossRef]
- Möller, F.; Månsson, M.; Wallström, J.; Hellström, M.; Hugosson, J.; Godtman, R.A. Prostate Cancers in the Prostate-specific Antigen Interval of 1.8–3 ng/ml: Results from the Göteborg-2 Prostate Cancer Screening Trial. Eur. Urol. 2024, 86, 95–100. [Google Scholar] [CrossRef]
- Farha, M.W.; Salami, S.S. Biomarkers for prostate cancer detection and risk stratification. Ther. Adv. Urol. 2022, 14, 1–14. [Google Scholar] [CrossRef]
- Padhani, A.R.; Schoots, I.G.; Barentsz, J.O. Fast Magnetic Resonance Imaging as a Viable Method for Directing the Prostate Cancer Diagnostic Pathway. Eur. Urol. Oncol. 2021, 4, 863–865. [Google Scholar] [CrossRef]
- Schoots, I.G.; Haider, M.A.; Punwani, S.; Padhani, A.R. MRI in Prostate Cancer Screening: A Review and Recommendations, From the AJR Special Series on Screening. AJR Am. J. Roentgenol. 2025. [Google Scholar] [CrossRef]
- Agrotis, G.; Ursprung, S.; Schoots, I. Personalized Prostate MRI: Tailoring Contrast Medium Use in an Era of Increasing Demand. Eur. Radiol. 2025. [Google Scholar] [CrossRef]
- Brix, M.A.; Järvinen, J.; Bode, M.K.; Nevalainen, M.; Nikki, M.; Niinimäki, J.; Lammentausta, E. Financial impact of incorporating deep learning reconstruction into magnetic resonance imaging routine. Eur. J. Radiol. 2024, 175, 111434. [Google Scholar] [CrossRef] [PubMed]
- Hamilton, J.; Franson, D.; Seiberlich, N. Recent advances in parallel imaging for MRI. Prog. Nucl. Magn. Reson. Spectrosc. 2017, 101, 71–95. [Google Scholar] [CrossRef] [PubMed]
- Cui, L.; Song, Y.; Wang, Y.; Wang, R.; Wu, D.; Xie, H.; Li, J.; Yang, G. Motion artifact reduction for magnetic resonance imaging with deep learning and k-space analysis. PLoS ONE 2023, 18, e0278668. [Google Scholar] [CrossRef]
- Kiryu, S.; Akai, H.; Yasaka, K.; Tajima, T.; Kunimatsu, A.; Yoshioka, N.; Akahane, M.; Abe, O.; Ohtomo, K. Clinical Impact of Deep Learning Reconstruction in MRI. Radiographics 2023, 43, e220133. [Google Scholar] [CrossRef]
- Ravishankar, S.; Ye, J.C.; Fessler, J.A. Image Reconstruction: From Sparsity to Data-adaptive Methods and Machine Learning. Proc. IEEE. Inst. Electr. Electron. Eng. 2020, 108, 86–109. [Google Scholar] [CrossRef]
- Page, M.J.; McKenzie, J.E.; Bossuyt, P.M.; Boutron, I.; Hoffmann, T.C.; Mulrow, C.D.; Shamseer, L.; Tetzlaff, J.M.; Akl, E.A.; Brennan, S.E.; et al. The PRISMA 2020 statement: An updated guideline for reporting systematic reviews. Syst. Rev. 2021, 4, 89. [Google Scholar] [CrossRef]
- McInnes, M.; Moher, D.; Thombs, B.; McGrath, T.; Bossuyt, P.; Clifford, T.; Cohen, J.; Deeks, J.; Gatsonis, C.; Hooft, L.; et al. Preferred Reporting Items for a Systematic Review and Meta-analysis of Diagnostic Test Accuracy Studies. JAMA 2018, 10, 388–396. [Google Scholar] [CrossRef]
- Wan, X.; Wang, W.; Liu, J.; Tong, T. Estimating the sample mean and standard deviation from the sample size, median, range and/or interquartile range. BMC Med. Res. Methodol. 2014, 14, 135. [Google Scholar] [CrossRef]
- Viechtbauer, W. Conducting Meta-Analyses in R with the metafor Package. J. Stat. Softw. 2010, 91, 121108. [Google Scholar] [CrossRef]
- Belue, M.J.; Harmon, S.A.; Masoudi, S.; Barrett, T.; Law, Y.M.; Purysko, A.S.; Panebianco, V.; Yilmaz, E.C.; Lin, Y.; Jadda, P.K.; et al. Quality of T2-weighted MRI re-acquisition versus deep learning GAN image reconstruction: A multi-reader study. Eur. J. Radiol. 2024, 170, 111259. [Google Scholar] [CrossRef]
- Bischoff, L.M.; Peeters, J.M.; Weinhold, L.; Krausewitz, P.; Ellinger, J.; Katemann, C.; Isaak, A.; Weber, O.M.; Kuetting, D.; Attenberger, U.; et al. Deep Learning Super-Resolution Reconstruction for Fast and Motion-Robust T2-weighted Prostate MRI. Radiology 2023, 308, e230427. [Google Scholar] [CrossRef] [PubMed]
- Boschheidgen, M.; Drewes, L.; Valentin, B.; Ullrich, T.; Trappe, S.; Al-Monajjed, R.; Radtke, J.P.; Albers, P.; Wittsack, H.J.; Antoch, G.; et al. Use of deep learning-accelerated T2 TSE for prostate MRI: Comparison with and without hyoscine butylbromide admission. Magn. Reson. Imaging 2025, 118, 110358. [Google Scholar] [CrossRef] [PubMed]
- Cochran, R.L.; Milshteyn, E.; Ghosh, S.; Nakrour, N.; Mercaldo, N.D.; Guidon, A.; Harisinghani, M.G. Minimizing prostate diffusion weighted MRI examination time through deep learning reconstruction. Clin. Imaging 2025, 117, 110341. [Google Scholar] [CrossRef] [PubMed]
- Gassenmaier, S.; Afat, S.; Nickel, M.D.; Mostapha, M.; Herrmann, J.; Almansour, H.; Nikolaou, K.; Othman, A.E. Accelerated t2-weighted tse imaging of the prostate using deep learning image reconstruction: A prospective comparison with standard t2-weighted tse imaging. Cancers 2021, 13, 3593. [Google Scholar] [CrossRef]
- Gassenmaier, S.; Afat, S.; Nickel, D.; Mostapha, M.; Herrmann, J.; Othman, A.E. Deep learning–accelerated T2-weighted imaging of the prostate: Reduction of acquisition time and improvement of image quality. Eur. J. Radiol. 2021, 137, 109600. [Google Scholar] [CrossRef]
- Gassenmaier, S.; Warm, V.; Nickel, D.; Weiland, E.; Herrmann, J.; Almansour, H.; Wessling, D.; Afat, S. Thin-Slice Prostate MRI Enabled by Deep Learning Image Reconstruction. Cancers 2023, 15, 578. [Google Scholar] [CrossRef]
- Harder, F.N.; Weiss, K.; Amiel, T.; Peeters, J.M.; Tauber, R.; Ziegelmayer, S.; Burian, E.; Makowski, M.R.; Sauter, A.P.; Gschwend, J.E.; et al. Prospectively Accelerated T2-Weighted Imaging of the Prostate by Combining Compressed SENSE and Deep Learning in Patients with Histologically Proven Prostate Cancer. Cancers 2022, 14, 5741. [Google Scholar] [CrossRef]
- Hu, L.; Zhou, D.W.; Fu, C.X.; Benkert, T.; Xiao, Y.F.; Wei, L.M.; Zhao, J.G. Calculation of Apparent Diffusion Coefficients in Prostate Cancer Using Deep Learning Algorithms: A Pilot Study. Front. Oncol. 2021, 11, 697721. [Google Scholar] [CrossRef]
- Jeong, J.; Yeom, S.K.; Choi, I.Y.; Cha, S.H.; Han, J.S.; Lee, C.H.; Sung, D.J.; Choi, J.W.; Bae, J.H.; Choi, H.; et al. Deep learning image reconstruction of diffusion-weighted imaging in evaluation of prostate cancer focusing on its clinical implications. Quant. Imaging Med. Surg. 2024, 14, 3432–3446. [Google Scholar] [CrossRef]
- Johnson, P.M.; Tong, A.; Donthireddy, A.; Melamud, K.; Petrocelli, R.; Smereka, P.; Qian, K.; Keerthivasan, M.B.; Chandarana, H.; Knoll, F. Deep Learning Reconstruction Enables Highly Accelerated Biparametric MR Imaging of the Prostate. J. Magn. Reson. Imaging 2022, 56, 184–195. [Google Scholar] [CrossRef]
- Jung, W.; Kim, E.H.; Ko, J.; Jeong, G.; Choi, M.H. Convolutional neural network-based reconstruction for acceleration of prostate T2 weighted MR imaging: A retro-and prospective study. Br. J. Radiol. 2022, 95, 20211378. [Google Scholar] [CrossRef] [PubMed]
- Jurka, M.; Macova, I.; Wagnerova, M.; Capoun, O.; Jakubicek, R.; Ourednicek, P.; Lambert, L.; Burgetova, A. Deep-learning-based reconstruction of T2-weighted magnetic resonance imaging of the prostate accelerated by compressed sensing provides improved image quality at half the acquisition time. Quant. Imaging Med. Surg. 2024, 14, 3534–3543. [Google Scholar] [CrossRef] [PubMed]
- Kaye, E.A.; Aherne, E.A.; Duzgol, C.; Häggström, I.; Kobler, E.; Mazaheri, Y.; Fung, M.M.; Zhang, Z.; Otazo, R.; Vargas, H.A.; et al. Accelerating prostate diffusion-weighted MRI using a guided denoising convolutional neural network: Retrospective feasibility study. Radiol. Artif. Intell. 2020, 2, 1–9. [Google Scholar] [CrossRef] [PubMed]
- Kim, E.H.; Choi, M.H.; Lee, Y.J.; Han, D.; Mostapha, M.; Nickel, D. Deep learning-accelerated T2-weighted imaging of the prostate: Impact of further acceleration with lower spatial resolution on image quality. Eur. J. Radiol. 2021, 145, 110012. [Google Scholar] [CrossRef]
- Kim, D.H.; Choi, M.H.; Lee, Y.J.; Rha, S.E.; Nickel, M.D.; Lee, H.S.; Han, D. Deep learning-accelerated T2WI of the prostate for transition zone lesion evaluation and extraprostatic extension assessment. Sci. Rep. 2024, 14, 29249. [Google Scholar] [CrossRef]
- Kim, M.; Kim, S.H.; Hong, S.; Kim, Y.J.; Kim, H.R.; Kim, J.Y. Evaluation of Extra-Prostatic Extension on Deep Learning-Reconstructed High-Resolution Thin-Slice T2-Weighted Images in Patients with Prostate Cancer. Cancers 2024, 16, 413. [Google Scholar] [CrossRef]
- Lee, K.L.; Kessler, D.A.; Dezonie, S.; Chishaya, W.; Shepherd, C.; Carmo, B.; Graves, M.J.; Barrett, T. Assessment of deep learning-based reconstruction on T2-weighted and diffusion-weighted prostate MRI image quality. Eur. J. Radiol. 2023, 166, 111017. [Google Scholar] [CrossRef]
- Liu, Y.; Liu, Y.; Vanguri, R.; Litwiller, D.; Liu, M.; Hsu, H.Y.; Ha, R.; Shaish, H.; Jambawalikar, S. 3D Isotropic Super-resolution Prostate MRI Using Generative Adversarial Networks and Unpaired Multiplane Slices. J. Digit. Imaging 2021, 34, 1199–1208. [Google Scholar] [CrossRef]
- Nishioka, N.; Fujima, N.; Tsuneta, S.; Yoshikawa, M.; Kimura, R.; Sakamoto, K.; Kato, F.; Miyata, H.; Kikuchi, H.; Matsumoto, R.; et al. Enhancing the image quality of prostate diffusion-weighted imaging in patients with prostate cancer through model-based deep learning reconstruction. Eur. J. Radiol. Open 2024, 13, 100588. [Google Scholar] [CrossRef]
- Oerther, B.; Engel, H.; Nedelcu, A.; Strecker, R.; Benkert, T.; Nickel, D.; Weiland, E.; Mayrhofer, T.; Bamberg, F.; Benndorf, M.; et al. Performance of an ultra-fast deep-learning accelerated MRI screening protocol for prostate cancer compared to a standard multiparametric protocol. Eur. Radiol. 2024, 34, 7053–7062. [Google Scholar] [CrossRef]
- Park, J.C.; Park, K.J.; Park, M.Y.; hyun Kim, M.; Kim, J.K. Fast T2-Weighted Imaging With Deep Learning-Based Reconstruction: Evaluation of Image Quality and Diagnostic Performance in Patients Undergoing Radical Prostatectomy. J. Magn. Reson. Imaging 2022, 55, 1735–1744. [Google Scholar] [CrossRef] [PubMed]
- Pfaff, L.; Darwish, O.; Wagner, F.; Thies, M.; Vysotskaya, N.; Hossbach, J.; Weiland, E.; Benkert, T.; Eichner, C.; Nickel, D.; et al. Enhancing diffusion-weighted prostate MRI through self-supervised denoising and evaluation. Sci. Rep. 2024, 14, 24292. [Google Scholar] [CrossRef] [PubMed]
- Riederer, S.J.; Borisch, E.A.; Froemming, A.T.; Kawashima, A.; Takahashi, N. Comparison of model-based versus deep learning-based image reconstruction for thin-slice T2-weighted spin-echo prostate MRI. Abdom. Radiol. 2024, 49, 2921–2931. [Google Scholar] [CrossRef] [PubMed]
- Sato, Y.; Ohkuma, K. Verification of image quality improvement by deep learning reconstruction to 1.5 T MRI in T2-weighted images of the prostate gland. Radiol. Phys. Technol. 2024, 17, 756–764. [Google Scholar] [CrossRef]
- Shen, L.; Xu, H.; Liao, Q.; Yuan, Y.; Yu, D.; Wei, J.; Yang, Z.; Wang, L. A Feasibility Study of AI-Assisted Compressed Sensing in Prostate T2-Weighted Imaging. Acad. Radiol. 2024, 31, 5022–5033. [Google Scholar] [CrossRef]
- Shiraishi, K.; Nakaura, T.; Kobayashi, N.; Uetani, H.; Nagayama, Y.; Kidoh, M.; Yatsuda, J.; Kurahashi, R.; Kamba, T.; Yamahita, Y.; et al. Enhancing thin slice 3D T2-weighted prostate MRI with super-resolution deep learning reconstruction: Impact on image quality and PI-RADS assessment. Magn. Reson. Imaging 2025, 117, 110308. [Google Scholar] [CrossRef]
- Tong, A.; Bagga, B.; Petrocelli, R.; Smereka, P.; Vij, A.; Qian, K.; Grimm, R.; Kamen, A.; Keerthivasan, M.B.; Nickel, M.D.; et al. Comparison of a Deep Learning-Accelerated vs. Conventional T2-Weighted Sequence in Biparametric MRI of the Prostate. J. Magn. Reson. Imaging 2023, 58, 1055–1064. [Google Scholar] [CrossRef]
- Ueda, T.; Ohno, Y.; Yamamoto, K.; Murayama, K.; Ikedo, M.; Yui, M.; Hanamatsu, S.; Tanaka, Y.; Obama, Y.; Ikeda, H.; et al. Deep Learning Reconstruction of Diffusion-weighted MRI Improves Image Quality for Prostatic Imaging. Radiology 2022, 303, 373–381. [Google Scholar] [CrossRef]
- Ursprung, S.; Herrmann, J.; Joos, N.; Weiland, E.; Benkert, T.; Almansour, H.; Lingg, A.; Afat, S.; Gassenmaier, S. Accelerated diffusion-weighted imaging of the prostate using deep learning image reconstruction: A retrospective comparison with standard diffusion-weighted imaging. Eur. J. Radiol. 2023, 165, 110953. [Google Scholar] [CrossRef]
- van Lohuizen, Q.; Roest, C.; Simonis, F.F.; Fransen, S.J.; Kwee, T.C.; Yakar, D.; Huisman, H. Assessing deep learning reconstruction for faster prostate MRI: Visual vs. diagnostic performance metrics. Eur. Radiol. 2024, 34, 7364–7372. [Google Scholar] [CrossRef]
- Wang, X.; Ma, J.; Bhosale, P.; Rovira, J.J.I.; Qayyum, A.; Sun, J.; Bayram, E.; Szklaruk, J. Novel deep learning-based noise reduction technique for prostate magnetic resonance imaging. Abdom. Radiol. 2021, 46, 3378–3386. [Google Scholar] [CrossRef] [PubMed]
- Zhu, J.; Chen, X.; Liu, Y.; Yang, B.; Wei, R.; Qin, S.; Yang, Z.; Hu, Z.; Dai, J.; Men, K. Improving accelerated 3D imaging in MRI-guided radiotherapy for prostate cancer using a deep learning method. Radiat. Oncol. 2023, 18, 108. [Google Scholar] [CrossRef] [PubMed]
- Tibrewala, R.; Dutt, T.; Tong, A.; Ginocchio, L.; Lattanzi, R.; Keerthivasan, M.B.; Baete, S.H.; Chopra, S.; Lui, Y.W.; Sodickson, D.K.; et al. FastMRI Prostate: A public, biparametric MRI dataset to advance machine learning for prostate cancer imaging. Sci. Data 2024, 11, 404. [Google Scholar] [CrossRef]
- Health, N.L. fastMRI Dataset. Available online: https://fastmri.med.nyu.edu/ (accessed on 26 May 2025).
- Boss, M.A.; Malyarenko, D.; Partridge, S.; Obuchowski, N.; Shukla-Dave, A.; Winfield, J.M.; Fuller, C.D.; Miller, K.; Mishra, V.; Ohliger, M.; et al. The QIBA Profile for Diffusion-Weighted MRI: Apparent Diffusion Coefficient as a Quantitative Imaging Biomarker. Radiology 2024, 313, e233055. [Google Scholar] [CrossRef]
- Edupuganti, V.; Mardani, M.; Cheng, J.; Vasanawala, S.; Pauly, J. Exploring the Hallucination Risk of Deep Generative Models in MR Image Recovery. In Proceedings of the 27th ISMRM Proceedings, ISMRM, Montreal, QC, Canada, 11–16 May 2019. [Google Scholar]
- Antun, V.; Renna, F.; Poon, C.; Adcock, B.; Hansen, A.C. On instabilities of deep learning in image reconstruction and the potential costs of AI. Proc. Natl. Acad. Sci. USA 2020, 117, 30088–30095. [Google Scholar] [CrossRef]
- Gottschling, N.M.; Antun, V.; Hansen, A.C.; Adcock, B. The Troublesome Kernel: On Hallucinations, No Free Lunches, and the Accuracy-Stability Tradeoff in Inverse Problems. SIAM Rev. 2025, 67, 73–104. [Google Scholar] [CrossRef]
- Kastryulin, S.; Zakirov, J.; Pezzotti, N.; Dylov, D.V. Image Quality Assessment for Magnetic Resonance Imaging. IEEE Access 2023, 11, 14154–14168. [Google Scholar] [CrossRef]
- Dohmen, M.; Klemens, M.A.; Baltruschat, I.M.; Truong, T.; Lenga, M. Similarity and quality metrics for MR image-to-image translation. Sci. Rep. 2025, 15, 3853. [Google Scholar] [CrossRef]
| T2w | DWI | |||||
|---|---|---|---|---|---|---|
| Image | k-Space | Direct Mapping | Image | k-Space | Direct Mapping | |
| Simulated | 2 | 0 | 1 | 2 | 1 | 2 |
| Acquired | 3 | 2 | 10 | 0 | 0 | 2 |
| Not applicable | 4 | 3 | 0 | 2 | 1 | 1 |
| Objective Image Quality Metrics | Subjective Image Quality Metrics |
|---|---|
| - Signal-to-noise ratio (15) | - Overall image quality |
| - Contrast-to-noise ratio (13) | - Noise |
| - Edge rise distance / Slope profile (6) | - Artifacts |
| - Structural similarity index (6) | - Sharpness |
| - Peak signal-to-noise ratio (5) | - Conspicuity |
| - Root mean squared error (4) | - Diagnostic confidence |
| - Performance of diagnostic AI (3) | |
| - Feature similarity index (1) | |
| - Perceptual index (1) | |
| - Variance (1) | |
| - Gaussian log likelihood (1) | |
| - Edge keeping index (1) |
Disclaimer/Publisher’s Note: The statements, opinions and data contained in all publications are solely those of the individual author(s) and contributor(s) and not of MDPI and/or the editor(s). MDPI and/or the editor(s) disclaim responsibility for any injury to people or property resulting from any ideas, methods, instructions or products referred to in the content. |
© 2025 by the authors. Licensee MDPI, Basel, Switzerland. This article is an open access article distributed under the terms and conditions of the Creative Commons Attribution (CC BY) license (https://creativecommons.org/licenses/by/4.0/).
Share and Cite
Ursprung, S.; Agrotis, G.; van Houdt, P.J.; ter Beek, L.C.; Boellaard, T.N.; Beets-Tan, R.G.H.; Yakar, D.; Padhani, A.R.; Schoots, I.G. Prostate MRI Using Deep Learning Reconstruction in Response to Cancer Screening Demands—A Systematic Review and Meta-Analysis. J. Pers. Med. 2025, 15, 284. https://doi.org/10.3390/jpm15070284
Ursprung S, Agrotis G, van Houdt PJ, ter Beek LC, Boellaard TN, Beets-Tan RGH, Yakar D, Padhani AR, Schoots IG. Prostate MRI Using Deep Learning Reconstruction in Response to Cancer Screening Demands—A Systematic Review and Meta-Analysis. Journal of Personalized Medicine. 2025; 15(7):284. https://doi.org/10.3390/jpm15070284
Chicago/Turabian StyleUrsprung, Stephan, Georgios Agrotis, Petra J. van Houdt, Leon C. ter Beek, Thierry N. Boellaard, Regina G. H. Beets-Tan, Derya Yakar, Anwar R. Padhani, and Ivo G. Schoots. 2025. "Prostate MRI Using Deep Learning Reconstruction in Response to Cancer Screening Demands—A Systematic Review and Meta-Analysis" Journal of Personalized Medicine 15, no. 7: 284. https://doi.org/10.3390/jpm15070284
APA StyleUrsprung, S., Agrotis, G., van Houdt, P. J., ter Beek, L. C., Boellaard, T. N., Beets-Tan, R. G. H., Yakar, D., Padhani, A. R., & Schoots, I. G. (2025). Prostate MRI Using Deep Learning Reconstruction in Response to Cancer Screening Demands—A Systematic Review and Meta-Analysis. Journal of Personalized Medicine, 15(7), 284. https://doi.org/10.3390/jpm15070284