

Postoperative Biochemical Outcomes in Metabolic Bariatric Surgery: Results from a High-Adherence Cohort


 ,
,  , , , and
Abstract
1. Introduction
2. Materials and Methods
2.1. Study Group
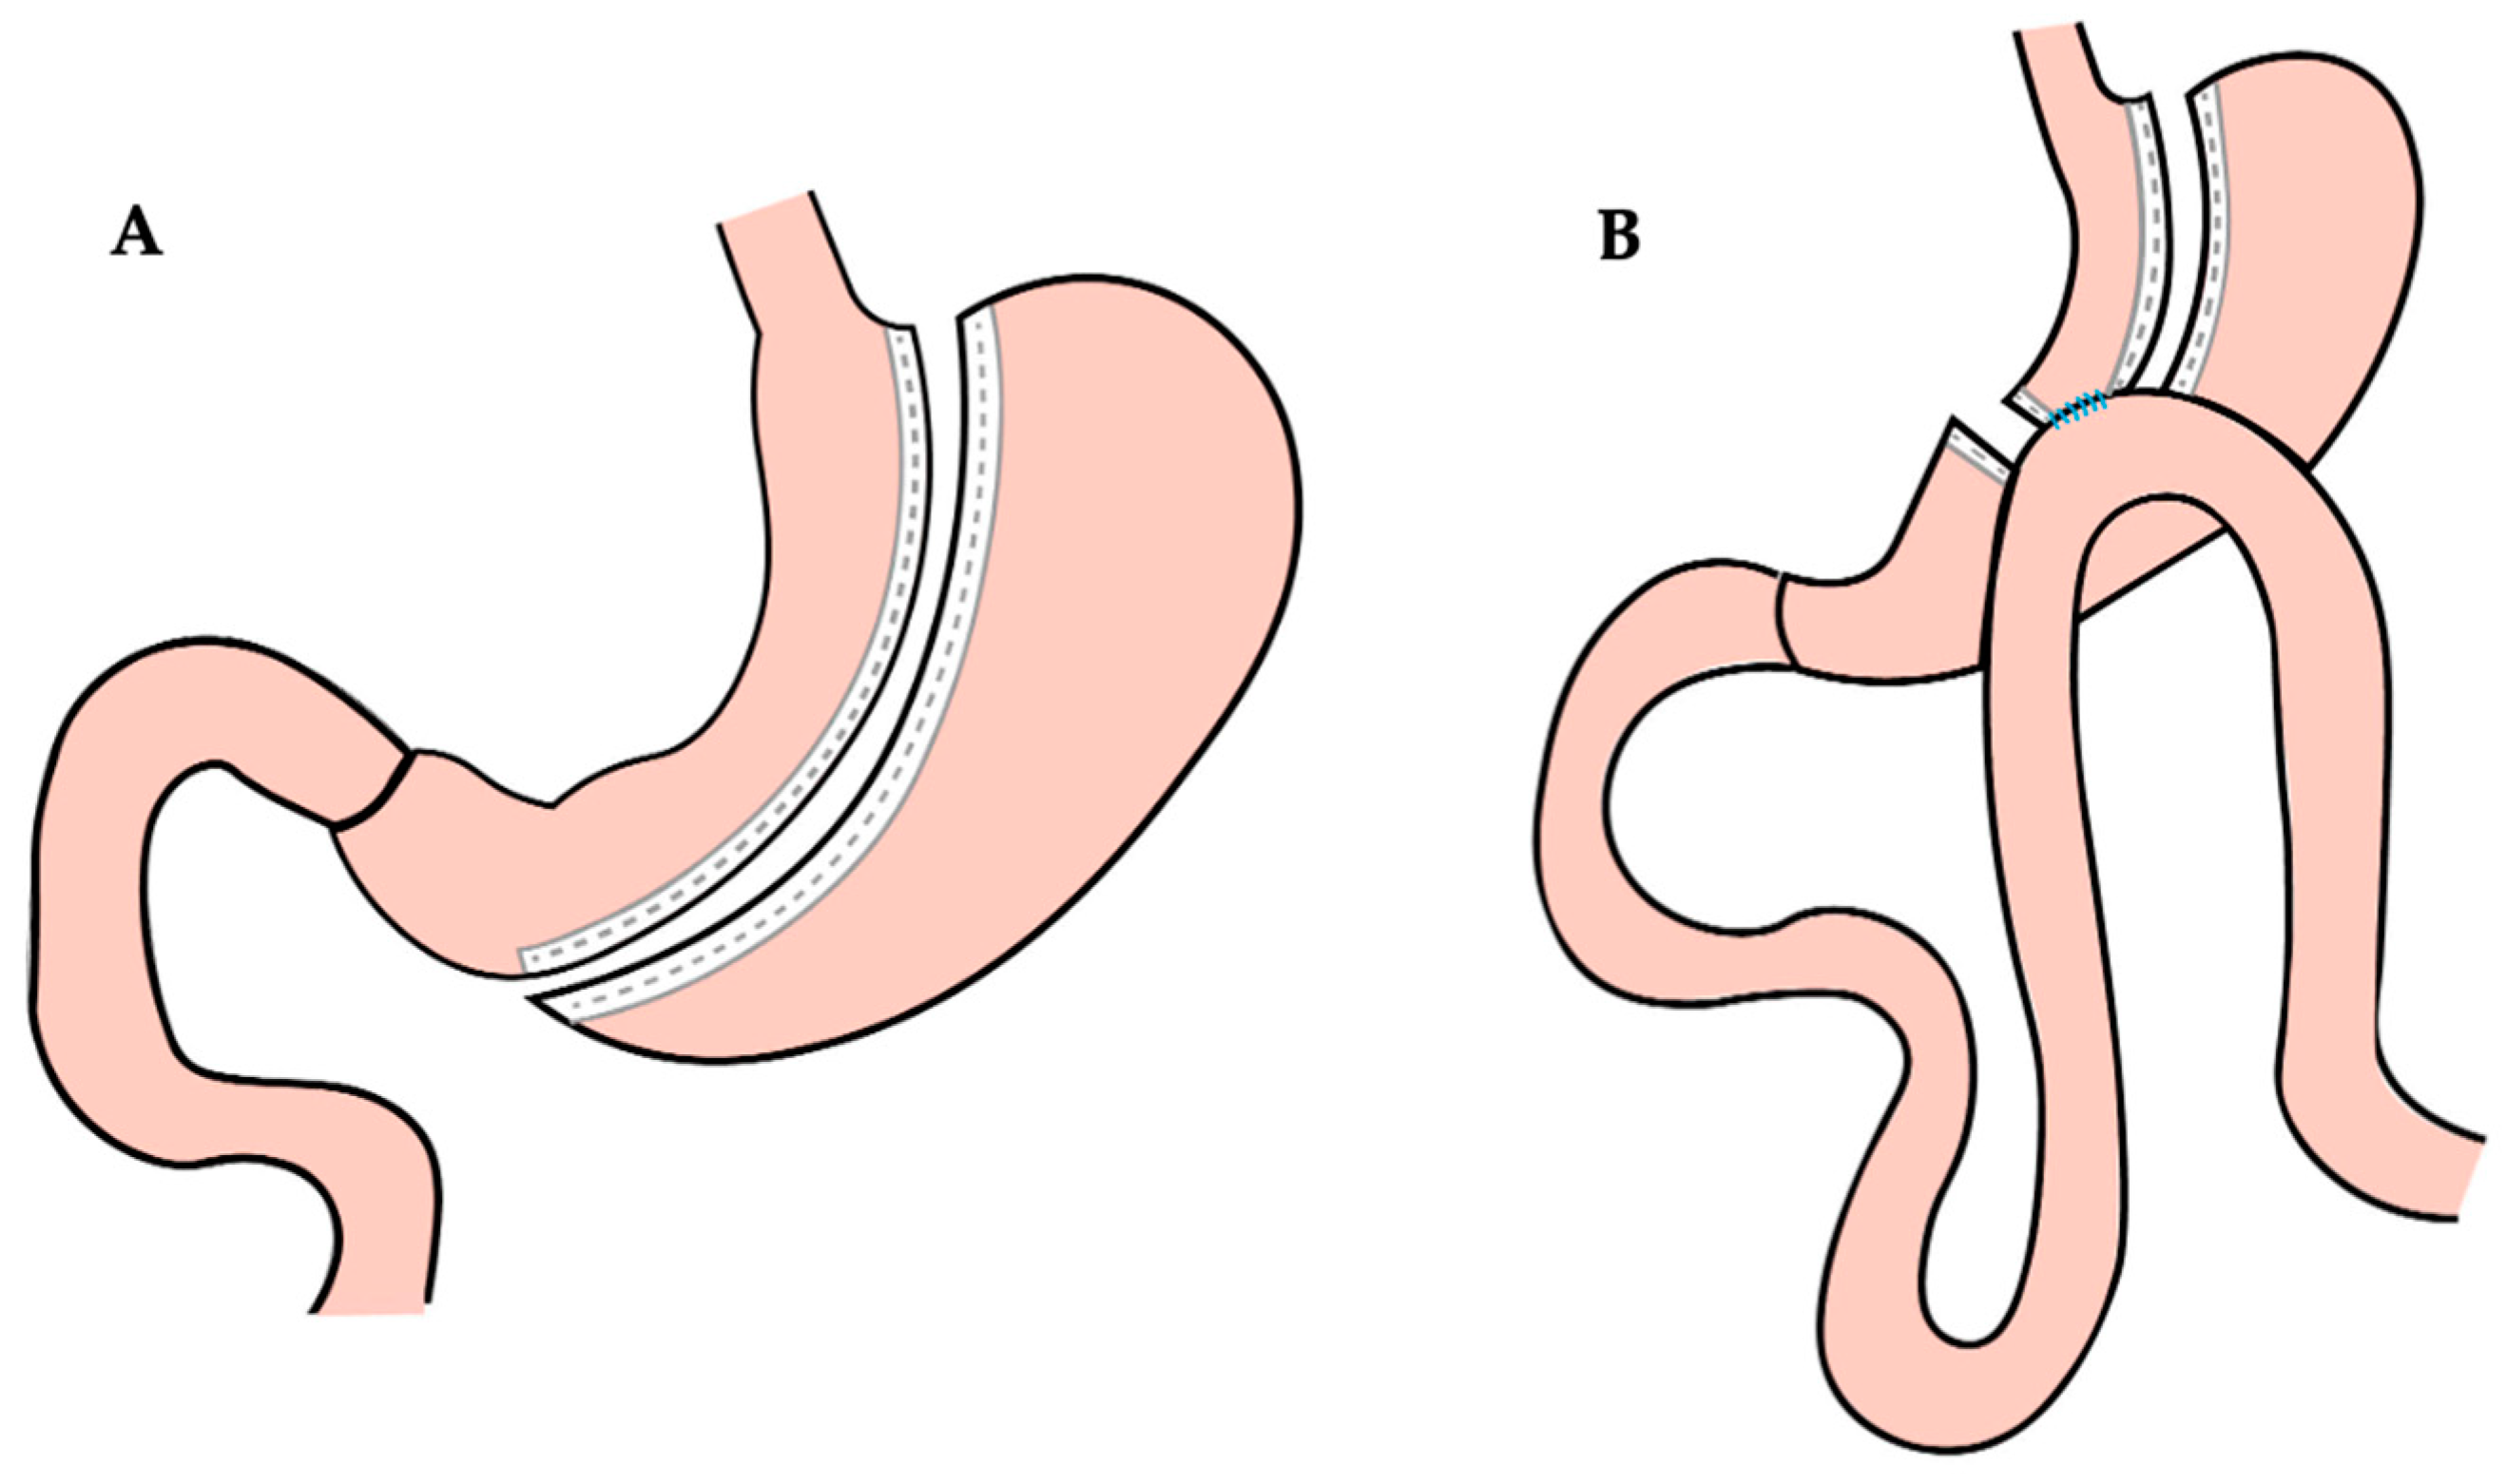
2.2. Operative Procedures
2.3. Follow-Up Data Collection
- Interview to assess patients’ dietary habits, quality of life, potential postoperative complications, and pharmacological therapy modifications;
- Collection of blood samples and evaluation of hematological parameters including evaluation of liver, renal, thyroid, and glycometabolic functions.
2.4. Statistical Analysis
3. Results
3.1. Study Group
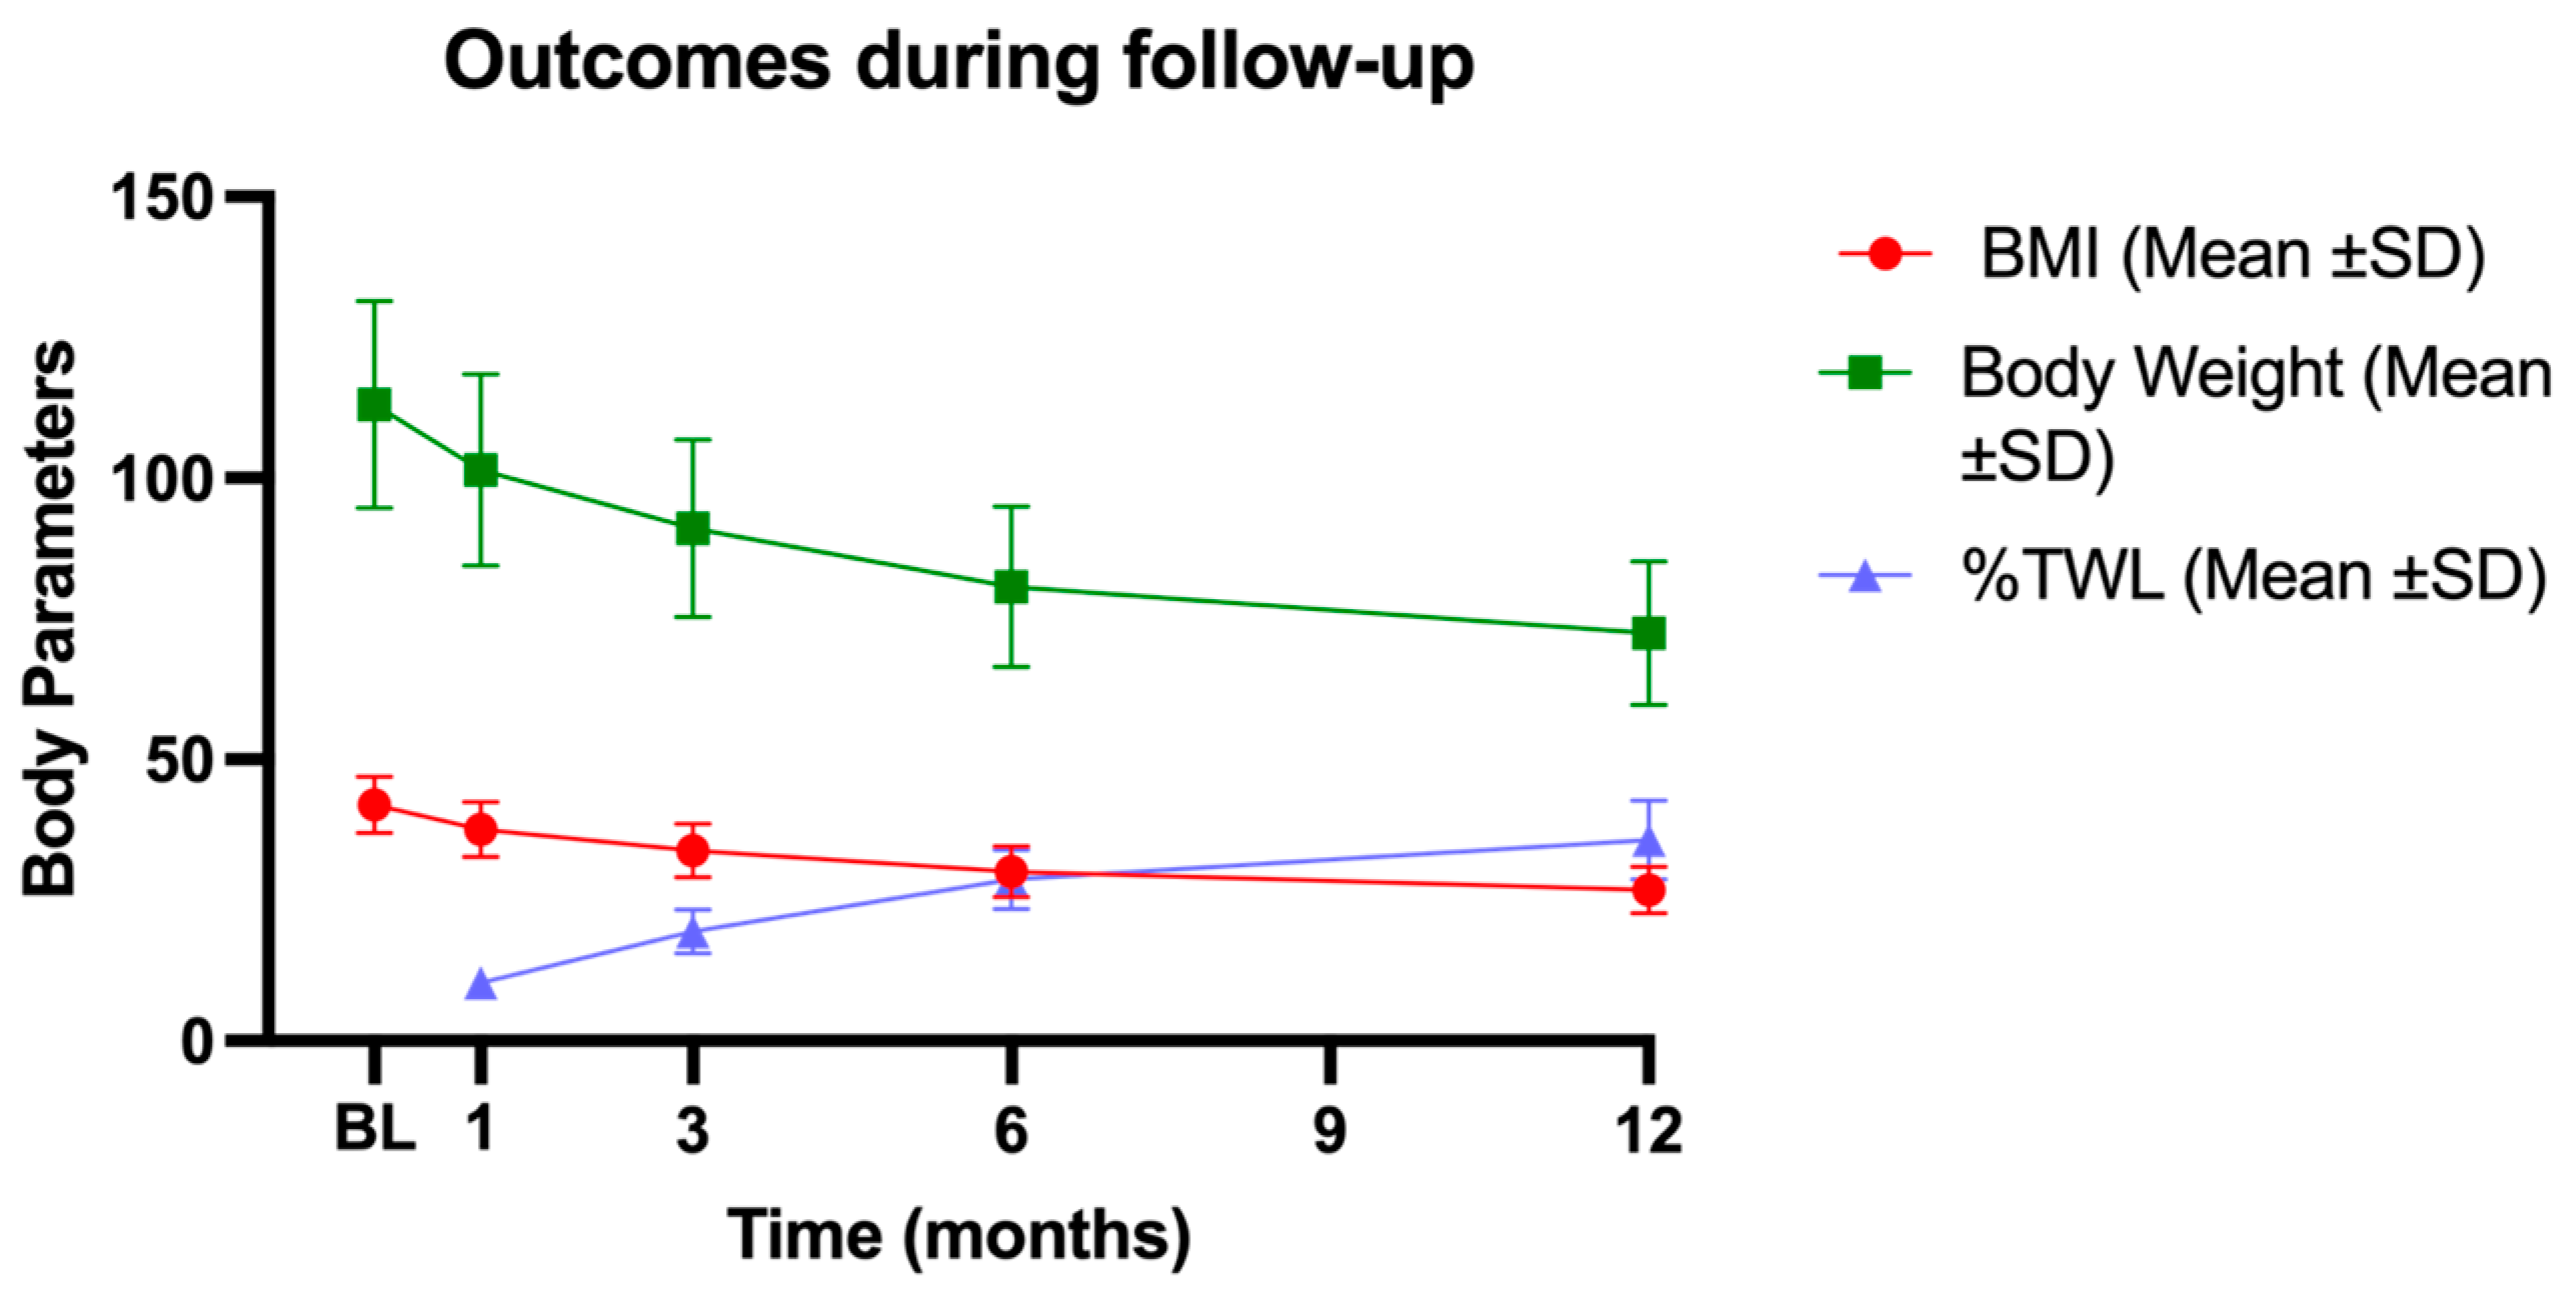
3.2. Weight Loss
3.3. Lipid Profiles
3.4. Thyroid Hormones
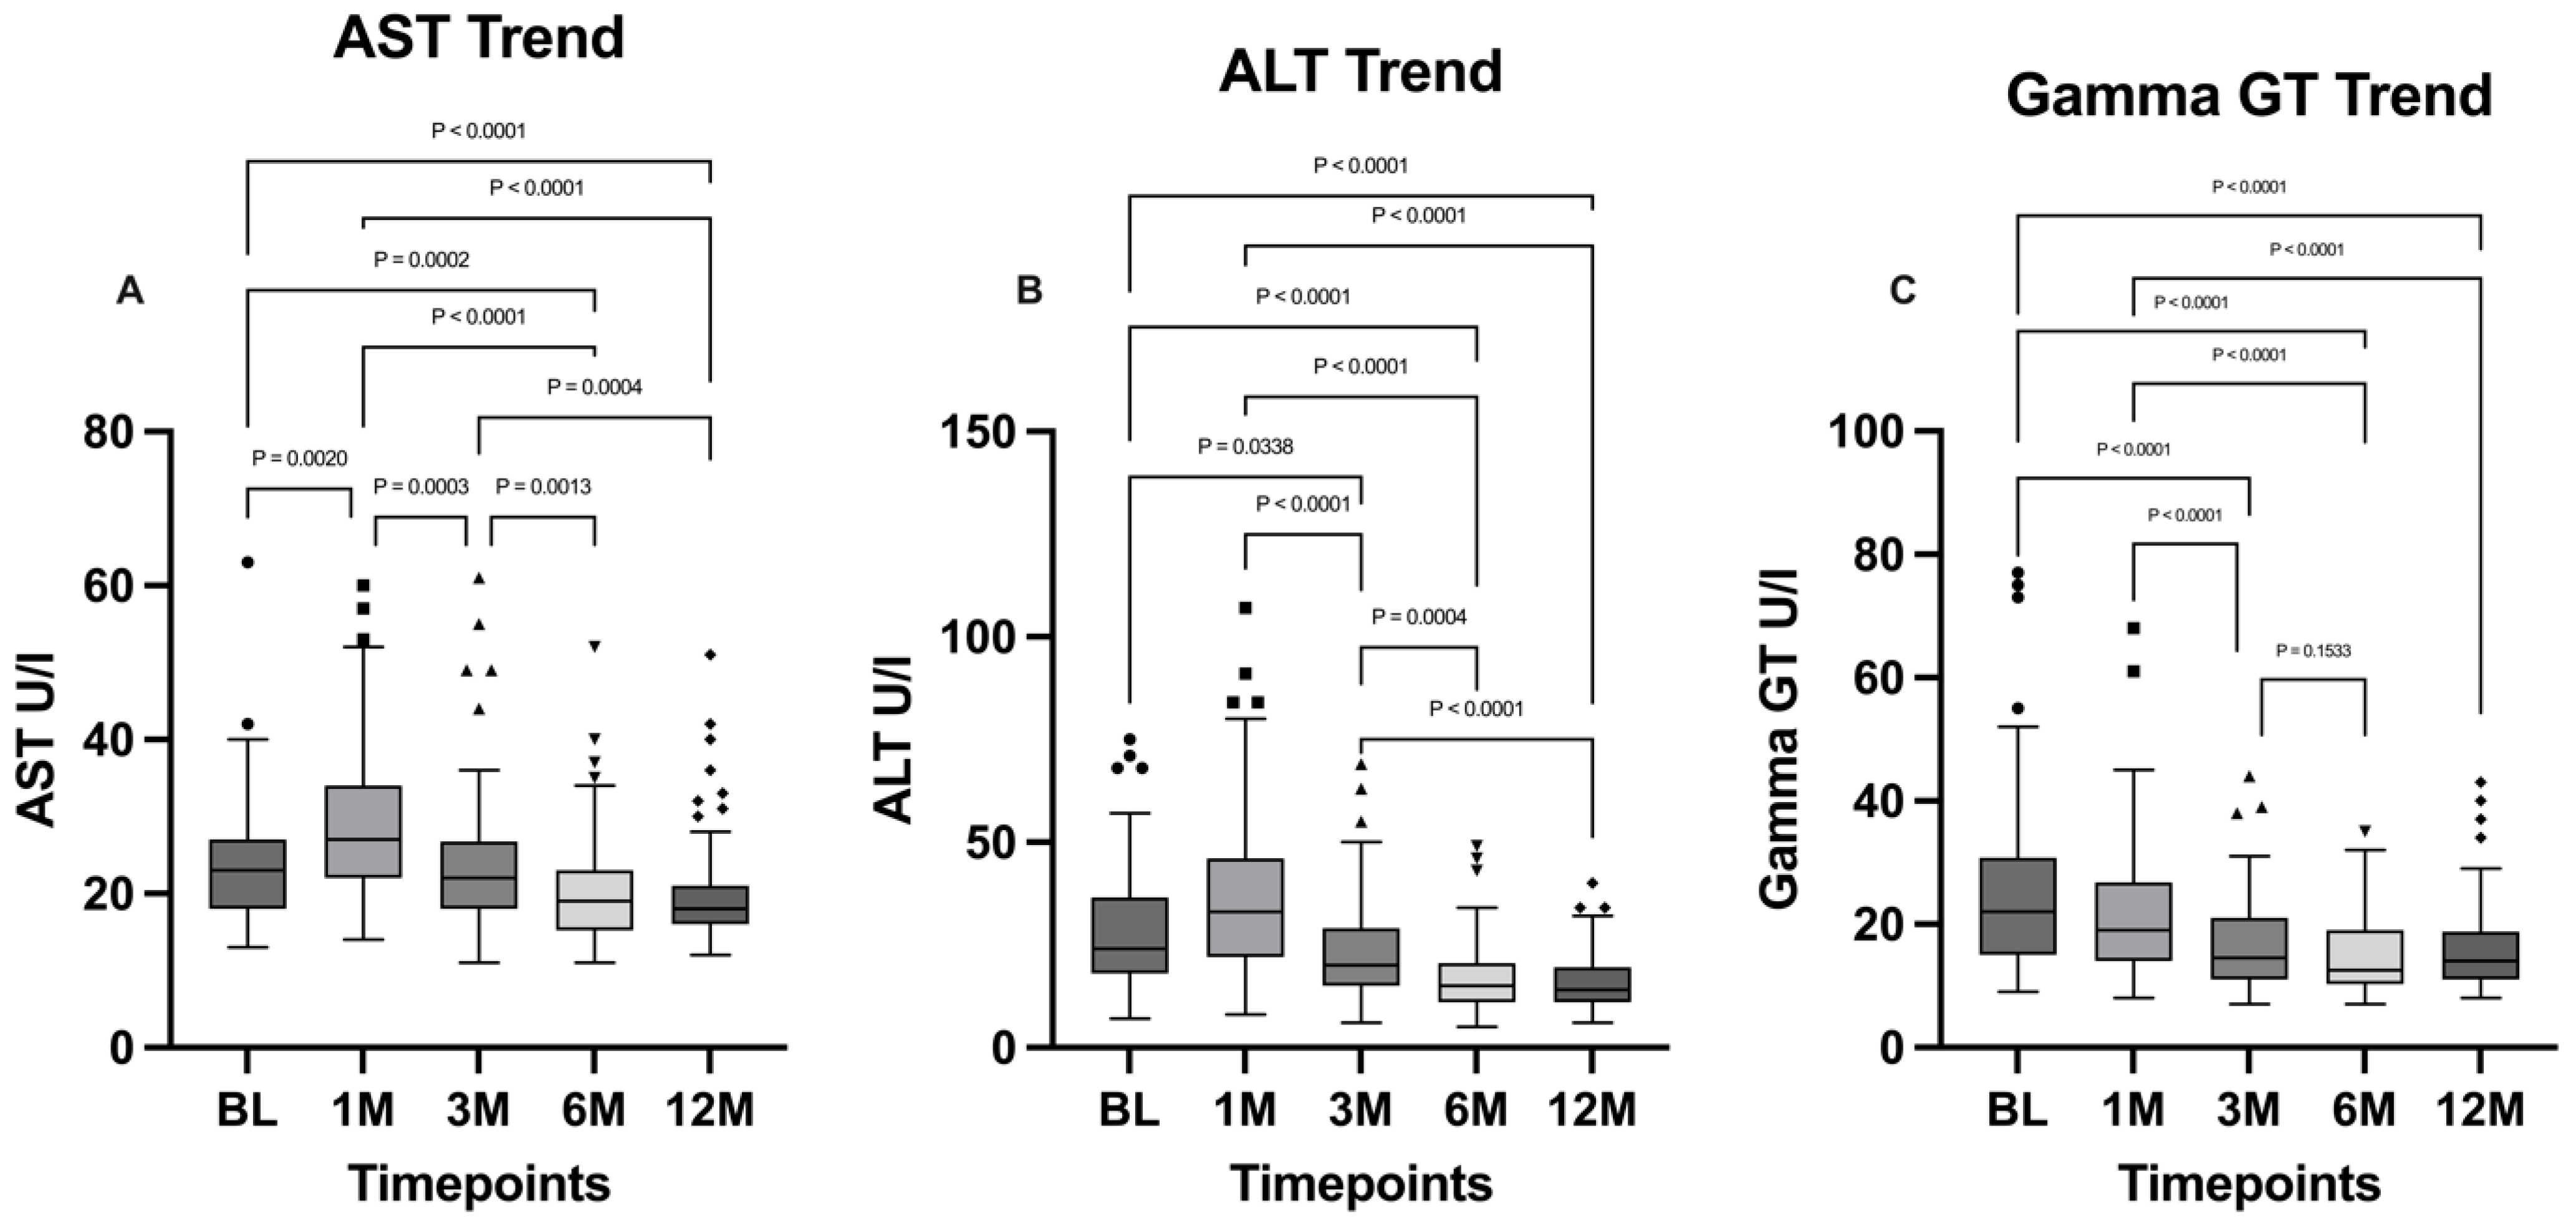
3.5. Liver Condition
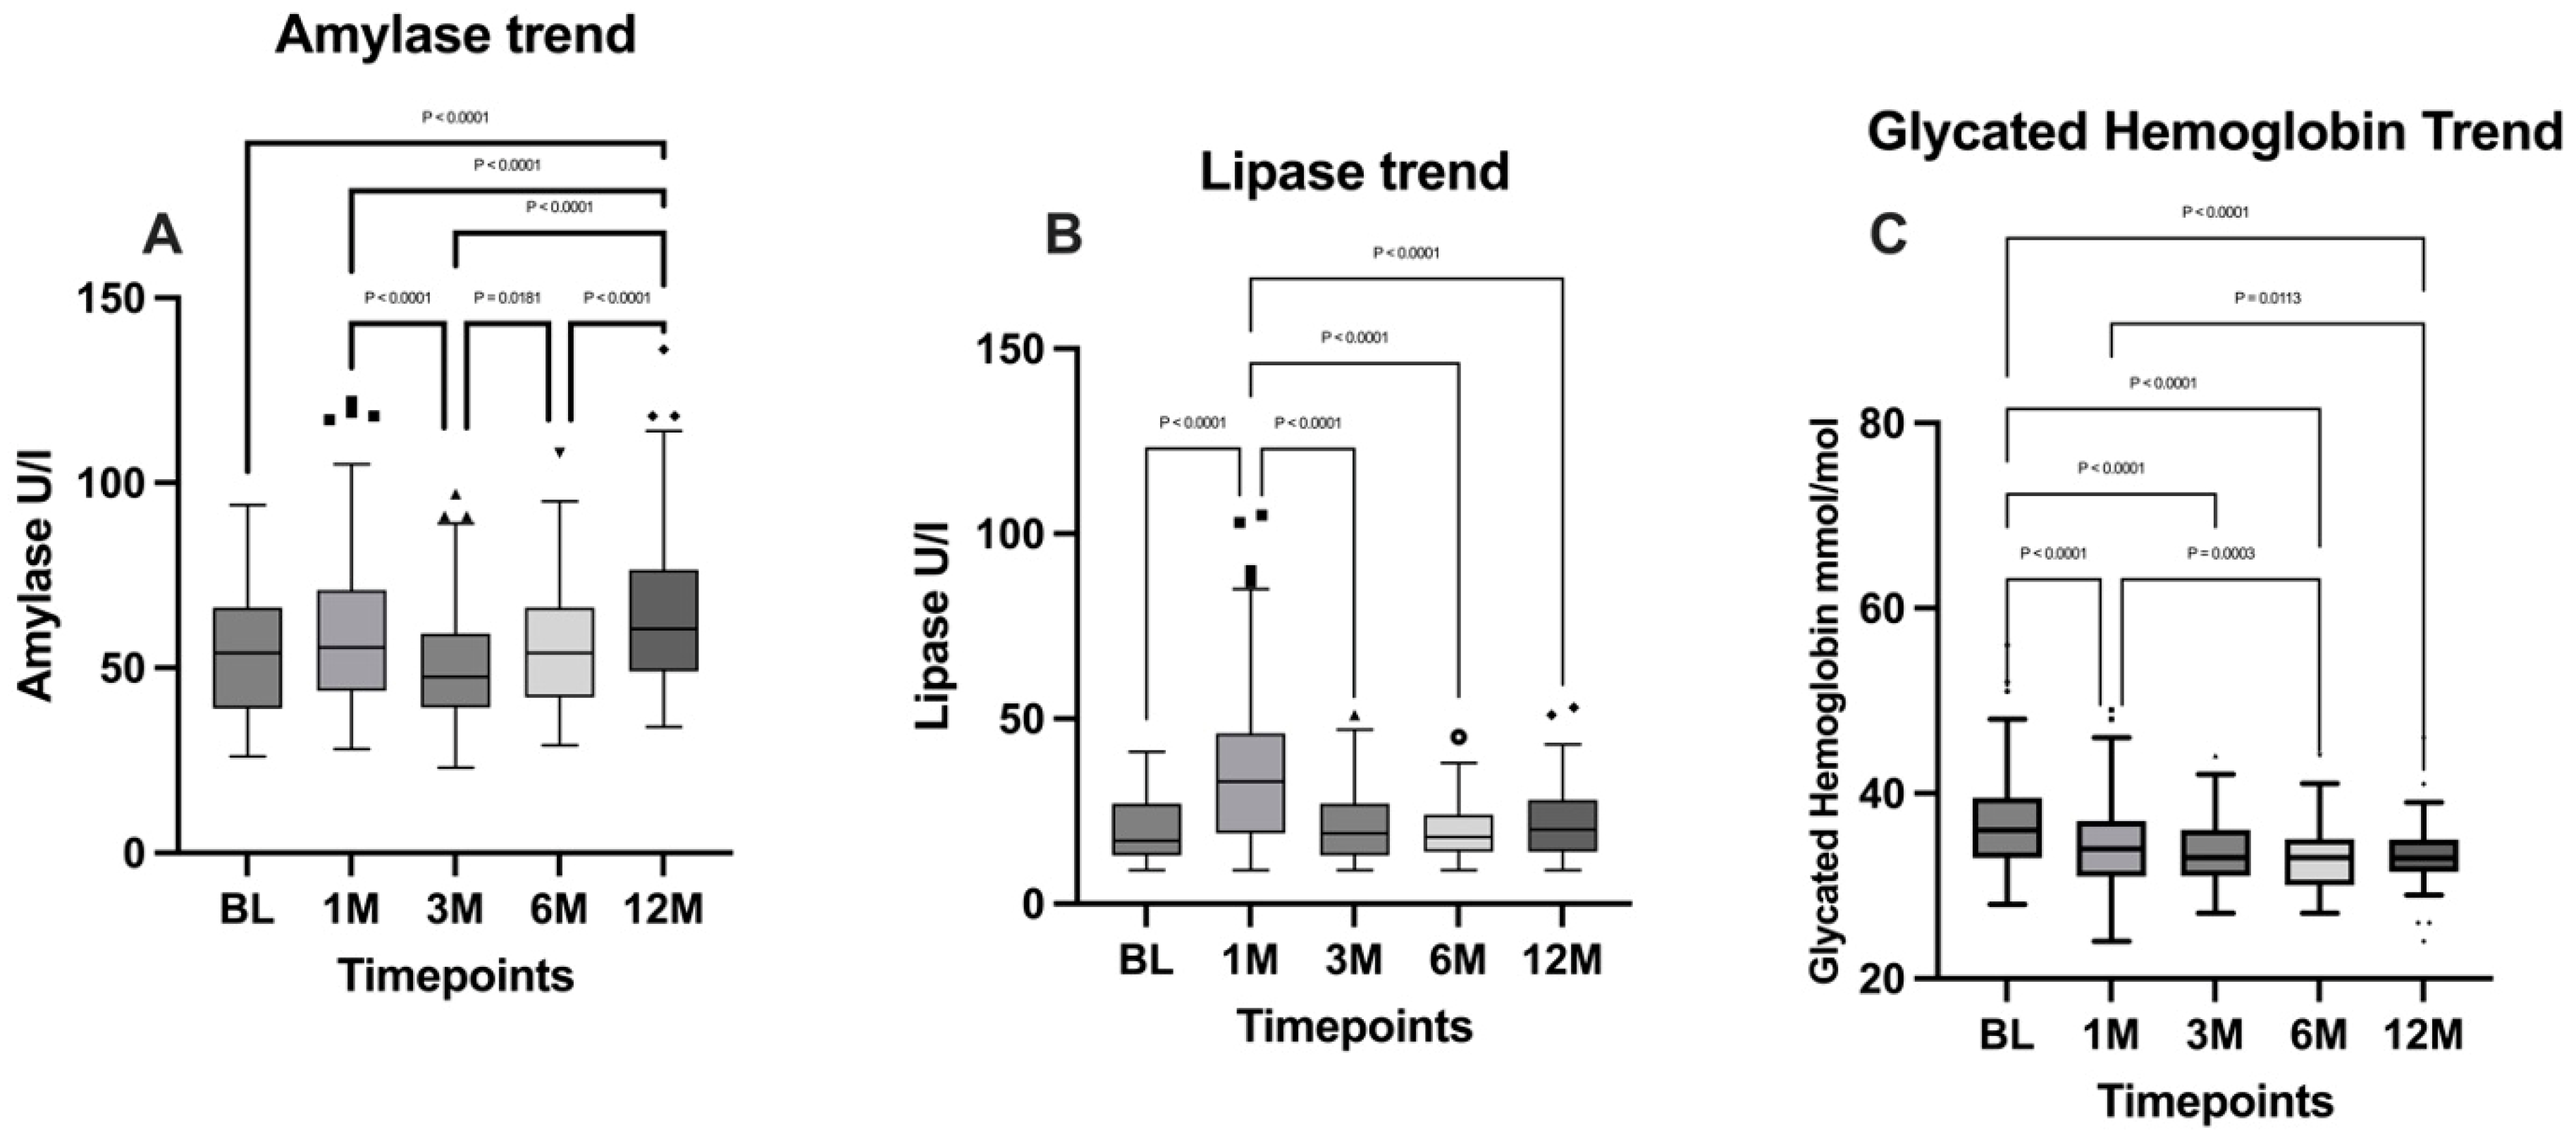
3.6. Pancreatic Functionality and Glucose Levels
4. Discussion
5. Conclusions
Author Contributions
Funding
Institutional Review Board Statement
Informed Consent Statement
Data Availability Statement
Conflicts of Interest
References
- Powell-Wiley, T.M.; Poirier, P.; Burke, L.E.; Després, J.-P.; Gordon-Larsen, P.; Lavie, C.J.; Lear, S.A.; Ndumele, C.E.; Neeland, I.J.; Sanders, P.; et al. Obesity and Cardiovascular Disease: A Scientific Statement From the American Heart Association. Circulation 2021, 143, e984–e1010. [Google Scholar] [CrossRef]
- Guh, D.P.; Zhang, W.; Bansback, N.; Amarsi, Z.; Birmingham, C.L.; Anis, A.H. The Incidence of Co-Morbidities Related to Obesity and Overweight: A Systematic Review and Meta-Analysis. BMC Public Health 2009, 9, 88. [Google Scholar] [CrossRef] [PubMed]
- Schlottmann, F.; Baz, C.; Pirzada, A.; Masrur, M.A. Postoperative Follow-up Compliance: The Achilles’ Heel of Bariatric Surgery. Obes. Surg. 2023, 33, 2945–2948. [Google Scholar] [CrossRef] [PubMed]
- O’Kane, M.; Parretti, H.M.; Hughes, C.A.; Sharma, M.; Woodcock, S.; Puplampu, T.; Blakemore, A.I.; Clare, K.; MacMillan, I.; Joyce, J.; et al. Guidelines for the Follow-Up of Patients Undergoing Bariatric Surgery. Clin. Obes. 2016, 6, 210–224. [Google Scholar] [CrossRef]
- Vidal, P.; Ramón, J.M.; Goday, A.; Parri, A.; Crous, X.; Trillo, L.; Pera, M.; Grande, L. Lack of Adherence to Follow-Up Visits After Bariatric Surgery: Reasons and Outcome. Obes. Surg. 2014, 24, 179–183. [Google Scholar] [CrossRef]
- Puzziferri, N.; Roshek, T.B.; Mayo, H.G.; Gallagher, R.; Belle, S.H.; Livingston, E.H. Long-term Follow-up After Bariatric Surgery: A Systematic Review. JAMA 2014, 312, 934. [Google Scholar] [CrossRef] [PubMed]
- Switzer, N.J.; Merani, S.; Skubleny, D.; Pelletier, J.-S.; Kanji, R.; Shi, X.; Birch, D.W.; De Gara, C.; Sharma, A.M.; Gill, R.S.; et al. Quality of Follow-up: Systematic Review of the Research in Bariatric Surgery. Ann. Surg. 2016, 263, 875–880. [Google Scholar] [CrossRef] [PubMed]
- Phelan, S.M.; Burgess, D.J.; Yeazel, M.W.; Hellerstedt, W.L.; Griffin, J.M.; Van Ryn, M. Impact of Weight Bias and Stigma on Quality of Care and Outcomes for Patients with Obesity. Obes. Rev. 2015, 16, 319–326. [Google Scholar] [CrossRef]
- Burgess, E.; Hassmén, P.; Pumpa, K.L. Determinants of Adherence to Lifestyle Intervention in Adults with Obesity: A Systematic Review. Clin. Obes. 2017, 7, 123–135. [Google Scholar] [CrossRef] [PubMed]
- Tolvanen, L.; Svensson, Å.; Hemmingsson, E.; Christenson, A.; Lagerros, Y.T. Perceived and Preferred Social Support in Patients Experiencing Weight Regain After Bariatric Surgery—A Qualitative Study. Obes. Surg. 2021, 31, 1256–1264. [Google Scholar] [CrossRef] [PubMed]
- Metzgar, C.J.; Preston, A.G.; Miller, D.L.; Nickols-Richardson, S.M. Facilitators and Barriers to Weight Loss and Weight Loss Maintenance: A Qualitative Exploration. J. Hum. Nutr. Diet. 2015, 28, 593–603. [Google Scholar] [CrossRef] [PubMed]
- Brethauer, S.A.; Kim, J.; El Chaar, M.; Papasavas, P.; Eisenberg, D.; Rogers, A.; Ballem, N.; Kligman, M.; Kothari, S. Standardized Outcomes Reporting in Metabolic and Bariatric Surgery. Surg. Obes. Relat. Dis. 2015, 11, 489–506. [Google Scholar] [CrossRef] [PubMed]
- Bjørklund, G.; Semenova, Y.; Pivina, L.; Costea, D.-O. Follow-up after bariatric surgery: A review. Nutrition 2020, 78, 110831. [Google Scholar] [CrossRef]
- Reiber, B.M.M.; Barendregt, R.; De Vries, R.; Bruin, S.C.; Van Der Peet, D.L. Is Adherence to Follow-Up After Bariatric Surgery Necessary? A Systematic Review and Meta-Analysis. Obes. Surg. 2022, 32, 904–911. [Google Scholar] [CrossRef] [PubMed]
- Kim, H.J.; Madan, A.; Fenton-Lee, D. Does Patient Compliance with Follow-up Influence Weight Loss After Gastric Bypass Surgery? A Systematic Review and Meta-Analysis. Obes. Surg. 2014, 24, 647–651. [Google Scholar] [CrossRef] [PubMed]
- Elfhag, K.; Rössner, S. Who Succeeds in Maintaining Weight Loss? A Conceptual Review of Factors Associated with Weight Loss Maintenance and Weight Regain. Obes. Rev. 2005, 6, 67–85. [Google Scholar] [CrossRef] [PubMed]
- Jones, D.E.; Carson, K.A.; Bleich, S.N.; Cooper, L.A. Patient Trust in Physicians and Adoption of Lifestyle Behaviors to Control High Blood Pressure. Patient Educ. Couns. 2012, 89, 57–62. [Google Scholar] [CrossRef]
- Carswell, K.A.; Belgaumkar, A.P.; Amiel, S.A.; Patel, A.G. A Systematic Review and Meta-Analysis of the Effect of Gastric Bypass Surgery on Plasma Lipid Levels. Obes. Surg. 2016, 26, 843–855. [Google Scholar] [CrossRef] [PubMed]
- Genua, I.; Ramos, A.; Caimari, F.; Balagué, C.; Sánchez-Quesada, J.L.; Pérez, A.; Miñambres, I. Effects of Bariatric Surgery on HDL Cholesterol. Obes. Surg. 2020, 30, 1793–1798. [Google Scholar] [CrossRef]
- Heffron, S.P.; Parikh, A.; Volodarskiy, A.; Ren-Fielding, C.; Schwartzbard, A.; Nicholson, J.; Bangalore, S. Changes in Lipid Profile of Obese Patients Following Contemporary Bariatric Surgery: A Meta-Analysis. Am. J. Med. 2016, 129, 952–959. [Google Scholar] [CrossRef] [PubMed]
- Kjellmo, C.A.; Karlsson, H.; Nestvold, T.K.; Ljunggren, S.; Cederbrant, K.; Marcusson-Ståhl, M.; Mathisen, M.; Lappegård, K.T.; Hovland, A. Bariatric Surgery Improves Lipoprotein Profile in Morbidly Obese Patients by Reducing LDL Cholesterol, apoB, and SAA/PON1 Ratio, Increasing HDL Cholesterol, but Has No Effect on Cholesterol Efflux Capacity. J. Clin. Lipidol. 2018, 12, 193–202. [Google Scholar] [CrossRef] [PubMed]
- PichÃ, M.-E. Effects of Bariatric Surgery on Lipid-Lipoprotein Profile. Metab. Clin. Exp. 2021, 115, 154441. [Google Scholar] [CrossRef] [PubMed]
- Chen, Y.; Zhang, W.; Pan, Y.; Chen, W.; Wang, C.; Yang, W.; on behalf of Chinese Obesity, Metabolic Surgery Collaborative. Thyroid Function Before and After Laparoscopic Sleeve Gastrectomy in Patients with Obesity. Obes. Surg. 2022, 32, 1954–1961. [Google Scholar] [CrossRef]
- Teke, E.; Güneş, Y.; Çoruhlu, B.; Esen Bulut, N.; Fersahoglu, M.M.; Ergin, A.; Sancak, S. Effects of laparoscopic Sleeve Gastrectomy on Thyroid Hormones and Relationship Between Metabolic Parameters and Long-Term Total Weight Loss. Surg. Endosc. 2024, 38, 1807–1812. [Google Scholar] [CrossRef] [PubMed]
- Tian, Z.; Nie, Y.; Li, Z.; Wang, P.; Zhang, N.; Hei, X.; Ping, A.; Liu, B.; Meng, H. Total Weight Loss Induces the Alteration in Thyroid Function After Bariatric Surgery. Front. Endocrinol. 2024, 15, 1333033. [Google Scholar] [CrossRef] [PubMed]
- Burza, M.A.; Romeo, S.; Kotronen, A.; Svensson, P.-A.; Sjöholm, K.; Torgerson, J.S.; Lindroos, A.-K.; Sjöström, L.; Carlsson, L.M.S.; Peltonen, M. Long-Term Effect of Bariatric Surgery on Liver Enzymes in the Swedish Obese Subjects (SOS) Study. PLoS ONE 2013, 8, e60495. [Google Scholar] [CrossRef] [PubMed]
- CRIO Group; Borges-Canha, M.; Neves, J.S.; Mendonça, F.; Silva, M.M.; Costa, C.; Cabral, P.M.; Guerreiro, V.; Lourenço, R.; Meira, P.; et al. The Impact of Bariatric Surgery on Hepatic Function and Predictors of Liver Steatosis and Fibrosis. Obes. Surg. 2020, 30, 2935–2941. [Google Scholar] [CrossRef]
- Elhelw, O.; Ragavan, S.; Majeed, W.; Alkhaffaf, B.; Mohammed, N.; Senapati, S.; Ammori, B.J.; Robinson, J.A.; Syed, A.A. The Impact of Bariatric Surgery on Liver Enzymes in People with Obesity: A 5-Year Observational Study. Surgeon 2024, 22, e26–e33. [Google Scholar] [CrossRef] [PubMed]
- Guan, B.; Chen, Y.; Chong, T.H.; Peng, J.; Mak, T.K.; Wang, C.; Yang, J. Effect of Bariatric Surgery on Serum Enzyme Status in Obese Patients. Obes. Surg. 2020, 30, 2700–2707. [Google Scholar] [CrossRef] [PubMed]
- Maggard-Gibbons, M.; Maglione, M.; Livhits, M.; Ewing, B.; Maher, A.R.; Hu, J.; Li, Z.; Shekelle, P.G. Bariatric Surgery for Weight Loss and Glycemic Control in Nonmorbidly Obese Adults With Diabetes: A Systematic Review. JAMA 2013, 309, 2250–2261. [Google Scholar] [CrossRef] [PubMed]
- Ribaric, G.; Buchwald, J.N.; McGlennon, T.W. Diabetes and Weight in Comparative Studies of Bariatric Surgery vs Conventional Medical Therapy: A Systematic Review and Meta-Analysis. Obes. Surg. 2014, 24, 437–455. [Google Scholar] [CrossRef] [PubMed]
- Schauer, P.R.; Bhatt, D.L.; Kirwan, J.P.; Wolski, K.; Brethauer, S.A.; Navaneethan, S.D.; Aminian, A.; Pothier, C.E.; Kim, E.S.; Nissen, S.E.; et al. Bariatric Surgery versus Intensive Medical Therapy for Diabetes—3-Year Outcomes. N. Engl. J. Med. 2014, 370, 2002–2013. [Google Scholar] [CrossRef] [PubMed]


| Comorbidity | N | Percentage |
|---|---|---|
| Cardiovascular diseases | 23 | 28.75% |
| Hypothyroidism | 12 | 15% |
| Type 2 diabetes mellitus | 6 | 7.5% |
| GERD | 5 | 6.25% |
| Insulin resistance | 5 | 6.25% |
| Autoimmune thyroiditis | 4 | 5% |
| Polycystic ovary syndrome | 2 | 2.5% |
| Timepoint | Mean BMI ± SD | Mean %TWL ± SD |
|---|---|---|
| Baseline | 42 ± 5.05 | - |
| 1 month | 38 ± 4.92 | 10.33 ± 2.58 |
| 3 months | 34 ± 4.74 | 19.50 ± 3.92 |
| 6 months | 30 ± 4.53 | 28.64 ± 5.35 |
| 12 months | 27 ± 4.08 | 35.70 ± 7.05 |
| Variable | BL | 1M | 3M | 6M | 12M |
|---|---|---|---|---|---|
| TSH, μU/mL (median, IQR) | 2.12 (1.43–2.84) | 1.55 (1.05–2.56) | 1.51 (1.09–2.09) | 1.5 (1.06–2.16) | 1.63 (1.23–2.33) |
| T3, pg/mL (median, IQR) | 3.57 (3.26–3.95) | 3.34 (3.1–3.63) | 3.34 (3.14–3.57) | 3.13 (2.89–3.35) | 3.1 (2.78–3.41) |
| T4, ng/dL (median, IQR) | 0.86 (0.76–0.97) | 0.87 (0.78–0.99) | 0.93 (0.80–1.02) | 0.84 (0.75–0.95) | 0.87 (0.72–1) |
Disclaimer/Publisher’s Note: The statements, opinions and data contained in all publications are solely those of the individual author(s) and contributor(s) and not of MDPI and/or the editor(s). MDPI and/or the editor(s) disclaim responsibility for any injury to people or property resulting from any ideas, methods, instructions or products referred to in the content. |
© 2024 by the authors. Licensee MDPI, Basel, Switzerland. This article is an open access article distributed under the terms and conditions of the Creative Commons Attribution (CC BY) license (https://creativecommons.org/licenses/by/4.0/).
Share and Cite
Sofia, M.; Agosta, M.; D’Amato, S.; Conti, G.N.; Mazzone, C.; Faletra, G.; La Greca, G.; Latteri, S. Postoperative Biochemical Outcomes in Metabolic Bariatric Surgery: Results from a High-Adherence Cohort. J. Pers. Med. 2025, 15, 7. https://doi.org/10.3390/jpm15010007
Sofia M, Agosta M, D’Amato S, Conti GN, Mazzone C, Faletra G, La Greca G, Latteri S. Postoperative Biochemical Outcomes in Metabolic Bariatric Surgery: Results from a High-Adherence Cohort. Journal of Personalized Medicine. 2025; 15(1):7. https://doi.org/10.3390/jpm15010007
Chicago/Turabian StyleSofia, Maria, Marcello Agosta, Sara D’Amato, Giuseppe Nicolò Conti, Chiara Mazzone, Gloria Faletra, Gaetano La Greca, and Saverio Latteri. 2025. "Postoperative Biochemical Outcomes in Metabolic Bariatric Surgery: Results from a High-Adherence Cohort" Journal of Personalized Medicine 15, no. 1: 7. https://doi.org/10.3390/jpm15010007
APA StyleSofia, M., Agosta, M., D’Amato, S., Conti, G. N., Mazzone, C., Faletra, G., La Greca, G., & Latteri, S. (2025). Postoperative Biochemical Outcomes in Metabolic Bariatric Surgery: Results from a High-Adherence Cohort. Journal of Personalized Medicine, 15(1), 7. https://doi.org/10.3390/jpm15010007