Abstract
Objective: To systematically review and meta-analyze the predictive value of the Fournier gangrene severity index (FGSI), the simplified FGSI (SFGSI), and the Uludag FGSI (UFGSI) on mortality in patients affected by Fournier’s Gangrene (FG). Methods: A search was performed in PubMed, Web of Science, Embase, and the Cochrane Library, from January 2000 to May 2023, to identify original cohorts comparing data between surviving and non-surviving FG patients. The statistical analysis consisted of two parts. First, the mean and standard deviation (SD) of the FGSI, SFGSI, and UFGSI at admission were extrapolated from each study, and the pooled mean difference (MD) with 95% confidence interval (95% CI) was obtained using the Der Simonian–Laird random-effect model. Second, to evaluate the accuracy of the FGSI, SFGSI, and UFSGI in predicting mortality, true positive (TP), false positive (FP), true negative (TN), and false negative (FN) values were extracted where possible and reported in 2 × 2 contingency tables. The sensitivity, specificity, and AUC values were pooled, and summary receiver operating characteristic (SROC) curves were constructed. Results: Overall, forty studies comprising 2257 patients were included. The pooled analysis revealed that the FGSI, SFGSI, and UFGSI values at admission were higher in non-survivors than survivors (MD: 5.53 (95% CI: 4.68–6.37); MD: 2.41 (95% CI: 1.06–3.77); and MD: 5.47 (95% CI: 3.68–7.26), respectively). Moreover, the AUC values of the FGSI, SFGSI, and UFGSI were 0.90 (95% CI: 0.87–0.92), 0.84 (95% CI: 0.80–0.87), and 0.94 (95% CI: 0.92–0.96), respectively. Conclusions: The higher scores of the FGSI, SFGSI, and UFGSI on admission were associated with mortality. Moreover, when comparing accuracy rates, the UFGSI exhibited the highest AUC value.
1. Introduction
Fournier’s gangrene (FG) is a rare and potentially life-threatening necrotizing fasciitis that affects the genital and perineal regions. FG infection is often polymicrobial, caused by a synergy of aerobic and anaerobic bacteria. Despite the substantial advancements in understanding the underlying causes and mechanisms of FG, the mortality rates related to this condition are still elevated, ranging from 5% to 65% [1,2].
To date, the clinical management of FG consists of extensive surgical debridement, fascia incision, the drainage of necrotic tissue, and sufficient intravenous administration of broad-spectrum antibiotics [3]. Moreover, recent studies have also highlighted the potential benefits of hyperbaric oxygen therapy [4]; however, its application is still limited, due to challenges in accessing and transferring patients to units that offer this service.
In the last decades, several scoring systems have been conceived to assess the severity of FG at the time of admission. The Fournier gangrene severity index (FGSI), developed by Laor et al. in 1995, represents one of the most commonly used scoring systems able to predict the likelihood of mortality in patients with FG [5]. More specifically, the FGSI incorporates nine clinical and laboratory parameters (including temperature, heart rate, respiratory rate, sodium, potassium, creatinine, leukocytes, hematocrit, and bicarbonate). In this context, each parameter is given a score on a scale from 0 to 4, and the overall score is calculated by adding together the points assigned to each parameter. Later, in 2010, Yilmazlar et al. proposed the Uludag FGSI (UFGSI) by incorporating the age and the extent of the disease to the FGSI [6]. Here, the authors found that the UFGSI outperformed the FGSI in predicting mortality (ROC curves: 0.94 vs. 0.84). Finally, a shorter version of the FGSI, known as the simplified FGSI (SFGSI), was introduced by Lin et al. by including only three variables (serum potassium, creatinine, and hematocrit), with the aim of establishing a more user-friendly score while at the same time maintaining a high sensitivity and specificity [7].
The aim of this systematic review and meta-analysis is to investigate the predictive values and accuracy of the FGSI, SFGSI, and UFGSI on mortality in patients affected by FG.
2. Materials and Methods
2.1. Study Design and Search Strategy
This meta-analysis was conducted in accordance with the preferred reporting items for systematic review and eta-analyses (PRISMA) guidelines [8]. A literature search using electronic databases (PubMed, Web of Science, Embase, and the Cochrane Library) was performed from January 2000 to May 2023. The search strategy included a comprehensive set of the following keywords: (“Fournier”[All Fields] OR “fourniers”[All Fields] OR “fourniers”[All Fields]) AND “FGSI”[All Fields]; (“Fournier gangrene”[MeSH Terms] OR (“Fournier”[All Fields] AND “gangrene”[All Fields]) OR “Fournier gangrene”[All Fields]) AND “SFGSI”[All Fields]; (“Fournier gangrene”[MeSH Terms] OR (“Fournier”[All Fields] AND “gangrene”[All Fields]) OR “Fournier gangrene”[All Fields]) AND “UFGSI”[All Fields]. Only English-language studies published in peer-reviewed journals were included.
2.2. Eligibility Criteria
All relevant original publications reporting FGSI, UFGSI and SFGSI scores at admission and comparing data between surviving and non-surviving FG patients were included.
The clinical and laboratory parameters constituting the FGSI, UFGSI and SFGSI are shown in Table 1.

Table 1.
Clinical and laboratory parameters constituting the three evaluated scoring systems (FGSI, UFGSI, and SFGSI).
Studies were excluded if they met one of the following exclusion criteria: (1) in vitro or animal study; (2) data duplication, data overlapping, or unreliably extracted or incomplete data; (3) abstract only article, review, thesis, book, conference paper, editorial, author response, letter, and comments; (4) article without available full text along with (5) any previous systematic review, meta-analysis, or literature review on the topic of interest. After deduplication, title screening and abstract screening were performed by two independent reviewers (A.T. and F.P.) to select the relevant studies. Eligible articles were further screened for inclusion in the systematic review and meta-analysis. Any disagreement was resolved by discussion and by consulting the senior reviewer when necessary (U.A.).
2.3. Data Extraction and Management
For each database, we downloaded all references that matched the final search terms using Endnote X9 software (Version 3.3, Clarivate Analytics, London, UK). Moreover, we examined the reference list of the eligible studies identified during the screening process to search for any additional studies. After the selection of articles based on the predefined inclusion criteria, the full texts were subject to data extraction by two authors using a Microsoft Excel file. Data were rechecked by at least two independent reviewers to ensure the accuracy of the extracted data. All disagreements and discrepancies were resolved by discussion and consultation with a senior team member when necessary (C.L.). Papers published by the same research group and studying the same factors were checked for potential duplicate data based on the year of patient recruitment and the hospital where the patients were recruited and by confirmation from the study authors. The study that had the longest follow-up time was selected for inclusion.
2.4. Quality Assessment
The quality of each study was independently evaluated by two investigators (P.D. and A.T.) according to the National Institutes of Health’s (NIH) quality assessment tool (Supplementary Table S1) [9]. The assessment of each study’s quality was achieved using a scoring system comprising 14 questions. The interpretation of the scores was as follows: studies obtaining a score of 13–14 were categorized as exhibiting good quality, while those scoring between 9 and 12 were deemed fair. Studies scoring below 9 were regarded as poor quality, specifically in the context of cohort studies. Divergences and discrepancies were resolved through discussion or consultation with a third party.
2.5. Statistical Analysis and Data Synthesis
The statistical analysis consisted of 2 parts. First, studies reporting the mean and standard deviation (SD) of the FGSI, SFGSI, and UFGSI at the time of admission between two cohorts (survivors vs. non-survivors) were extracted, and the pooled mean differences (MD) with 95% confidence interval (95% CI) were obtained using the Der Simonian–Laird random-effect model. To estimate the mean and standard deviation for non-normal data based on the provided median and interquartile range (IQR), we utilized the approach described by Hozo et al. [10]. The heterogeneity between studies was evaluated with p value and I2. I2 ≥ 50% or p ≤ 0.05 was deemed to represent significant heterogeneity. On the contrary, if statistical study heterogeneity was not observed (I2 ≤ 50% and p ≥ 0.05), a fixed-effects model was used.
Second, to evaluate the accuracy of the FGSI, SFGSI, and UFSGI, true positive (TP), false positive (FP), true negative (TN), and false negative (FN) values were extracted, whenever possible, from each study and reported in 2 × 2 contingency tables. Finally, sensitivity, specificity, and AUC from different studies were pooled and summary receiver operating characteristic (SROC) curves were constructed.
Publication bias was evaluated both qualitatively and quantitatively in this study. Qualitatively, the assessment was conducted using funnel plots by comparing the standardized mean difference (SMD) and the standard error of the natural logarithm of SMD (SE(SMD)) (Supplementary Figures S1–S3). Additionally, a quantitative analysis was performed using Galbraith plots to determine the presence of small-study effects (Supplementary Figures S4–S6). All of the analyses were accomplished using Stata version 18 (Stata Corporation, College Station, TX, USA), with all tests being two-sided, and with a statistical significance set at <0.05.
3. Results
3.1. Included Studies and Study Characteristics
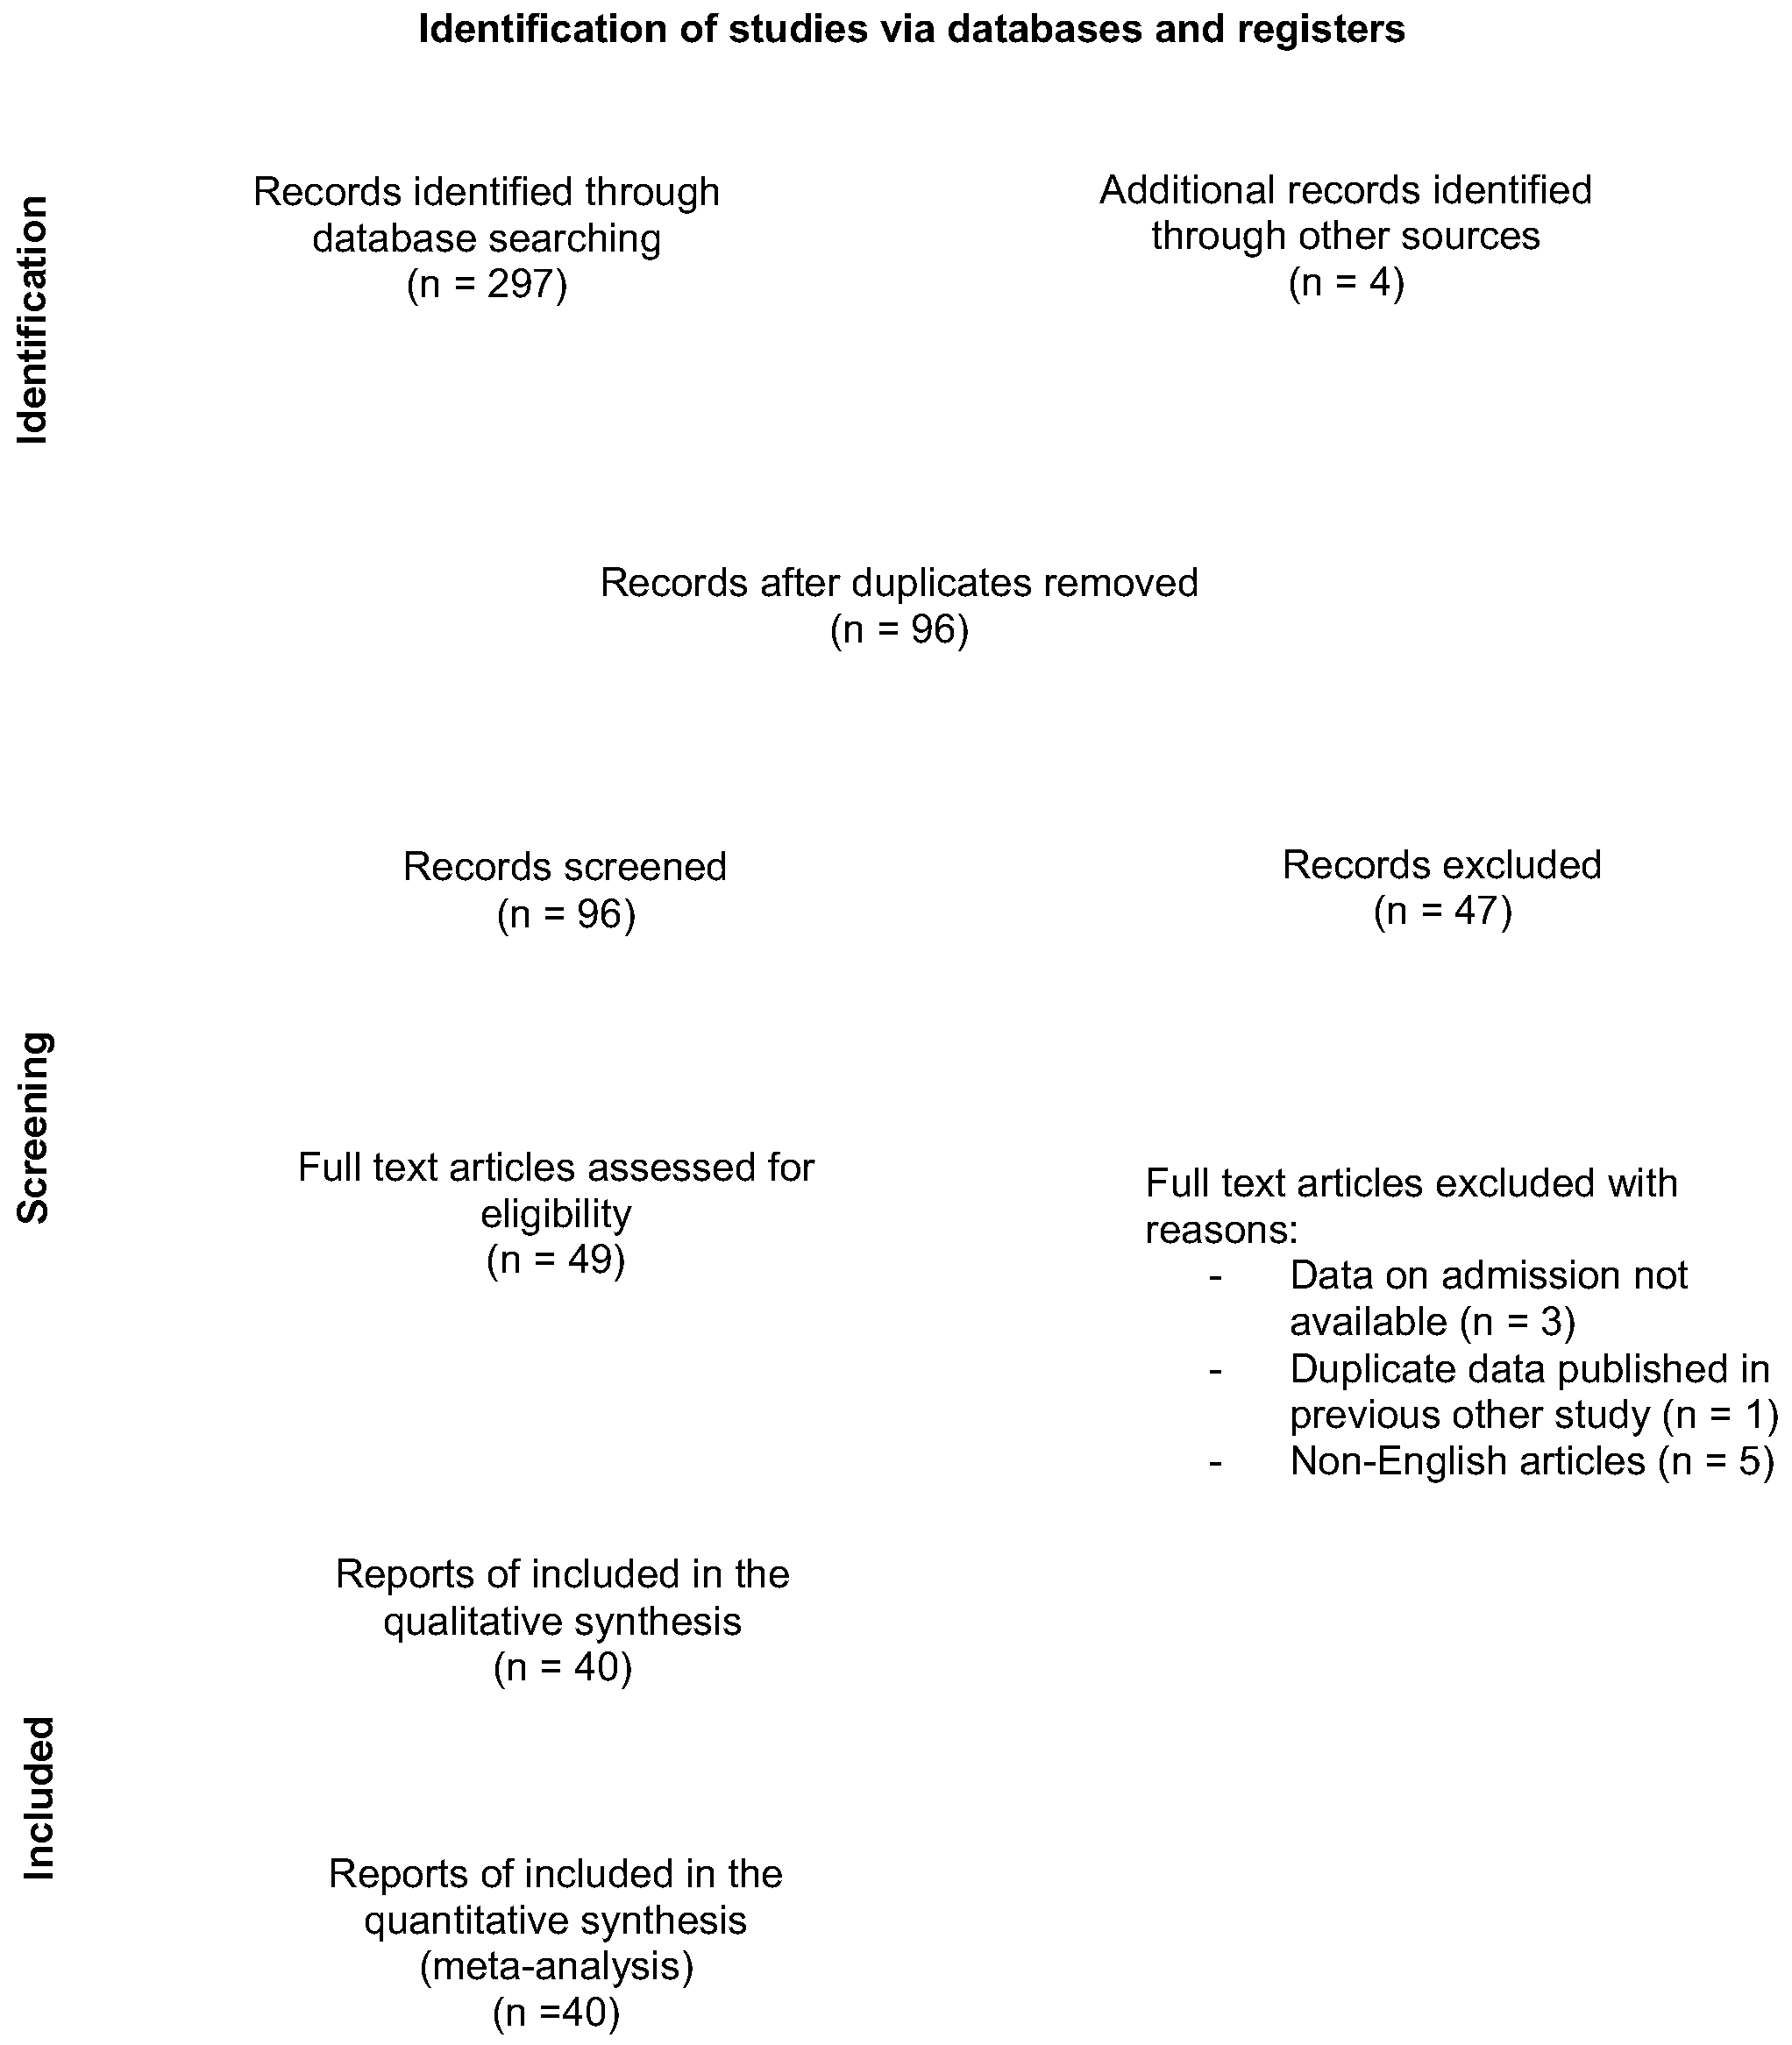
Our search initially yielded 301 article references (Figure 1). Of those, 205 were subsequently removed, due to either duplication or not meeting the inclusion criteria. Full-text articles were then re-evaluated and critically analyzed for the remaining 49 references. Of those, nine were excluded, with reasons. Finally, the remaining 40 articles [6,7,11,12,13,14,15,16,17,18,19,20,21,22,23,24,25,26,27,28,29,30,31,32,33,34,35,36,37,38,39,40,41,42,43,44,45,46,47,48], comprising a total of 2257 patients, were considered for our systematic review and meta-analysis. The main characteristics of the included studies are detailed in Table 2. Of those, 36 were single-center studies and 4 were multi-center studies. Moreover, 38 studies were retrospective, and only 2 were prospective. The sample size varied between 16 and 150 patients, with a mean age ranging from 44.6 to 65.9 years.

Figure 1.
Flow diagram showing the number of abstracts and articles screened and evaluated during the review process.
Table 2.
Main characteristics of the included studies.
3.2. The Prognostic Value of FGSI
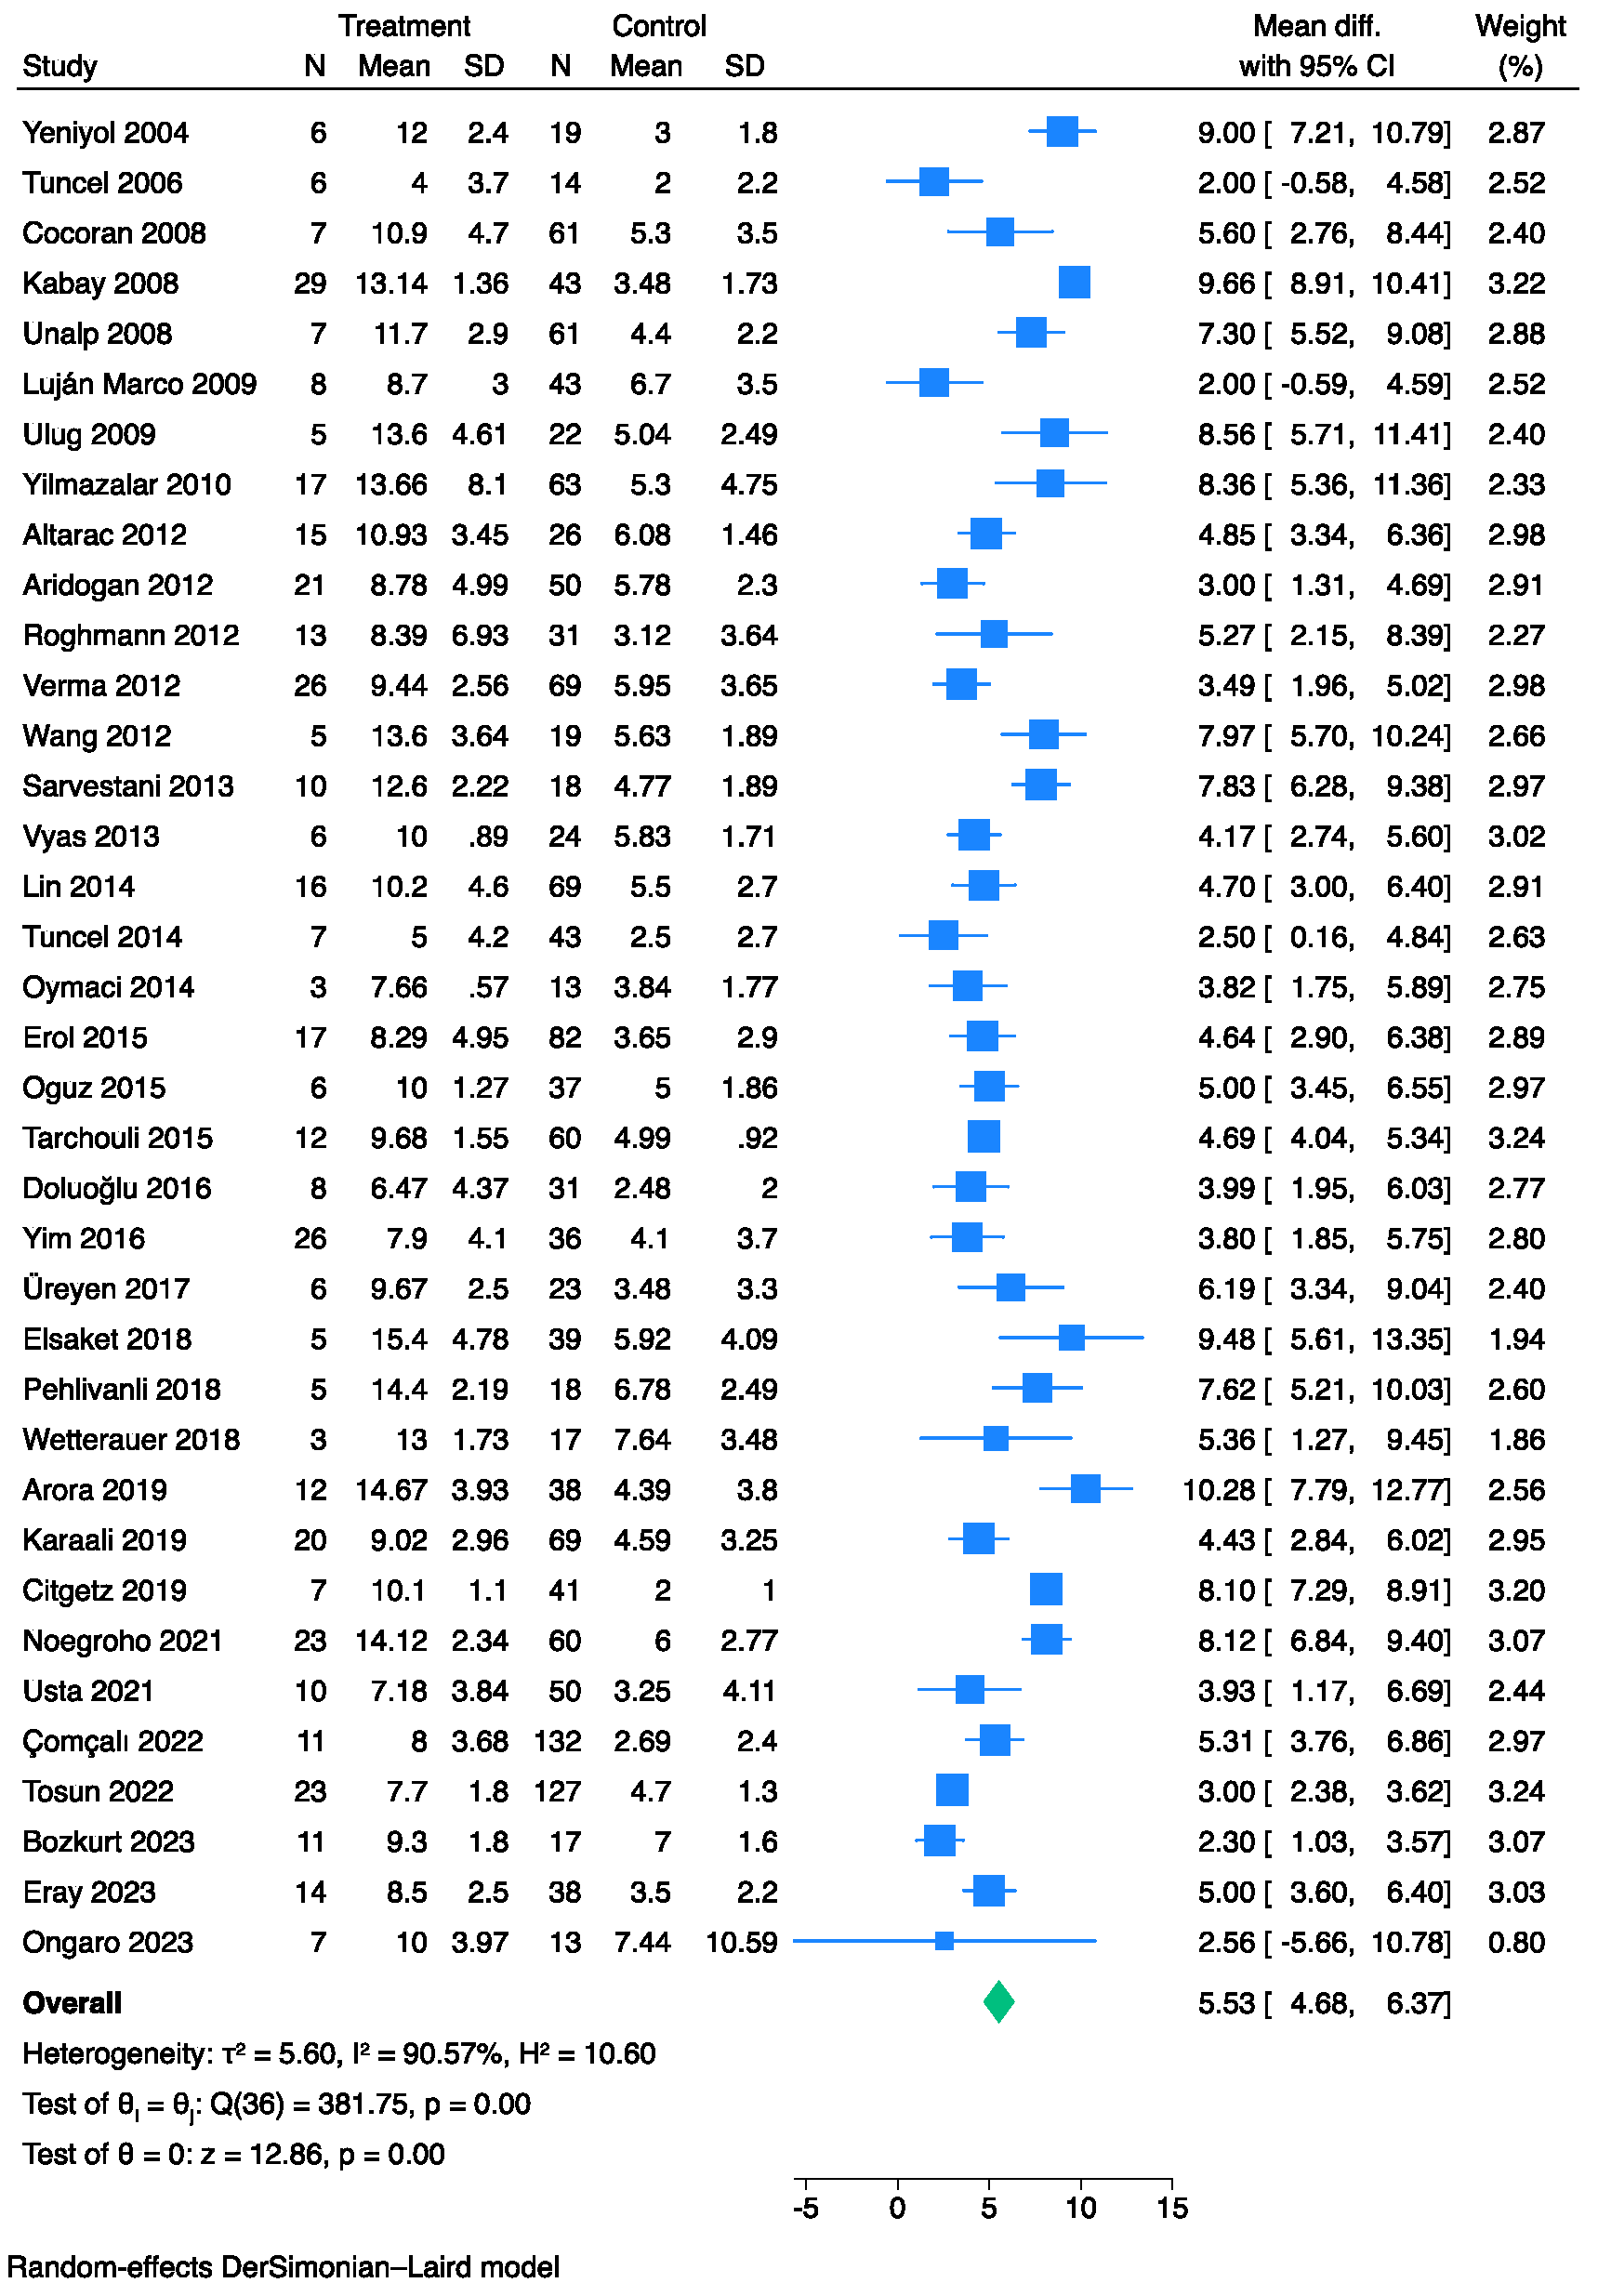
Overall, 37 studies [6,7,11,12,13,14,15,16,17,18,19,20,21,22,23,24,25,26,27,28,29,30,31,32,33,34,36,37,38,39,41,42,43,44,45,47,48] comprising 2043 patients with FG and evaluable FGSI data at admission were compared between survivors and non-survivors. The pooled analysis showed that the non-survivor cohorts exhibited higher FGSI values than the survivors (MD: 5.53, 95% CI: 4.68–6.37) (Figure 2). However, significant heterogeneity was observed across the studies (I2: 91%).
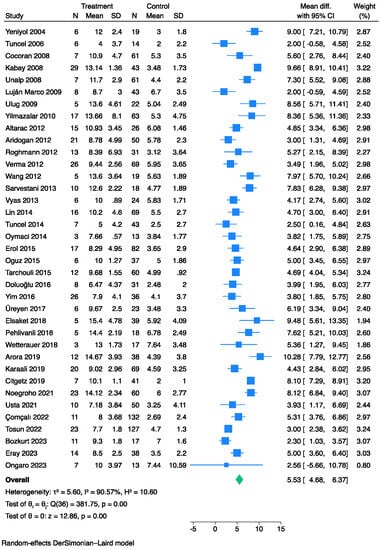
Figure 2.
Forest plot for studies using the Der Simonian-Laird random-effect models showing elevated FGSI scores on admission in non-survivors vs. survivors.
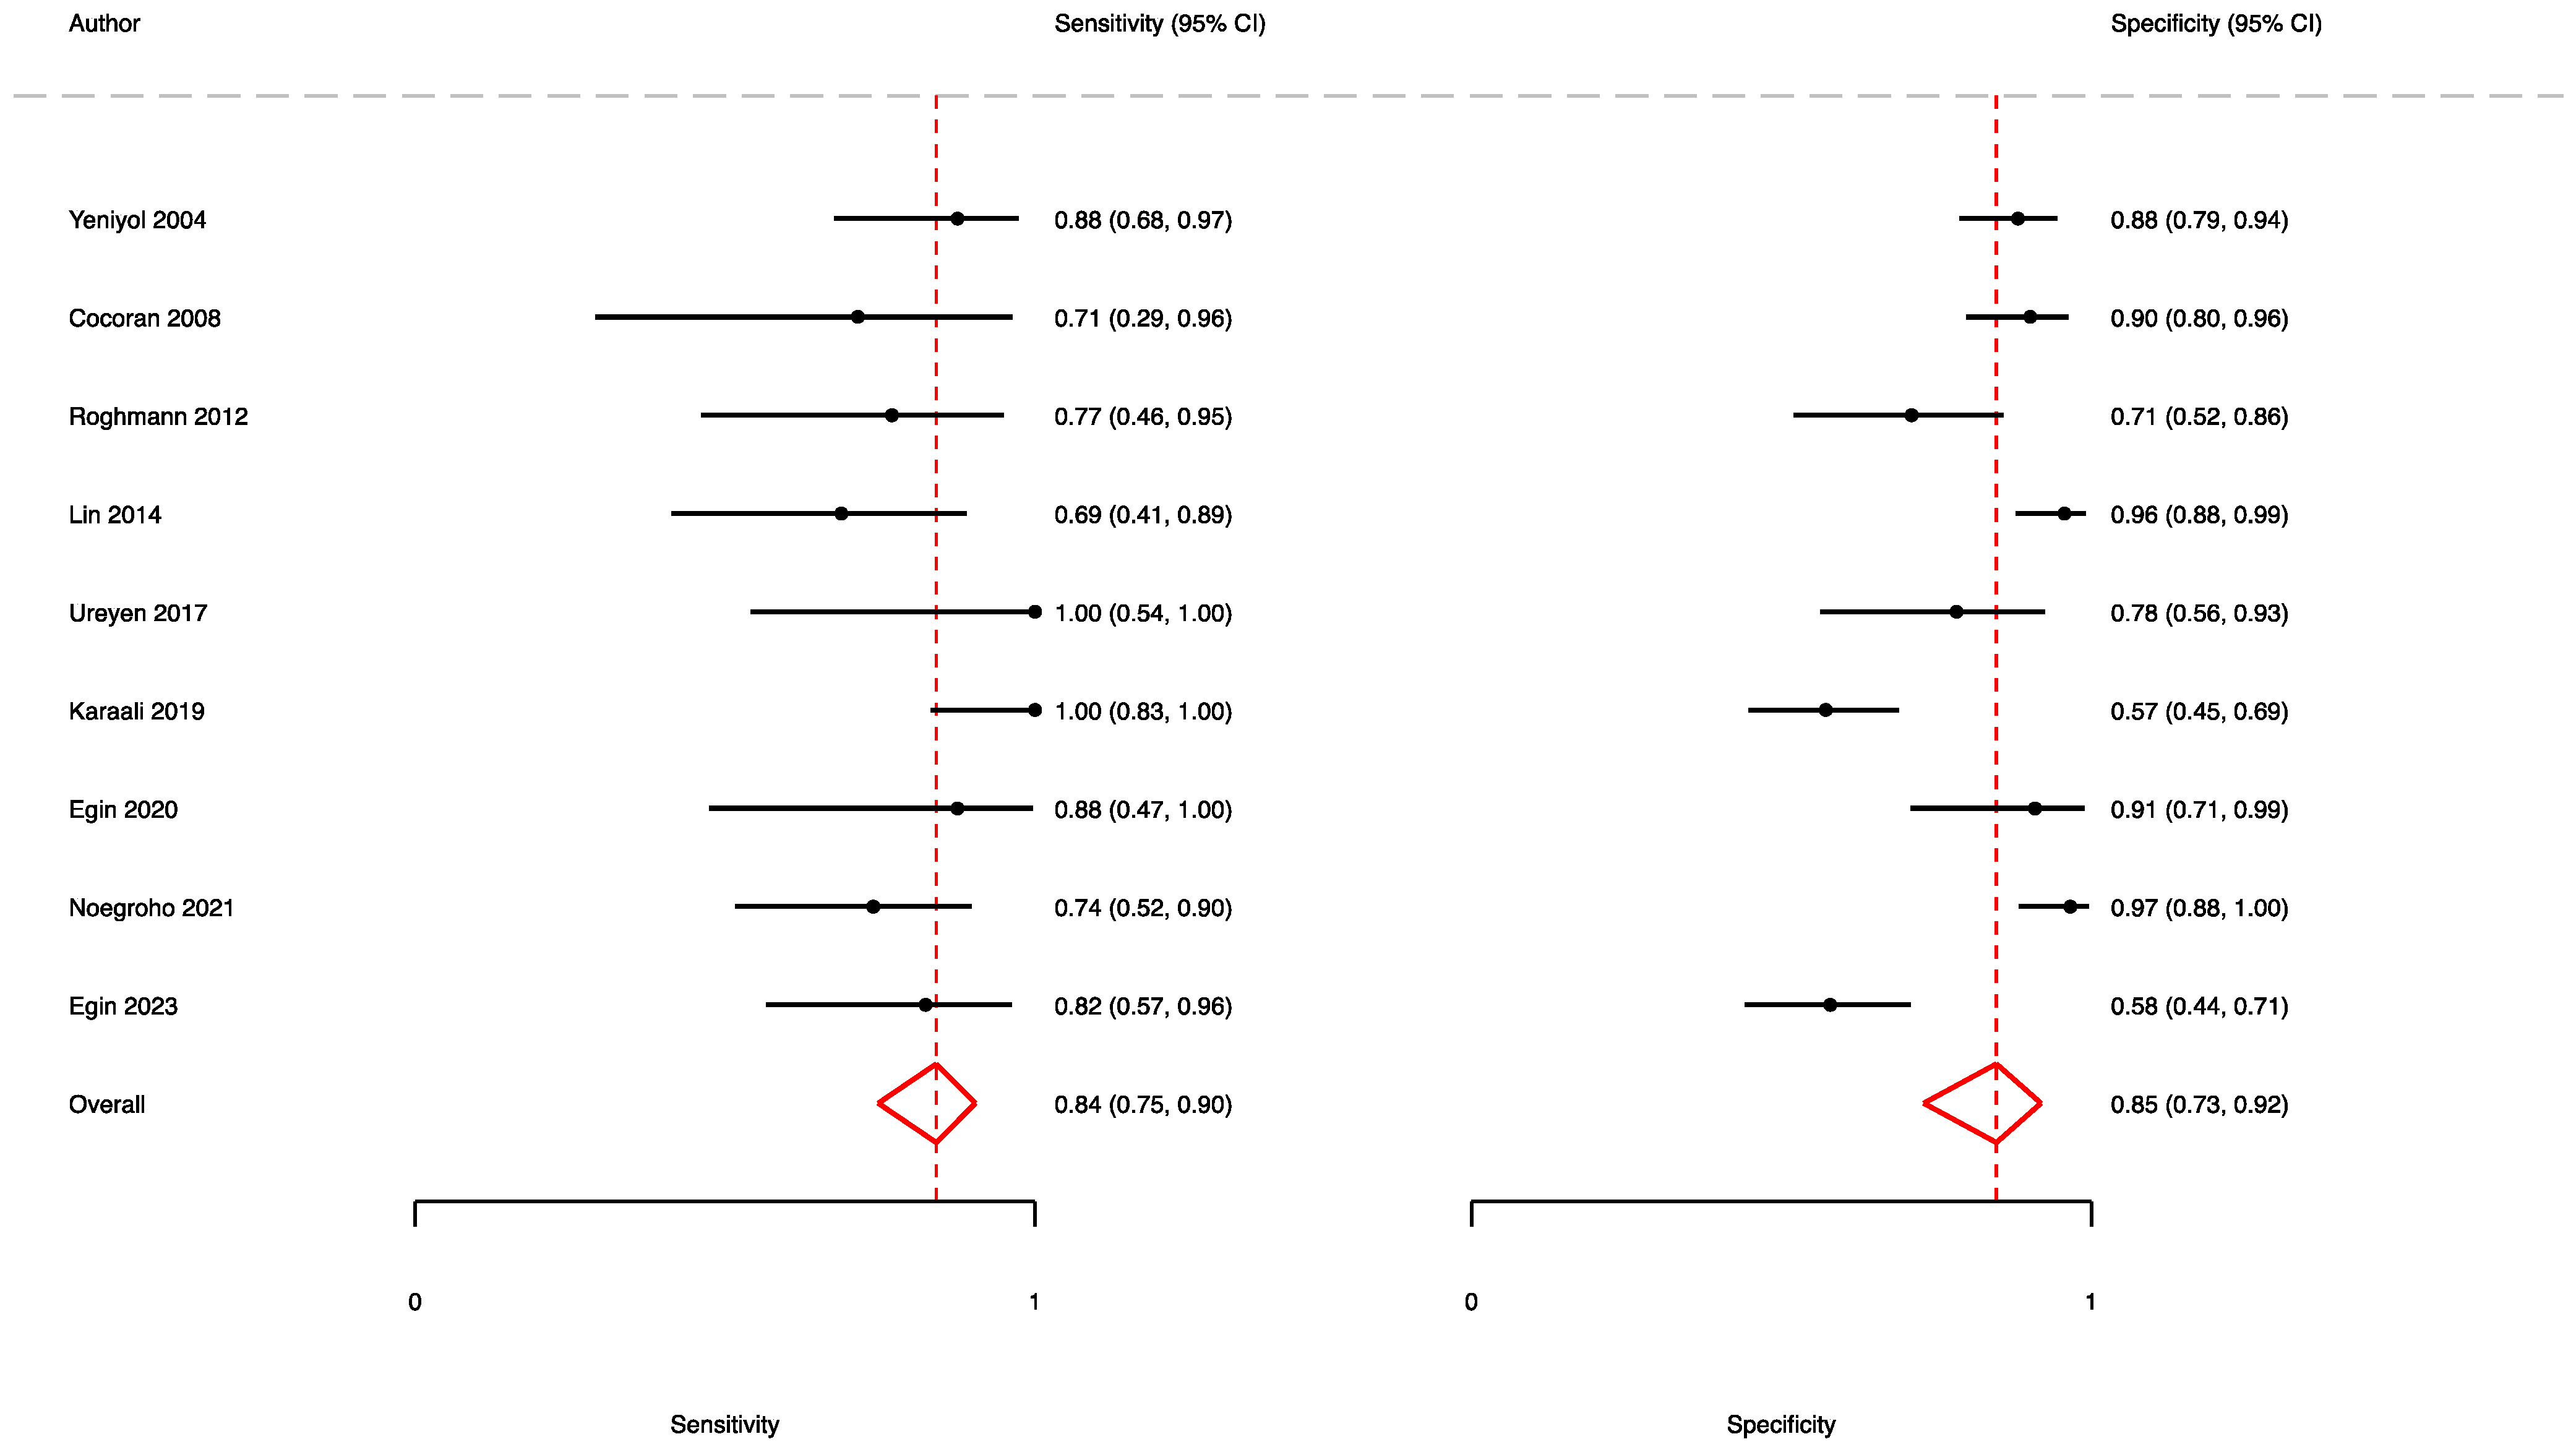
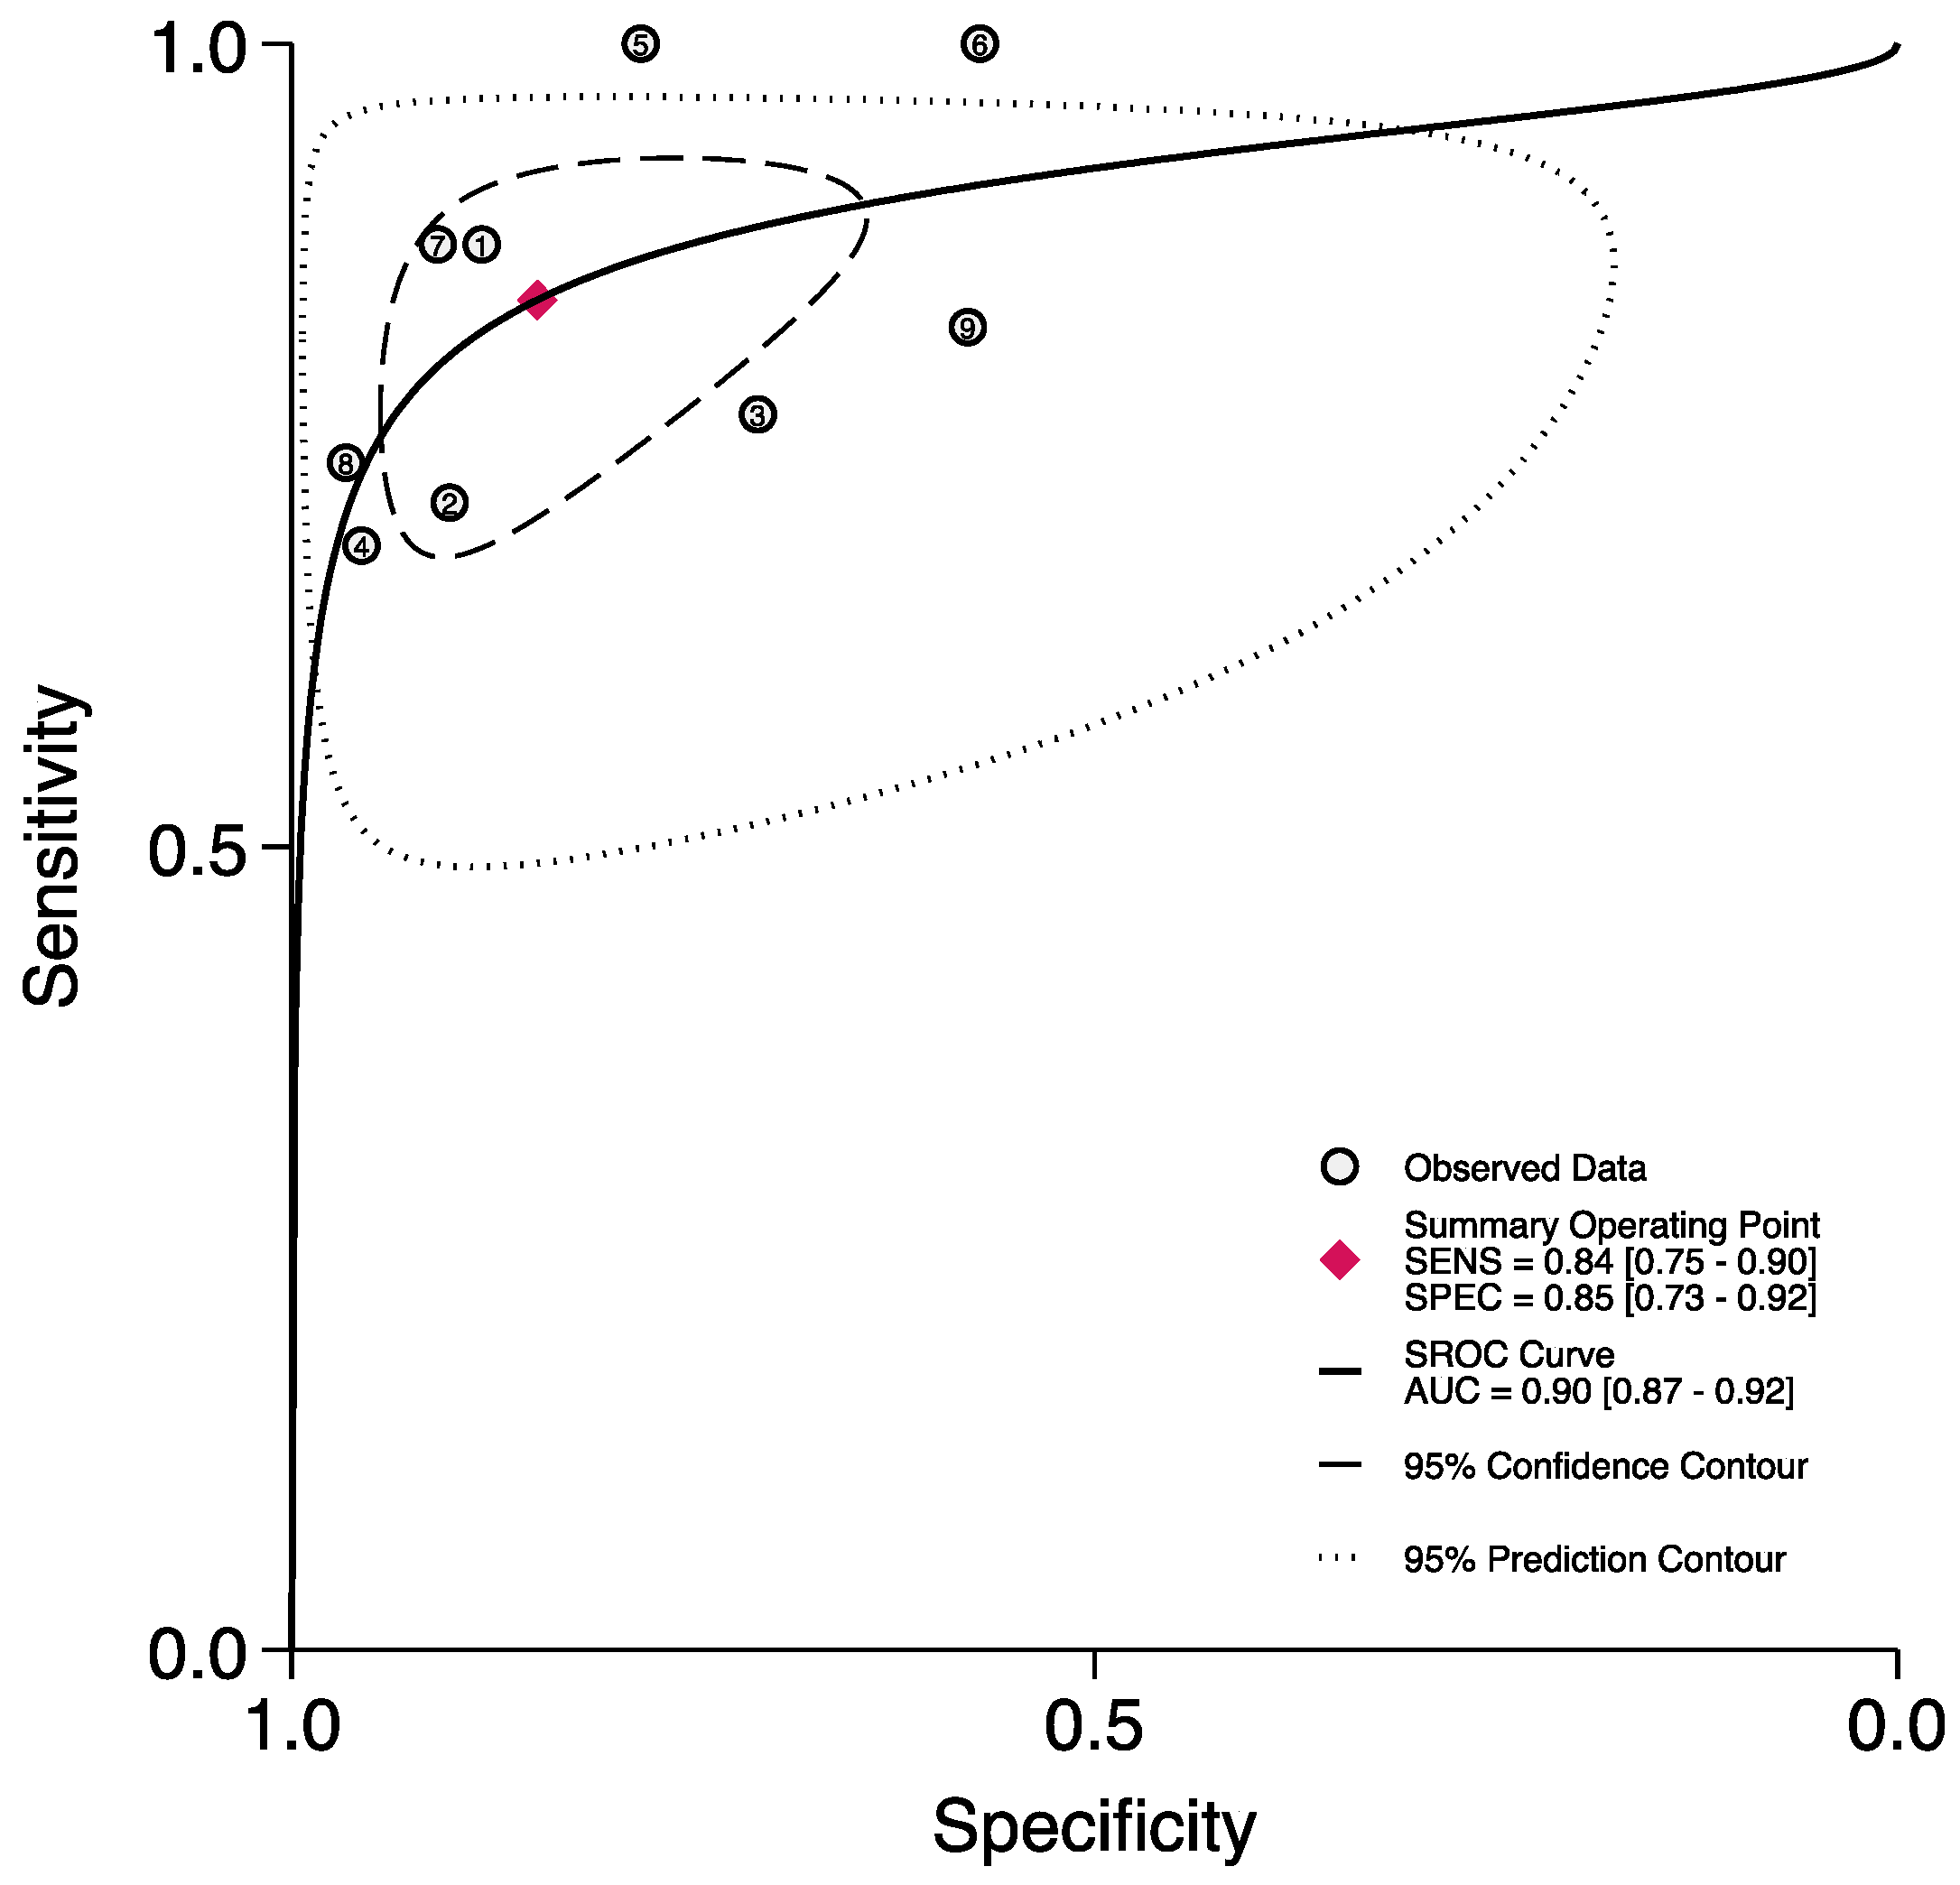
A total of nine studies [7,11,13,20,32,39,40,41,46] reported the accuracy rates of the FGSI in predicting mortality. Here, the pooled sensitivity, specificity, and AUC values were 0.84 (95% CI (0.75–0.90)), 0.85 (95% CI (0.73–0.92)), and 0.90 (95% CI (0.87–0.92)), respectively (Figure 3 and Figure 4).
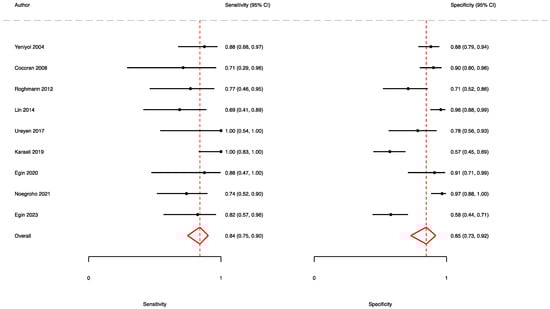
Figure 3.
Forest plot showing the sensitivity and specificity of the FGSI in predicting mortality.

Figure 4.
ROC curve and AUC of the FGSI in predicting mortality.
3.3. The Prognostic Value of SFGSI
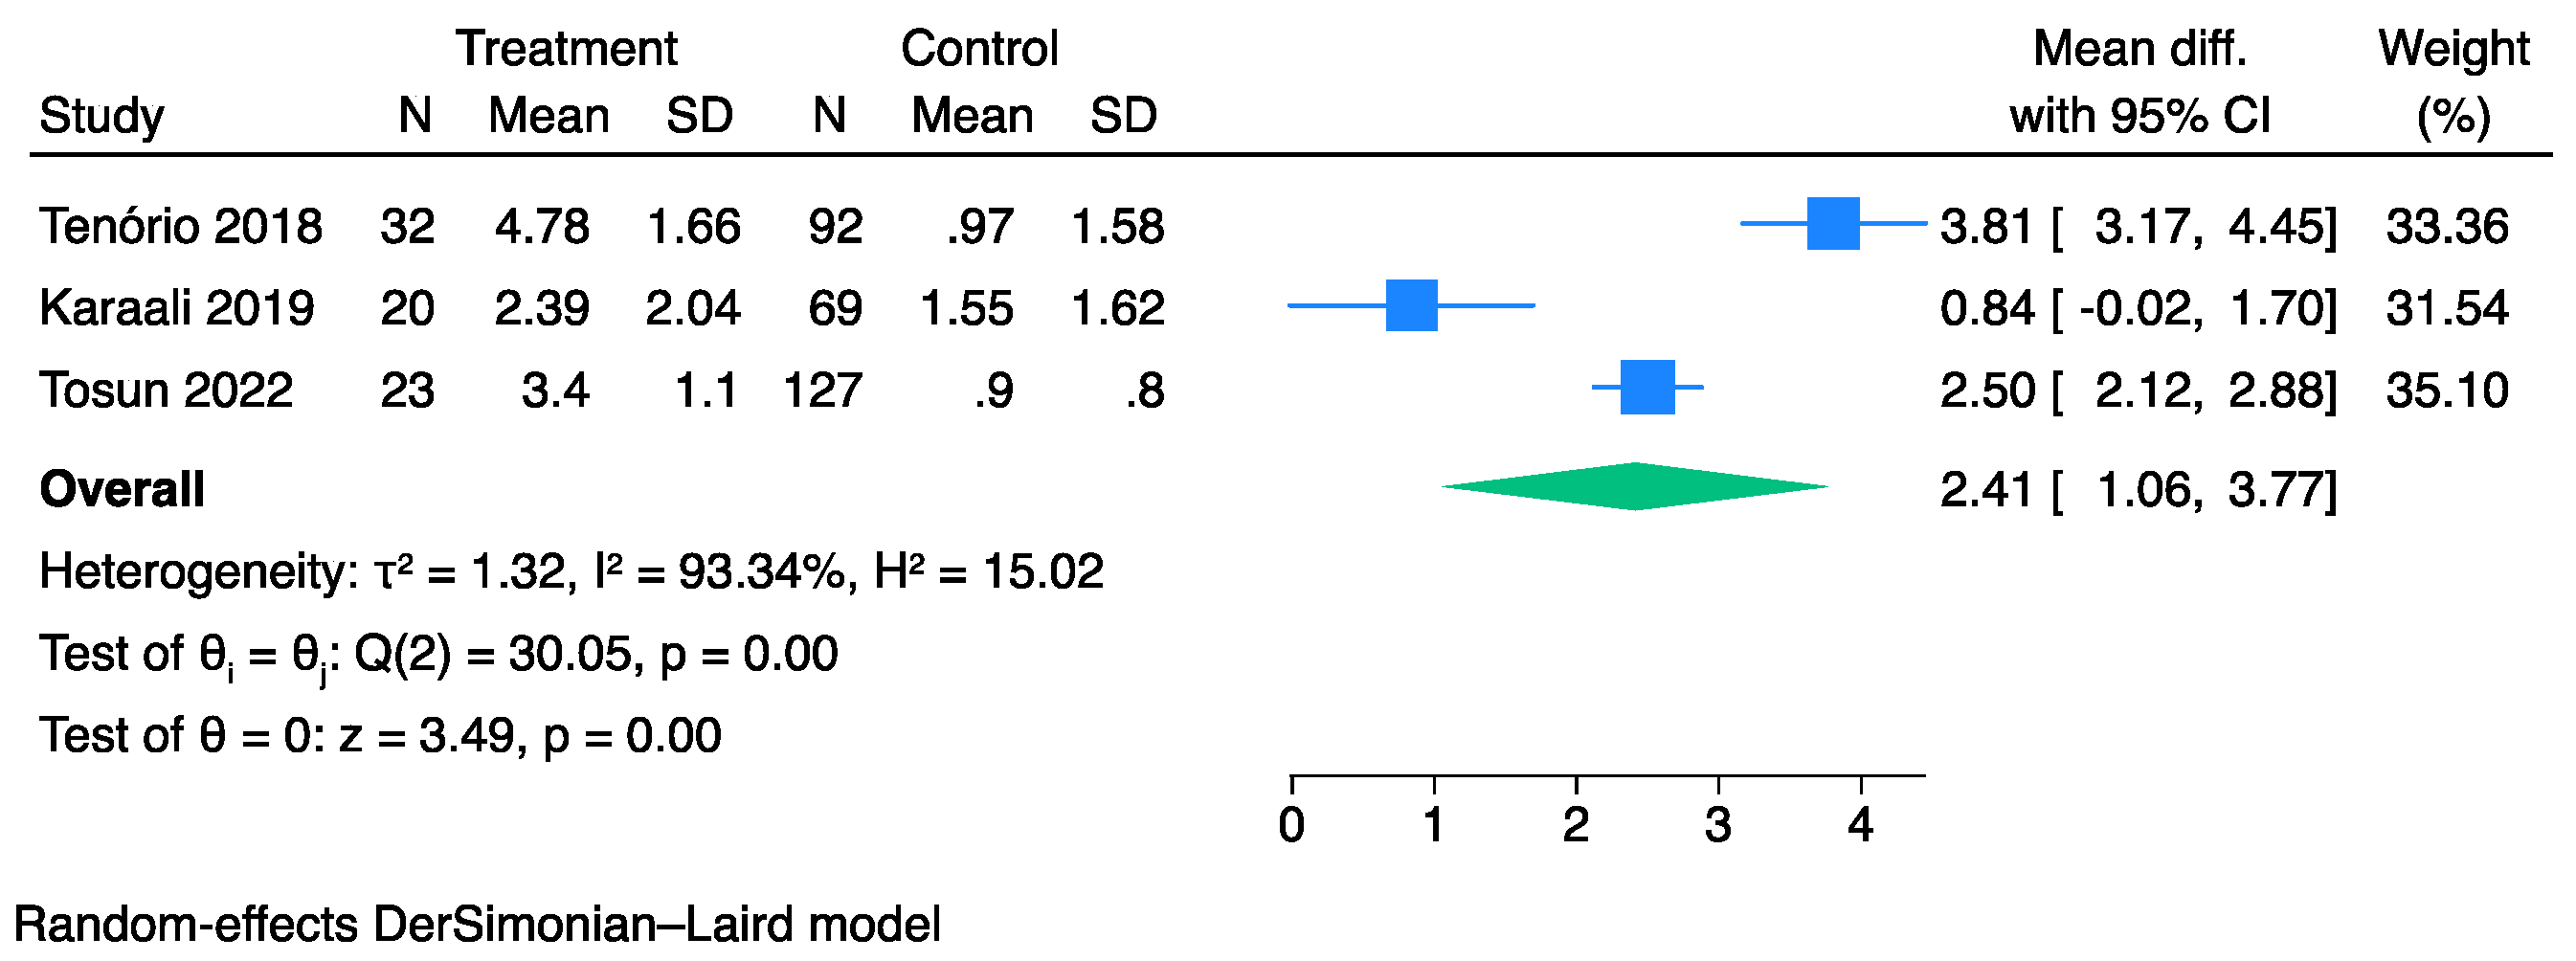
Overall, three studies [35,39,44] comprising 363 patients with FG and evaluable SFGSI data at admission were compared between survivors and non-survivors. The pooled analysis showed that the non-survivor cohorts exhibited higher SFGSI values than the survivors (MD: 2.41, 95% CI: 1.06–3.77) (Figure 5). However, significant heterogeneity was observed across the studies (I2: 93%,).
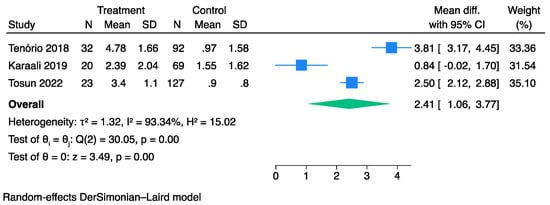
Figure 5.
Forest plot for studies using the Der Simonian-Laird random-effect models showing elevated SFGSI scores on admission in non-survivors vs. survivors.
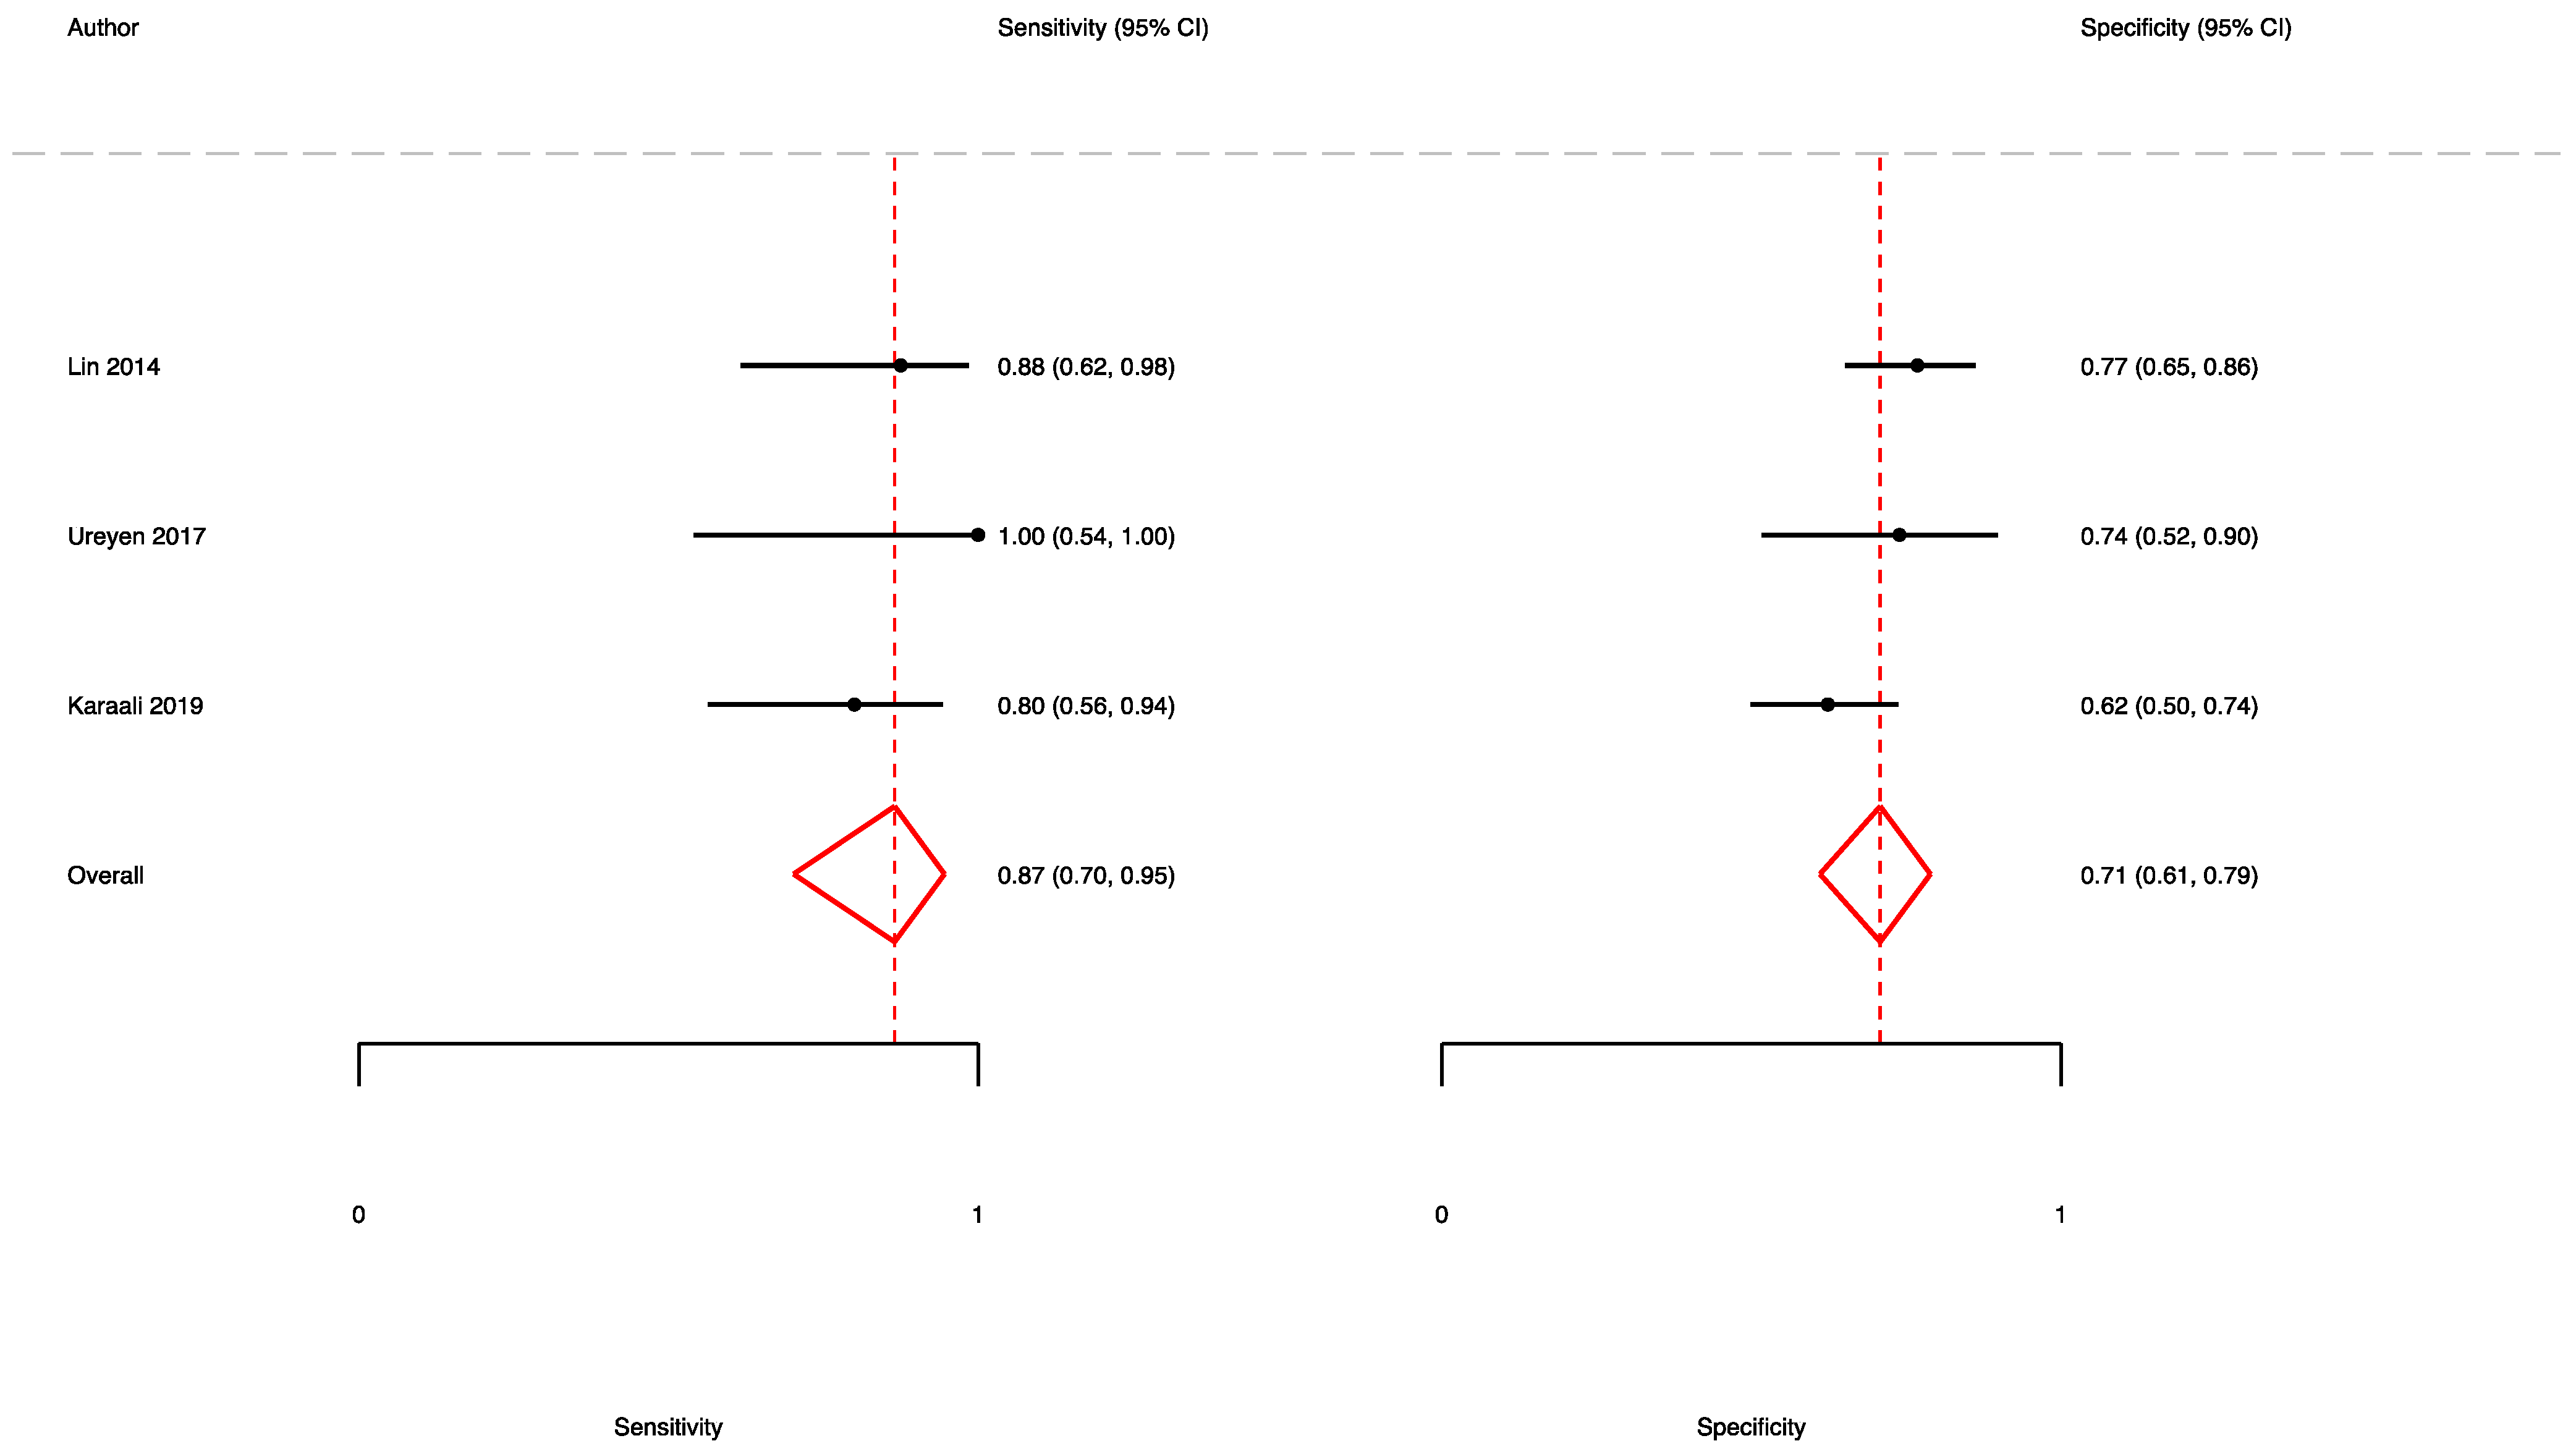
A total of three studies [7,32,39] reported the accuracy rates of the SFGSI in predicting mortality. Here, the pooled sensitivity, specificity, and AUC values were 0.87 (95% CI (0.70–0.95)), 0.71 (95% CI (0.61–0.79)), and 0.84 (95% CI (0.80–0.87)), respectively (Figure 6 and Figure 7).
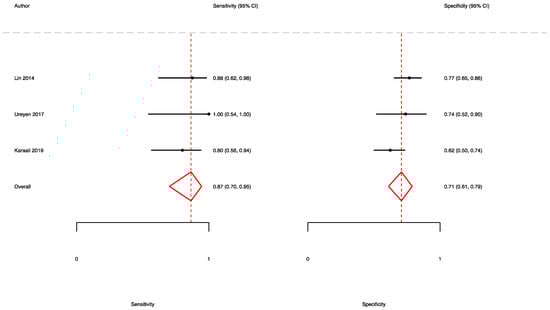
Figure 6.
Forest plot showing the sensitivity and specificity of the SFGSI in predicting mortality.
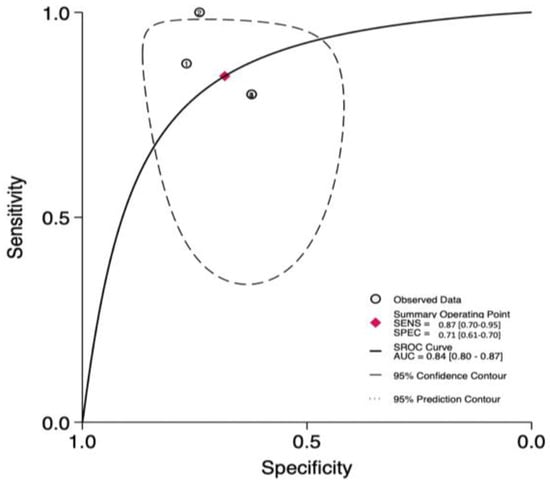
Figure 7.
ROC curve and AUC of the SFGSI in predicting mortality.
3.4. The Prognostic Value of UFGSI
Overall, seven studies [20,26,27,32,39,42,43] comprising 515 patients with FG and evaluable UFGSI data at admission were compared between survivors and non-survivors. The pooled analysis showed that the non-survivor cohorts exhibited higher UFGSI values than the survivors (MD: 5.47, 95% CI: 3.68–7.26) (Figure 8). However, significant heterogeneity was observed across the studies (I2: 84%).
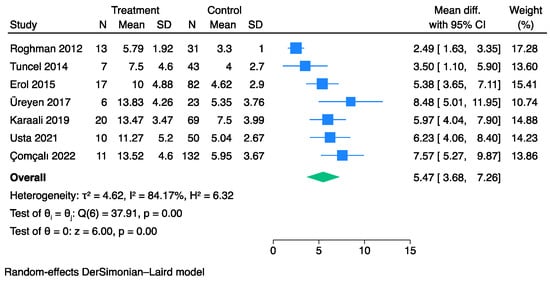
Figure 8.
Forest plot for studies using the Der Simonian–Laird random-effect models showing elevated UFGSI scores on admission in non-survivors vs. survivors.
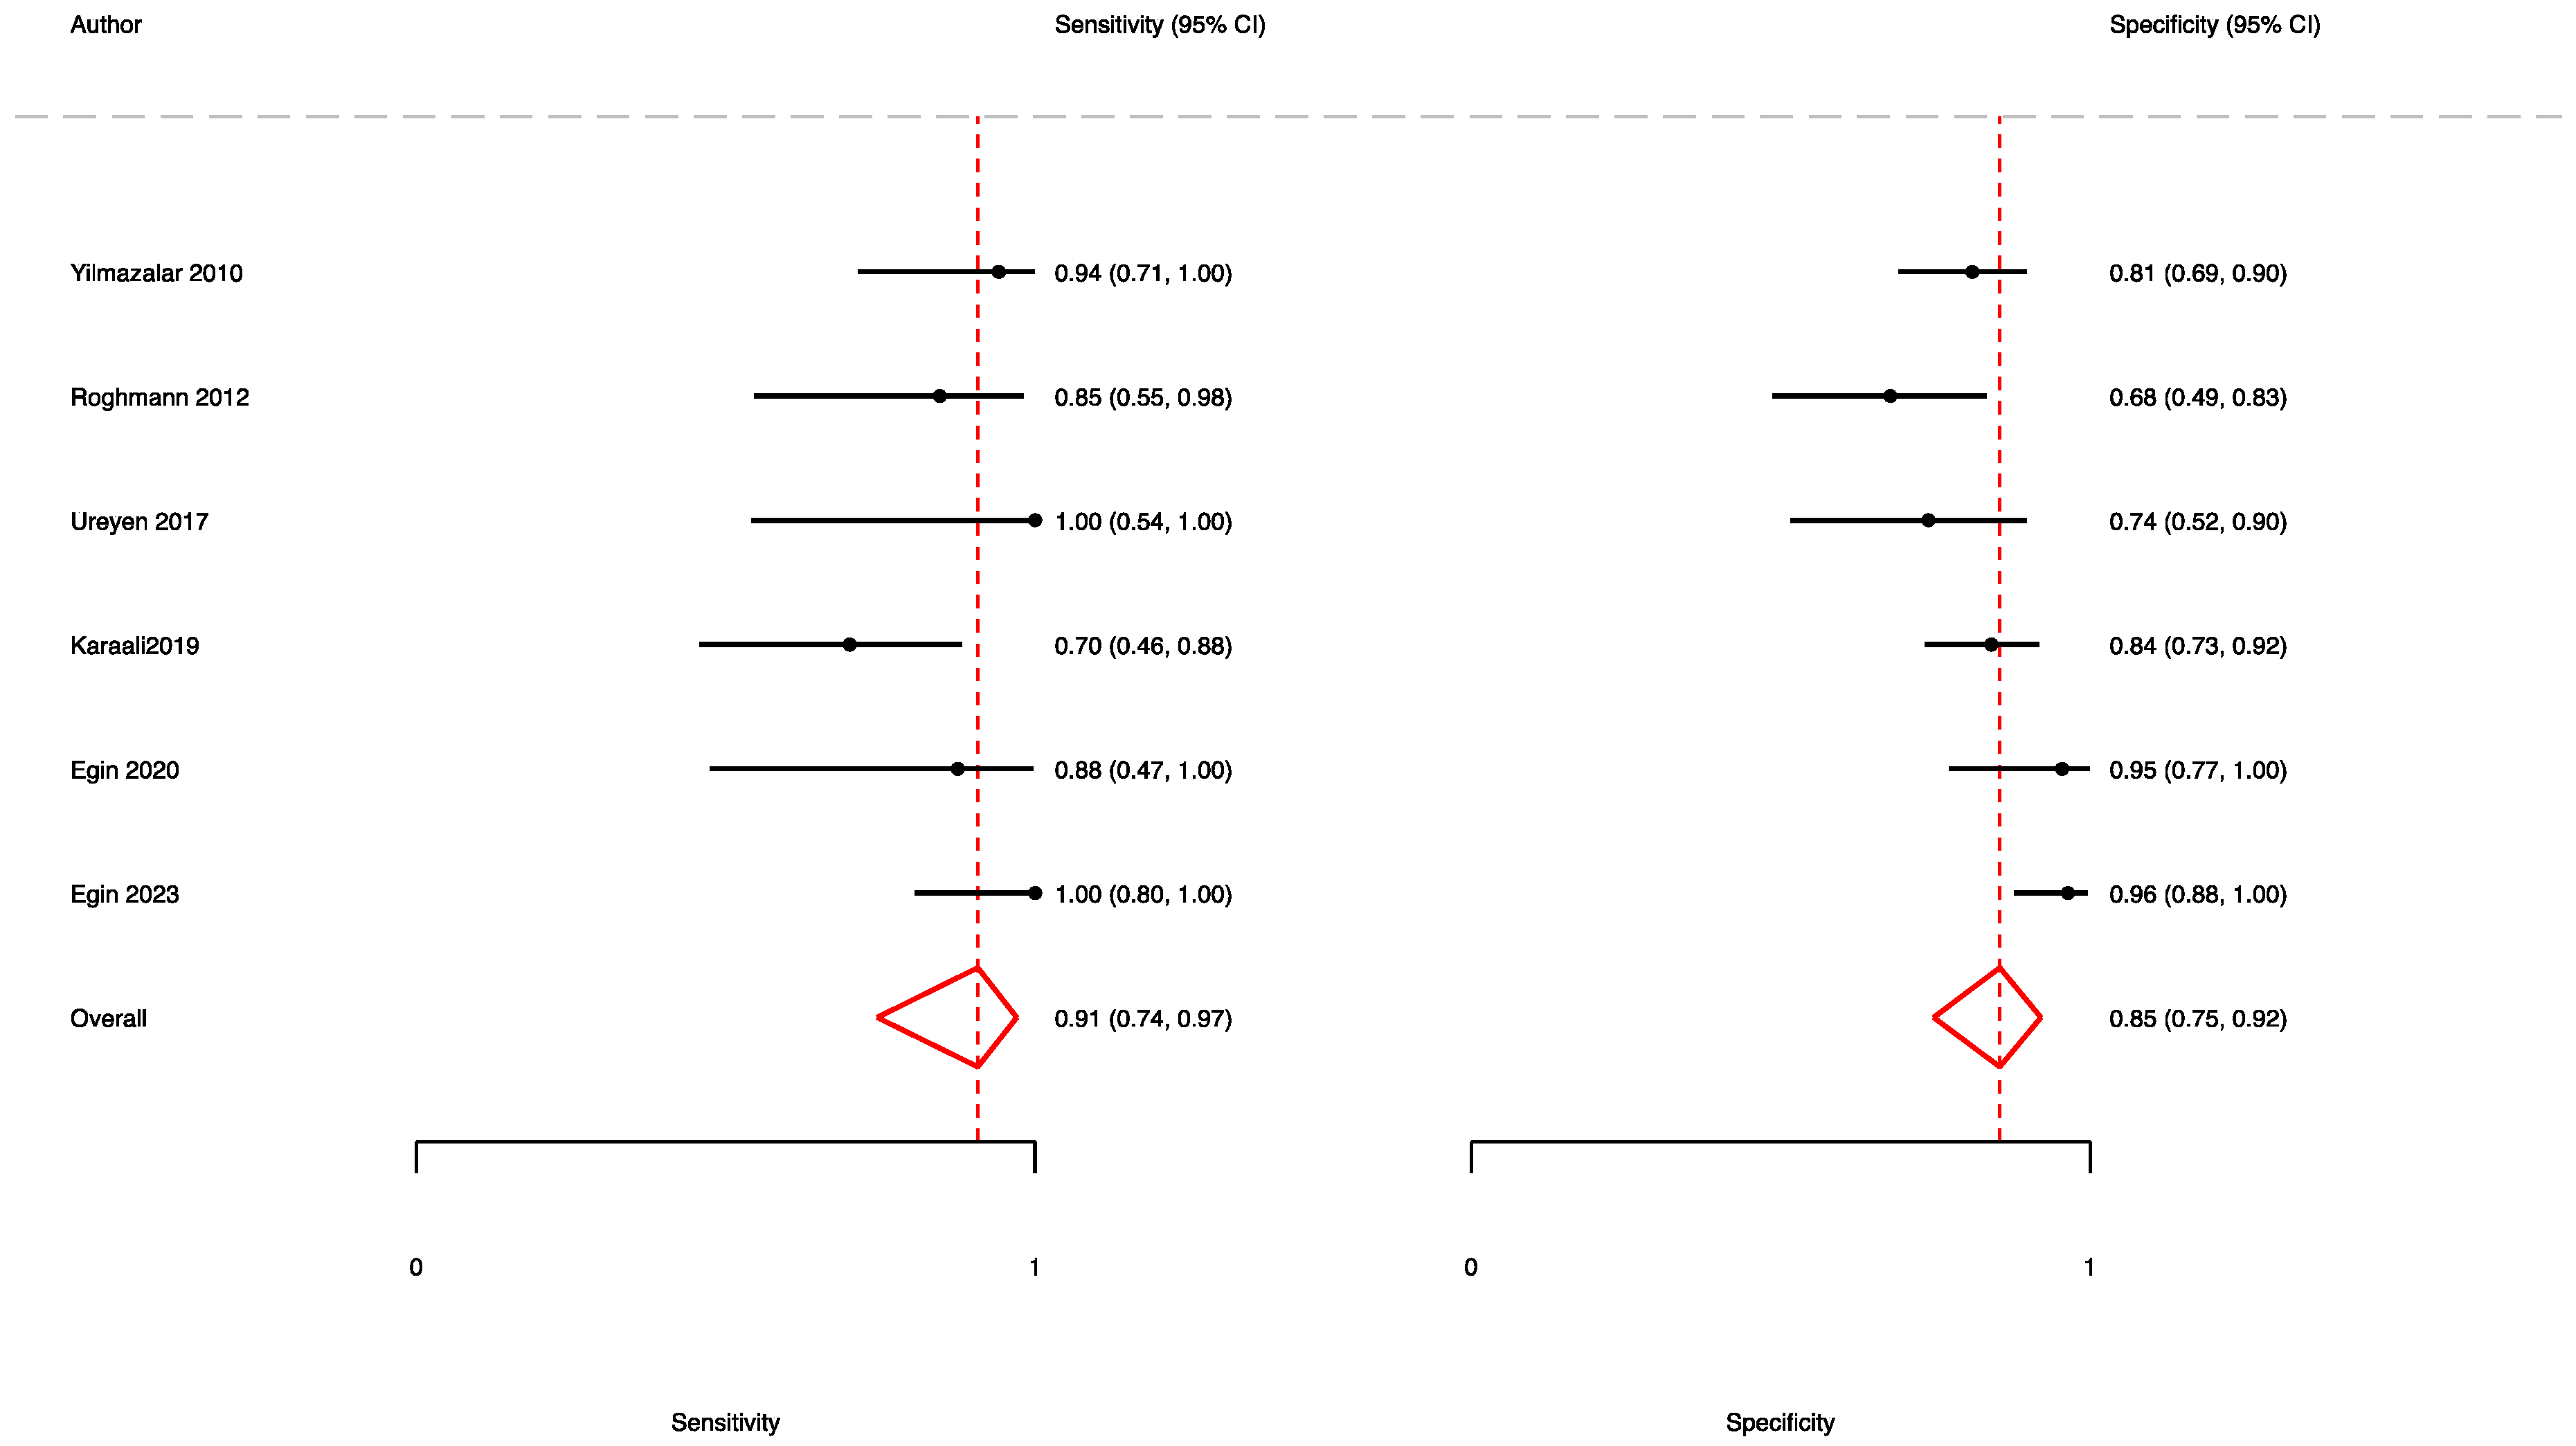
A total of six studies [11,20,32,39,40,46] reported the accuracy rates of the FGSI in predicting mortality. Here, the pooled sensitivity, specificity, and AUC values were 0.91 (95% CI (0.74–0.97)), 0.85 (95% CI (0.75–0.92)), and 0.94 (95% CI (0.92–0.96)), respectively (Figure 9 and Figure 10).
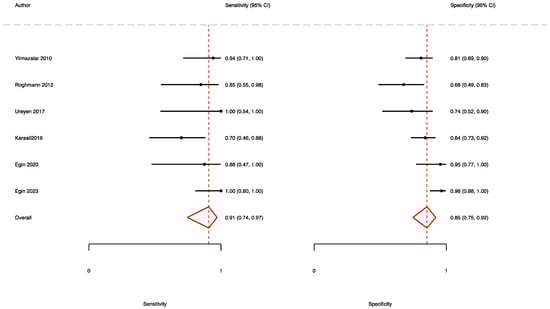
Figure 9.
Forest plot showing the sensitivity and specificity of the UFGSI in predicting mortality.
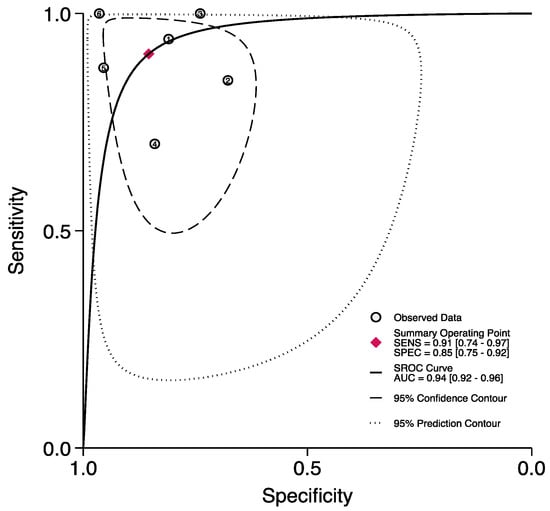
Figure 10.
ROC curve and AUC of the UFGSI in predicting mortality.
4. Discussion
FG is usually a polymicrobial infection caused by aerobic Gram-negative bacilli or Gram-positive cocci. The most frequently identified bacterial species, upon culture, are Enterobacteriaceae, such as E. Coli, followed by streptococcal species [49]. Other organisms that are frequently isolated include Staphylococci, P. aeruginosa, Peptostreptococci, Bacteroides spp., and Clostridia [49].
Several comorbidities, such as diabetes, heart disease, renal failure, and kidney disease, may represent significant factors of increased mortality rates in individuals with FG [50]. Nevertheless, abnormal laboratory parameters at admission are recognized as important predictors of survival outcomes [5,6,7]. More specifically, increased leukocyte counts and levels of creatinine, creatine kinase, urea, lactate dehydrogenase, alkaline phosphatase, and decreased levels of hematocrit, bicarbonate, sodium, potassium, calcium, total protein, and albumin, are most often predictive of a worse prognosis [5,6,7,50]. Relying on these parameters, the FGSI, SFGSI, and UFGSI are commonly used scoring systems in evaluating the severity of FG patients at the time of admission.
The results of this meta-analysis suggest that patients affected by FG present higher scores of the FGSI, SFGSI, and UFGSI at admission. Our analyses led to several noteworthy findings. First, the FSGI values were higher in non-survivors than in survivors (MD: 5.53, 95% CI: 4.68–6.37). Hence, these laboratory abnormalities likely indicate sepsis associated with acute kidney injury and could represent the initial phase of multi-organ failure. Moreover, we also focused on studies estimating the accuracy of the mortality prediction of the FGSI [7,11,13,20,32,39,40,41,46]. Here, the sensitivity of the FGSI ranged from 69% to 100%, and the specificity ranged from 57% to 97% [7,32,39,41], depicting a pooled AUC value of 0.90 (95% CI: 0.87–0.92). Although no consensus has yet been established in determining an optimal cut-off value for the FGSI, a threshold of nine was most commonly retrieved among the included articles. However, we are aware that heterogeneity of the cut-off value used may lead to inevitable potential bias.
Second, the UFGSI was developed by Yilmazlar et al. in 2010 by incorporating the age and the extent of disease to the FGSI parameters [6]. In our meta-analysis, Çomçalı et al. represented the largest cohort (n = 144) evaluating the UFGSI as a predictor of mortality in FG patients, showing an AUC value of 0.89 [43]. Notably, the authors also proposed a novel score, named the Fournier’s gangrene mortality estimation model (FGMPM) score, which incorporates some parameters from the FGSI, UFGSI, and age-adjusted Charlson comorbidity index (ACCI) scores, with variables such as the depth of necrosis, the need for intensive care, the requirement for inotropes, and the neutrophil–lymphocyte ratio. Interestingly, the FGMPM depicted the highest AUC value among all of the evaluated scores (0.985; 95% CI: 0.998–1.000) [43]. However, despite the strength of the FGMPM, future studies are needed to externally validate this index as a reliable predictive scoring system. Nevertheless, the authors found that the UFGSI outperformed the FGSI, as evidenced by a statistically significative difference between the two ROC curves (0.105) (p = 0.002) [6]. This is in agreement with the results of our meta-analysis, where the pooled AUC in predicting mortality of the UFGSI was higher when compared to the FGSI and SFSGI (0.94 vs. 0.90 vs. 0.84).
The SFGSI was developed by Lin et al., relying on the theory that most of the current studies indicated a consistent trend of elevated serum creatinine levels or the presence of renal failure as cornerstones of a poorer prognosis in patients with FG [7]. The authors found a noteworthy relationship between patient mortality and levels of serum creatinine, potassium, and hematocrit. Notably, these three parameters are frequently observed to be abnormal in patients with renal failure, suggesting that renal function might play a crucial role in influencing the overall outcome of individuals with FG [51,52,53]. This association was further reinforced by a large population-based cohort study (n = 1641), where renal failure emerged as a significant predictor of mortality, with an odds ratio of 5.3 [54]. Tenorio et al. confirmed these variables to be independent risk factors of mortality with a univariate analysis [35]. Additionally, when tested with a multivariate analysis, a significant increase in odds ratio was depicted (O.R.:50.2; 95% CI: 13.18–191.47), and patients with an SFGSI score greater than two experienced a mortality rate of 70%, whereas patients with an SFGSI score lower than two had a significantly lower mortality rate of 4.8% (p < 0.0001) [35]. Based on our results, we found a higher SFGSI MD between non-survivors and survivors (MD: 2.41, 95% CI: 1.06–3.77), with a pooled AUC value of 0.84 (95% CI 0.80–0.87), in predicting mortality. Finally, the SFGSI appears to be a promising alternative for assessing the mortality predictors in Fournier’s gangrene. Its main advantage lies in its straightforward applicability, as it involves only three parameters. Furthermore, it can be readily employed right after the patient’s admission, allowing for early risk assessment and timely intervention.
Taken together, the FGSI, UFGSI and SFGSI are extremely useful tools for clinicians in evaluating patients with FG in daily clinical practice. However, the time-consuming nature of the FGSI and UFGSI scoring systems has led to the development of new and more practical scoring systems, such as NLR, PLR, and RDW [55]. However, these systemic inflammatory response markers have not been thoroughly evaluated, and the absence of well-established cut-off values, as well as the low number of studies, did not allow us to quantitatively pool these systemic inflammatory response markers.
The major strength of the current study is the high number of studies included (n = 40), enrolling a total of 2257 patients. To the best of our knowledge, this is the first meta-analysis investigating the prognostic values of the FGSI, SFGSI, and UFGSI in FG patients.
We are aware of the limitations of this meta-analysis. First, although the association between the FGSI/UFGSI and mortality risk in FG was clear, we failed to find a uniformed cut-off value. Second, the mortality rates varied among the studies, which may be attributed to the variations in the baseline characteristics of the enrolled patients in each study, resulting in heterogeneity in our reported outcomes. Pre-existent comorbidities, the duration of symptoms, surgical delay, and poor renal function may represent important confounders. Third, the included studies were more frequently retrospective; therefore, selection bias, recall bias, and other biases should be considered, which may also cause heterogeneity in the pooled outcomes. Finally, the large ethnic diversity and small sample size of some studies may have caused sampling error [56]. Further studies with larger populations and a sufficient patient number are required to validate our study results.
5. Conclusions
In our meta-analysis, higher scores of the FGSI, SFGSI, and UFGSI on admission were associated with mortality. Moreover, when comparing the AUC values, the UFGSI exhibited the highest accuracy, followed by the FGSI. Future studies are needed to externally validate the new scoring systems.
Supplementary Materials
The following supporting information can be downloaded at: https://www.mdpi.com/article/10.3390/jpm13091283/s1, Figure S1: Publication bias analysis using the Funnel Plot including studies reporting FGSI.; Figure S2: Publication bias analysis using the Funnel Plot including studies reporting SFGSI.; Figure S3: Publication bias analysis using the Funnel Plot including studies reporting UFGSI.; Figure S4: Galbraith Plot including studies reporting FGSI.; Figure S5: Galbraith Plot including studies reporting SFGSI.; Figure S6: Galbraith Plot including studies reporting UFGSI.; Table S1: National Institutes of Health (NIH) quality assessment tool for the included studies.
Author Contributions
Conceptualization, A.T. and P.D.; methodology, A.T. and L.A.; software, F.P. (Francesco Passaro) and A.T.; validation, R.S.F., U.A. and C.L.; formal analysis, A.T.; investigation, R.R.; resources, G.B.D.P. and F.P. (Flavia Proietti); data curation, P.D.; writing—original draft preparation, A.T.; writing—review and editing, A.T. and F.P. (Francesco Prata); visualization, C.L.; supervision, S.P. and G.F.; project administration, C.L. All authors have read and agreed to the published version of the manuscript.
Funding
This research received no external funding.
Institutional Review Board Statement
Not applicable.
Informed Consent Statement
Not applicable.
Data Availability Statement
Data presented are contained within the article; for additional information, datasets are also available upon request from the corresponding author.
Conflicts of Interest
The authors declare no conflict of interest.
References
- Sorensen, M.D.; Krieger, J.N.; Rivara, F.P.; Broghammer, J.A.; Klein, M.B.; Mack, C.D.; Wessells, H. Fournier’s Gangrene: Population based epidemiology and outcomes. J. Urol. 2009, 181, 2120–2126. [Google Scholar] [CrossRef] [PubMed]
- Ecker, K.W.; Baars, A.; Töpfer, J.; Frank, J. Necrotizing Fasciitis of the Perineum and the Abdominal Wall-Surgical Approach. Eur. J. Trauma Emerg. Surg. 2008, 34, 219–228. [Google Scholar] [CrossRef] [PubMed]
- Korkut, M.; Içöz, G.; Dayangaç, M.; Akgün, E.; Yeniay, L.; Erdoğan, O.; Cal, C. Outcome analysis in patients with Fournier’s gangrene: Report of 45 cases. Dis. Colon. Rectum. 2003, 46, 649–652. [Google Scholar] [CrossRef] [PubMed]
- Raizandha, M.A.; Hidayatullah, F.; Kloping, Y.P.; Rahman, I.A.; Djatisoesanto, W.; Rizaldi, F. The role of hyperbaric oxygen therapy in Fournier’s Gangrene: A systematic review and meta-analysis of observational studies. Int. Braz. J. Urol. 2022, 48, 771–781. [Google Scholar] [CrossRef] [PubMed]
- Laor, E.; Palmer, L.S.; Tolia, B.M.; Reid, R.E.; Winter, H.I. Outcome prediction in patients with Fournier’s gangrene. J. Urol. 1995, 154, 89–92. [Google Scholar] [CrossRef]
- Yilmazlar, T.; Ozturk, E.; Ozguc, H.; Ercan, I.; Vuruskan, H.; Oktay, B. Fournier’s gangrene: An analysis of 80 patients and a novel scoring system. Tech. Coloproctol. 2010, 14, 217–223. [Google Scholar] [CrossRef] [PubMed]
- Lin, T.Y.; Ou, C.H.; Tzai, T.S.; Tong, Y.C.; Chang, C.C.; Cheng, H.L.; Yang, W.H.; Lin, Y.M. Validation and simplification of Fournier’s gangrene severity index. Int. J. Urol. 2014, 21, 696–701. [Google Scholar] [CrossRef] [PubMed]
- Moher, D.; Liberati, A.; Tetzlaff, J.; Altman, D.G.; PRISMA Group. Preferred reporting items for systematic reviews and meta-analyses: The PRISMA statement. PLoS Med. 2009, 6, e1000097. [Google Scholar] [CrossRef]
- Health NIo. Quality Assessment Tool for Observational Cohort and Cross-Sectional Studies. National Heart, Lung, and Blood Institute; 2014. Available online: https://www.nhlbi.nih.gov/health-topics/study-quality-assessment-tools (accessed on 1 June 2023).
- Hozo, S.P.; Djulbegovic, B.; Hozo, I. Estimating the mean and variance from the median, range, and the size of a sample. BMC Med. Res. Methodol. 2005, 5, 13. [Google Scholar] [CrossRef]
- Yeniyol, C.O.; Suelozgen, T.; Arslan, M.; Ayder, A.R. Fournier’s gangrene: Experience with 25 patients and use of Fournier’s gangrene severity index score. Urology 2004, 64, 218–222. [Google Scholar] [CrossRef]
- Tuncel, A.; Aydin, O.; Tekdogan, U.; Nalcacioglu, V.; Capar, Y.; Atan, A. Fournier’s gangrene: Three years of experience with 20 patients and validity of the Fournier’s Gangrene Severity Index Score. Eur. Urol. 2006, 50, 838–843. [Google Scholar] [CrossRef]
- Corcoran, A.T.; Smaldone, M.C.; Gibbons, E.P.; Walsh, T.J.; Davies, B.J. Validation of the Fournier’s gangrene severity index in a large contemporary series. J. Urol. 2008, 180, 944–948. [Google Scholar] [CrossRef] [PubMed]
- Kabay, S.; Yucel, M.; Yaylak, F.; Algin, M.C.; Hacioglu, A.; Kabay, B.; Muslumanoglu, A.Y. The clinical features of Fournier’s gangrene and the predictivity of the Fournier’s Gangrene Severity Index on the outcomes. Int. Urol. Nephrol. 2008, 40, 997–1004. [Google Scholar] [CrossRef]
- Unalp, H.R.; Kamer, E.; Derici, H.; Atahan, K.; Balci, U.; Demirdoven, C.; Nazli, O.; Onal, M.A. Fournier’s gangrene: Evaluation of 68 patients and analysis of prognostic variables. J. Postgrad. Med. 2008, 54, 102–105. [Google Scholar] [CrossRef] [PubMed]
- Luján Marco, S.; Budía, A.; Di Capua, C.; Broseta, E.; Jiménez Cruz, F. Evaluation of a severity score to predict the prognosis of Fournier’s gangrene. BJU Int. 2010, 106, 373–376. [Google Scholar] [CrossRef]
- Uluğ, M.; Gedik, E.; Girgin, S.; Celen, M.K.; Ayaz, C. The evaluation of microbiology and Fournier’s gangrene severity index in 27 patients. Int. J. Infect. Dis. 2009, 13, e424–e430. [Google Scholar] [CrossRef] [PubMed]
- Altarac, S.; Katušin, D.; Crnica, S.; Papeš, D.; Rajković, Z.; Arslani, N. Fournier’s gangrene: Etiology and outcome analysis of 41 patients. Urol. Int. 2012, 88, 289–293. [Google Scholar] [CrossRef]
- Aridogan, I.A.; Izol, V.; Abat, D.; Karsli, O.; Bayazit, Y.; Satar, N. Epidemiological characteristics of Fournier’s gangrene: A report of 71 patients. Urol. Int. 2012, 89, 457–461. [Google Scholar] [CrossRef]
- Roghmann, F.; von Bodman, C.; Löppenberg, B.; Hinkel, A.; Palisaar, J.; Noldus, J. Is there a need for the Fournier’s gangrene severity index? Comparison of scoring systems for outcome prediction in patients with Fournier’s gangrene. BJU Int. 2012, 110, 1359–1365. [Google Scholar] [CrossRef]
- Verma, S.; Sayana, A.; Kala, S.; Rai, S. Evaluation of the Utility of the Fournier’s Gangrene Severity Index in the Management of Fournier’s Gangrene in North India: A Multicentre Retrospective Study. J. Cutan. Aesthet. Surg. 2012, 5, 273–276. [Google Scholar] [CrossRef]
- Wang, L.; Han, X.; Liu, M.; Ma, Y.; Li, B.; Pan, F.; Li, W.; Wang, L.; Yang, X.; Chen, Z.; et al. Experience in management of Fournier’s gangrene: A report of 24 cases. J. Huazhong Univ. Sci. Technol. Med. Sci. 2012, 32, 719–723. [Google Scholar] [CrossRef]
- Sabzi Sarvestani, A.; Zamiri, M.; Sabouri, M. Prognostic Factors for Fournier’s Gangrene; A 10-year Experience in Southeastern Iran. Bull. Emerg. Trauma. 2013, 1, 116–122. [Google Scholar] [PubMed]
- Vyas, H.G.; Kumar, A.; Bhandari, V.; Kumar, N.; Jain, A.; Kumar, R. Prospective evaluation of risk factors for mortality in patients of Fournier’s gangrene: A single center experience. Indian J. Urol. 2013, 29, 161–165. [Google Scholar] [PubMed]
- Oymacı, E.; Coşkun, A.; Yakan, S.; Erkan, N.; Uçar, A.D.; Yıldırım, M. Evaluation of factors affecting mortality in Fournier’s Gangrene: Retrospective clinical study of sixteen cases. Ulus. Cerrahi. Derg. 2014, 30, 85–89. [Google Scholar] [CrossRef]
- Tuncel, A.; Keten, T.; Aslan, Y.; Kayali, M.; Erkan, A.; Koseoglu, E.; Atan, A. Comparison of different scoring systems for outcome prediction in patients with Fournier’s gangrene: Experience with 50 patients. Scand. J. Urol. 2014, 48, 393–399. [Google Scholar] [CrossRef]
- Erol, B.; Tuncel, A.; Tok, A.; Hanci, V.; Sari, U.; Sendogan, F.; Budak, S.; Aydemir, H.; Amasyali, A.S.; Yildirim, A.; et al. Low magnesium levels an important new prognostic parameter can be overlooked in patients with Fournier’s gangrene: A multicentric study. Int. Urol. Nephrol. 2015, 47, 1939–1945. [Google Scholar] [CrossRef] [PubMed]
- Oguz, A.; Gümüş, M.; Turkoglu, A.; Bozdağ, Z.; Ülger, B.V.; Agaçayak, E.; Böyük, A. Fournier’s Gangrene: A Summary of 10 Years of Clinical Experience. Int. Surg. 2015, 100, 934–941. [Google Scholar] [CrossRef]
- Tarchouli, M.; Bounaim, A.; Essarghini, M.; Ratbi, M.B.; Belhamidi, M.S.; Bensal, A.; Zemmouri, A.; Ali, A.A.; Sair, K. Analysis of prognostic factors affecting mortality in Fournier’s gangrene: A study of 72 cases. Can. Urol. Assoc. J. 2015, 9, E800–E804. [Google Scholar] [CrossRef]
- Doluoğlu, Ö.G.; Karagöz, M.A.; Kılınç, M.F.; Karakan, T.; Yücetürk, C.N.; Sarıcı, H.; Özgür, B.C.; Eroğlu, M. Overview of different scoring systems in Fournier’s Gangrene and assessment of prognostic factors. Turk. J. Urol. 2016, 42, 190–196. [Google Scholar] [CrossRef]
- Yim, S.U.; Kim, S.W.; Ahn, J.H.; Cho, Y.H.; Chung, H.; Hwang, E.C.; Yu, H.S.; Oh, K.J.; Kim, S.O.; Jung, S.I.; et al. Neutrophil to Lymphocyte and Platelet to Lymphocyte Ratios Are More Effective than the Fournier’s Gangrene Severity Index for Predicting Poor Prognosis in Fournier’s Gangrene. Surg. Infect. 2016, 17, 217–223. [Google Scholar] [CrossRef]
- Üreyen, O.; Acar, A.; Gökçelli, U.; Atahan, M.K.; İlhan, E. Usefulness of FGSI and UFGSI scoring systems for predicting mortality in patients with Fournier’s gangrene: A multicenter study. Ulus. Travma. Acil. Cerrahi. Derg. 2017, 23, 389–394. [Google Scholar] [PubMed]
- Elsaket, A.E.; Maharajh, S.; Urry, R.J. The presentation, management and outcomes of Fournier’s gangrene at a tertiary urology referral centre in South Africa. S. Afr. Med. J. 2018, 108, 671–676. [Google Scholar] [CrossRef] [PubMed]
- Pehlivanlı, F.; Aydin, O. Factors Affecting Mortality in Fournier Gangrene: A Single Center Experience. Surg. Infect. 2019, 20, 78–82. [Google Scholar] [CrossRef] [PubMed]
- Tenório, C.E.L.; Lima, S.V.C.; Albuquerque, A.V.; Cavalcanti, M.P.; Teles, F. Risk factors for mortality in Fournier’s gangrene in a general hospital: Use of simplified founier gangrene severe index score (SFGSI). Int. Braz. J. Urol. 2018, 44, 95–101. [Google Scholar] [CrossRef] [PubMed]
- Wetterauer, C.; Ebbing, J.; Halla, A.; Kuehl, R.; Erb, S.; Egli, A.; Schaefer, D.J.; Seifert, H.H. A contemporary case series of Fournier’s gangrene at a Swiss tertiary care center-can scoring systems accurately predict mortality and morbidity? World J. Emerg. Surg. 2018, 13, 25. [Google Scholar] [CrossRef] [PubMed]
- Arora, A.; Rege, S.; Surpam, S.; Gothwal, K.; Narwade, A. Predicting Mortality in Fournier Gangrene and Validating the Fournier Gangrene Severity Index: Our Experience with 50 Patients in a Tertiary Care Center in India. Urol. Int. 2019, 102, 311–318. [Google Scholar] [CrossRef]
- Çitgez, S.; Demirdağ, Ç.; Özkaya, M.; Selçuk, S.; Erözenci, A. Fournier’s gangrene: Analysis of risk factors affecting mortality in a tertiary urology referral center. J. Urol. Surg. 2019, 6, 196–200. [Google Scholar] [CrossRef]
- Karaali, C.; Salimoglu, S.; Emiroglu, M.; Budak, G.G.; Calik, B.; Aydin, C. Is it possible to estimate the mortality rate of Fournier Gangrene with new parameters? Kuwait Med. J. 2019, 52, 286–290. [Google Scholar]
- Egin, S.; Kamali, S.; Hot, S.; Gökçek, B.; Yesiltas, M. Comparison of Mortality in Fournier’s Gangrene with the Two Scoring Systems. J. Coll. Physicians Surg. Pak. 2020, 30, 67–72. [Google Scholar] [CrossRef]
- Noegroho, B.S.; Siregar, S.; Mustafa, A.; Rivaldi, M.A. Validation of FGSI Scores in Predicting Fournier Gangrene in Tertiary Hospital. Res. Rep. Urol. 2021, 13, 341–346. [Google Scholar] [CrossRef]
- Usta, M.A.; Ulusahin, M.; Tayar, S.; Cekic, A.B.; Kazaz, I.O.; Guner, A.; Turkyilmaz, S. Scoring Systems for the Prediction of Mortality in Patient with Fournier’s Gangrene: An Analysis of 60 Patients. Indian J. Surg. 2021, 83, 696–702. [Google Scholar] [CrossRef]
- Çomçalı, B.; Ceylan, C.; Altun Özdemir, B.; Ağaçkıran, İ.; Akıncı, F. Comparison of the newly developed Fournier’s gangrene mortality prediction model with existing models. Ulus. Travma Acil Cerrahi Derg. 2022, 28, 490–497. [Google Scholar] [PubMed]
- Tosun, Y.; Akıncı, O.; Küçük, H.F. Risk factors for mortality in Fournier’s gangrene of anorectal origin. Ulus. Travma Acil Cerrahi Derg. 2022, 28, 1128–1133. [Google Scholar] [PubMed]
- Bozkurt, F.T.; Öncel, H.F.; Salar, R. Predictive factors for mortality in intensive care patients with Fournier’s gangrene: Five years’ experience from a single center in Turkey. Eur. Rev. Med. Pharmacol. Sci. 2023, 27, 2326–2331. [Google Scholar] [PubMed]
- Eğin, S.; Kamalı, S.; Hot, S.; Gökçek, B.; Yeşiltaş, M.; Duman, M.G.; Alemdar, A. The importance of the scoring system in Fournier’s gangrene. Ulus. Travma Acil Cerrahi Derg. 2023, 29, 109–115. [Google Scholar] [CrossRef]
- Eray, I.C.; Dalci, K.; Gumus, S.; Yalav, O.; Saritas, A.G.; Boz, A.; Rencuzogullari, A. The role of C-reactive protein ratio in predicting mortality in patients with Fournier gangrene. Ann. Coloproctol. 2023, 39, 223–230. [Google Scholar] [CrossRef] [PubMed]
- Ongaro, L.; Claps, F.; Rizzo, M.; Di Cosmo, G.; Traunero, F.; D’Andrea, E.; Garaffa, G.; Cai, T.; Zucchi, A.; Trombetta, C.; et al. Procalcitonin as prognostic factor in patients with Fournier’s gangrene. Urol. J. 2023, 90, 157–163. [Google Scholar] [CrossRef]
- Khan, A.; Gidda, H.; Murphy, N.; Alshanqeeti, S.; Singh, I.; Wasay, A.; Haseeb, M. An Unusual Bacterial Etiology of Fournier’s Gangrene in an Immunocompetent Patient. Cureus 2022, 14, e26616. [Google Scholar] [CrossRef]
- El-Qushayri, A.E.; Khalaf, K.M.; Dahy, A.; Mahmoud, A.R.; Benmelouka, A.Y.; Ghozy, S.; Mahmoud, M.U.; Bin-Jumah, M.; Alkahtani, S.; Abdel-Daim, M.M. Fournier’s gangrene mortality: A 17-year systematic review and meta-analysis. Int. J. Infect. Dis. 2020, 92, 218–225. [Google Scholar] [CrossRef]
- Flammia, R.S.; Tufano, A.; Proietti, F.; Gerolimetto, C.; DENunzio, C.; Franco, G.; Leonardo, C. Renal surgery for kidney cancer: Is preoperative proteinuria a predictor of functional and survival outcomes after surgery? A systematic review of the literature. Minerva Urol. Nephrol. 2022, 74, 255–264. [Google Scholar] [CrossRef]
- Pirklbauer, M. Hemodialysis treatment in patients with severe electrolyte disorders: Management of hyperkalemia and hyponatremia. Hemodial. Int. 2020, 24, 282–289. [Google Scholar] [CrossRef] [PubMed]
- Hsu, C.Y.; Bates, D.W.; Kuperman, G.J.; Curhan, G.C. Relationship between hematocrit and renal function in men and women. Kidney Int. 2001, 59, 725–731. [Google Scholar] [CrossRef]
- Sorensen, M.D.; Krieger, J.N.; Rivara, F.P.; Klein, M.B.; Wessells, H. Fournier’s gangrene: Management and mortality predictors in a population based study. J. Urol. 2009, 182, 2742–2747. [Google Scholar] [CrossRef] [PubMed]
- Yücel, B.; Ustun, B. Neutrophil to lymphocyte ratio, platelet to lymphocyte ratio, mean platelet volume, red cell distribution width and plateletcrit in preeclampsia. Pregnancy Hypertens. 2017, 7, 29–32. [Google Scholar] [CrossRef] [PubMed]
- Lin, L. Bias caused by sampling error in meta-analysis with small sample sizes. PLoS ONE 2018, 13, e0204056. [Google Scholar] [CrossRef]


Disclaimer/Publisher’s Note: The statements, opinions and data contained in all publications are solely those of the individual author(s) and contributor(s) and not of MDPI and/or the editor(s). MDPI and/or the editor(s) disclaim responsibility for any injury to people or property resulting from any ideas, methods, instructions or products referred to in the content. |
© 2023 by the authors. Licensee MDPI, Basel, Switzerland. This article is an open access article distributed under the terms and conditions of the Creative Commons Attribution (CC BY) license (https://creativecommons.org/licenses/by/4.0/).