

Are Semiquantitative Methods Superior to Deauville Scoring in the Monitoring Therapy Response for Pediatric Hodgkin Lymphoma?


 ,
,  and
and
Abstract
1. Introduction
2. Materials and Methods
2.1. Patient Enrolment and 18F-FDG PET-CT Image Acquisition Protocol
2.2. Visual and Quantitative Assessment of 18F-FDG PET-CT Images
2.3. Statistical Analysis
3. Results
3.1. Baseline SUVmax in Predicting a Positive Response
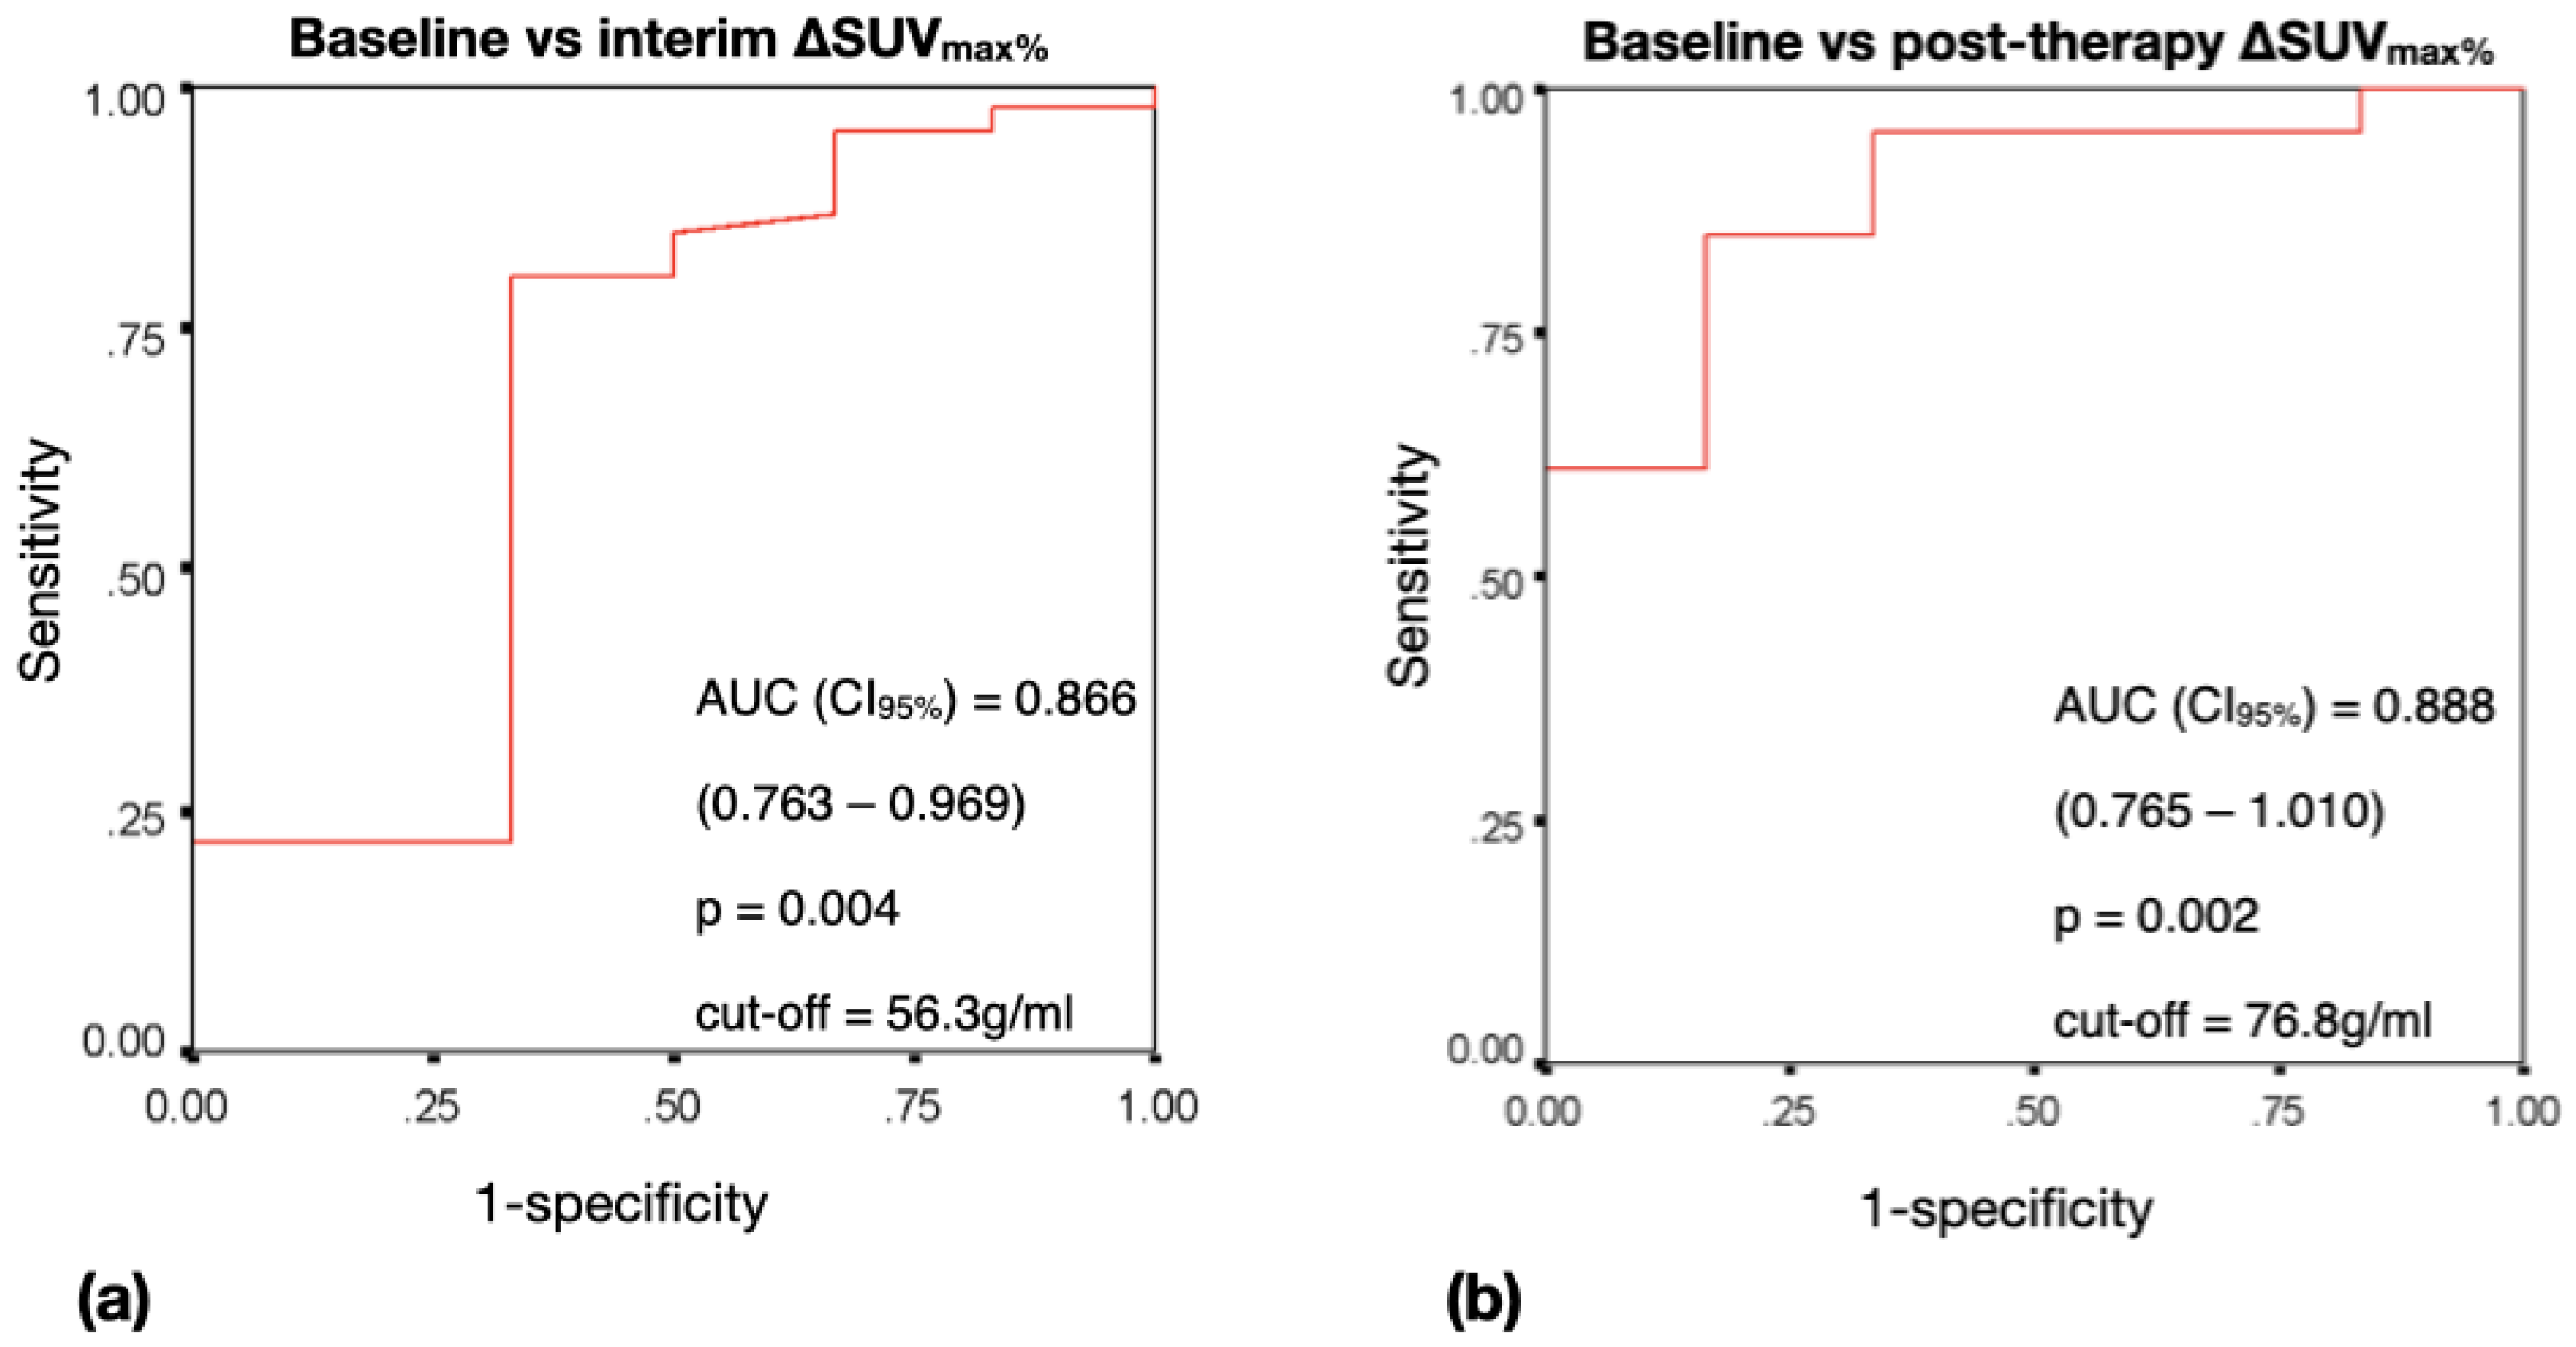
3.2. Performance of ΔSUVmax% in Predicting a Therapy Response at 24 Months
3.3. Diagnostic Accuracy of Prognostication by Deauville Criteria (Visual Assessment) at Different Intervals of Time in the Prediction of a Response at 24 Months
4. Discussion
4.1. Semiquantitative Assessment
4.2. Deauville Scoring
4.3. rPET and DS
4.4. Comparison of DS and SUVmax% Reduction
4.5. Study Limitations
5. Conclusions
Author Contributions
Funding
Institutional Review Board Statement
Informed Consent Statement
Data Availability Statement
Conflicts of Interest
References
- Buhtoiarov, I.N. Paediatric lymphoma. Pediatr. Rev. 2017, 38, 410–423. [Google Scholar] [CrossRef]
- Sherief, L.M.; Elsafy, U.R.; Abdelkhalek, E.R.; Kamal, N.M.; Elbehedy, R.; Hassan, T.H.; Sherbiny, H.S.; Beshir, M.R.; Saleh, S.H. Hodgkin lymphoma in childhood—Clinicopathological features and therapy outcome at 2 centres from a developing country. Medicine 2015, 94, e670. [Google Scholar] [CrossRef]
- Jorgov, L.; Montravers, F.; Balogova, S.; Ragu, C.; Pacquement, H.; Leblanc, T.; Abbou, S.; Ducou-Lepointe, H.; Landman-Parker, J.; Talbot, J.N. Paediatric and adolescent Hodgkin lymphoma: Information derived from diffuse organ uptake of 18F-fluorodeoxyglucose pre-treatment and on interim PET/CT. EJNMMI Res. 2016, 43, 1220–1230. [Google Scholar] [CrossRef] [PubMed]
- Swerdlow, A.J. Epidemiology of Hodgkin’s disease and non-Hodgkin’s lymphoma. EJNMMI Res. 2003, 30 (Suppl. 1), S3–S12. [Google Scholar] [CrossRef]
- Aleman, B.M.P.; van den Belt-Dusebout, A.W.; Klokman, W.J.; Van’t Veer, M.B.; Bartelink, H.; van Leeuwen, F.E. Long-term cause specific mortality of patients treated for Hodgkin’s disease. J. Clin. Oncol. 2003, 21, 3431–3439. [Google Scholar] [CrossRef] [PubMed]
- Ng, A.K.; Bernardo, M.P.; Weller, E.; Backstrand, K.H.; Silver, B.; Marcus, K.C.; Tarbell, N.J.; Friedberg, J.; Canellos, G.P.; Mauch, P.M. Long-term survival and competing causes of death in patients with early-stage Hodgkin’s disease treated at age 50 or younger. J. Clin. Oncol. 2002, 20, 2101–2108. [Google Scholar] [CrossRef] [PubMed]
- Riad, R.; Omar, W.; Kotb, M.; Hafez, M.; Sidhom, I.; Zamzam, M.; Zaky, I.; Abdel-Dayem, H. Role of PET/CT in malignant pediatric lymphoma. Eur. J. Nucl. Med. Mol. Imaging 2010, 37, 319–329. [Google Scholar] [CrossRef] [PubMed]
- Bhakta, N.; Liu, Q.; Yeo, F.; Baassiri, M.; Ehrhardt, M.J.; Srivastava, D.K.; Metzger, M.L.; Krasin, M.J.; Ness, K.K.; Hudson, M.M.; et al. Cumulative burden of cardiovascular morbidity in paediatric, adolescent, and young adult survivors of Hodgkin’s lymphoma: An analysis from the St Jude Lifetime Cohort Study. Lancet Oncol. 2016, 17, 1325–1334. [Google Scholar] [CrossRef]
- Bhatia, S.; Yasui, Y.; Robison, L.L.; Birch, J.M.; Bogue, M.K.; Diller, L.; DeLaat, C.; Fossati-Bellani, F.; Morgan, E.; Oberlin, O.; et al. High risk of subsequent neoplasms continues with extended follow-up of childhood Hodgkin’s disease: Report from the Late Effects Study Group. J. Clin. Oncol. 2003, 21, 4386–4394. [Google Scholar] [CrossRef]
- Hussien, A.E.; Furth, C.; Schönberger, S.; Hundsdoerfer, P.; Steffen, I.G.; Amthauer, H.; Müller, H.W.; Hautzel, H. FDG-PET response prediction in pediatric Hodgkin’s lymphoma: Impact of metabolically defined tumor volumes and individualized SUV measurements on the positive predictive value. Cancers 2015, 7, 287–304. [Google Scholar] [CrossRef]
- Boellaard, R. Standards for PET image acquisition and quantitative data analysis. J. Nucl. Med. 2009, 50 (Suppl 1.), 11S–20S. [Google Scholar] [CrossRef] [PubMed]
- Fischman, A.J.; Alpert, N.M. FDG-PET in oncology: There’s more to it than looking at pictures. J. Nucl. Med. 1993, 34, 6–11. [Google Scholar]
- Huang, S.C. Anatomy of SUV. Nucl. Med. Biol. 2000, 27, 643–646. [Google Scholar] [CrossRef]
- Gambhir, S.S. Molecular imaging of cancer with positron emission tomography. Nat. Rev. Cancer 2002, 2, 683–693. [Google Scholar] [CrossRef] [PubMed]
- Barrington, S.F.; Mikhaeel, N.G.; Kostakoglu, L.; Meignan, M.; Hutchings, M.; Müeller, S.P.; Schwartz, L.H.; Zucca, E.; Fisher, R.I.; Trotman, J.; et al. Role of imaging in the staging and response assessment of lymphoma: Consensus of the International Conference on Malignant Lymphomas Imaging Working Group. J. Clin. Oncol. 2014, 32, 3048–3058. [Google Scholar] [CrossRef]
- Meignan, M.; Gallamini, A.; Meignan, M.; Gallamini, A.; Haioun, C. Report on the First International Workshop on Interim-PET-Scan in Lymphoma. Leuk. Lymphoma 2009, 50, 1257–1260. [Google Scholar] [CrossRef] [PubMed]
- Kaste, S.C.; Howard, S.C.; McCarville, E.B.; Krasin, M.J.; Kogos, P.G.; Hudson, M.M. 18F-FDG-avid sites mimicking active disease in pediatric Hodgkin’s. Pediatr. Radiol. 2005, 35, 141–154. [Google Scholar] [CrossRef] [PubMed]
- Hasenclever, D.; Kurch, L.; Mauz-Körholz, C.; Elsner, A.; Georgi, T.; Wallace, H.; Landman-Parker, J.; Moryl-Bujakowska, A.; Cepelová, M.; Karlén, J.; et al. qPET—A quantitative extension of the Deauville scale to assess response in interim FDG-PET scans in lymphoma. EJNMMI Res. 2014, 41, 1301–1308. [Google Scholar] [CrossRef]
- Annunziata, S.; Cuccaro, A.; Calcagni, M.L.; Hohaus, S.; Giordano, A.; Rufini, V. Interim FDG-PET/CT in Hodgkin lymphoma: The prognostic role of the ratio between target lesion and liver SUVmax (rPET). Ann. Nucl. Med. 2016, 30, 588–592. [Google Scholar] [CrossRef] [PubMed]
- Cheson, B.D.; Fisher, R.I.; Barrington, S.F.; Cavalli, F.; Schwartz, L.H.; Zucca, E.; Lister, T.A.; Alliance, Australasian Leukaemia and Lymphoma Group; Eastern Cooperative Oncology Group; European Mantle Cell Lymphoma Consortium; et al. Recommendations for initial evaluation, staging, and response assessment of Hodgkin and non-Hodgkin lymphoma: The Lugano classification. J. Clin. Oncol. 2014, 32, 3059–3068. [Google Scholar] [CrossRef]
- Malladi, A.; Viner, M.; Jackson, T.; Mercier, G.; Subramaniam, R.M. PET/CT mediastinal and liver FDG uptake: Effects of biological and procedural factors. J. Med. Imaging Radiat. Oncol. 2013, 57, 169–175. [Google Scholar] [CrossRef]
- Barrington, S.F.; Kluge, R. FDG PET for therapy monitoring in Hodgkin and non-Hodgkin lymphomas. EJNMMI Res. 2017, 44 (Suppl. 1), 97–110. [Google Scholar] [CrossRef]
- Biggi, A.; Gallamini, A.; Chauvie, S.; Hutchings, M.; Kostakoglu, L.; Gregianin, M.; Meignan, M.; Malkowski, B.; Hofman, M.S.; Barrington, S.F. International validation study for interim PET in ABVD-treated, advanced-stage Hodgkin lymphoma: Interpretation criteria and concordance rate among reviewers. J. Nucl. Med. 2013, 54, 683–690. [Google Scholar] [CrossRef]
- Asthana, S.; Labani, S.; Mehrana, S.; Bakhshi, S. Incidence of childhood leukemia and lymphoma in India. Pediatr. Hematol. Oncol. J. 2018, 3, 115–120. [Google Scholar] [CrossRef]
- Ferrari, C.; Niccoli Asabella, A.; Merenda, N.; Altini, C.; Fanelli, M.; Muggeo, P.; De Leonardis, F.; Perillo, T.; Santoro, N.; Rubini, G. Pediatric Hodgkin lymphoma: Predictive value of interim 18F-FDG PET/CT in therapy response assessment. Medicine 2017, 96, e5973. [Google Scholar] [CrossRef]
- Aide, N.; Lasnon, C.; Veit-Haibach, P.; Sera, T.; Sattler, B.; Boellaard, R. EANM/EARL harmonization strategies in PET quantification: From daily practice to multicentre oncological studies. EJNMMI Res. 2017, 44 (Suppl. 1), 17–31. [Google Scholar] [CrossRef]
- Furth, C.; Steffen, I.G.; Amthauer, H.; Ruf, J.; Misch, D.; Schönberger, S.; Kobe, C.; Denecke, T.; Stöver, B.; Hautzel, H.; et al. Early and late therapy response assessment with [18F] fluorodeoxyglucose positron emission tomography in pediatric Hodgkin’s lymphoma: Analysis of a prospective multicenter trial. J. Clin. Oncol. 2009, 27, 4385–4391. [Google Scholar] [CrossRef]
- Blautzik, J.; Grelich, L.; Schramm, N.; Henkel, R.; Bartenstein, P.; Pfluger, T. What and how should we measure in paediatric oncology FDG-PET/CT? Comparison of commonly used SUV metrics for differentiation between paediatric tumours. EJNMMI Res. 2019, 9, 115. [Google Scholar] [CrossRef] [PubMed]
- Isik, E.G.; Kuyumcu, S.; Kebudi, R.; Sanli, Y.; Karakas, Z.; Cakir, F.B.; Unal, S.N. Prediction of outcome in pediatric Hodgkin lymphoma based on interpretation of 18FDG-PET/CT according to ΔSUVmax, Deauville 5-point scale and IHP criteria. Ann. Nucl. Med. 2017, 31, 660–668. [Google Scholar] [CrossRef]
- Furth, C.; Steffen, I.G.; Erdrich, A.S.; Hundsdoerfer, P.; Ruf, J.; Henze, G.; Schönberger, S.; Amthauer, H.; Hautzel, H. Explorative analyses on the value of interim PET for prediction of response in pediatric and adolescent non-Hodgkin lymphoma patients. EJNMMI Res. 2013, 3, 71. [Google Scholar] [CrossRef] [PubMed]
- Terasawa, T.; Lau, J.; Bardet, S.; Couturier, O.; Hotta, T.; Hutchings, M.; Nihashi, T.; Nagai, H. Fluorine-18-fluorodeoxyglucose positron emission tomography for interim response assessment of advanced-stage Hodgkin’s lymphoma and diffuse large B-cell lymphoma: A systematic review. J. Clin. Oncol. 2009, 27, 1906–1914. [Google Scholar] [CrossRef]
- Ilivitzki, A.; Radan, L.; Ben-Arush, M.; Israel, O.; Ben-Barak, A. Early interim FDG PET/CT prediction of treatment response and prognosis in pediatric Hodgkin disease-added value of low-dose CT. Pediatr. Radiol. 2013, 43, 86–92. [Google Scholar] [CrossRef] [PubMed]
- Kluge, R.; Kurch, L.; Georgi, T.; Metzger, M. Current role of FDG-PET in pediatric Hodgkin’s lymphoma. Semin. Nucl. Med. 2017, 47, 242–257. [Google Scholar] [CrossRef]
- Meignan, M. Interim PET in lymphoma: A step towards standardization. EJNMMI Res. 2010, 37, 1821–1823. [Google Scholar] [CrossRef] [PubMed]
- Verloh, N.; Einspieler, I.; Utpatel, K.; Menhart, K.; Brunner, S.; Hofheinz, F.; van den Hoff, J.; Wiggermann, P.; Evert, M.; Stroszczynski, C.; et al. In vivo confirmation of altered hepatic glucose metabolism in patients with liver fibrosis/cirrhosis by 18F-FDG PET/CT. EJNMMI Res. 2018, 8, 98. [Google Scholar] [CrossRef] [PubMed]
- Shammas, A.; Lim, R.; Charron, M. Pediatric FDG PET/CT: Physiologic uptake, normal variants, and benign conditions. Radiographics 2009, 29, 1467–1486. [Google Scholar] [CrossRef] [PubMed]
- Elhamady, H.Y.; Mostafa, H.M.; Elsayed, H.F.; Abo-ElAzm, O.M.; Hussein, M.H. Deauville score versus ratio Deauville score in the interpretation of interim 18F-FDG PET-CT and in prediction of outcome in children with FDG-avid extra-nodal lymphomas. Egypt. J. Radiol. Nucl. Med. 2022, 53, 217. [Google Scholar] [CrossRef]


| HL Subtype | Patients (N) | Proportion (%) |
|---|---|---|
| Mixed cellularity | 9 | 17.3 |
| Nodular lymphocyte predominant | 8 | 15.4 |
| Nodular sclerosing | 35 | 67.3 |
| HL Stage | Patients (N) | Proportion (%) |
|---|---|---|
| 1A | 10 | 19.2 |
| 1B | 3 | 5.8 |
| 2A | 15 | 28.8 |
| 2B | 5 | 9.6 |
| 3A | 11 | 21.2 |
| 3B | 3 | 5.8 |
| 4A | 3 | 5.8 |
| 4B | 2 | 3.8 |
| Score | Description |
|---|---|
| 1 | No uptake |
| 2 | Uptake ≤mediastinum |
| 3 | Uptake >mediastinum but ≤liver |
| 4 | Uptake moderately increased above liver at any site |
| 5 | Markedly increased uptake above the liver at any site |
| NE | Not evaluable |
| X | Any areas of uptake not likely to be related to lymphoma |
| 1 | No uptake |
| ΔSUVmax% | DS | z (p) | |
|---|---|---|---|
| Sensitivity | 82.6 | 80.4 | 0.286 (0.779) |
| Specificity | 83.3 | 100.0 | 3.075 (0.002) |
| False-negative rate | 17.4 | 19.6 | 0.286 (0.779) |
| False-positive rate | 16.7 | 0.0 | 3.075 (0.002) |
| PPV | 97.4 | 100.0 | 1.162 (0.246) |
| NPV | 38.5 | 40.0 | 0.161 (0.873) |
| Positive likelihood ratio | 5.0 | - | - (-) |
| Negative likelihood ratio | 0.2 | 0.2 | 0.015 (0.992) |
| Accuracy | 82.7 | 82.7 | 0 (1) |
| ΔSUVmax% | DS | z (p) | |
|---|---|---|---|
| Sensitivity | 84.8 | 97.8 | 2.36 (0.018) |
| Specificity | 66.7 | 83.3 | 1.963 (0.049) |
| False-negative rate | 15.2 | 2.2 | 2.36 (0.018) |
| False-positive rate | 33.3 | 16.7 | 1.963 (0.049) |
| PPV | 97.5 | 95.7 | 0.495 (0.624) |
| NPV | 41.7 | 80.0 | 4.004 (0.001) |
| Positive likelihood ratio | 5.1 | 2.9 | 0.559 (0.582) |
| Negative likelihood ratio | 0.2 | 0.0 | 0.233 (0.818) |
| Accuracy | 84.6 | 94.2 | 1.594 (0.112) |
| rPET | DS | z (p) | |
|---|---|---|---|
| Sensitivity | 76.1 | 80.4 | 0.537 (0.596) |
| Specificity | 100.0 | 100.0 | - |
| False-negative rate | 23.9 | 19.6 | 0.548 (0.589) |
| False-positive rate | 0.0 | 0.0 | - |
| PPV | 100.0 | 100.0 | - |
| NPV | 35.3 | 40.0 | 0.519 (0.610) |
| Positive likelihood ratio | - | - | - |
| Negative likelihood ratio | 0.2 | 0.2 | 0.051 (0.960) |
| Accuracy | 78.8 | 82.7 | 0.535 (0.596) |
Disclaimer/Publisher’s Note: The statements, opinions and data contained in all publications are solely those of the individual author(s) and contributor(s) and not of MDPI and/or the editor(s). MDPI and/or the editor(s) disclaim responsibility for any injury to people or property resulting from any ideas, methods, instructions or products referred to in the content. |
© 2023 by the authors. Licensee MDPI, Basel, Switzerland. This article is an open access article distributed under the terms and conditions of the Creative Commons Attribution (CC BY) license (https://creativecommons.org/licenses/by/4.0/).
Share and Cite
Ibrahim, F.; Gabelloni, M.; Faggioni, L.; Padma, S.; Visakh, A.R.; Cioni, D.; Neri, E. Are Semiquantitative Methods Superior to Deauville Scoring in the Monitoring Therapy Response for Pediatric Hodgkin Lymphoma? J. Pers. Med. 2023, 13, 445. https://doi.org/10.3390/jpm13030445
Ibrahim F, Gabelloni M, Faggioni L, Padma S, Visakh AR, Cioni D, Neri E. Are Semiquantitative Methods Superior to Deauville Scoring in the Monitoring Therapy Response for Pediatric Hodgkin Lymphoma? Journal of Personalized Medicine. 2023; 13(3):445. https://doi.org/10.3390/jpm13030445
Chicago/Turabian StyleIbrahim, Firuz, Michela Gabelloni, Lorenzo Faggioni, Subramanyam Padma, Arun R. Visakh, Dania Cioni, and Emanuele Neri. 2023. "Are Semiquantitative Methods Superior to Deauville Scoring in the Monitoring Therapy Response for Pediatric Hodgkin Lymphoma?" Journal of Personalized Medicine 13, no. 3: 445. https://doi.org/10.3390/jpm13030445
APA StyleIbrahim, F., Gabelloni, M., Faggioni, L., Padma, S., Visakh, A. R., Cioni, D., & Neri, E. (2023). Are Semiquantitative Methods Superior to Deauville Scoring in the Monitoring Therapy Response for Pediatric Hodgkin Lymphoma? Journal of Personalized Medicine, 13(3), 445. https://doi.org/10.3390/jpm13030445