
Direct Comparative Analysis of a Pharmacogenomics Panel with PacBio Hifi® Long-Read and Illumina Short-Read Sequencing

 ,
,
Abstract
:1. Introduction
2. Materials and Methods
2.1. Patient Cohort
2.2. Customized Panel Combined with Illumina® Short-Read Sequencing (SRS)
2.3. Twist Panel Combined with the PacBio SMRT® Long-Read Sequencing (LRS)
3. Results
3.1. Global Genotype and Phenotype Concordances
3.2. CYP2D6 Analysis
3.3. UGT1A1 Analysis
3.4. NAT2 Analysis
4. Discussion
Supplementary Materials
Author Contributions
Funding
Institutional Review Board Statement
Informed Consent Statement
Data Availability Statement
Acknowledgments
Conflicts of Interest
References
- PharmGKB. Available online: https://www.pharmgkb.org/ (accessed on 6 October 2023).
- Homepage. Available online: http://www.knmp.nl/node/265 (accessed on 6 October 2023).
- Relling, M.V.; Klein, T.E. CPIC: Clinical Pharmacogenetics Implementation Consortium of the Pharmacogenomics Research Network. Clin. Pharmacol. Ther. 2011, 89, 464–467. [Google Scholar] [CrossRef] [PubMed]
- Desmeules, J.; Gascon, M.P.; Dayer, P.; Magistris, M. Impact of Environmental and Genetic Factors on Codeine Analgesia. Eur. J. Clin. Pharmacol. 1991, 41, 23–26. [Google Scholar] [CrossRef] [PubMed]
- Gasche, Y.; Daali, Y.; Fathi, M.; Chiappe, A.; Cottini, S.; Dayer, P.; Desmeules, J. Codeine Intoxication Associated with Ultrarapid CYP2D6 Metabolism. N. Engl. J. Med. 2004, 351, 2827–2831. [Google Scholar] [CrossRef] [PubMed]
- Hoskins, J.M.; Carey, L.A.; McLeod, H.L. CYP2D6 and Tamoxifen: DNA Matters in Breast Cancer. Nat. Rev. Cancer 2009, 9, 576–586. [Google Scholar] [CrossRef] [PubMed]
- CYP2D6. Available online: https://www.pharmgkb.org/gene/PA128/prescribingInfo (accessed on 6 October 2023).
- Koiwai, O.; Nishizawa, M.; Hasada, K.; Aono, S.; Adachi, Y.; Mamiya, N.; Sato, H. Gilbert’s Syndrome Is Caused by a Heterozygous Missense Mutation in the Gene for Bilirubin UDP-Glucuronosyltransferase. Hum. Mol. Genet. 1995, 4, 1183–1186. [Google Scholar] [CrossRef] [PubMed]
- Ramchandani, R.P.; Wang, Y.; Booth, B.P.; Ibrahim, A.; Johnson, J.R.; Rahman, A.; Mehta, M.; Innocenti, F.; Ratain, M.J.; Gobburu, J.V.S. The Role of SN-38 Exposure, UGT1A1*28 Polymorphism, and Baseline Bilirubin Level in Predicting Severe Irinotecan Toxicity. J. Clin. Pharmacol. 2007, 47, 78–86. [Google Scholar] [CrossRef] [PubMed]
- Marchini, J.; Cutler, D.; Patterson, N.; Stephens, M.; Eskin, E.; Halperin, E.; Lin, S.; Qin, Z.S.; Munro, H.M.; Abecasis, G.R.; et al. A Comparison of Phasing Algorithms for Trios and Unrelated Individuals. Am. J. Hum. Genet. 2006, 78, 437–450. [Google Scholar] [CrossRef]
- Golka, K.; Blaszkewicz, M.; Samimi, M.; Bolt, H.M.; Selinski, S. Reconstruction of N-Acetyltransferase 2 Haplotypes Using PHASE. Arch. Toxicol. 2008, 82, 265–270. [Google Scholar] [CrossRef]
- Azuma, J.; Ohno, M.; Kubota, R.; Yokota, S.; Nagai, T.; Tsuyuguchi, K.; Okuda, Y.; Takashima, T.; Kamimura, S.; Fujio, Y.; et al. NAT2 Genotype Guided Regimen Reduces Isoniazid-Induced Liver Injury and Early Treatment Failure in the 6-Month Four-Drug Standard Treatment of Tuberculosis: A Randomized Controlled Trial for Pharmacogenetics-Based Therapy. Eur. J. Clin. Pharmacol. 2013, 69, 1091–1101. [Google Scholar] [CrossRef]
- Popitsch, N.; Schuh, A.; Taylor, J.C. ReliableGenome: Annotation of Genomic Regions with High/Low Variant Calling Concordance. Bioinformatics 2017, 33, 155–160. [Google Scholar] [CrossRef]
- Caspar, S.M.; Dubacher, N.; Kopps, A.M.; Meienberg, J.; Henggeler, C.; Matyas, G. Clinical Sequencing: From Raw Data to Diagnosis with Lifetime Value. Clin. Genet. 2018, 93, 508–519. [Google Scholar] [CrossRef] [PubMed]
- Wenger, A.M.; Peluso, P.; Rowell, W.J.; Chang, P.-C.; Hall, R.J.; Concepcion, G.T.; Ebler, J.; Fungtammasan, A.; Kolesnikov, A.; Olson, N.D.; et al. Accurate Circular Consensus Long-Read Sequencing Improves Variant Detection and Assembly of a Human Genome. Nat. Biotechnol. 2019, 37, 1155–1162. [Google Scholar] [CrossRef] [PubMed]
- Eid, J.; Fehr, A.; Gray, J.; Luong, K.; Lyle, J.; Otto, G.; Peluso, P.; Rank, D.; Baybayan, P.; Bettman, B.; et al. Real-Time DNA Sequencing from Single Polymerase Molecules. Science 2009, 323, 133–138. [Google Scholar] [CrossRef] [PubMed]
- Mikheyev, A.S.; Tin, M.M.Y. A First Look at the Oxford Nanopore MinION Sequencer. Mol. Ecol. Resour. 2014, 14, 1097–1102. [Google Scholar] [CrossRef] [PubMed]
- Travers, K.J.; Chin, C.-S.; Rank, D.R.; Eid, J.S.; Turner, S.W. A Flexible and Efficient Template Format for Circular Consensus Sequencing and SNP Detection. Nucleic Acids Res. 2010, 38, e159. [Google Scholar] [CrossRef] [PubMed]
- Loomis, E.W.; Eid, J.S.; Peluso, P.; Yin, J.; Hickey, L.; Rank, D.; McCalmon, S.; Hagerman, R.J.; Tassone, F.; Hagerman, P.J. Sequencing the Unsequenceable: Expanded CGG-Repeat Alleles of the Fragile X Gene. Genome Res. 2013, 23, 121–128. [Google Scholar] [CrossRef]
- Pharmacogenomics Testing with the SOPHiA DDMTM Platform—SOPHiA GENETICS. Available online: https://www.sophiagenetics.com/clinical/rare-and-inherited-diseases/pharmacogenomics/ (accessed on 6 October 2023).
- SOPHiA DDMTM For Genomics. Available online: https://www.sophiagenetics.com/technology/sophia-ddm-for-genomics/ (accessed on 6 October 2023).
- Lee, S.-B.; Wheeler, M.M.; Patterson, K.; McGee, S.; Dalton, R.; Woodahl, E.L.; Gaedigk, A.; Thummel, K.E.; Nickerson, D.A. Stargazer: A Software Tool for Calling Star Alleles from next-Generation Sequencing Data Using CYP2D6 as a Model. Genet. Med. 2019, 21, 361–372. [Google Scholar] [CrossRef]
- Twist Bioscience. Long Read Library Preparation and Standard Hyb v2 Enrichment. Available online: https://www.twistbioscience.com/resources/protocol/long-read-library-preparation-and-standard-hyb-v2-enrichment (accessed on 6 October 2023).
- Twist Bioscience. Twist Alliance Long-Read PGx Panel BED File. Available online: https://www.twistbioscience.com/resources/data-files/twist-alliance-long-read-pgx-panel-bed-file (accessed on 6 October 2023).
- McInnes, G.; Lavertu, A.; Sangkuhl, K.; Klein, T.E.; Whirl-Carrillo, M.; Altman, R.B. Pharmacogenetics at Scale: An Analysis of the UK Biobank. Clin. Pharmacol. Ther. 2021, 109, 1528–1537. [Google Scholar] [CrossRef]
- Swen, J.J.; van der Wouden, C.H.; Manson, L.E.; Abdullah-Koolmees, H.; Blagec, K.; Blagus, T.; Böhringer, S.; Cambon-Thomsen, A.; Cecchin, E.; Cheung, K.-C.; et al. A 12-Gene Pharmacogenetic Panel to Prevent Adverse Drug Reactions: An Open-Label, Multicentre, Controlled, Cluster-Randomised Crossover Implementation Study. Lancet 2023, 401, 347–356. [Google Scholar] [CrossRef]
- Esteves, F.; Rueff, J.; Kranendonk, M. The Central Role of Cytochrome P450 in Xenobiotic Metabolism—A Brief Review on a Fascinating Enzyme Family. J. Xenobiot. 2021, 11, 94–114. [Google Scholar] [CrossRef]
- Qiao, W.; Martis, S.; Mendiratta, G.; Shi, L.; Botton, M.R.; Yang, Y.; Gaedigk, A.; Vijzelaar, R.; Edelmann, L.; Kornreich, R.; et al. Integrated CYP2D6 Interrogation for Multiethnic Copy Number and Tandem Allele Detection. Pharmacogenomics 2019, 20, 9–20. [Google Scholar] [CrossRef] [PubMed]
- Stephens, M.; Smith, N.J.; Donnelly, P. A New Statistical Method for Haplotype Reconstruction from Population Data. Am. J. Hum. Genet. 2001, 68, 978–989. [Google Scholar] [CrossRef] [PubMed]
- Logsdon, G.A.; Vollger, M.R.; Eichler, E.E. Long-Read Human Genome Sequencing and Its Applications. Nat. Rev. Genet. 2020, 21, 597–614. [Google Scholar] [CrossRef] [PubMed]
- van der Lee, M.; Rowell, W.J.; Menafra, R.; Guchelaar, H.-J.; Swen, J.J.; Anvar, S.Y. Application of Long-Read Sequencing to Elucidate Complex Pharmacogenomic Regions: A Proof of Principle. Pharmacogenomics J. 2022, 22, 75–81. [Google Scholar] [CrossRef]
- Martin, M.; Ebert, P.; Marschall, T. Read-Based Phasing and Analysis of Phased Variants with WhatsHap. Methods Mol. Biol. 2023, 2590, 127–138. [Google Scholar] [CrossRef]


| Samples (n = 13) | Haplotype Concordance SRS vs. LRS | Diplotype Concordance SRS vs. LRS | Phenotype Concordance SRS vs. LRS | Details |
|---|---|---|---|---|
| Sample 1 | yes | yes | yes | |
| Sample 2 | no | yes | yes | Low depth for UGT1A1*60 and UGT1A1*93 by LRS (TA6/TA7) |
| Sample 3 | no | no | yes | NAT2*6/*13 given by statistical phasing was detected as NAT2*4/*6,*13 by direct phasing |
| Sample 4 | no | no | yes | CYP2D6*2/*2 by SRS was detected as *5/*2 × 2 by LRS NAT2 *5,*12,*13/*6,*11 given by statistical phasing was detected as NAT2 *6,*13,*12/*5,*11 by direct phasing |
| Sample 5 | no | yes | yes | Low depth for UGT1A1*60 and UGT1A1*93 by LRS phasing (TA6/TA7) |
| Sample 6 | yes | yes | yes | |
| Sample 7 | yes | yes | yes | |
| Sample 8 | yes | yes | yes | |
| Sample 9 | no | no | yes | NAT2 *5,*12/*11 given by statistical phasing was detected as NAT2 *12/*5,*11 by direct phasing |
| Sample 10 | no | no | yes | NAT2*4/*5,*11,*12 given by statistical phasing was detected as *12/*5,*11 by direct phasing |
| Sample 11 | no | no | yes | NAT2*6/*13 given by statistical phasing was detected as NAT2 *12/*6,*13,*12 by direct phasing |
| Sample 12 | no | yes | yes | No coverage for UGT1A1*60 and UGT1A1*93 with the LRS technique (TA6/TA7) |
| Sample 13 | yes | yes | yes | |
| Total | 38.4% (5/13) | 61.5% (8/13) | 100% (13/13) |
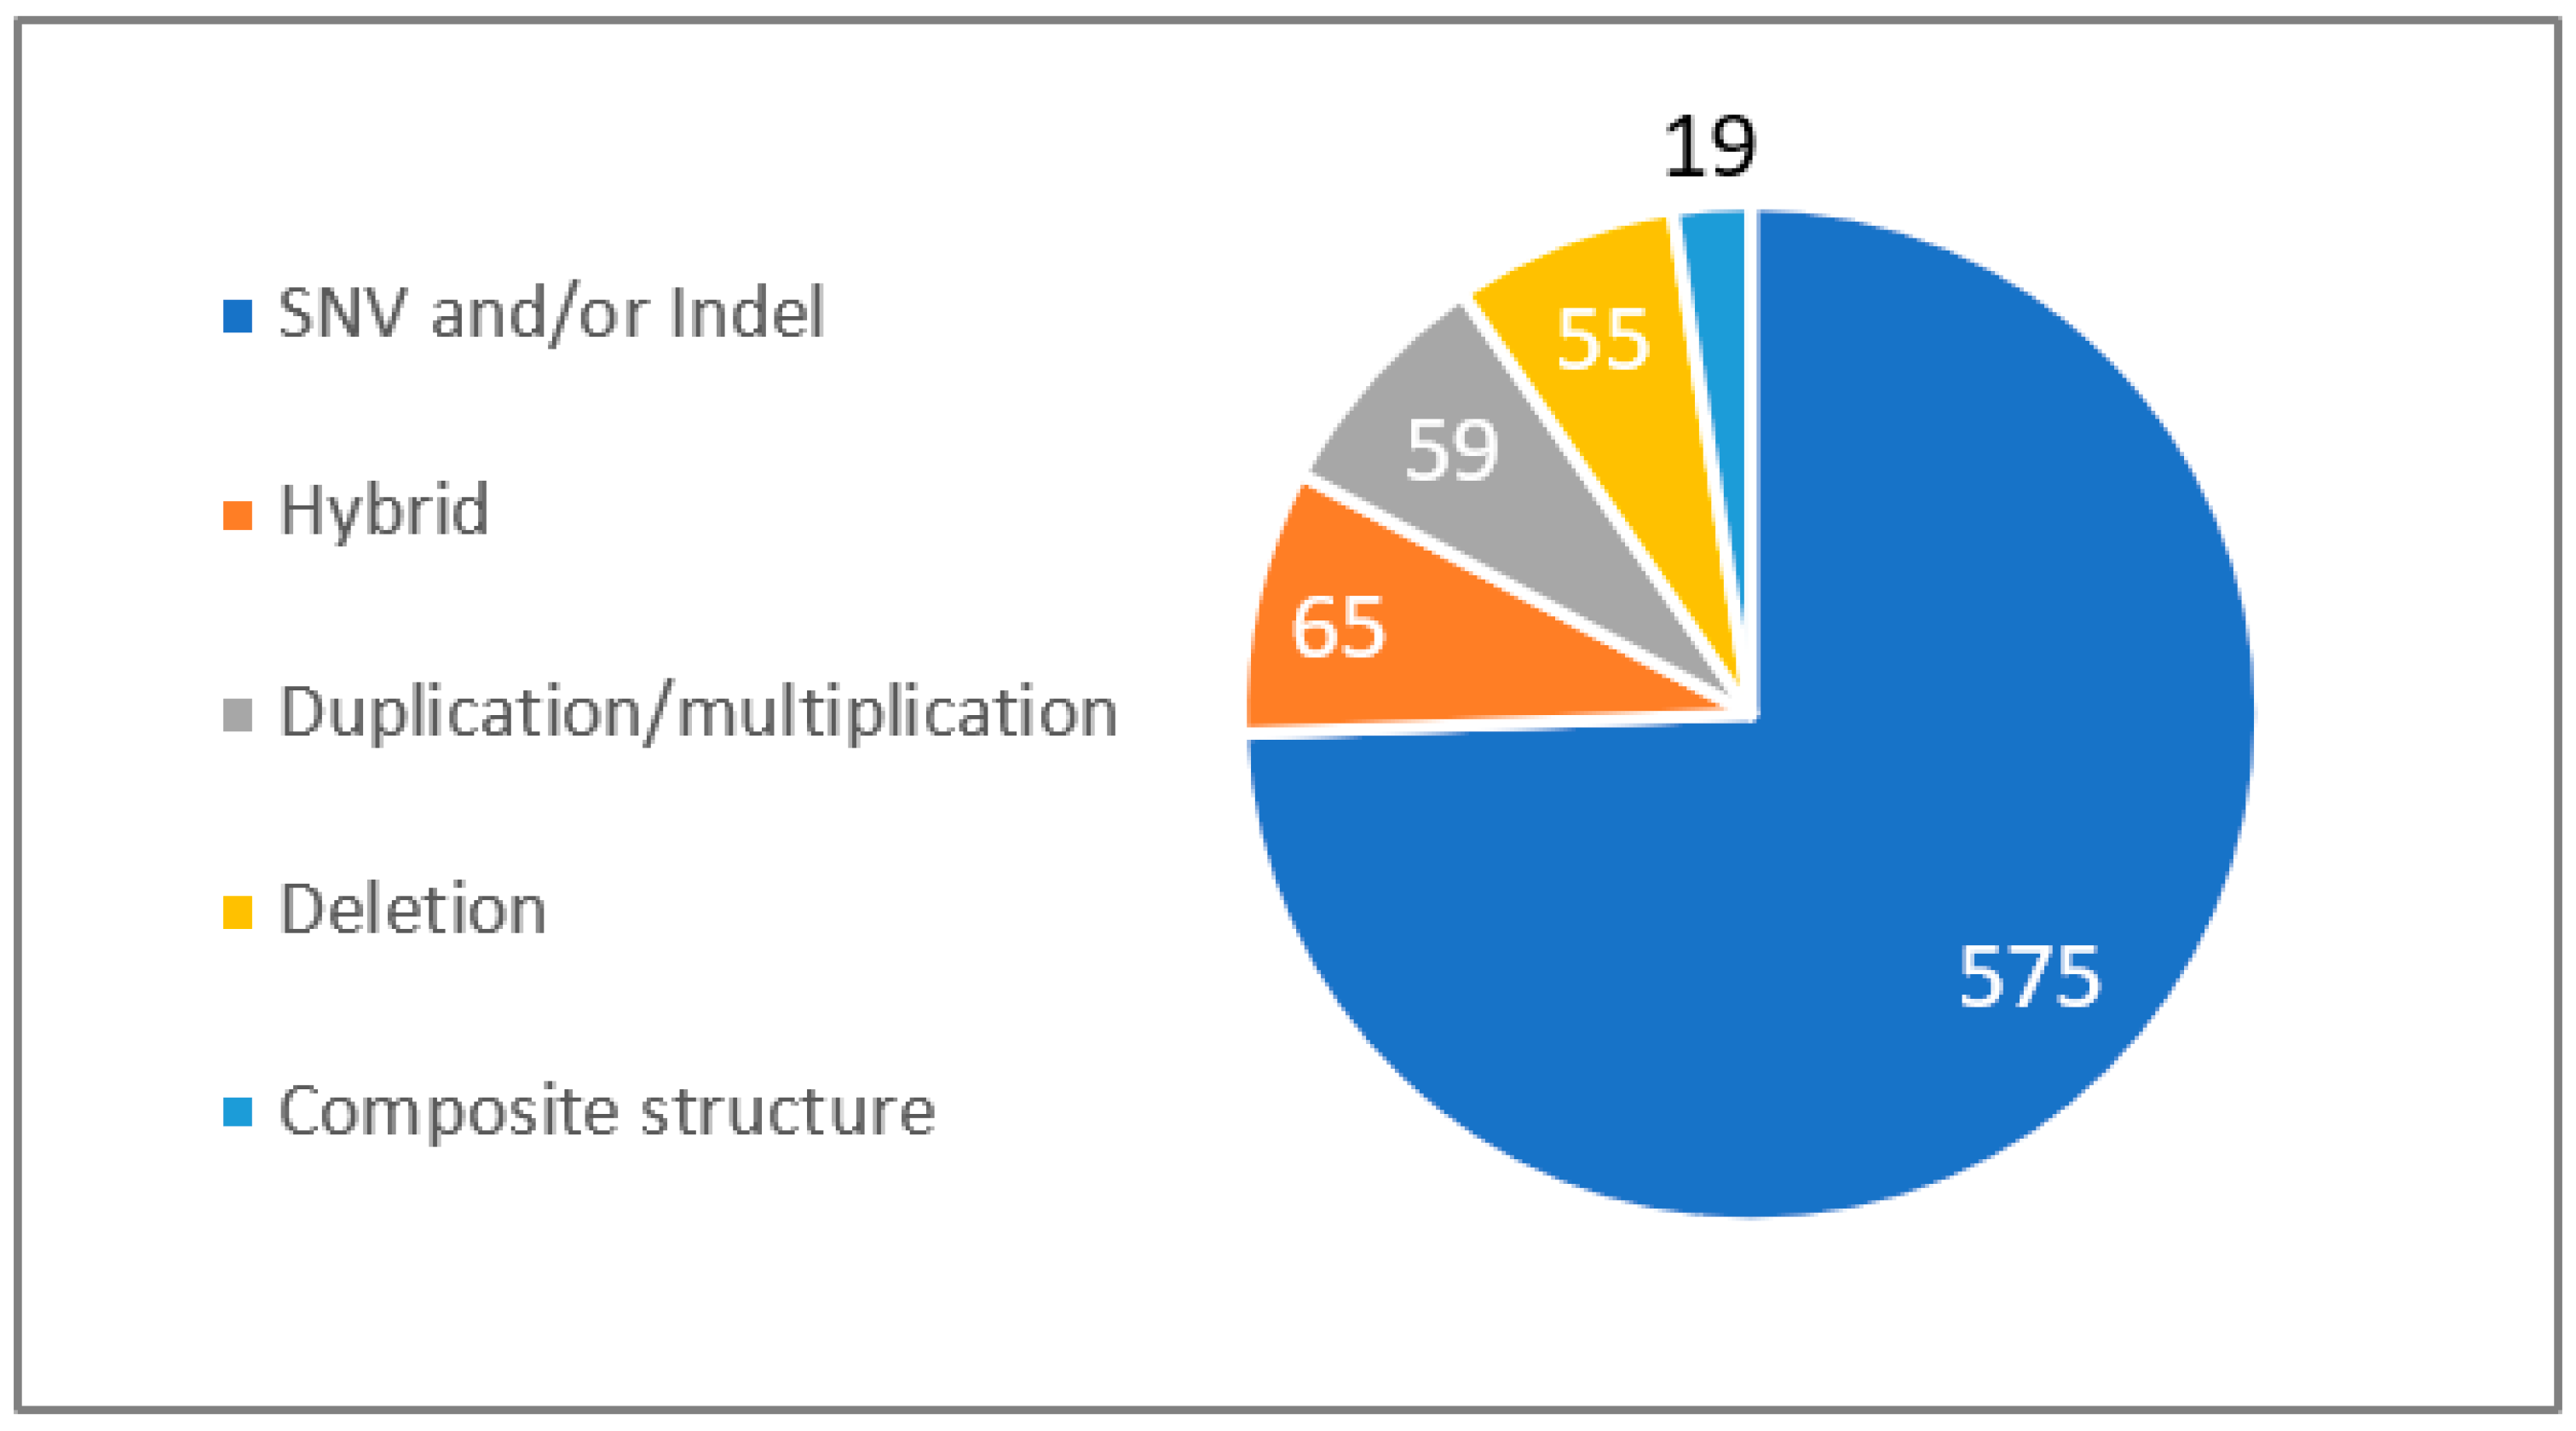
| CYP2D6 Structural Forms (n) | Diplotypes (n) |
|---|---|
| Hybrid (65) | *1/*4,*68 (16); *2/*4,*68 (14); *4/*41,*68 (7); *4 × 2,*68 (5); *1/*4,*4N (3); *4/*4,*68 (3); *3/*4,*68 (1); *1/*2,*68 (2); *9/*4,*68 (2); *4/*35,*68 (2); *1/*2,*13 (2); *41/*4,*68 (1); *2/*41,*68 (1); *4/*1,*61 (1); *4/*6,*4N (1); *10/*10,*36 (1); *4 × 2,*36 (1); *2/*10,*36 (1); *17/*45,*68 (1) |
| Duplication/multiplication (59) | *1/*2 × 2 (20); *2 × 2/*41 (6); *2 × 2/*4 (4); *2/*2 × 2 (4); *1 × 3 (3); *1/*4 × 2 (2); *2 × 3 (2); *10 × 2/*1 (1); *1 × 2/*53 (1); *4/*28 × 2 (1); *2 × 2/*28 (1); *2 × 2/*10 (1); *41/*71 × 2 (1); *2 × 2/*35 (1); *4 × 2/*9 (1); *1/*2 × 3 (1); *1 × 2/*9 (1); *1 × 2/*29 (1); *1 × 2/*41 (1); *2 × 3/*29 (1); *35 × 3 (1); *4/*9 × 2 (1); *3 × 2/*41 (1); *2 × 2/*17 (1); *2 × 2/*33 (1) |
| Deletion (55) | *1/*5 (25); *4/*5 (7); *2/*5 (6); *5/*41 (4); *5/*35 (2); *5/*17 (2); *5/*9 (2); *3/*5 (2); *5/*10 (2); *5/*34 (1); *5/*29 (1); *5/*28 (1) |
| Composite structure (19) | *2 × 2/*4,*68 (5); *1/*4,*68 × 2 (2); *4 × 2,*68 × 2 (2); *1 × 2/*4,*68 (1); *5/*4,*68 (1); *1/*4,*68 × 3 (1); *3/*4,*68 (1); *4/*28,*68 × 2 (1); *2 × 3/*68 (1); *2/*5,*36 (1); *2 × 2/*41,*80 (1); *10 × 2,*36 × 2 (1); *4 × 2,*4N × 2 (1) |
| CYP2D6 Form (n) | Sample (n = 13) | Copy Number Variation 2D6/2D7 /Hybrid | Hybrid | Diplotype | Metabolizer Status (AS) | Diplotype Concordance | Phenotype Concordance |
|---|---|---|---|---|---|---|---|
| Hybrid (1) | Sample 10 | 2/2/1 | CYP2D6-2D7 | *4/*41,*68 | PM (0.5) | yes | yes |
| Duplication (2) | Sample 3 | 3/2/0 | absence | *2 × 2/*41 | NM (2.25) | yes | yes |
| Sample 11 | 3/2/0 | absence | *1/*4 × 2 | IM (1.0) | yes | yes | |
| Deletion (1) | Sample 1 | 1/2/0 | absence | *5/*17 | PM (0.5) | yes | yes |
| Deletion and duplication (1) | Sample 4 | 3/2/0 | absence | *2 × 2/*5 | IM (1.0) | no | yes |
| Composite structure (1) | Sample 13 | 3/2/1 | CYP2D6-2D7 | *1 × 2/*4,*68 | NM (2.0) | yes | yes |
| SNV and/orindel (7) | Sample 12 | 2/2/0 | absence | *1/*41 | NM (1.25) | yes | yes |
| Sample 9 | 2/2/0 | absence | *29/*43 | IM (1.0) | yes | yes | |
| Sample 8 | 2/2/0 | absence | *1/*10 | NM (1.25) | yes | yes | |
| Sample 7 | 2/2/0 | absence | *4/*6 | PM (0) | yes | yes | |
| Sample 6 | 2/2/0 | absence | *1/*41 | NM (1.25) | yes | yes | |
| Sample 5 | 2/2/0 | absence | *9/*41 | PM (0.5) | yes | yes | |
| Sample 2 | 2/2/0 | absence | *2/*2 | NM (2.0) | yes | yes |
| Sample (n = 13) | Diplotype SRS | Metabolizer Status (AS) SRS | TA Repeat rs34983651 rs57191451 SRS vs. LRS | Diplotype LRS | Metabolizer Status (AS) LRS | Diplotype Concordance SRS vs. LRS |
|---|---|---|---|---|---|---|
| Sample 1 | *36/*60 | NM(2.125) | TA5/TA6 vs. TA5/TA6 | *36/*60 | NM (2.125) | yes |
| Sample 2 | *1/*28 | IM(1.3) | TA6/TA7 vs. TA6/TA7 | *1/*28 | IM (1.3) | yes |
| Sample 3 | *1/*60 | IM(1.7) | TA6/TA6 vs. TA6/TA6 | *1/*60 | IM (1.7) | yes |
| Sample 4 | *1/*1 | NM(2) | TA6/TA6 vs. TA6/TA6 | *1/*1 | NM (2) | yes |
| Sample 5 | *1/*28 | IM(1.3) | TA6/TA7 vs. TA6/TA7 | *1/*28 | IM (1.3) | yes |
| Sample 6 | *1/*1 | NM(2) | TA6/TA6 vs. TA6/TA6 | *1/*1 | NM (2) | yes |
| Sample 7 | *28/*28 | PM(0.6) | TA7/TA7 vs. TA7/TA7 | *28/*28 | PM (0.6) | yes |
| Sample 8 | *1/*28 | IM(1.3) | TA6/TA7 vs. TA6/TA7 | *1/*28 | IM (1.3) | yes |
| Sample 9 | *36/*37 | IM(1.3) | TA5/TA8 vs. TA5/TA8 | *36/*37 | IM (1.3) | yes |
| Sample 10 | *1/*28 | IM(1.3) | TA6/TA7 vs. TA6/TA7 | *1/*28 | IM (1.3) | yes |
| Sample 11 | *1/*28 | IM(1.3) | TA6/TA7 vs. TA6/TA7 | *1/*28 | IM (1.3) | yes |
| Sample 12 | *1/*28 | IM(1.3) | TA6/TA7 vs. TA6/TA7 | *1/*28 | IM (1.3) | yes |
| Sample 13 | *28/*28 | PM(0.6) | TA7/TA7 vs. TA7/TA7 | *28/*28 | PM (0.6) | Yes |
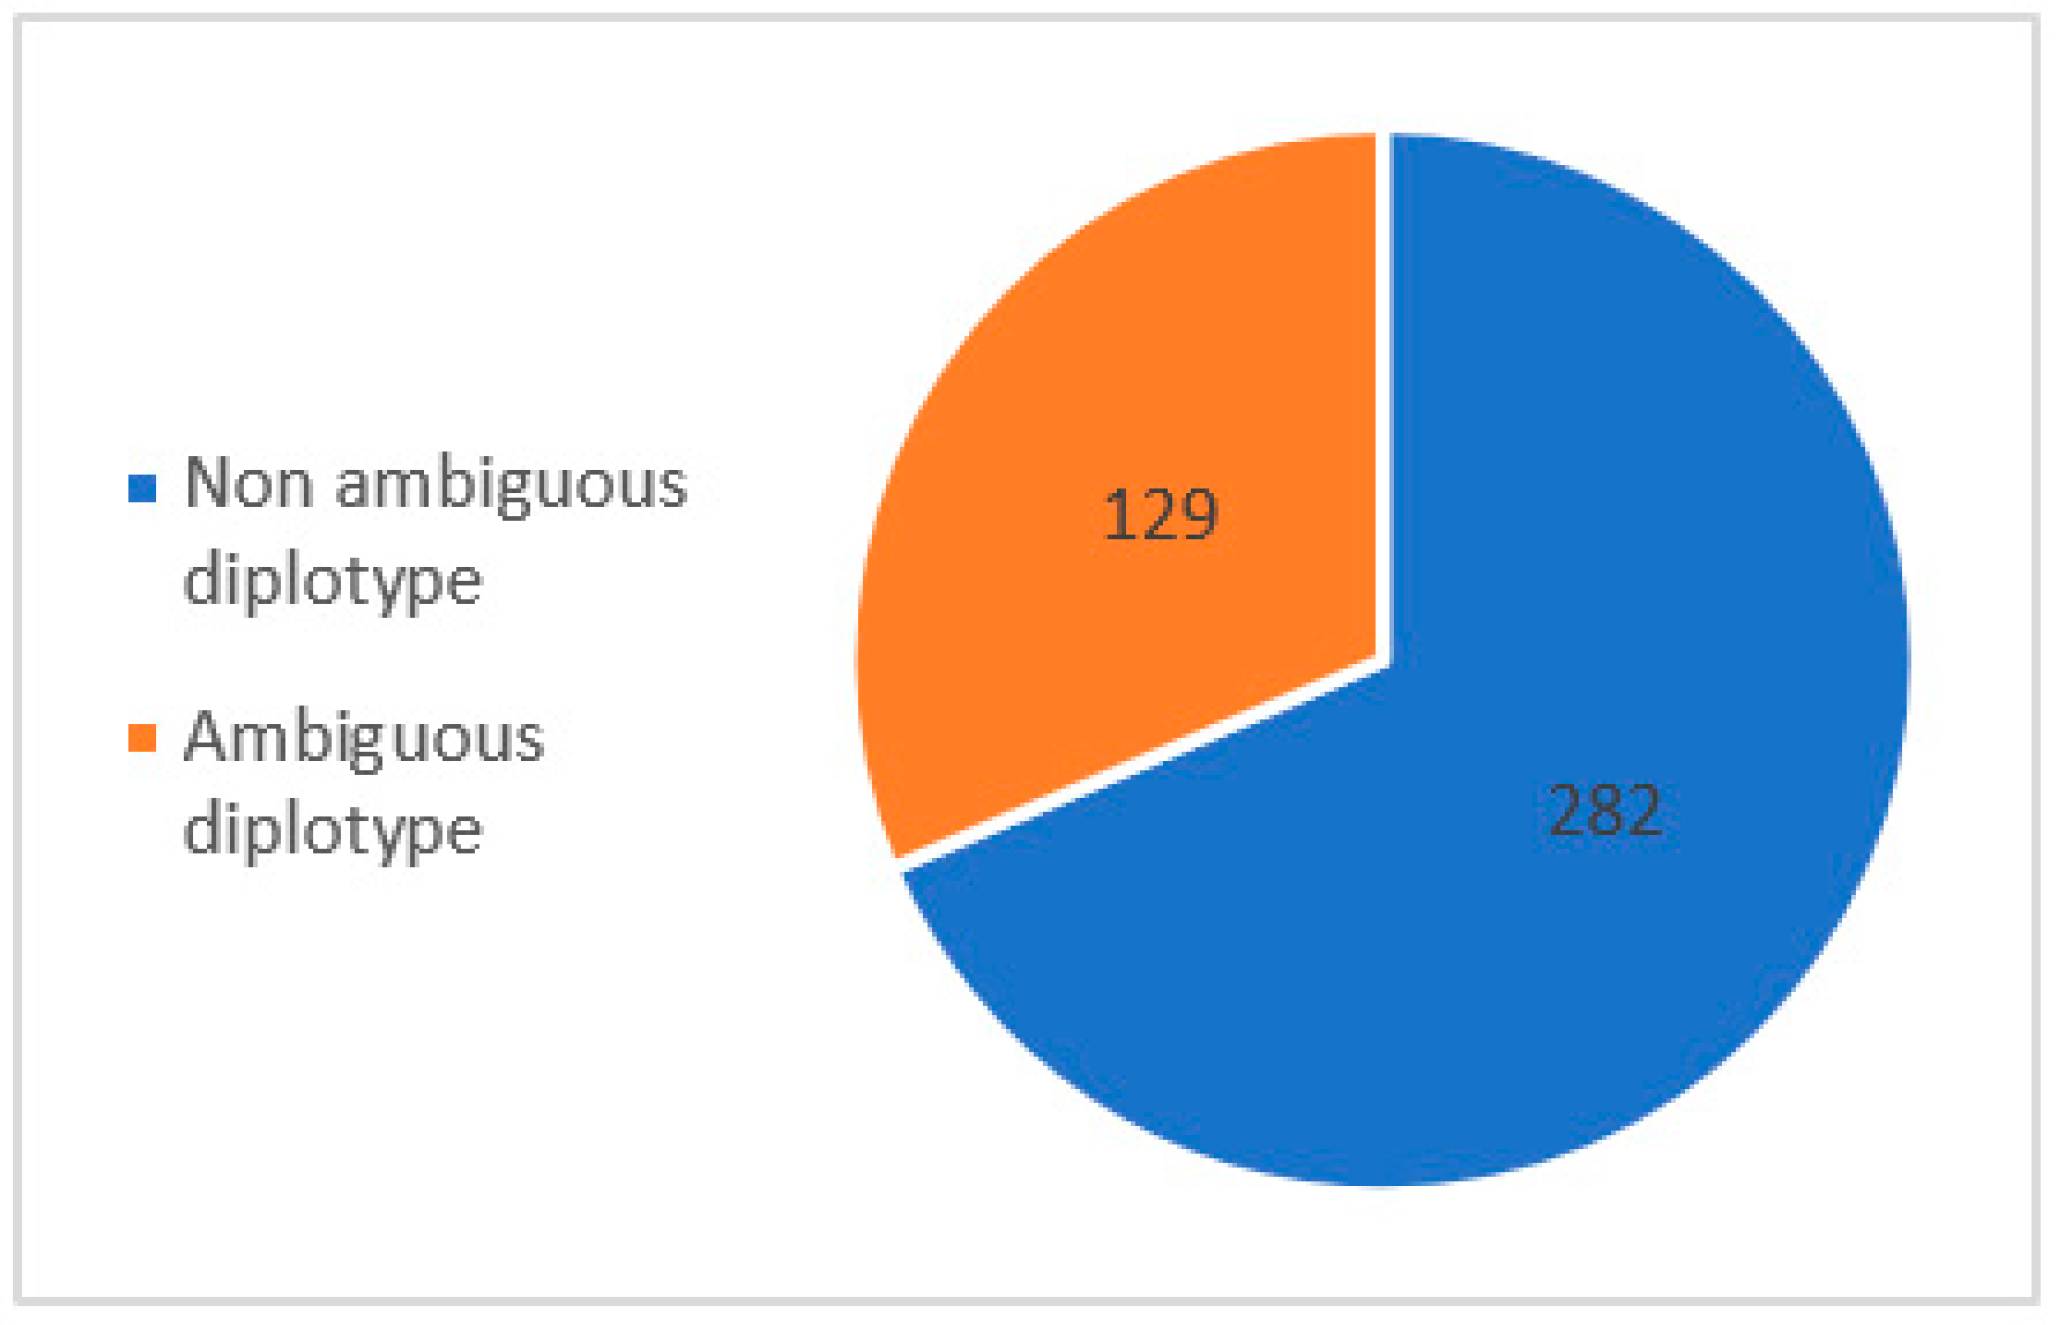
| Type (n) | Diplotypes (n) |
|---|---|
| Non-ambiguous diplotype (282) | *5,*11,*12/*5,*11,*12 (70); *4/*5,*11,*12 (53); *6,*13/*6,*13 (42); *4/*6,*13 (33); *4/*4 (20); *6/*13 (14); *5/*11,*12 (7); *4/*5,*12 (5); *5,*11/*12 (5); *4/*12 (4); *7/*13 (4); *5,*11,*12/*5,*12 (3); *4/*7,*13 (2); *5,*11/*5,*11,*12 (2); *5,*12/*11 (2); *5,*12/*11,*12 (2); *6,*12/*13 (2); *4/*14,*13 (1); *4/*5,*11 (1); *4/*6,*12,*13 (1); *4/*6 (1); *5,*11,*12/*11,*12 (1); *5,*11,*12/*13 (1); *5/*11,*12,*13 (1); *5/*12 (1); *6,*13/*13 (1); *5,*12/*14 (1); *5,*14,*11,*12/*13 (1); *5/*14,*11,*12,*13 (1) |
| Ambiguous diplotype (129) | *5,*11,*12/*6,*13 (68); *5,*11,*12,*13/*6 (7); *5,*11/*6,*12,*13 (7); *5,*11,*12/*7,*13 (6); *5,*6,*11/*12,*13 (6); *5,*11/*6,*13 (6); *4/*5,*6,*11,*12,*13 (4); *5,*12/*6,*13 (4); *5,*6,*13/*11,*12 (3); *5,*6,*11,*12/*13 (3); *5,*13/*6,*11,*12 (2); *4/*5,*14,*11,*12 (1); *4/*6,*14,*13 (1); *5,*11,*12,*13/*7 (1); *5,*12,*13/*6 (1); *5,*12,*13/*6,*11 (1); *5,*14,*12/*11 (1); *5,*6,*11/*13 (1); *5,*6,*12/*11,*13 (1); *5,*6,*12/*13 (1); *5/*6 (1); *5/*7,*11,*12,*13 (1); *6,*13/*7,*13 (1); *6/*14,*13 (1) |
| NAT2 Form (n) | Sample (n = 13) | Diplotype SRS (Stargazer) | Acetylator Status SRS | Clinical Diplotype LRS | Metabolizer Status (AS) | Diplotype Concordance SRS|LRS |
|---|---|---|---|---|---|---|
| Non-ambiguous diplotype (12) | Sample 1 | *4/*5,*12 | IA | *4/*5,*12 | IA | yes |
| Sample 2 | *4/*4 | RA | *4/*4 | RA | yes | |
| Sample 3 | *6/*13 | IA | *4/*6,*13 | IA | no | |
| Sample 5 | *5,*11,*12/*5,*11,*12 | SA | *5,*11,*12/*5,*11,*12 | SA | yes | |
| Sample 6 | *4/*5,*11,*12 | IA | *4/*5,*11,*12 | IA | yes | |
| Sample 7 | *4/*6,*13 | IA | *4/*6,*13 | IA | yes | |
| Sample 8 | *5,*11,*12/*5,*12 | SA | *5,*11,*12/*5,*12 | SA | yes | |
| Sample 9 | *5,*12/*11 | SA | *12/*5,*11 | SA | no | |
| Sample 10 | *4/*5,*11,*12 | IA | *12/*5,*11 | IA | no | |
| Sample 11 | *6/*13 | IA | *12/6,*13,*12 | IA | no | |
| Sample 12 | *5,*11,*12/*5,*11,*12 | SA | *5,*11,*12/*5,*11,*12 | SA | yes | |
| Sample 13 | *6,*13/*6,*13 | SA | *6,*13/*6,*13 | SA | yes | |
| Ambiguous diplotype (1) | Sample 4 | *5,*12,*13/*6,*11 | IA | *6,*13,*12/*5,*11 | IA | no |
Disclaimer/Publisher’s Note: The statements, opinions and data contained in all publications are solely those of the individual author(s) and contributor(s) and not of MDPI and/or the editor(s). MDPI and/or the editor(s) disclaim responsibility for any injury to people or property resulting from any ideas, methods, instructions or products referred to in the content. |
© 2023 by the authors. Licensee MDPI, Basel, Switzerland. This article is an open access article distributed under the terms and conditions of the Creative Commons Attribution (CC BY) license (https://creativecommons.org/licenses/by/4.0/).
Share and Cite
Barthélémy, D.; Belmonte, E.; Pilla, L.D.; Bardel, C.; Duport, E.; Gautier, V.; Payen, L. Direct Comparative Analysis of a Pharmacogenomics Panel with PacBio Hifi® Long-Read and Illumina Short-Read Sequencing. J. Pers. Med. 2023, 13, 1655. https://doi.org/10.3390/jpm13121655
Barthélémy D, Belmonte E, Pilla LD, Bardel C, Duport E, Gautier V, Payen L. Direct Comparative Analysis of a Pharmacogenomics Panel with PacBio Hifi® Long-Read and Illumina Short-Read Sequencing. Journal of Personalized Medicine. 2023; 13(12):1655. https://doi.org/10.3390/jpm13121655
Chicago/Turabian StyleBarthélémy, David, Elodie Belmonte, Laurie Di Pilla, Claire Bardel, Eve Duport, Veronique Gautier, and Léa Payen. 2023. "Direct Comparative Analysis of a Pharmacogenomics Panel with PacBio Hifi® Long-Read and Illumina Short-Read Sequencing" Journal of Personalized Medicine 13, no. 12: 1655. https://doi.org/10.3390/jpm13121655
APA StyleBarthélémy, D., Belmonte, E., Pilla, L. D., Bardel, C., Duport, E., Gautier, V., & Payen, L. (2023). Direct Comparative Analysis of a Pharmacogenomics Panel with PacBio Hifi® Long-Read and Illumina Short-Read Sequencing. Journal of Personalized Medicine, 13(12), 1655. https://doi.org/10.3390/jpm13121655