Systematic Review

Quality of Life and Audiological Benefits in Pediatric Cochlear Implant Users in Romania: Systematic Review and Cohort Study

by
Gina Gundacker
1,*,
Delia Emilia Trales
2 and
Horatiu Eugen Stefanescu
2
1
Life Science Department, University of Applied Sciences Technikum Vienna, 1200 Vienna, Austria
2
Department of Otolaryngology, Victor Babeș Medical and Pharmaceutical University, 300041 Timișoara, Romania
*
Author to whom correspondence should be addressed.
J. Pers. Med. 2023, 13(11), 1610; https://doi.org/10.3390/jpm13111610
Submission received: 13 October 2023 / Revised: 7 November 2023 / Accepted: 9 November 2023 / Published: 15 November 2023
(This article belongs to the Special Issue Personalized Medicine in Otolaryngology: Special Topic Otology)

Abstract

:
Profound sensorineural hearing loss (SNHL) can be successfully treated with a cochlear implant (CI), and treatment is usually accompanied by increased quality of life (QoL). Therefore, the aim of this study was to investigate generic and health-related QoL, as well as the level of audiological outcomes, of CI users, in addition to whether Qol can be restored to the extent of those with normal hearing. Furthermore, different implantation timepoints were compared (early vs. late), and a possible correlation between health and generic QoL questionnaires was investigated. The outcomes from 93 pediatric CI users from Romania were analyzed in the study. Two QoL questionnaires (SSQ12, AQoL-6D), as well as the HSM sentence test and Soundfield measurements, were assessed. The outcomes revealed that the CI users were able to achieve the same QoL as their age- and-gender matched peers with normal hearing, and hearing was restored with good speech comprehension. No significant difference between early- and late-implanted children was detected, although a tendency of a better Word Recognition Score (+10%) in the early-implanted group was discovered. A moderate and significant correlation between the generic and health-related Qol questionnaire was observed. Audiological examinations are still the standard practice by which to measure the benefit of any hearing intervention; nonetheless, generic and health-related QoL should be assessed in order to provide a full picture of a successful and patient-satisfactory cochlear implant procedure.

1. Introduction

Hearing loss (HL) is the most common sensory impairment, and, as of today, the only one which can be replaced with an implant [1]. According to the world report on hearing from 2021, conducted by the World Health Organization (WHO), more than 5% of the world’s population, i.e., roughly 460 million individuals, have moderate to severe hearing loss which would influence their everyday lives if left untreated [2]. Of these people, about 34 million children are affected with disabling hearing loss [3]. Hearing-impaired people suffer from restrictions regarding their participation in daily life [3]. Furthermore, individuals with communication difficulties have a risk of restricted cognitive skills, including reduced attention and concentration spans as well as lower than average memory recall [2]. This can be avoided if they receive the right support and treatment as soon as possible. Disabling hearing loss often also leads to low self-esteem, feelings of seclusion, and social isolation, causing depression and anxiety [2,3]. Hence, people who are hearing-impaired often report a lower overall quality of life (QoL) [2].
Depending on the type and severity of hearing impairment, several treatment options are possible, from conventional hearing aids to medical interventions utilizing passive middle ear prostheses, active middle ear or bone conduction implants, and cochlear implants (CI). Cochlear implantation often requires personalized rehabilitation to not only hear sounds, but to enhance speech perception, speech production, and language development [3,4]. With the use of a CI, approximately one million partly or completely deaf individuals worldwide have been able to regain functional hearing [5]. The literature on children with CIs has demonstrated significant outcomes, especially in the development and perception of speech [6]. Children who have received cochlear implants at a young age have developed speech perception skills that allow them to develop fluent spoken language at a rate resembling that of children with normal hearing [6,7].
The progress and benefit of a cochlear implant can be measured via objective measures such as pure tone audiometry, which is measured at certain frequencies and sound levels [8]. Also, sentence tests are regularly applied in order to check whether speech comprehension is developing. The Hochmair–Schulz–Moser (HSM) sentence test is one example of such an assessment, and was developed especially for CI users, applying everyday words to test their speech perception [9]. In general, beneficial audiometric measurements do not always indicate a better QoL [10]. However, since the aim of such interventions is to improve quality of life, attention should also be focused on how the person subjectively perceives their new hearing. A vast amount of different QoL questionnaires, validated and translated into numerous languages, are available and are used to validate the benefit to the patient. These tests can be taken into account for future treatments and can be compared to other, similar interventions [11].
Quality of life questionnaires validate individuals’ subjective perception of different dimensions of life, such as mobility, mental health, sight, hearing, etc. One can distinguish between generic and disease-specific QoL questionnaires and their respective impacts on quality of life [10]. The evaluation of quality of life is still not a standard clinical routine measure to evaluate the benefit of an intervention; thus, the available literature on the quality of life of CI patients is very heterogenous.
Therefore, the aim of this study was to conduct a systematic literature review on the generic QoL of CI users, as well as to provide additional audiological data and QoL scores from a pediatric study cohort of CI users from Romania. Therefore, the following points were the focus of this paper:
  • A systematic review of the current literature regarding the QoL of CI users was conducted to obtain an overview of the generic QoL questionnaires utilized in the literature, and to see which questionnaires were employed for pediatric CI users.
  • The generic QoL of the Romanian CI user study cohort was assessed, and they were compared with age- and gender-matched peers with normal hearing.
  • Data from the study cohort were collected to assess the level of speech comprehension and hearing ability of pediatric CI users in Romania using the translated and recorded HSM sentence test and pure tone audiometry.
  • Possible influencing factors, such as early-implanted (≤3 years) CI users versus late-implanted (>3 years) children, were investigated.
  • Finally, possible correlations between the generic and health-related quality of life questionnaires were assessed.

2. Materials and Methods

The methods can be divided into two main areas, with one area describing the methods section for the systematic review. The second main item contains the data collection methods for the Romanian study group of pediatric CI users.

2.1. Systematic Review

The systematic review was conducted according to the PRISMA guidelines [12]. The studies were searched in the PubMed database according to the search terms defined in Table 1. Inclusion and exclusion criteria were defined based on PRISMA guidelines [12] using the so-called PICOS classification (Population, Intervention, Comparators, Outcomes, and Study Design), and are listed in Table 2. The systematic review was not registered.
The Oxford level of evidence guidelines were considered in order to evaluate the quality of the included papers [13]. The five levels were defined based on the possible outcomes/research standards, with level I representing the best and level V representing the worst reporting standard. In our analysis, for example, we considered the study design, the number of study participants, the follow-up examinations, etc.

2.2. Data Collection from the Study Cohort in Romania

2.2.1. Participants

For this study, 93 participants, with a mean age of 10.9 ± 5.0 years, were included. The study cohort consisted of 35 female and 58 male children and adolescents from Romania who were suffering from sensorineural hearing loss accompanied with a hearing threshold higher than 70 dB. Every participant was fitted unilaterally with a cochlear implant (Combi 40+, Pulsar, Sonata, Mi1000 Concerto, Mi1200 Synchrony) and an audio processor (behind the ear: Opus, Opus 2, Sonnet, Sonnet 2, Tempo+; single unit: Rondo, Rondo 2, Rondo 3) from MED-EL (MED-EL GesmbH, Innsbruck, Austria). Adolescents and adults up to 20 years of age were included if the implantation had been carried out in childhood. For this reason, the age range extended from 2 to 20 years.

2.2.2. Data Collection

Data were collected during clinical routine measurements at the clinic of Timisoara (Municipal Hospital, Strada Gheorghe Dima nr. 5, Timisoara, Romania), as well as from a CI self-help group camp in Eforie. The relevant patient outcomes gathered by responsive clinical personnel were provided in a pseudonymized form. The parents or legal representatives provided their consent for the collection of their children’s data.

2.2.3. Quality of Life Assessments

The QoL questionnaires were completed by the participants themselves, using either the online form or the printed version. If the study participants were too young, the questionnaires were completed with the help of their parents or legal representatives.

Assessment of Quality of Life (AQoL-6D)

To measure the generic QoL, the AQoL-6D total utility score, along with the individual utility scores of the six dimensions, were assessed. These dimensions were as follows: Independent Living, Mental Health, Coping, Relationships, Pain, and Senses [14]. The AQoL with six dimensions was considered because the participants were children and adolescents, and the questionnaire with eight dimensions is designed for adults only [15]. The AQoL-6D consists of 20 items, each with four to six possible answers to describe the subject’s situation [14]. Each answer option is assigned a numerical value from 1–6, depending on how many answers are available, and the evaluation tools provided by the AQoL-Homepage convert the absolute outcomes into weighted utility scores [14,16]. In general, the total utility score and the utility sub-scores of the six dimensions for the AQoL-6D range from 0 to 1, with 0 being the worst and 1 being the best possible result, indicating a perfect QoL [14].

Speech, Spatial and Qualities of Hearing Scale (SSQ12)

The SSQ12 consists of twelve questions separated into three main dimensions and an overall outcome [6]. Each question is answered using a Likert scale from 0 to 10. The average of each category (speech, spatial, quality of hearing, and the overall average) is used for the outcome calculations. The resulting outcomes range from 0 to 10, with 10 being the best possible result and 0 the worst. Thus, a score of 10 represents no limitations on QoL due to hearing impairment [17].

2.2.4. Audiological Measurements

Sound Field Audiometry (Clinical Set-Up)

Sound field measurements are frequently performed in routine audiological examinations to determine the hearing thresholds over several frequencies [18]. Calibrated loudspeakers (Pioneer Corp., S-SP 50, Tokyo, Japan) are placed in front of the participant, and sounds of different volumes and frequencies are presented via an audiometer (Interacoustics A/S, AA222, Middelfart, Denmark) in a soundproof room. The non-implanted side is plugged and covered to determine the hearing level of the implanted ear [19].

Speech Audiometry (Camp Set-Up)

The Hochmaier–Schulz–Moser (HSM) sentence test was the assessment of choice for this study where recited sentences must be repeated by the attendant [20]. It was specifically developed to assess the speech comprehension of CI users, and consists of 30 lists with 20 daily sense sentences for each test set. Each list has a word count of 106 words [9]. The HSM sentence test was translated into Romanian and recorded by a professional native male speaker. The results ranged from 0% to 100%, with 100% representing a perfect intelligibility of speech.

2.2.5. Data Analysis

The primary AQoL-6D analysis was conducted with the evaluation tool provided by the AQoL Homepage [14] for the statistical software SPSS (IBM Corp.; IBM SPSS Statistics 29; Armonk, NY, USA). Statistical analysis was carried out using the GraphPad PRISM statistical software (GraphPad Software Inc.; demo version or latest version 9.0.0; San Diego, CA, USA).
The pure tone averages (PTAs) for hearing thresholds with frequencies of 0.5, 1, 2, and 4 kHz were calculated [19,21] for further comparative statistical analyses.
All data sets were tested for normal distribution by applying the Shapiro–Wilk test with a confidence level of 95%, resulting in no normal distribution. Nonparametric statistical tests like the Mann–Whitney U-test, the Spearman rank correlation test, and the Dunn’s multiple comparison were also used. A significance level with an alpha value of 0.05 was set for all tests.

3. Results

There are two primary sections in the results section. The first describes the systematic review’s outcomes. The results of the Romanian study group of pediatric CI users are included in the second main part. Furthermore, unless otherwise specified, all results and numerical values are presented as the mean and standard deviation (SD).

3.1. Systematic Review

The presented outcomes of this systematic review include the results of the screening process; the investigation of the quality of life questionnaires for adults and children that are represented in the current literature; and, finally, the evaluation of the extracted studies.

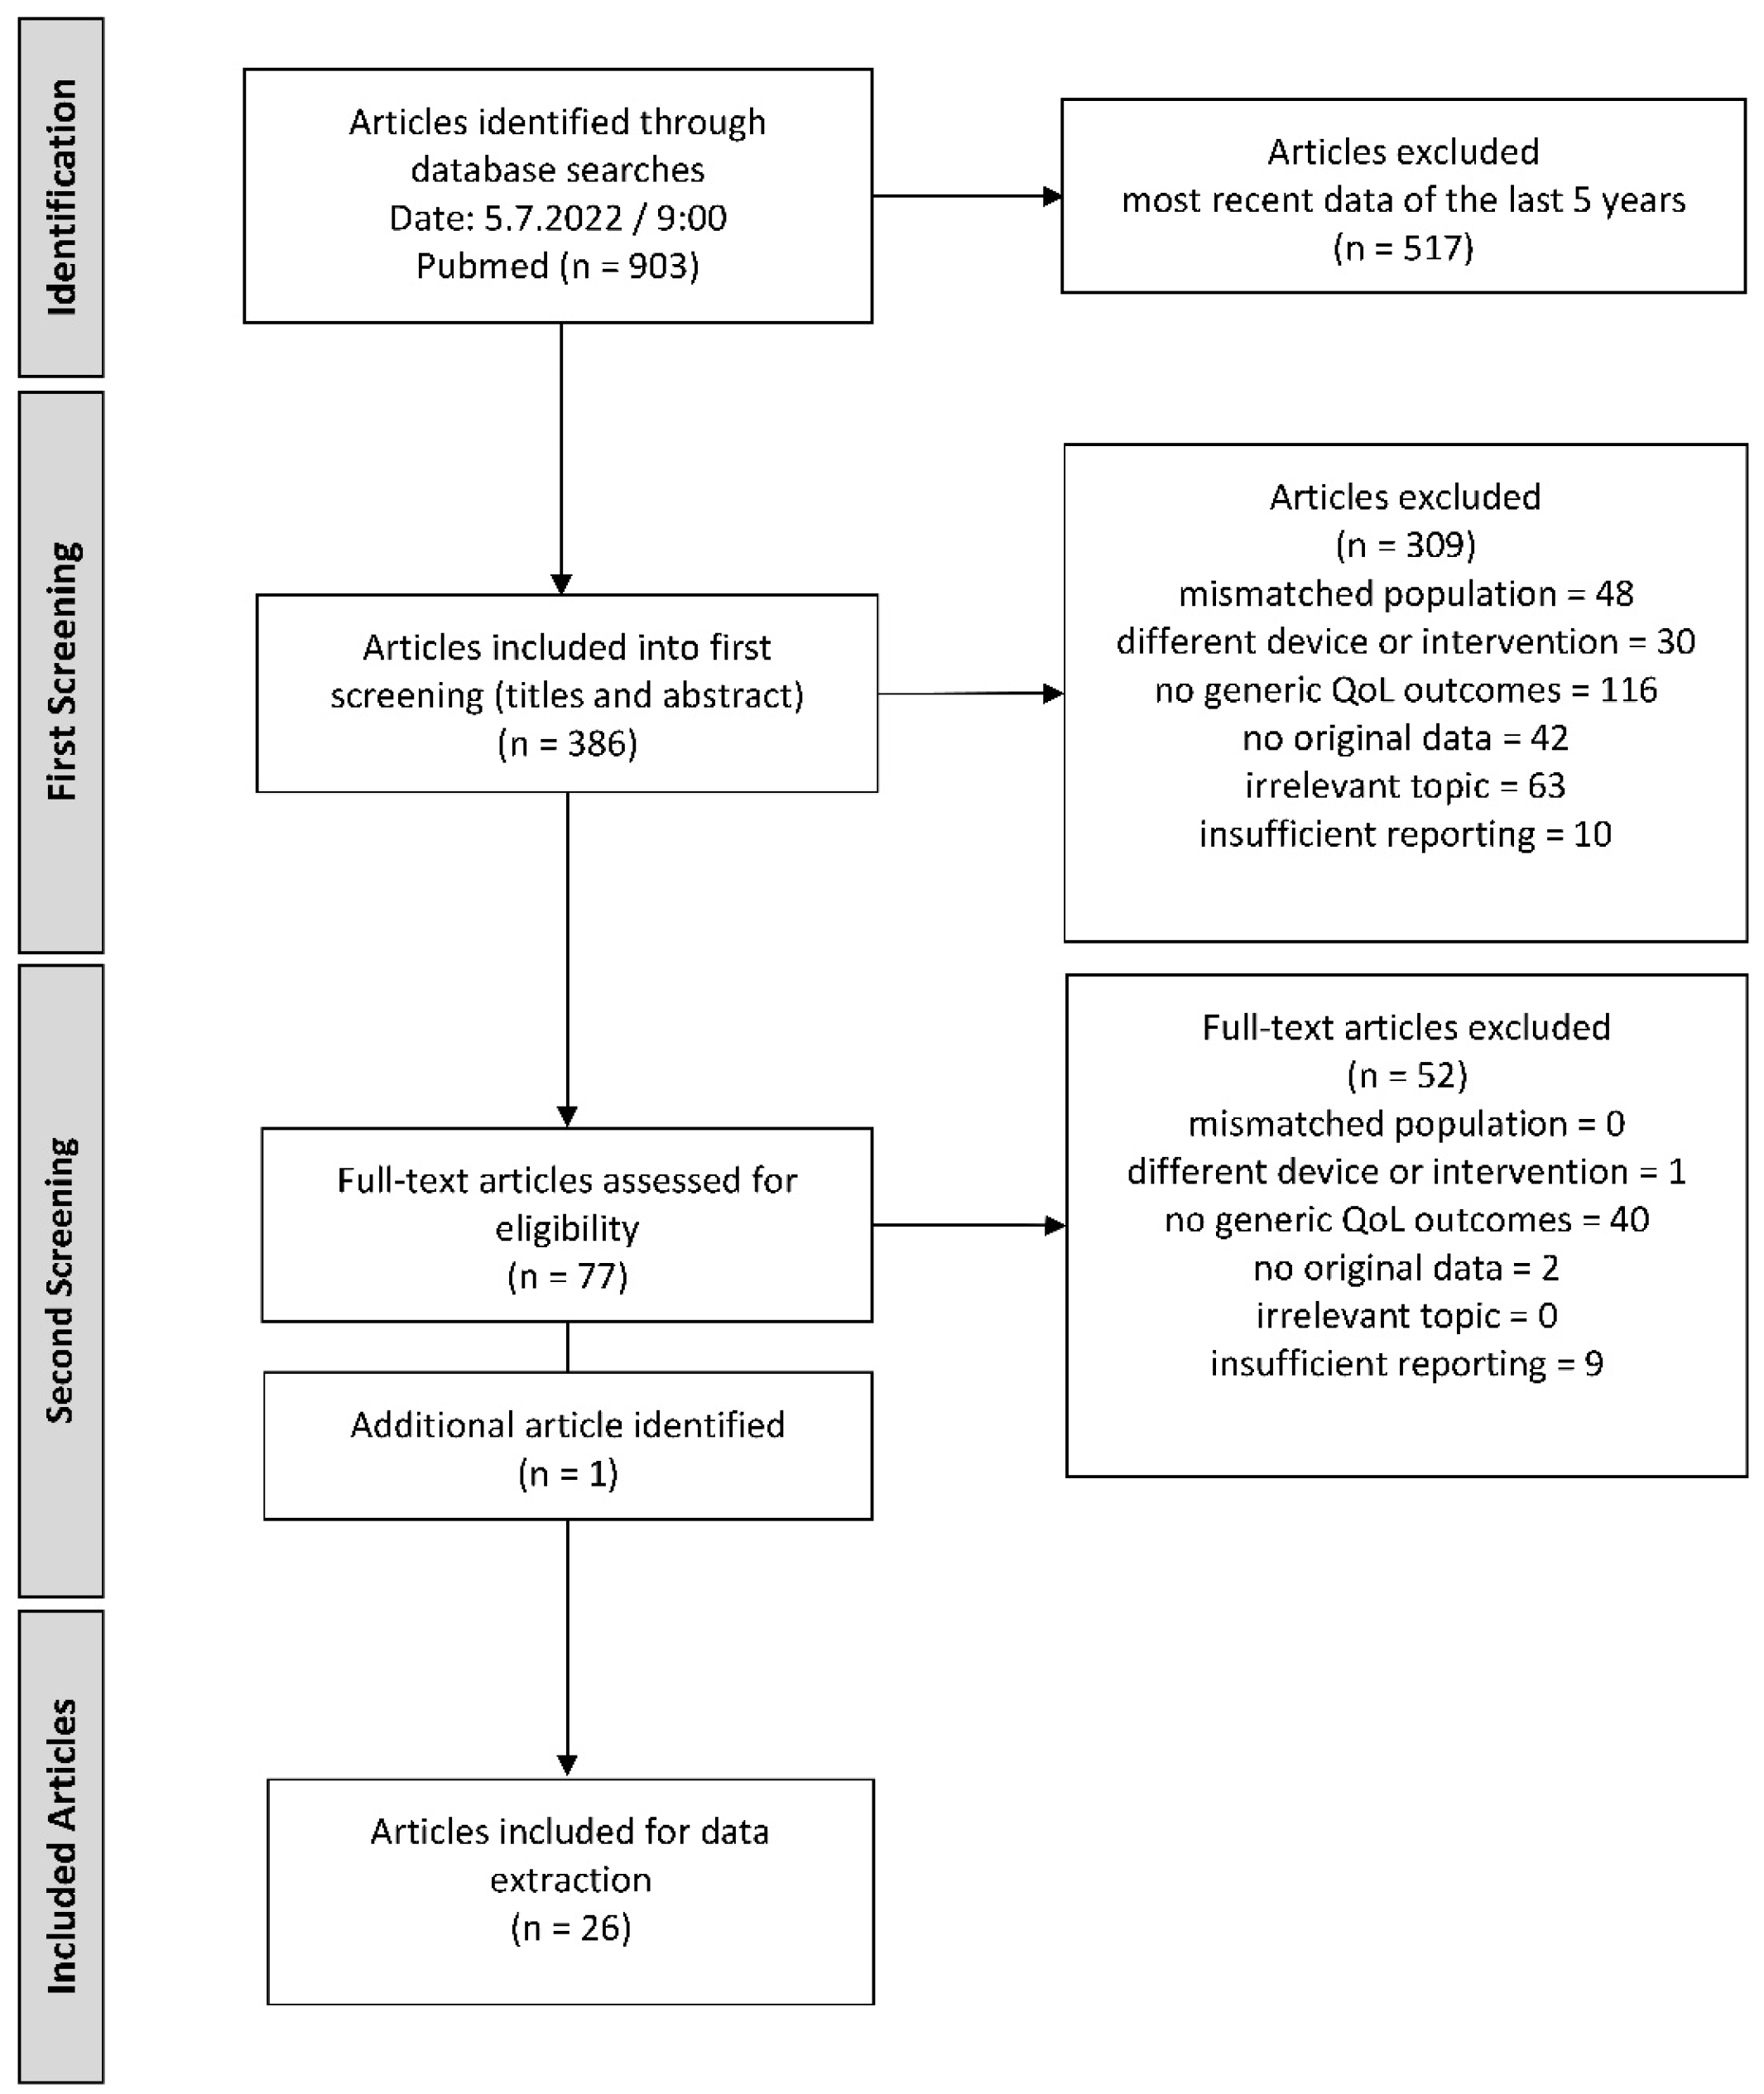
3.1.1. Screening Process

The process and outcomes of the systematic literature search can be seen in the flow chart in Figure 1. First, the articles were selected according to the title and abstract, leaving 77 papers for the second screening, which involved the full text. Following the second screening, data extraction was performed for 25 publications. The screening outcomes and reasons for exclusion (n = 157) are outlined in Figure 1.
An additional search, specifically for the AQoL with the search terms (cochlear implant *) AND (aqol), was conducted on 28.7.2022/9:00. Two publications were identified, but only one [15] met the inclusion criteria described in Table 2. Finally, 26 publications were included for further data extraction.

3.1.2. Adult CI Users and Their Generic QoL

The extracted data of the generic QoL scores for adult CI users are presented in Table 3. The darker blue fields emphasize the total scores, while the lighter green and blue fields highlight the subcategories that can also be merged. An example of this can be seen for the AQoL at the bottom of Table 3, where the light blue subcategories of independent living, pain, and senses are combined to form the category of physical super dimension. The given standard deviation was calculated for the summarized mean values of the included publications. If only one publication is provided for a number of papers, it indicates that the values were extracted directly from the published article. As shown in Table 3, the quantity of the study cohort mostly varied according to the number of subjects from whom data were collected. The reason for this was that several questionnaires were administered, but did not always include the entire group. In the follow-up investigations, it also happened that patients were lost to follow-up for unknown reasons.
In general, it can be seen in Table 3 that the QoL was nearly always higher for all scores after a cochlear implant intervention. However, the dimensions and numerical ranks differed so much that the questionnaires could not be compared with each other.

3.1.3. Pediatric CI Users and Their Generic QoL

Table 4 shows the generic QoL outcomes for children and adolescents. The systematic review included three QoL questionnaires for children. For the children and adolescents, only postoperative outcomes were recorded. As with the adult population, a higher outcome of the questionnaire generally indicates a better quality of life. It was visible that there is no uniform way to measure quality of life in children. In general fewer data were available for children.

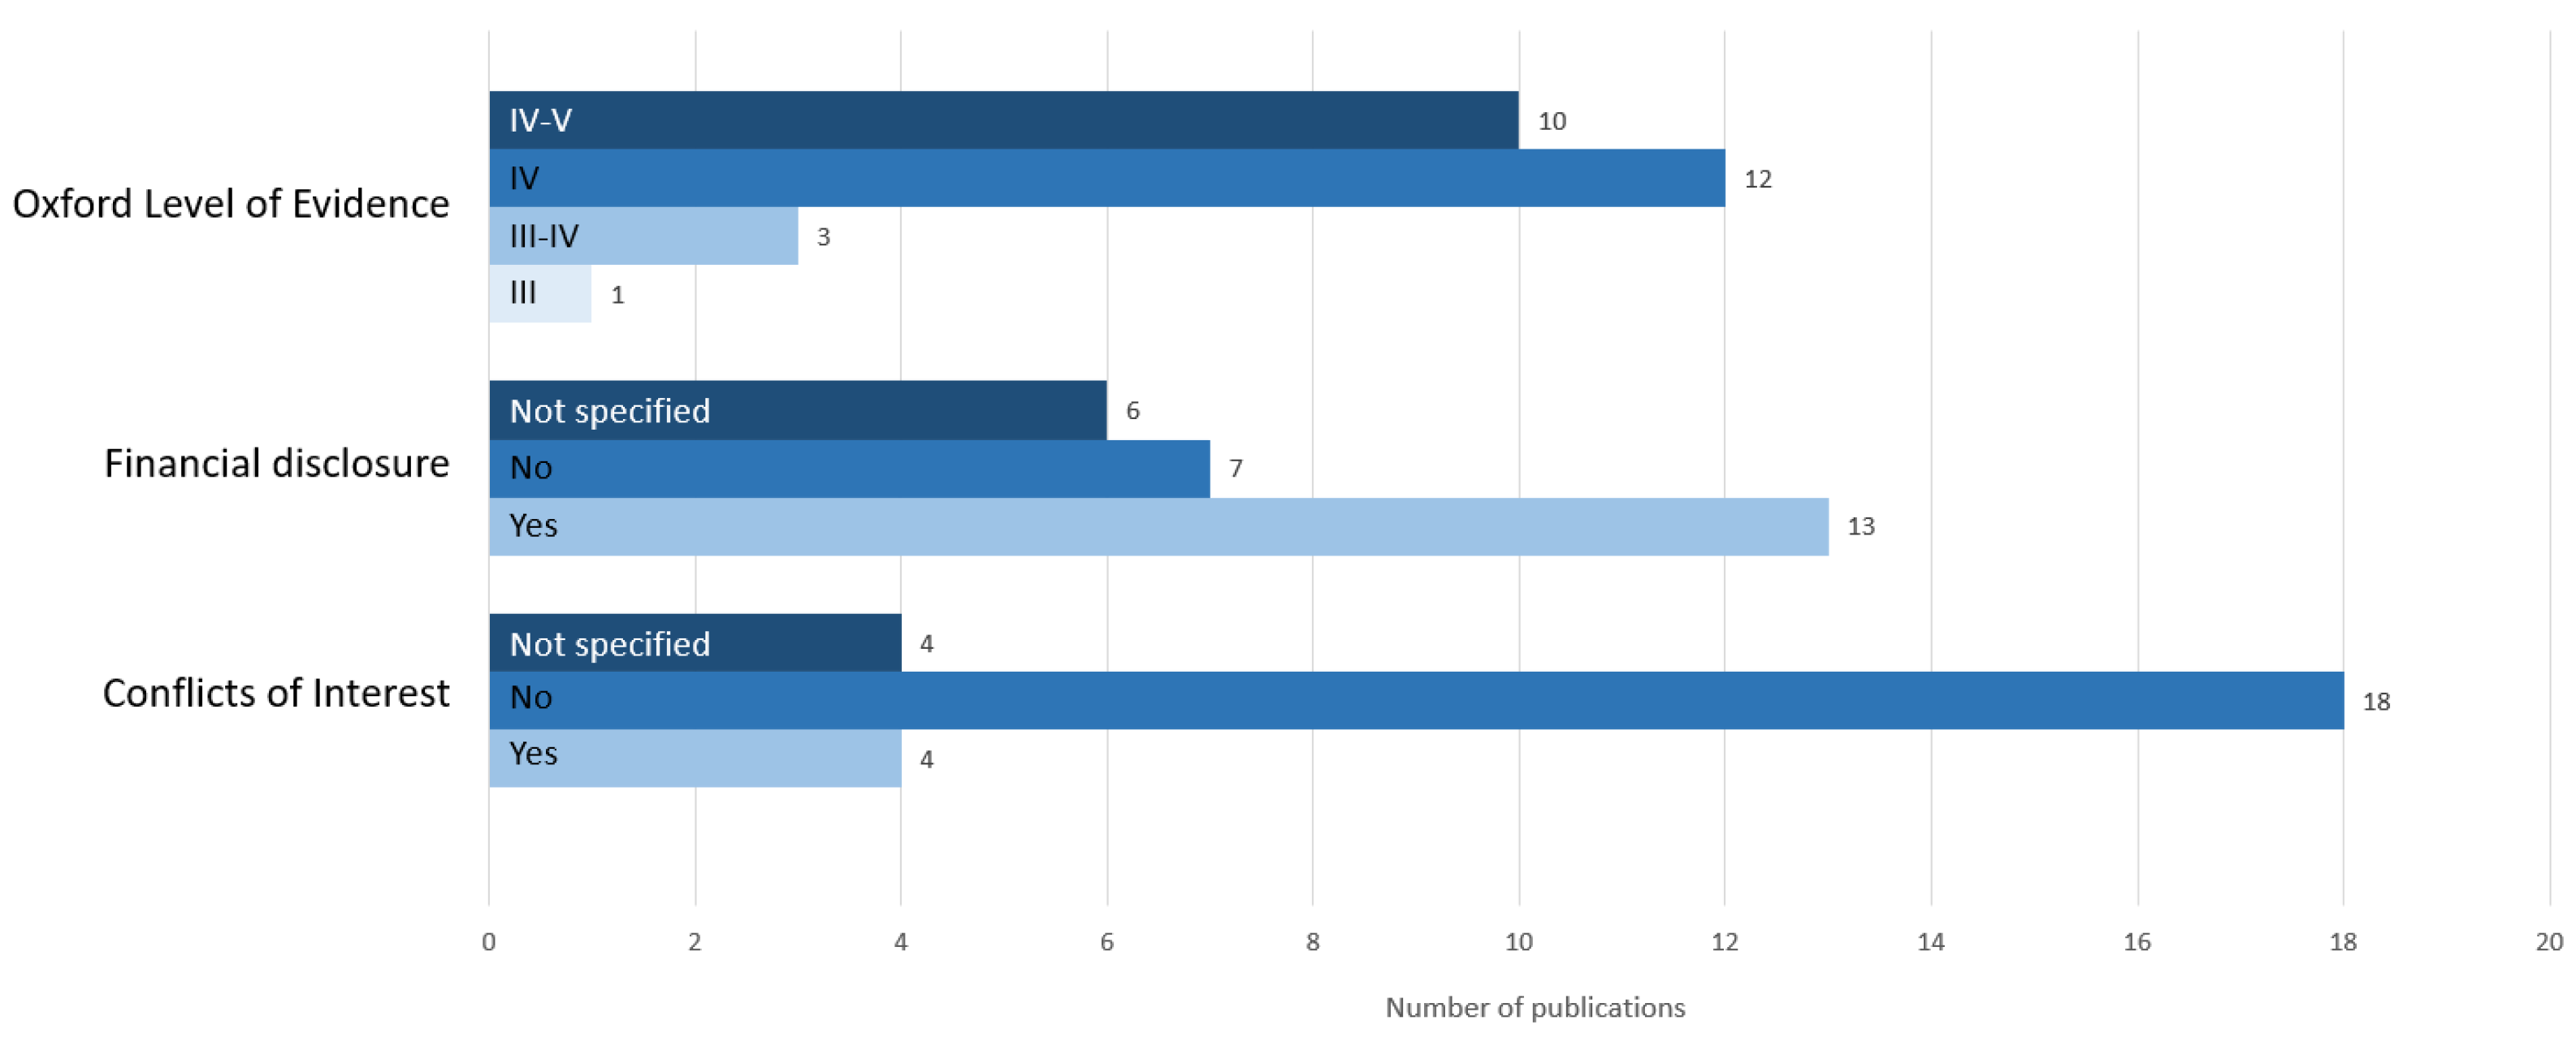
3.1.4. Quality Evaluation of Extracted Publications

To evaluate the quality of the included papers, the Oxford level of evidence was used, which ranges from level I to V, with the best rating corresponding to level I. Most papers indicated only level IV or IV–V, because they were case series or case–control studies, which can be seen in Figure 2. The prospective cross-sectional study by Issing et al. [35] achieved level III because long-term follow up evaluations with more than 30 participants, as well as comparison group data, were provided, and the outcomes were presented clearly and understandably to the reader. In addition, we investigated whether the studies had been financially supported, which was the case for 13 publications out of 26. It can also be seen in the bar chart in Figure 2 that 18 papers did not report conflicts of interest, only four did, and four did not provide this information.

3.2. Data Collection from Study Cohort in Romania

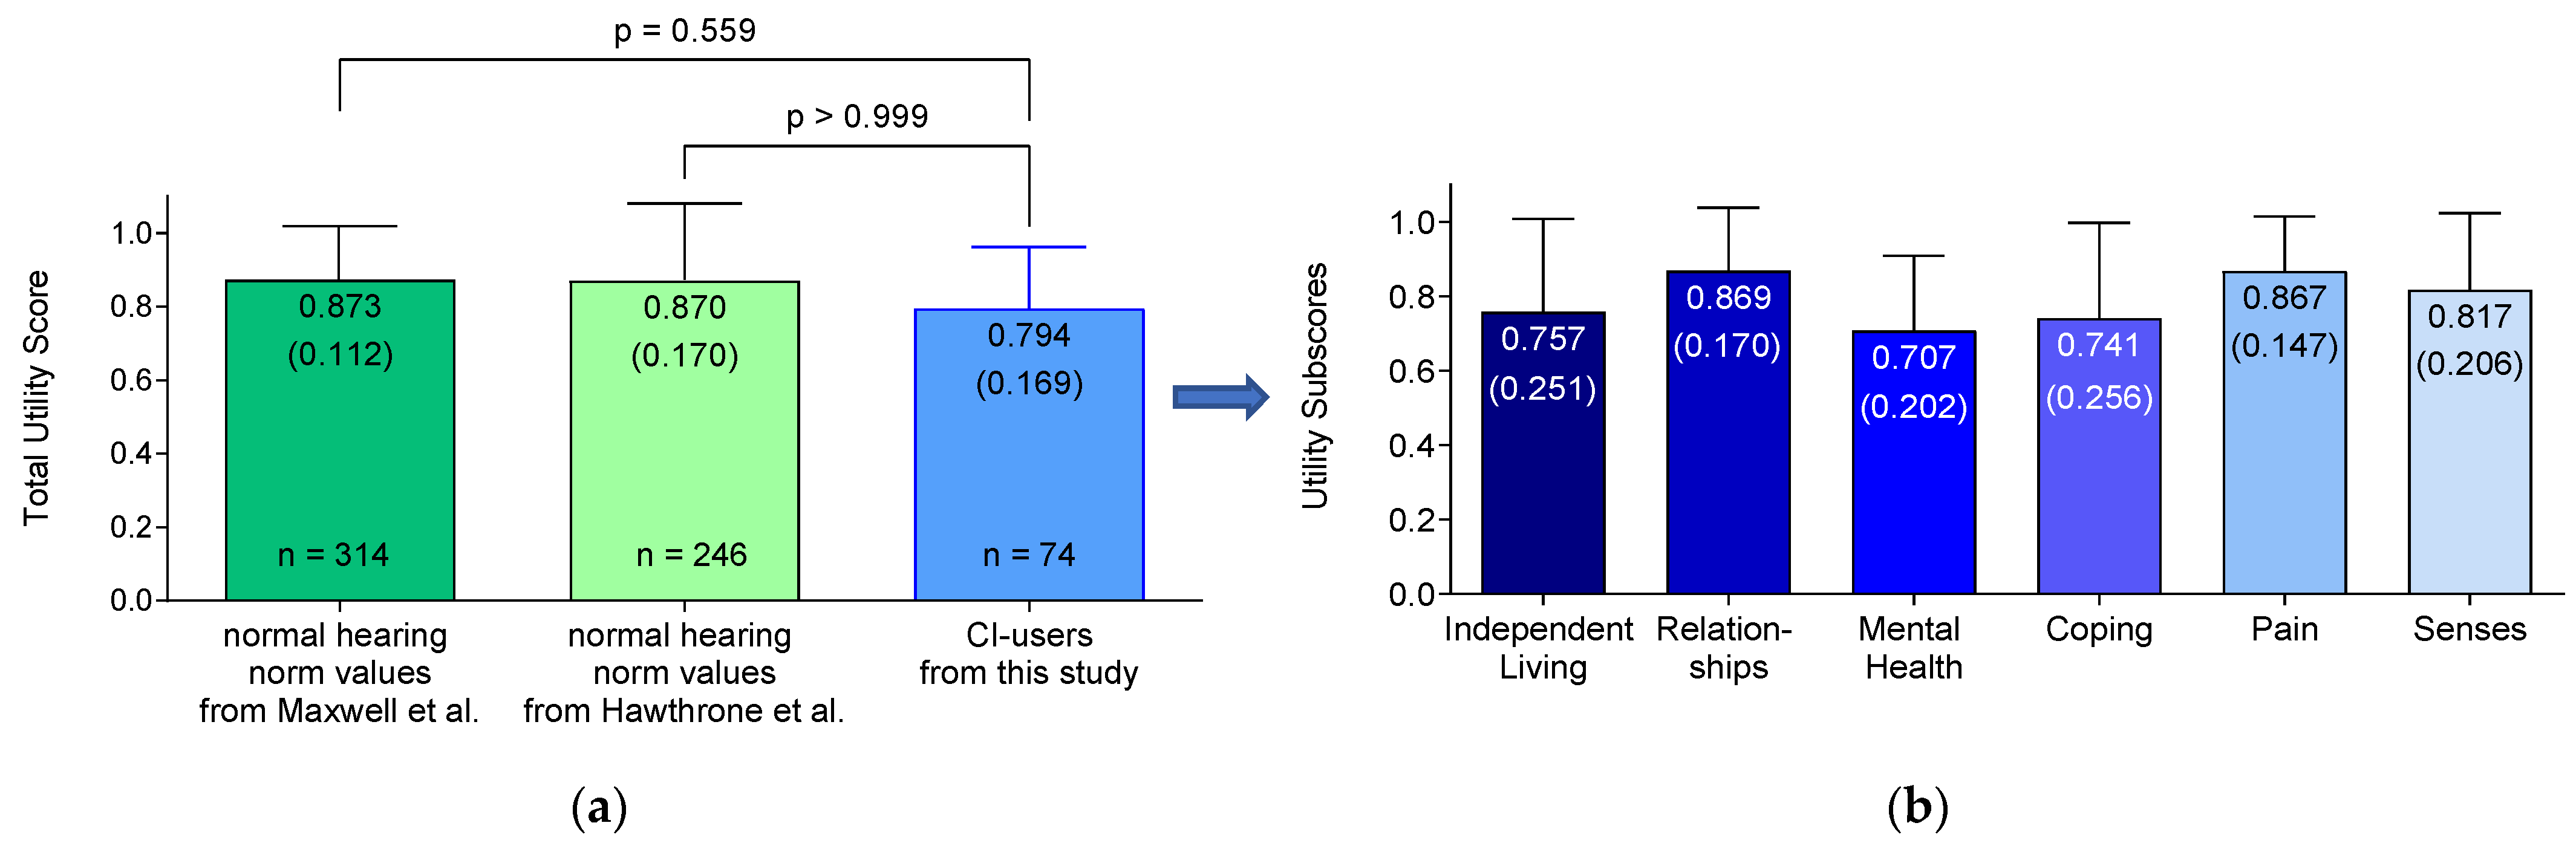
3.2.1. Assessment of Quality of Life (AQoL-6D)

Figure 3 represents the results of the total utility score and utility sub-scores of the AQol-6D questionnaire from the pediatric CI users of this study in blue. It is important to note that the blue total utility score in the left chart of Figure 3a is composed of the six dimensions of the right bar chart (b), which provides the utility sub-scores. In general, a utility score of 0 indicates no QoL, while a maximum score of 1 represents a perfect QoL. The results of the individual dimensions of the 74 participants in this study ranged in utility score from 0.71 to 0.87. In Figure 3, the highest scores were achieved in the relationships (0.87 (0.17)) and pain (0.87 (0.15)) dimensions. However, the participants had the lowest results for the sub-scores of mental health (0.71 (0.20)) and coping (0.74 (0.26)).
The total utility score of the AQoL-6D of this study was 0.79 (0.17) for the children and adolescents who had been treated with a cochlear implant, which can be seen in the blue bar in the left bar chart of Figure 3a. Furthermore, in the left bar chart in Figure 3a, norm values for the total utility scores of age- and gender-matched peers with normal hearing are presented in green. These norm values were extracted from the publication by Maxwell et al. [43] (represented as a dark green bar), as well as from the study by Hawthorne et al. [44] (represented as a light green bar). Both values from the indicated publications [43,44] were compared to the total utility score of the AQoL-6D of this study. Neither the norm values of Hawthorne et al. [44] (p = > 0.999) nor those from Maxwell et al. [43] (p = 0.559) were able to demonstrate a significant difference (p < 0.05) between the total utility score of CI users and children with normal hearing.

3.2.2. Speech Spatial Qualities of Hearing Scale (SSQ12)

The results of the SSQ12 questionnaire for 79 pediatric CI users are shown in Figure 4. The individual scores on the speech spatial qualities of hearing test are displayed. The total score is presented in blue. The results ranged from 0 to 10, with 0 corresponding to the worst result and 10 to the best. A maximum score of 10 points would indicate that there is no limitation to quality of life due to the hearing impairment. In general, the mean values in Figure 4 are represented as crosses, and the mean value of the overall score of the SSQ12 for CI users is 6.05 (1.63). The highest score of 6.43 (1.63) was achieved in the qualities of hearing section. Hence, the lowest score, 5.79 (2.19), was given for the speech category.

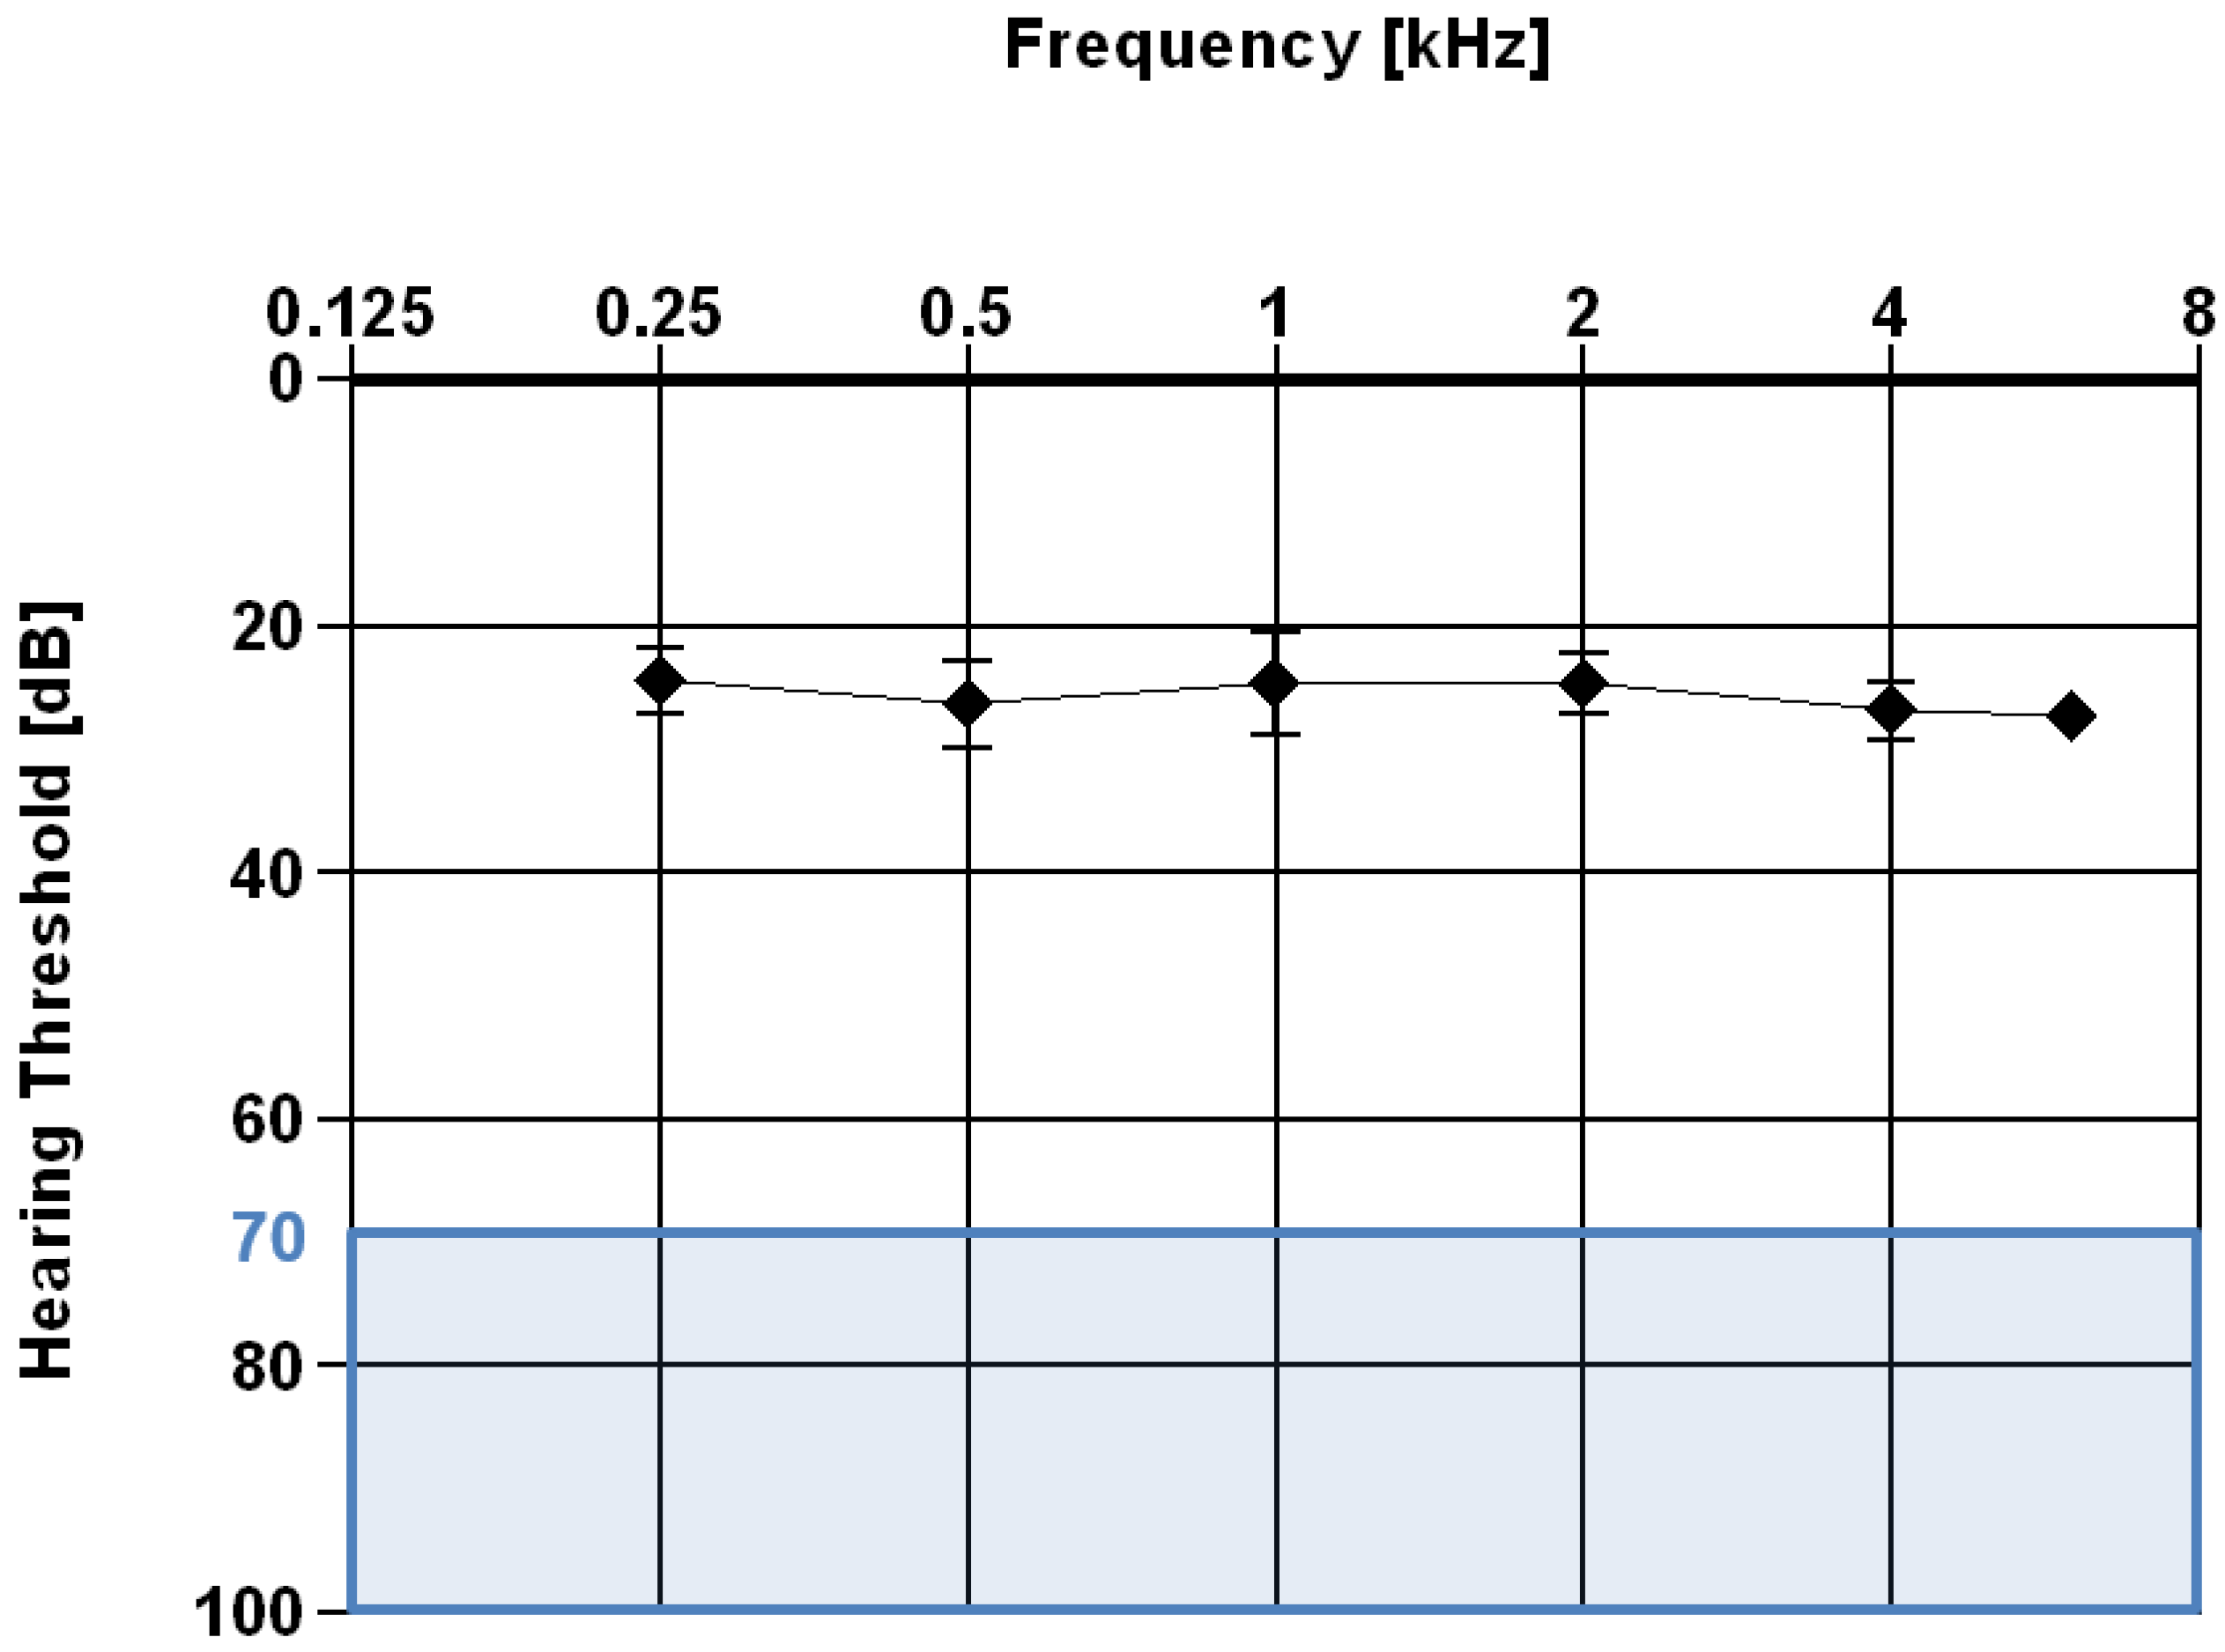
3.2.3. Pure Tone Audiometry

Pure tone audiometry refers to the total number of examined ears which were treated with a cochlear implant (Table 5). The best aided hearing level was 24.4 dB, measured at a frequency of 0.25 kHz, as shown in (Figure 5, Table 5). The hearing threshold ranged from 24.4 dB (2.62 dB), at a test frequency of 0.25 kHz, to 27.3 dB (1.52 dB) at a frequency of 6 kHz.
The blue area at the bottom of the audiogram represents the cochlear implant indication range of the manufacturer (MED-EL [45]) (Figure 5). The hearing thresholds of most CI users improved by at least 40 dB after implantation.

3.2.4. Speech Audiometry

The HSM sentence test was conducted at a self-help camp in Romania, and 41 children and adolescents with cochlear implants successfully completed the test which can be seen in Table 6. Overall, a mean score of 71.6% (23.8) was achieved by the young CI users.

3.2.5. Implantation Timepoint

The study cohort was split into early (≤3 years) and late (>3 years) implantation groups. The assessed quality of life (AQoL-6D and SSQ12) and audiological (PTA and HSM sentence test) parameters were compared with each other. No significant differences between the early and late implantation groups were found for any of the four comparative parameters (Table 7).

3.2.6. Generic and Health-Related Quality of Life

A moderate and significant correlation between the generic (AQoL-6D) and the health-specific (SSQ12) questionnaires was found, with a Spearman coefficient of 0.4370 [47]. Additionally, the relationship between the utility score of the senses dimension of the AQoL-6D compared to the SSQ12 was investigated. With a Spearman coefficient of 0.6739, a moderate and significant correlation was found (Table 8).

4. Discussion

From the generic QoL results, it can be concluded that CI users can achieve the same level of quality of life as their healthy, normal-hearing peers. After comparing the normative values from two different publication populations [43,44], no significant difference regarding the QoL was detected between normal-hearing and CI-treated children and adolescents (p < 0.05). Although the absolute numerical norm values achieved by Hawthorne et al. [44] (0.870 (0.170)) and Maxwell et al. [43] (0.873 (0.112)) were somewhat different, a multiple comparison method revealed no significant difference in utility scores compared to the outcomes of this study (0.794 (0.169)), supporting the statement that CIs increase the QoL of hearing-impaired people after treatment [4] and confirming that normal hearing standards can be achieved. A possible influence of the fact that some questionnaires were answered by or together with the parents due to the age of the child and more heterogenous outcomes, as reflected by a rather high standard deviation (SD) such as that reported by the study of Khadka et al., could not be seen in our results, which achieved a rather low SD of 0.169 [48]. The validated norm values were retrieved from age groups of 15–19 years in the publication by Hawthorne et al. [44] and 16–24 years in the study of Maxwell et al. [43].
However, the overall positive outcomes are probably the result of an increase in self-confidence bolstered by the ability to communicate [6]. As no statistical gender differences could be found, the outcomes were not split (p > 0.05).
A total of 79 participants achieved a mean overall score of 6.05(1.63) for the health/hearing-related QoL, assessed by the Speech Spatial Qualities of Hearing Scale (SSQ12), which appears to be rather low in comparison to other publications [49,50,51,52]. Emphasis needs to be placed on the rather young study cohort, in which speech might not have been as developed due to age, not due to hearing status. It is also possible that the comparative studies simply presented the results of small, top-performing groups. For example, the studies by Rauch et al. [49] and Falcon et al. [50] involved single-sided deaf patients with normal hearing on one side [53].
A moderate and significant correlation between the outcomes of the generic and health/hearing-specific QoL was detected (Table 8). Unsurprising, the AQoL-6D subdimension of senses, which deals with seeing, hearing, and communication, showed the best correlation with the SSQ12, again reflecting the importance of hearing on overall quality of life. Parameters like anxiety, feelings of seclusion, or depression, which very often accompany untreated hearing loss [2], are often evaluated, and may be eliminated via treatment.
Even though the literature on AQoL assessments in the population with hearing loss is sparse, the questionnaire was used as the assessment of choice for utilization in the clinical process. The reasons were as follows: first, access was free of charge; second, the statistical software SPSS and STATA provided easy and, therefore, bias-free evaluation tools; and third, the availability of validated population norms enabled statistical comparisons. The provided data calculation syntax for STATA and SPSS ensures correct data analysis and, therefore, better comparability. Thus, no random deviations or obvious calculation errors occurred, as was found in the published outcomes of several HUI 3 questionnaire studies. The HUI was often evaluated incorrectly, which unfortunately made the results unusable for our systematic review and comparisons, especially since a license fee was required to for this questionnaire.
During the review process of the different QoL studies, it became evident that a consensus on the application of QoL instruments would be advisable.
Unfortunately, not enough comparable data were available to perform a meta-analysis (Table 3 and Table 4) [1,15,16,22,23,24,25,26,27,28,29,30,31,32,33,34,35,36,37,38,39,40,41,42,54,55]. Although no age group was excluded from the literature review, it is apparent that there is limited data available regarding QoL surveys on children [1,38,39,40,41,42]. This was one of the reasons why this study focused on collecting data from children and adolescents.
In conclusion, the systematic literature review clearly showed improved QoL after implantation, comparable to that of healthy, normal-hearing children, but also showed some clear limitations: first, a clear classification of health-related and generic QoL questionnaires is necessary. Second, uniform and correct assessments are needed in order for comparisons to be made. Third, more day-to-day evidence is required, which points towards the necessity to implement QoL questionnaires into clinical routines. More data on the QoL of the pediatric population are especially required.
The 41 tested CI users achieved impressive speech comprehension, with an overall score of 71.6% (23.8%) on the HSM sentence test (Table 6). The rather high standard deviation might be because of overly complex sentences or words, even though the HSM test includes everyday phrases in order to eliminate this possible bias. Another possibility might be the concentration level or the unfamiliar environment, or that the children were simply too shy to repeat the words [56].
The tested CI users showed an improvement of around 40 dB with the use of a cochlear implant, as the mean aided hearing threshold was between 24.4 dB (2.62 dB) and 27.3 dB (1.52 dB).
The literature repeatedly points out the importance of early implantation to ensure the optimal developmental effects [57,58,59]. Our study group outcomes were split into early- and late-implanted children (Table 7). Children under 3 years of age at the time of implantation were considered to fall into the early implantation group, and the rest comprised the late implantation group. Despite the outcomes not being significantly different, the early implantation group performed about 10% better than the comparison group on the HSM sentence test.
In conclusion, both age groups achieved generally good results for all measurements which were undertaken. These great results are probably related to the support of the families and their social environments. This assumption is based on the fact that all examinations, as well as rehabilitation and training (in the camp as well as in the hospital in Timisoara), were voluntary, and the parents went above and beyond to provide their children with all the opportunities necessary to further improve their hearing. Obviously, they were doing everything right.

5. Conclusions

Studies investigating the effect of a CI on different aspects of QOL and audiologic performance are important in order to provide realistic expectations to our patients, especially when children are involved. This study has proven that cochlear implant users can achieve the same generic quality of life as their normal-hearing peers. The audiological examinations showed a clear benefit after cochlear implantation. Since speech comprehension is challenging, the good outcomes achieved on the HSM sentence test by the CI users in Romania were impressive. Even though no significant difference was found between late and early implantation, for the QoL and audiological parameters examined, the early implantation group exhibited roughly 10% greater speech understanding compared to the later implantation cohort. No significant correlation between the generic and health-related quality of life questionnaires was found. Thus, both should be administered to obtain a better understanding of children and adolescents treated with cochlear implants and their hearing/health, as well as their general satisfaction in life.

Author Contributions

Conceptualization, H.E.S.; methodology, H.E.S. and G.G.; validation, G.G., D.E.T. and H.E.S.; formal analysis, G.G.; investigation, G.G. and D.E.T.; resources, G.G. and D.E.T.; data curation, G.G. and D.E.T.; writing—original draft preparation, G.G.; writing—review and editing, all authors; visualization, G.G.; supervision, H.E.S. All authors have read and agreed to the published version of the manuscript.

Funding

This research received no external funding.

Informed Consent Statement

Informed consent was obtained from all parents and legal guardians of the subjects involved in the study.

Conflicts of Interest

The authors declare no conflict of interest.

References

  1. Alnuhayer, O.; Alshawi, Y.; Julaidan, B.; Alromaih, N.; Alakeel, N.; Alballaa, A. Quality of Life and Cochlear Implant: Results in Saudi Children. Cureus 2020, 12, e11968. [Google Scholar] [CrossRef] [PubMed]
  2. World Health Organization. World Report on Hearing; World Health Organization: Geneva, Switzerland, 2021; ISBN 978-92-4-002048-1. [Google Scholar]
  3. World Health Organization. Deafness and Hearing Loss. Available online: https://www.who.int/news-room/fact-sheets/detail/deafness-and-hearing-loss (accessed on 29 August 2022).
  4. Lee, Y.; Sim, H. Bilateral Cochlear Implantation versus Unilateral Cochlear Implantation in Deaf Children: Effects of Sentence Context and Listening Conditions on Recognition of Spoken Words in Sentences. Int. J. Pediatr. Otorhinolaryngol. 2020, 137, 110237. [Google Scholar] [CrossRef] [PubMed]
  5. Zeng, F.-G. Celebrating the One Millionth Cochlear Implant. JASA Express Lett. 2022, 2, 077201. [Google Scholar] [CrossRef] [PubMed]
  6. Hirschfelder, A.; Gräbel, S.; Olze, H. The impact of cochlear implantation on quality of life. The role of audiologic performance and variables. Otolaryngol. Head Neck Surg. 2008, 138, 357–362. [Google Scholar] [CrossRef] [PubMed]
  7. Gatehouse, S.; Noble, W. The Speech, Spatial and Qualities of Hearing Scale (SSQ). Int. J. Audiol. 2004, 43, 85–99. [Google Scholar] [CrossRef]
  8. Bess, F.H.; Humes, L. Audiology: The Fundamentals, 4th ed.; Lippincott Williams & Wilkins: Philadelphia, PA, USA, 2008; ISBN 978-0-7817-6643-2. [Google Scholar]
  9. Hochmair-Desoyer, I.; Schulz, E.; Moser, L.; Schmidt, M. The HSM Sentence Test as a Tool for Evaluating the Speech Understanding in Noise of Cochlear Implant Users. Am. J. Otol. 1997, 18, S83. [Google Scholar]
  10. Haraldstad, K.; Wahl, A.; Andenæs, R.; Andersen, J.R.; Andersen, M.H.; Beisland, E.; Borge, C.R.; Engebretsen, E.; Eisemann, M.; Halvorsrud, L.; et al. A Systematic Review of Quality of Life Research in Medicine and Health Sciences. Qual. Life Res. 2019, 28, 2641–2650. [Google Scholar] [CrossRef]
  11. Real Life Gains: The Importance of Quality of Life|ExpertsONLINE. 2022. Available online: https://www.youtube.com/watch?v=hQMgpqxWfww&t=2s (accessed on 2 July 2023).
  12. Page, M.J.; McKenzie, J.E.; Bossuyt, P.M.; Boutron, I.; Hoffmann, T.C.; Mulrow, C.D.; Shamseer, L.; Tetzlaff, J.M.; Akl, E.A.; Brennan, S.E.; et al. The PRISMA 2020 Statement: An Updated Guideline for Reporting Systematic Reviews. BMJ 2021, 372, n71. [Google Scholar] [CrossRef]
  13. Ball, C.; Phillips, R.; Guyatt, G. OCEBM Levels of Evidence—Centre for Evidence-Based Medicine (CEBM). Available online: https://www.cebm.ox.ac.uk/resources/levels-of-evidence/ocebm-levels-of-evidence (accessed on 24 August 2022).
  14. Iezzi, A. Homepage of the Assessment of Quality of Life. Available online: https://www.aqol.com.au/ (accessed on 17 August 2022).
  15. Rostkowska, J.; Skarzynski, P.H.; Kobosko, J.; Gos, E.; Skarzynski, H. Health-Related Quality of Life in Adults with Profound Postlingual Hearing Loss before and after Cochlear Implantation. Eur. Arch. Otorhinolaryngol. 2021, 278, 3393–3399. [Google Scholar] [CrossRef]
  16. Sarant, J.; Harris, D.; Busby, P.; Maruff, P.; Schembri, A.; Dowell, R.; Briggs, R. The Effect of Cochlear Implants on Cognitive Function in Older Adults: Initial Baseline and 18-Month Follow Up Results for a Prospective International Longitudinal Study. Front. Neurosci. 2019, 13, 789. [Google Scholar] [CrossRef]
  17. Noble, W.; Jensen, N.S.; Naylor, G.; Bhullar, N.; Akeroyd, M.A. A Short Form of the Speech, Spatial and Qualities of Hearing Scale Suitable for Clinical Use: The SSQ12. Int. J. Audiol. 2013, 52, 409–412. [Google Scholar] [CrossRef] [PubMed]
  18. ASHA. Sound Field Measurement Tutorial. Available online: https://www.asha.org/policy/rp1991-00025/ (accessed on 1 March 2023).
  19. Gates, G.; Hoffman, H. What the Numbers Mean: An Epidemiological Perspective on Hearing. Available online: https://www.nidcd.nih.gov/health/statistics/what-numbers-mean-epidemiological-perspective-hearing (accessed on 27 February 2023).
  20. Herzog, M.; Schön, F.; Müller, J.; Knaus, C.; Scholtz, L.; Helms, J. Langzeitergebnisse nach Cochlear-Implant-Versorgung älterer Patienten. Laryngorhinootologie 2003, 82, 490–493. [Google Scholar] [CrossRef] [PubMed]
  21. Louw, C.; Swanepoel, D.W.; Eikelboom, R.H. Self-Reported Hearing Loss and Pure Tone Audiometry for Screening in Primary Health Care Clinics. J. Prim. Care Commun. Health 2018, 9, 2150132718803156. [Google Scholar] [CrossRef]
  22. Anzivino, R.; Conti, G.; Di Nardo, W.; Fetoni, A.R.; Picciotti, P.M.; Marra, C.; Guglielmi, V.; Fortunato, S.; Forli, F.; Paludetti, G.; et al. Prospective Evaluation of Cognitive Functions After Rehabilitation with Cochlear Implant or Hearing Aids: Preliminary Results of a Multicentric Study on Elderly Patients. Am. J. Audiol. 2019, 28, 762–774. [Google Scholar] [CrossRef] [PubMed]
  23. Calvino, M.; Sánchez-Cuadrado, I.; Gavilán, J.; Gutiérrez-Revilla, M.A.; Polo, R.; Lassaletta, L. Effect of Cochlear Implantation on Cognitive Decline and Quality of Life in Younger and Older Adults with Severe-to-Profound Hearing Loss. Eur. Arch. Otorhinolaryngol. 2022, 279, 4745–4759. [Google Scholar] [CrossRef]
  24. Hey, M.; Wesarg, T.; Mewes, A.; Helbig, S.; Hornung, J.; Lenarz, T.; Briggs, R.; Marx, M.; Ramos, A.; Stöver, T.; et al. Objective, Audiological and Quality of Life Measures with the CI532 Slim Modiolar Electrode. Cochlear Implant. Int. 2019, 20, 80–90. [Google Scholar] [CrossRef]
  25. Sivonen, V.; Sinkkonen, S.T.; Willberg, T.; Lamminmäki, S.; Jääskelä-Saari, H.; Aarnisalo, A.A.; Dietz, A. Improvements in Hearing and in Quality of Life after Sequential Bilateral Cochlear Implantation in a Consecutive Sample of Adult Patients with Severe-to-Profound Hearing Loss. J. Clin. Med. 2021, 10, 2394. [Google Scholar] [CrossRef]
  26. Sorrentino, T.; Donati, G.; Nassif, N.; Pasini, S.; Redaelli de Zinis, L.O. Cognitive Function and Quality of Life in Older Adult Patients with Cochlear Implants. Int. J. Audiol. 2020, 59, 316–322. [Google Scholar] [CrossRef]
  27. Tang, L.; Thompson, C.B.; Clark, J.H.; Ceh, K.M.; Yeagle, J.D.; Francis, H.W. Rehabilitation and Psychosocial Determinants of Cochlear Implant Outcomes in Older Adults. Ear Hear. 2017, 38, 663–671. [Google Scholar] [CrossRef]
  28. Forli, F.; Lazzerini, F.; Fortunato, S.; Bruschini, L.; Berrettini, S. Cochlear Implant in the Elderly: Results in Terms of Speech Perception and Quality of Life. Audiol. Neurootol. 2019, 24, 77–83. [Google Scholar] [CrossRef]
  29. Peters, J.P.M.; van Heteren, J.A.A.; Wendrich, A.W.; van Zanten, G.A.; Grolman, W.; Stokroos, R.J.; Smit, A.L. Short-Term Outcomes of Cochlear Implantation for Single-Sided Deafness Compared to Bone Conduction Devices and Contralateral Routing of Sound Hearing Aids-Results of a Randomised Controlled Trial (CINGLE-Trial). PLoS ONE 2021, 16, e0257447. [Google Scholar] [CrossRef]
  30. Chen, S.L.; Chan, K.C.; Hu, C.Y.; Fang, H.Y.; Wu, C.M. Experience of Adult Cochlear Implantation at a Tertiary Hospital. J. Chin. Med. Assoc. 2022, 85, 469–477. [Google Scholar] [CrossRef] [PubMed]
  31. Peter, N.; Kleinjung, T.; Probst, R.; Hemsley, C.; Veraguth, D.; Huber, A.; Caversaccio, M.; Kompis, M.; Mantokoudis, G.; Senn, P.; et al. Cochlear Implants in Single-Sided Deafness—Clinical Results of a Swiss Multicentre Study. Swiss Med. Wkly. 2019, 149, w20171. [Google Scholar] [CrossRef] [PubMed]
  32. Saraç, E.T.; Batuk, M.O.; Sennaroglu, G. Evaluation of the Quality of Life in Adults with Cochlear Implants: As Good as the Healthy Adults? Am. J. Otolaryngol. 2019, 40, 720–723. [Google Scholar] [CrossRef] [PubMed]
  33. Sousa, A.F.; Couto, M.I.V.; Martinho-Carvalho, A.C. Quality of Life and Cochlear Implant: Results in Adults with Postlingual Hearing Loss. Braz. J. Otorhinolaryngol. 2018, 84, 494–499. [Google Scholar] [CrossRef]
  34. Issing, C.; Baumann, U.; Pantel, J.; Stöver, T. Cochlear Implant Therapy Improves the Quality of Life in Older Patients—A Prospective Evaluation Study. Otol. Neurotol. 2020, 41, 1214–1221. [Google Scholar] [CrossRef]
  35. Issing, C.; Holtz, S.; Loth, A.G.; Baumann, U.; Pantel, J.; Stöver, T. Long-Term Effects on the Quality of Life Following Cochlear Implant Treatment in Older Patients. Eur. Arch. Otorhinolaryngol. 2022, 279, 5135–5144. [Google Scholar] [CrossRef]
  36. Völter, C.; Götze, L.; Dazert, S.; Falkenstein, M.; Thomas, J.P. Can Cochlear Implantation Improve Neurocognition in the Aging Population? Clin. Interv. Aging 2018, 13, 701–712. [Google Scholar] [CrossRef]
  37. Forli, F.; Turchetti, G.; Giuntini, G.; Bellelli, S.; Fortunato, S.; Bruschini, L.; Barillari, M.R.; Berrettini, S. Cochlear Implant in Prelingually Deafened Oralist Adults: Speech Perception Outcomes, Subjective Benefits and Quality of Life Improvement. Acta Otorhinolaryngol. Ital. 2017, 37, 416–422. [Google Scholar] [CrossRef]
  38. Piromchai, P.; Tanamai, N.; Kiatthanabumrung, S.; Kaewsiri, S.; Thongyai, K.; Atchariyasathian, V.; Thanawirattananit, P.; Wacharasindhu, C.; Mukkun, T.; Isipradit, P.; et al. Multicentre Cohort Study of Cochlear Implantation Outcomes in Thailand. BMJ Open 2021, 11, e054041. [Google Scholar] [CrossRef]
  39. Hendriksma, M.; Bruijnzeel, H.; Bezdjian, A.; Kay-Rivest, E.; Daniel, S.J.; Topsakal, V. Quality of Life (QoL) Evaluation of Children Using Cochlear Implants: Agreement between Pediatric and Parent Proxy-QoL Reports. Cochlear Implant. Int. 2020, 21, 338–343. [Google Scholar] [CrossRef] [PubMed]
  40. Aldriweesh, B.; Alharbi, M.; Alzahrani, M. Correlation of Quality of Life with Speech and Hearing Performance after Pediatric Cochlear Implantation. Int. J. Pediatr. Otorhinolaryngol. 2021, 150, 110889. [Google Scholar] [CrossRef] [PubMed]
  41. Dev, A.N.; Nahas, G.; Pappas, A.; Ambrose, T.; Craun, P.; Fustos, E.; Reilly, B.K.; Preciado, D. Underinsurance in Children Is Associated with Worsened Quality of Life after Cochlear Implantation. Int. J. Pediatr. Otorhinolaryngol. 2022, 157, 111119. [Google Scholar] [CrossRef]
  42. Vermi Sli Peker, S.; Demi, R.K.F.; Cukurova, I. Quality of Life and Parental Care Burden in Cochlear Implanted Children: A Case-Control Study. Int. J. Pediatr. Otorhinolaryngol. 2020, 136, 110164. [Google Scholar] [CrossRef] [PubMed]
  43. Maxwell, A.; Özmen, M.; Iezzi, A.; Richardson, J. Deriving Population Norms for the AQoL-6D and AQoL-8D Multi-Attribute Utility Instruments from Web-Based Data. Qual. Life Res. 2016, 25, 3209–3219. [Google Scholar] [CrossRef] [PubMed]
  44. Hawthorne, G.; Osborne, R. Population Norms and Meaningful Differences for the Assessment of Quality of Life (AQoL) Measure. Aust. N. Z. J. Public. Health 2005, 29, 136–142. [Google Scholar] [CrossRef] [PubMed]
  45. MED-EL. Medical Electronics Indications—MED-EL Pro. Available online: https://www.medel.pro/indications (accessed on 16 April 2023).
  46. Clark, J.G. Degree of Hearing Loss. Available online: https://www.asha.org/public/hearing/degree-of-hearing-loss/ (accessed on 9 August 2022).
  47. Schober, P.; Boer, C.; Schwarte, L.A. Correlation Coefficients: Appropriate Use and Interpretation. Anesth. Analg. 2018, 126, 1763. [Google Scholar] [CrossRef] [PubMed]
  48. Khadka, J.; Kwon, J.; Petrou, S.; Lancsar, E.; Ratcliffe, J. Mind the (Inter-Rater) Gap. An Investigation of Self-Reported versus Proxy-Reported Assessments in the Derivation of Childhood Utility Values for Economic Evaluation: A Systematic Review. Soc. Sci. Med. 2019, 240, 112543. [Google Scholar] [CrossRef]
  49. Rauch, A.-K.; Arndt, S.; Aschendorff, A.; Beck, R.; Speck, I.; Ketterer, M.C.; Jakob, T.F.; Hassepass, F. Long-Term Results of Cochlear Implantation in Children with Congenital Single-Sided Deafness. Eur. Arch. Otorhinolaryngol. 2021, 278, 3245–3255. [Google Scholar] [CrossRef]
  50. Falcón Benítez, N.; Falcón González, J.C.; Ramos Macías, Á.; Borkoski Barreiro, S.; Ramos de Miguel, Á. Cochlear Implants in Single-Sided Deafness. Comparison Between Children and Adult Populations with Post-Lingually Acquired Severe to Profound Hearing Loss. Front. Neurol. 2021, 12, 760831. [Google Scholar] [CrossRef]
  51. Beijen, J.-W.; Snik, A.F.M.; Mylanus, E.A.M. Sound Localization Ability of Young Children with Bilateral Cochlear Implants. Otol. Neurotol. 2007, 28, 479. [Google Scholar] [CrossRef] [PubMed]
  52. Galvin, K.L.; Hughes, K.C.; Mok, M. Can Adolescents and Young Adults with Prelingual Hearing Loss Benefit from a Second, Sequential Cochlear Implant? Int. J. Audiol. 2010, 49, 368–377. [Google Scholar] [CrossRef] [PubMed]
  53. Cleveland Clinic. Medical Professional Unilateral Hearing Loss (Single-Sided Deafness): Symptoms & Management. Available online: https://my.clevelandclinic.org/health/diseases/21625-unilateral-hearing-loss-single-sided-deafness (accessed on 12 April 2023).
  54. Wick, C.C.; Kallogjeri, D.; McJunkin, J.L.; Durakovic, N.; Holden, L.K.; Herzog, J.A.; Firszt, J.B.; Buchman, C.A. Hearing and Quality-of-Life Outcomes After Cochlear Implantation in Adult Hearing Aid Users 65 Years or Older: A Secondary Analysis of a Nonrandomized Clinical Trial. JAMA Otolaryngol. Head Neck Surg. 2020, 146, 925–932. [Google Scholar] [CrossRef] [PubMed]
  55. Marx, M.; Mosnier, I.; Venail, F.; Mondain, M.; Uziel, A.; Bakhos, D.; Lescanne, E.; N’Guyen, Y.; Bernardeschi, D.; Sterkers, O.; et al. Cochlear Implantation and Other Treatments in Single-Sided Deafness and Asymmetric Hearing Loss: Results of a National Multicenter Study Including a Randomized Controlled Trial. Audiol. Neurootol. 2021, 26, 414–424. [Google Scholar] [CrossRef] [PubMed]
  56. Moschner, D.B. Forschen mit Jungen Kindern—Eine Herausforderung; Universität Oldenburg: Oldenburg, Germany, 2012. [Google Scholar]
  57. Tajudeen, B.A.; Waltzman, S.B.; Jethanamest, D.; Svirsky, M.A. Speech Perception in Congenitally Deaf Children Receiving Cochlear Implants in the First Year of Life. Otol. Neurotol. 2010, 31, 1254–1260. [Google Scholar] [CrossRef] [PubMed]
  58. Colletti, L.; Mandalà, M.; Zoccante, L.; Shannon, R.V.; Colletti, V. Infants versus Older Children Fitted with Cochlear Implants: Performance over 10 Years. Int. J. Pediatr. Otorhinolaryngol. 2011, 75, 504–509. [Google Scholar] [CrossRef] [PubMed]
  59. Naik, A.N.; Varadarajan, V.V.; Malhotra, P.S. Early Pediatric Cochlear Implantation: An Update. Laryngoscope Investig. Otolaryngol. 2021, 6, 512–521. [Google Scholar] [CrossRef]
Figure 1. Flow diagram of the study selection process according to the PRISMA guidelines [12] (search conducted on 05.07.2022). QoL = quality of life.
Jpm 13 01610 g001
Figure 2. Quality evaluation of the included publications of the systematic review according to the Oxford level of evidence [13]. Additional representation of financial support and possible conflicts of interest.
Jpm 13 01610 g002
Figure 3. Graphical representation of the total utility score ((a), blue bar) and the utility sub-scores (b) on the assessment of quality of life questionnaire, which included six dimensions (AQoL-6D), for cochlear implant (CI)treated children (n = 74) of this study An additional comparison with the total utility scores on the AQoL-6D using norm values of peers of the same age and gender with normal hearing is also shown, obtained from the studies of Maxwell et al. [43] ((a), dark green) and Hawthorne et al. [44] ((a), light green). Significance level: p < 0.05. The mean values and corresponding standard deviations in parentheses are displayed in the bars. The scores range from the worst score of 0, indicating no quality of life (QoL), to the maximum score of 1, indicating a perfect generic QoL.
Jpm 13 01610 g003
Figure 4. Boxplot presentation of the Speech Spatial Qualities of Hearing Scale questionnaire (SSQ12) outcomes from 79 cochlear implant users. Median and quartiles for the sub-scores and the overall score (blue) are presented. An additional representation of the mean values are shown as crosses inside the boxplots and as numerical values above the boxplots, with their standard deviations in parentheses. The score, in general, ranges from a worst possible score of 0 to an optimal score of 10. A maximum score of 10 represents no limitations on quality of life due to hearing impairment.
Jpm 13 01610 g004
Figure 5. Audiogram with averaged hearing thresholds and standard deviations of the children and adolescents with cochlear implants (CI). For each frequency, data from at least 40 CI users were considered, but the exact numbers of participants are noted in Table 5. The blue area shows the CI indication range based on the manufacturer’s recommendation [45].
Jpm 13 01610 g005
Table 1. Search terms and hits for the literature search in the PubMed database.
Search StepsSearch TermsHits
1((Quality of Life) AND (cochlea * implant *))903
2Limit NOT (Health Related Quality of Life)903
3Filter: last five years for recent data (from 05/07/2017 to 05/07/2022)386
Table 2. Inclusion and exclusion criteria for literature screening.
Inclusion Criteria
PopulationSubjects of any age, gender, or ethnicity with any hearing loss or single-sided deafness (SSD), as well as and their legal representatives
Intervention/treatmentCochlear implantation
ComparatorNot applicable
OutcomesGeneric quality of life scores
Study designAll studies with original data, including case series, case–control, and longitudinal studies. Systematic reviews without original data, as well as acknowledgements, recommendations, or general topic descriptions were excluded.
Exclusion Criteria
Different device or treatment
Not a clinical study in humans
Other type of hearing loss (not SNHL, MHL, or SSD)
Topic not related to hearing loss or its treatment
Publication lacking sufficient information for evaluation
Overlap of data
Table 3. Extracted data regarding the systematic review for adults. All questionnaires refer to the generic quality of life of cochlear implant users before and after the intervention. If more than one publication is indicated, the values correspond to the mean value of these studies and their standard deviation (SD), unless otherwise stated. If medians and ranges are specified, they are listed separately. Darker blue fields represent total scores and lighter green or blue fields highlight the subcategories of the SF-36.
RangeCategoryEvaluation TimeMean ScoreSDMedianRangen Specific Test forAge Mean [years]Age SD [years]n Whole Study Cohortn Publications IncludedPublications
Mean ValuesMedian Values
1. GBI (=Glasgow Benefit Inventory)
−100 to +100TotalPostoperative39.69.99--240-56.411.62806Anzivino et al., 2019 [22]
Calvino et al., 2022 [23]
Hey et al., 2019 [24]
Sivonen et al., 2021 [25]
Sorrentino et al., 2020 [26]
Tang et al., 2017 [27]
General51.1914.402510.8–33.333222757.011.23917Calvino et al., 2022 [23]
Forli et al., 2019 [28]
Hey et al., 2019 [24]
Peters et al., 2021 [29]
Sivonen et al., 2021 [25]
Sorrentino et al., 2020 [26]
Tang et al., 2017 [27]
Social28.6511.8600–8.33
Physical13.7017.7900–0
Totalpostoperative
short term
(<12 months)
38.009.80--67 63.62.9702Anzivino et al., 2019 [22]
Hey et al., 2019 [24]
General38.8027.702510.8–33.33422757.03.8742Hey et al., 2019 [24]
Peters et al., 2021 [29]
Social10.5029.7000–8.33
Physical3.2015.7000–0
Totalpostoperative long term
(≥12 months)
40.0610.00--173-54.012.42104Calvino et al., 2022 [23]
Sivonen et al., 2021 [25]
Sorrentino et al., 2020 [26]
Tang et al., 2017 [27]
General52.4314.5428057.012.33175Calvino et al., 2022 [23]
Forli et al., 2019 [28]
Sivonen et al., 2021 [25]
Sorrentino et al., 2020 [26]
Tang et al., 2017 [27]
Social30.4610.88
Physical14.7518.33
2. WHOQOL (=World Health Organisation, Quality of Life)
WHOQOL-BREF (short form)
0–100TotalPostoperative66.0011.75--97-44.43.6974Chen et al., 2022 [30]
Peter et al., 2019 [31]
Saraç et al., 2019 [32]
Sousa et al., 2018 [33]
Environment59.704.60
Social realitionships59.177.93
Physical health63.506.82
Psychosocial health61.4010.09
WHOQOL-OLD (for old age)
0–100TotalPreoperative60.0015.70--34-73.54.9341Issing et al., 2020 [34]
Sensory Abilities38.1022.60
Autonomy63.2017.60
Past, Present, Future Activities66.2018.00
Social Participation61.4021.00
Death and Dying61.9030.00
Intimacy69.3020.20
TotalPostoperative69.043.41--151-71.54.11783Issing et al., 2020 [34]
Issing et al., 2022 [35]
Völter et al., 2018 [36]
Sensory Abilities55.181.65--118-74.40.91182Issing et al., 2020 [34]
Issing et al., 2022 [35]
Autonomy69.803.36
Past, Present, Future Activities71.633.00
Social Participation68.902.49
Death and Dying65.535.69
Intimacy73.731.39
3. SF-36 (=Short Form Health Survey with 36 items)
0–100Physical healthPreoperative61.5113.21--55-56.210.2552Anzivino et al., 2019 [22]
Chen et al., 2022 [30]
Mental health55.052.06
Physical Functioning--57.2055.1–57.2-30median:
35
range:
16–54
301Forli et al., 2017 [37]
Role-Physical56.2049.2–56.2
Body Pain62.8047.3–62.8
General Health57.9050.9–61.7
Vitality53.8046.7–60.9
Social Functioning46.3035.4–57.2
Role-Emotional55.3044.8–55.3
Mental Health45.9039.1–55.0
Physical healthPostoperative69.209.30--55-56.210.2552Anzivino et al., 2019 [22]
Chen et al., 2022 [30]
Mental health66.435.37
Physical Functioning--57.2055.1–57.2-30median:
35
range:
16–54
301Forli et al., 2017 [37]
Role-Physical56.2049.2–56.2
Body Pain62.8051.6–62.8
General Health60.3054.6–61.7
Vitality56.2051.1–63.3
Social Functioning49.0040.9–57.1
Role-Emotional55.3055.3–55.3
Mental Health52.7045.9–55.0
4. GHSI (=Glasgow Health Status Inventory)
−100 to +100Totalpostoperative66.002.00 23 44.2range:
19.5–64.8
271Sivonen et al., 2021 [25]
5. EQ-5D-5L (=European Quality of Life in 5 Dimensions, 5 Level Version)
0–5Mobilitypostoperative
shortterm
(<12 months)
1.650.95--20-3.05.84581Piromchai et al., 2021 [38]
Self-care1.150.67
Usual activities1.450.83
Pain/discomfort1.550.60
Anxiety/depression1.650.99
Mobilitypostoperative longterm
(≥12 months)
1.290.59--17
Self-care1.120.33
Usual activities1.470.72
Pain/discomfort1.470.51
Anxiety/depression1.180.39
6. HUI 3 (=Health Utilities Index)
0–1Totalpreoperative0.56---59-72.36.8591Sarant et al., 2019 [16]
postoperative0.67-20
7. AQoL-8D (=Assessment of Quality of Life in 8 Dimensions)
0–1TotalPreoperative0.500.23-0.17–0.99104-34.816.61041Rostkowska et al., 2021 [15]
Physical superdimension0.500.200.15–0.91
Psycho-social superdimension0.270.190.05–0.92
Independent living0.780.150.39–1
Pain0.760.240.15–1
Senses0.530.180.25–0.97
Mental health0.530.160.25–1
Happiness0.640.180.24–1
Coping0.720.170.38–1
Relationships0.600.140.47–1
Self-worth0.640.210.28–1
TotalPostoperative0.660.19-0.21–0.99
Physical superdimension0.620.200.18–0.96
Psycho-social superdimension0.370.180.09–1
Independent living0.860.140.35–1
Pain0.780.220.21–1
Senses0.710.160.35–0.97
Mental health0.600.130.29–1
Happiness0.730.130.36–1
Coping0.800.120.52–1
Relationships0.700.140.47–1
Self-worth0.810.140.39–1
Table 4. Extracted data regarding the systematic review for children. All questionnaires refer to the generic quality of life of cochlear implant users after the intervention. If more than one publication is indicated, the values correspond to the mean value of these studies and their standard deviation (SD). If medians and ranges are specified, they are listed separately. Darker blue fields represent total scores.
RangeCategoryEvaluation TimeMean ScoreSDMedianRangen Specific Test forAge Mean [years]Age SD [years]n Whole Study Cohortn Publications IncludedPublications
Mean ValuesMedian Values
8. PedsQL (=Pediatric Quality of Life Inventory)
0–100Physicalpostoperative shortterm
(<12 months)
74.5923.67 23 2.965.834581Piromchai et al., 2021 [38]
Emotional56.9618.63
Social50.2222.94
School50.9432.08
Totalpostoperative longterm
(≥12 months)
87.0811.1079.3134.78–10073344.791.221072Alnuhayer et al., 2020 [1]
Hendriksma et al., 2020 [39]
Physical90.042.9389.3640.63–10081343.880.925663Alnuhayer et al., 2020 [1]
Hendriksma et al., 2020 [39]
Piromchai et al., 2021 [38]
Emotional72.0715.1973.3325–100
Social75.2312.1078.2410–100
School66.2014.5376.5037.5–100
9. GCBI (=Glasgow Children’s Benefit Inventory)
−100 to +100Totalpostoperative58.125.89 127 3.540.241272Aldriweesh et al., 2021 [40]
Dev et al., 2022 [41]
Physical health44.3014.10 573.301.9571Dev et al., 2022 [41]
Emotion68.1013.20
Learning78.9010.70
Vitality64.7012.10
10. KINDL
0–100Totalpostoperative46.9012.00 34 5.330.98341Vermi Sli Peker et al., 2020 [42]
Physical well-being67.7016.20
Self-esteem42.7022.70
School/Kindergarten41.2022.10
Social Relations (Friends)45.4017.90
Emotional Well-Being41.0017.10
Family44.9019.10
Table 5. Mean values of the hearing thresholds and their standard deviations (SDs) at the specific test frequencies of the pure tone audiometry for the cochlear implant users of this study. The degrees of hearing loss (HL) were determined by the guidelines of American Speech-Language-Hearing-Association (ASHA) [46].
Frequency (kHz)Hearing Threshold, Mean (dB)SDn
(Ears)
Degree of Hearing Loss according to ASHA
0.2524.42.6255Slight HL
0.526.33.4756Mild HL
124.64.0655Slight HL
224.62.3455Slight HL
426.82.2151Mild HL
627.31.5245Mild HL
Table 6. Results of the Hochmaier–Schulz–Moser (HSM) sentence test for 41 cochlear implant users. The scores generally ranged from a minimum score of 0% to a maximum score of 100%, indicating perfect speech comprehension.
PropertiesScores
Participants (n)41
Mean (%)71.6
Standard deviation (%)23.8
Minimum (%)15.1
Maximum (%)100
Table 7. Comparative values between early (≤3 years) and late (>3 years) implantation timepoints for cochlear implant users.
Comparison ParametersEarly Implantation
≤3 Years
nLate Implantation
>3 Years
np-ValueSignificantly Different
(p < 0.05)
AQoL-6D0.78 (0.19)370.81 (0.14)370.7252No
SSQ125.97 (1.79)416.13 (1.47)380.5995No
PTA25.6 dB (12.8 dB)2721.2 dB (7.01 dB)200.1127No
HSM sentence test72.9% (24.5%)2270.1% (23.5%)190.6283No
The following parameters were compared: Assessment of Quality of Life in six dimensions (AQoL-6D), Speech Spatial Qualities of Hearing Scale (SSQ12), Pure Tone Average (PTA), and the Hochmair–Schulz–Moser (HSM) sentence test. The comparison parameters are significantly different when the p-value is <0.05.
Table 8. Correlation characteristics of the total scores of the generic (Assessment of Quality of Life in six dimensions (AQoL-6D)) and health-related (Speech Spatial Qualities of Hearing Scale (SSQ12)) quality of life. The correlation is significant when the p-value is <0.05.
Correlation Parametern PairsSpearman
ρ
Correlation
Strength
p-ValueCorrelation Significant
(p < 0.05)
AQoL-6D and SSQ12720.4370moderate0.0001Yes
AQoL-6D Senses and SSQ12720.6739moderate<0.0001Yes
Disclaimer/Publisher’s Note: The statements, opinions and data contained in all publications are solely those of the individual author(s) and contributor(s) and not of MDPI and/or the editor(s). MDPI and/or the editor(s) disclaim responsibility for any injury to people or property resulting from any ideas, methods, instructions or products referred to in the content.

