
Position Classification of the Endotracheal Tube with Automatic Segmentation of the Trachea and the Tube on Plain Chest Radiography Using Deep Convolutional Neural Network

 , , , , and
Abstract
:
1. Introduction
2. Methods
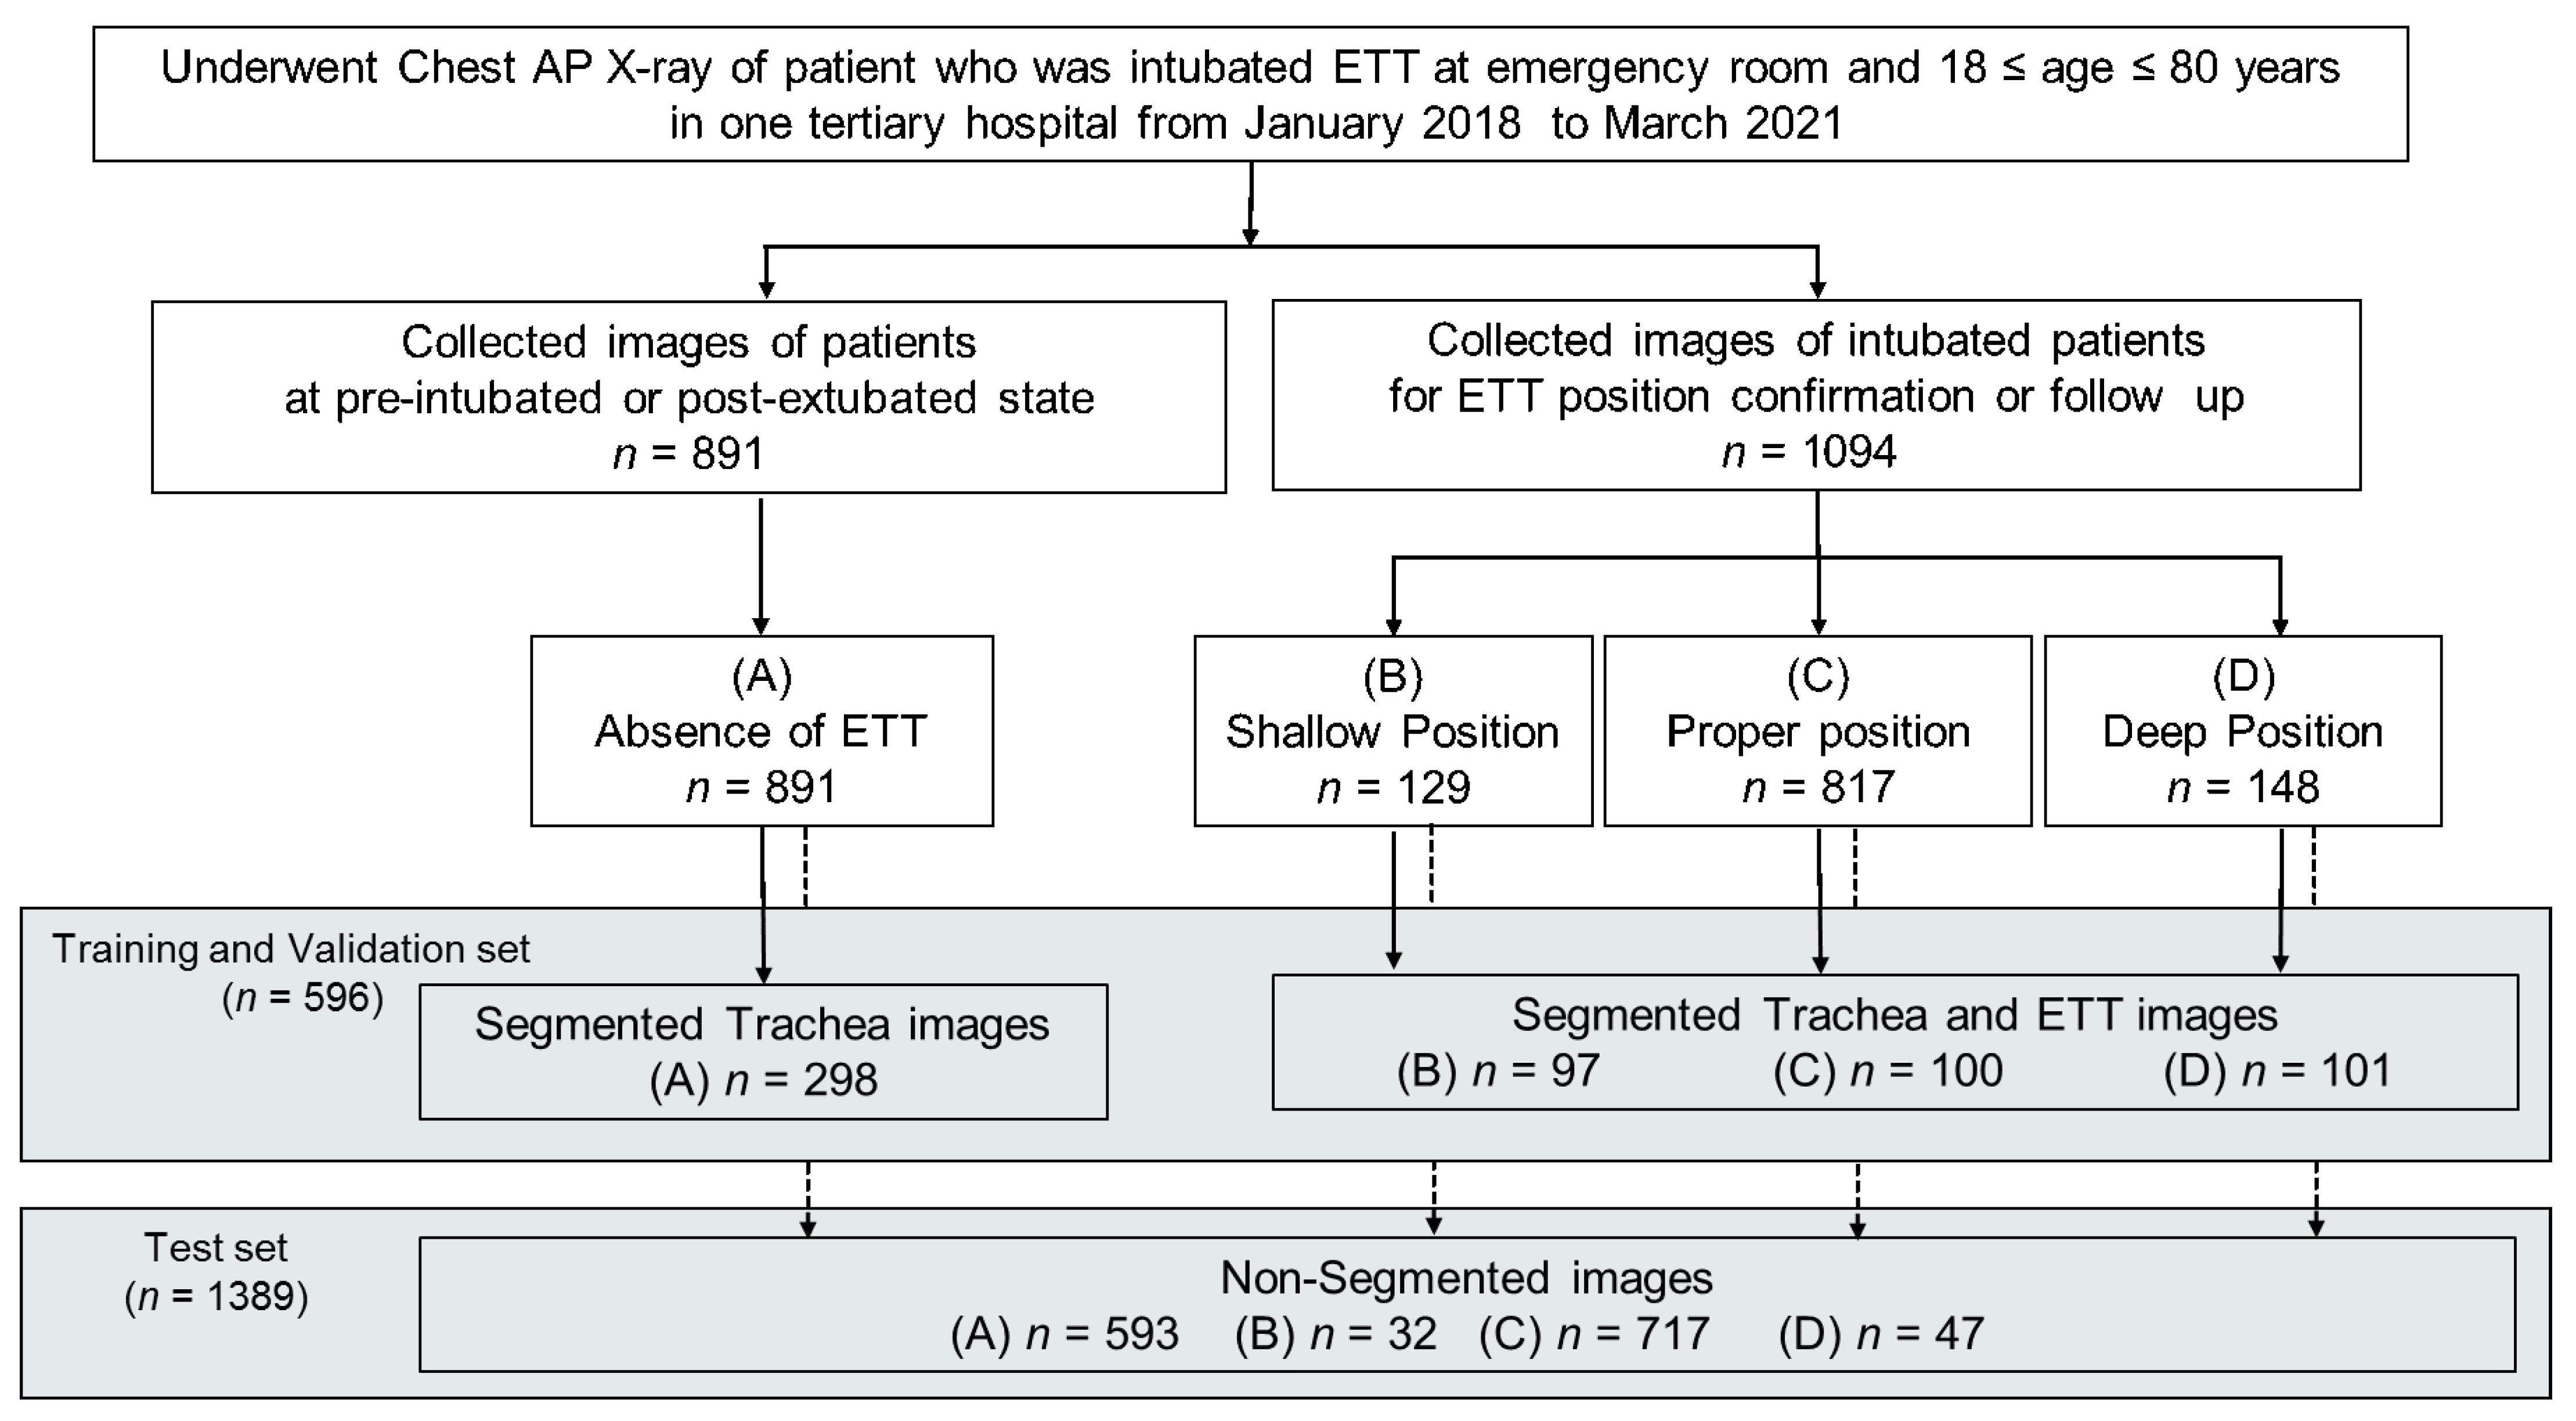
2.1. Study Design
2.2. Dataset of Participants
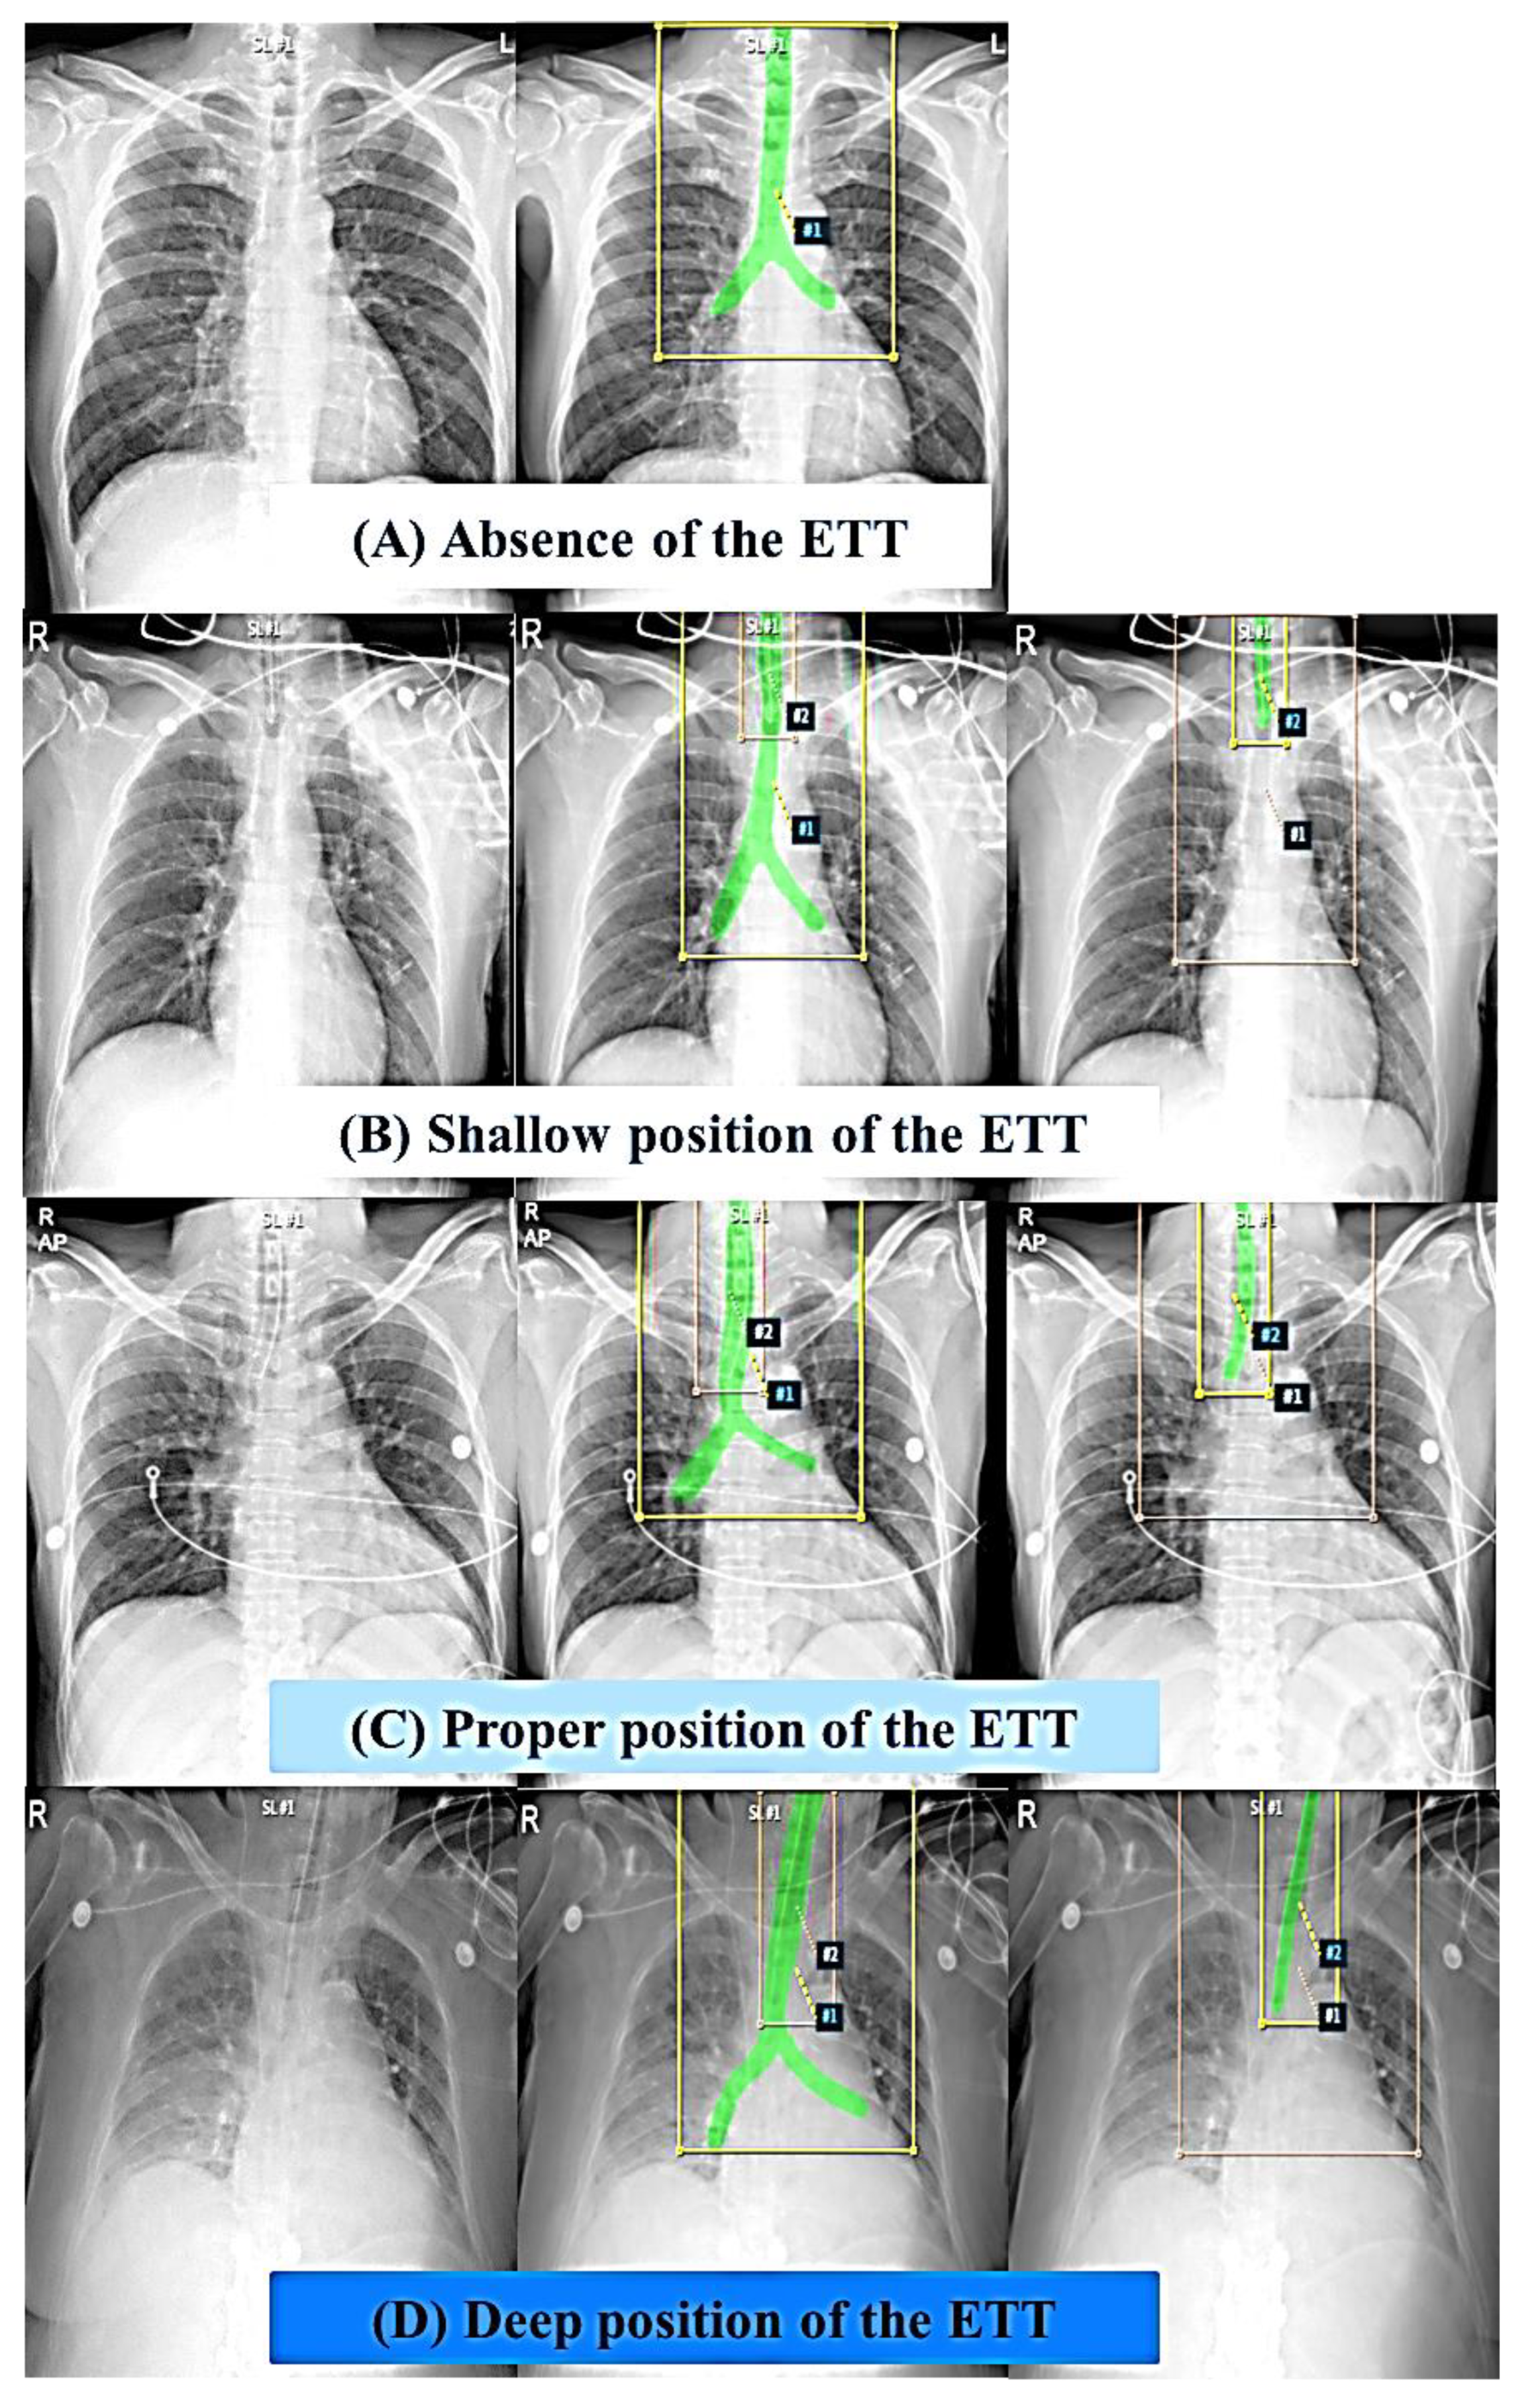
2.3. Segmentation of the Trachea and the ETT on Images and Data Processing
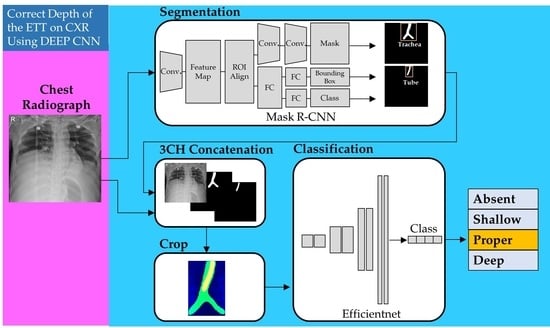
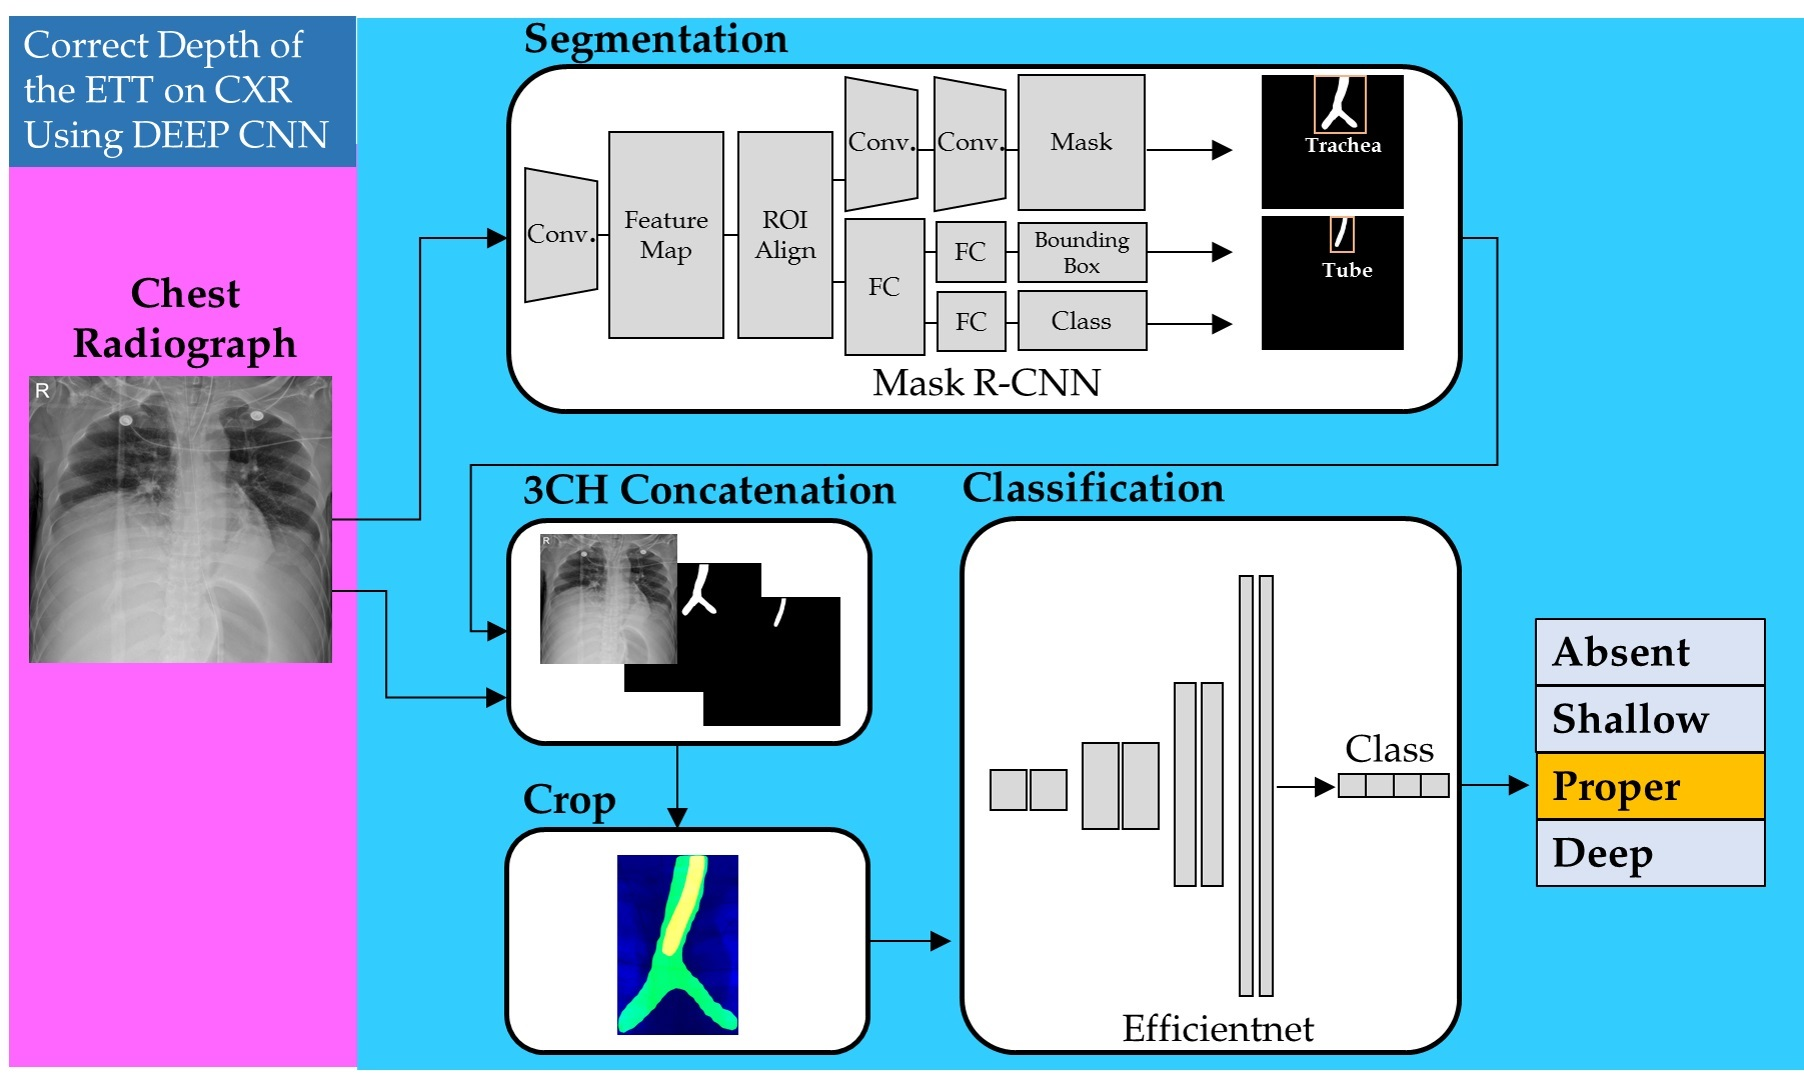
2.4. Proposed Models for Classification of Four Classes of ETT Position with Application of Automatic Segmentation Using Deep CNN
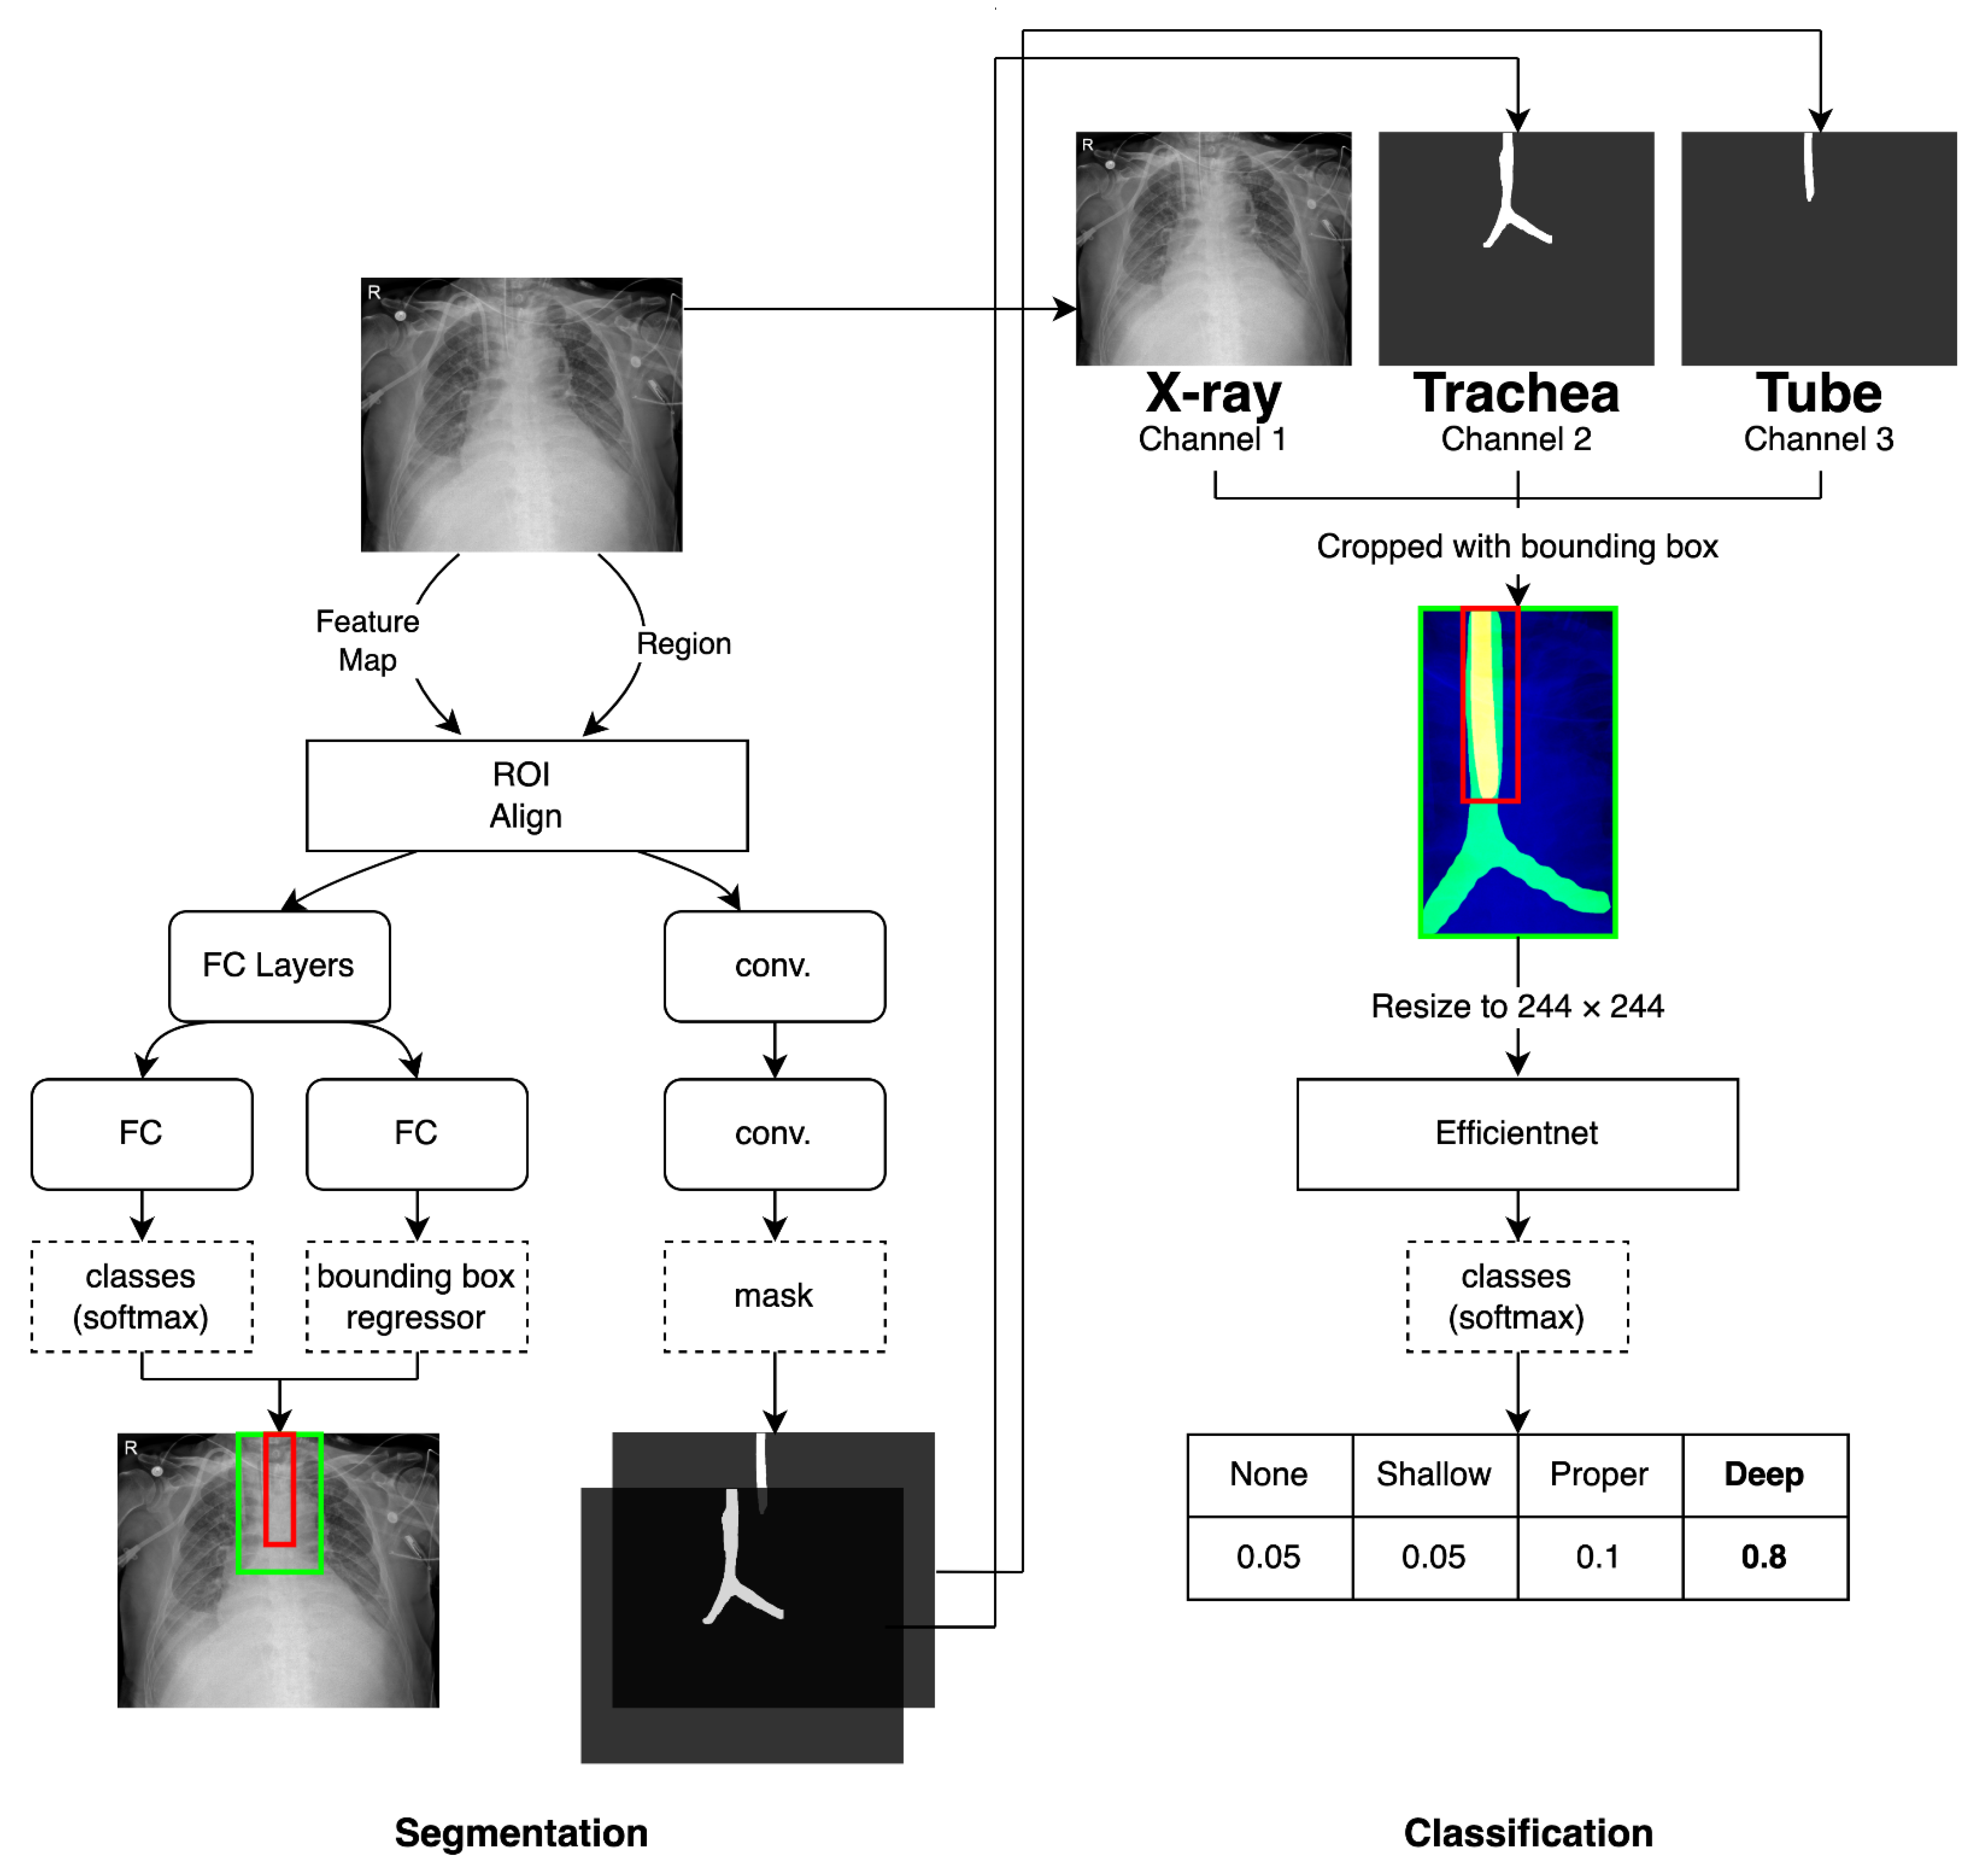
2.4.1. Network for the Segmentation of the Trachea and ETT
2.4.2. Network for Multi-Label Classification for Proper Positioning of the ETT in the Trachea
2.5. Experiments
2.6. Primary Outcomes
2.7. Statistical Analysis
3. Results
3.1. Five-Fold Validation for Automatic Segmentation of the Trachea and the ETT and Classification of Four Labels According to the ETT Position
3.2. Performance Test of Each Label for Classification of Four Labels with Non-Segmented Images after Training with All Segmented Images
4. Discussion
5. Conclusions
Author Contributions
Funding
Institutional Review Board Statement
Informed Consent Statement
Data Availability Statement
Conflicts of Interest
Abbreviations
| ETT | endotracheal tube |
| CNN | convolution neural network |
| AP | anteroposterior |
| PACS | picture archiving and communication system |
| DICOM | digital imaging and communication and medicine |
| Nifty | Neuroimaging Informatics Technology Initiative |
| FPN | feature pyramid network |
| SGD | stochastic gradient descent |
| SD | standard deviation |
| TP | true positive |
| FP | false positive |
| FN | false negative |
| NIH | National Institutes of Health |
References
- Sitzwohl, C.; Langheinrich, A.; Schober, A.; Krafft, P.; I Sessler, D.; Herkner, H.; Gonano, C.; Weinstabl, C.; Kettner, S.C. Endobronchial intubation detected by insertion depth of endotracheal tube, bilateral auscultation, or observation of chest movements: Randomised trial. BMJ 2010, 341, c5943. [Google Scholar] [CrossRef] [PubMed]
- Goodman, L.R.; Conrardy, P.A.; Laing, F.; Singer, M.M. Radiographic evaluation of endotracheal tube position. AJR Am. J. Roentgenol. 1976, 127, 433–434. [Google Scholar] [CrossRef] [PubMed]
- Peitzman, A.B.; Yealy, D.M.; Fabian, T.C.; Schwab, C.W. The Trauma Manual: Trauma and Acute Care Surgery; Wolters Kluwer: Philadelphia, PA, USA, 2019. [Google Scholar]
- Allan, E.; Giggens, R.; Ali, T.; Bhuva, S. The ICU Chest Radiograph: Line and Tube Essentials for Radiologists and ICU Physicians 2019: European Congress of Radiology-ECR 2019. Available online: https://epos.myesr.org/poster/esr/ecr2019/C-3024 (accessed on 1 April 2022).
- Owen, R.L.; Cheney, F.W. Endobronchial intubation: A preventable complication. Anesthesiology 1987, 67, 255–257. [Google Scholar] [CrossRef] [PubMed]
- Szekely, S.M.; Webb, R.K.; Williamson, J.A.; Russell, W.J. The Australian Incident Monitoring Study. Problems related to the en-dotracheal tube: An analysis of 2000 incident reports. Anaesth. Intensiv. Care 1993, 21, 611–616. [Google Scholar] [CrossRef]
- Brunel, W.; Coleman, D.L.; Schwartz, D.E.; Peper, E.; Cohen, N.H. Assessment of routine chest roentgenograms and the physical examination to confirm endotracheal tube position. Chest 1989, 96, 1043–1045. [Google Scholar] [CrossRef]
- Kim, J.T.; Kim, H.J.; Ahn, W.; Kim, H.S.; Bahk, J.H.; Lee, S.C.; Kim, C.S.; Kim, S.D. Head rotation, flexion, and extension alter endotra-cheal tube position in adults and children. Can. J. Anaesth. 2009, 56, 751–756. [Google Scholar] [CrossRef]
- Zwillich, C.W.; Pierson, D.J.; Creagh, C.; Sutton, F.D.; Schatz, E.; Petty, T.L. Complications of assisted ventilation. A prospective study of 354 consecutive episodes. Am. J. Med. 1974, 57, 161–170. [Google Scholar] [CrossRef]
- Stone, D.J.; Gal, T.J. Airway management. In Anesthesia, 5th ed.; Miller, R.D., Ed.; Churchill Livingstone: Philadephia, PA, USA, 2000; pp. 1431–1432. [Google Scholar]
- Bozeman, W.P.; Hexter, D.; Liang, H.K.; Kelen, G.D. Esophageal detector device versus detection of end-tidal carbon dioxide level in emergency intubation. Ann. Emerg. Med. 1996, 27, 595–599. [Google Scholar] [CrossRef]
- Grmec, S. Comparison of three different methods to confirm tracheal tube placement in emergency intubation. Intensive Care Med. 2002, 28, 701–704. [Google Scholar] [CrossRef]
- Chou, E.H.; Dickman, E.; Tsou, P.Y.; Tessaro, M.; Tsai, Y.M.; Ma, M.H.; Lee, C.C.; Marshall, J. Ultrasonography for confirmation of en-dotracheal tube placement: A systematic review and meta-analysis. Resuscitation 2015, 90, 97–103. [Google Scholar] [CrossRef]
- Song, Y.; Oh, J.; Chee, Y.; Lim, T.; Kang, H.; Cho, Y. A novel method to position an endotracheal tube at the correct depth using an infrared sensor stylet. Can. J. Anaesth. 2013, 60, 444–449. [Google Scholar] [CrossRef] [PubMed]
- Mitra, A.; Gave, A.; Coolahan, K.; Nguyen, T. Confirmation of endotracheal tube placement using disposable fiberoptic bronchoscopy in the emergent setting. World J. Emerg. Med. 2019, 10, 210–214. [Google Scholar] [CrossRef] [PubMed]
- Chen, S.; Zhang, M.; Yao, L.; Xu, W. Endotracheal tubes positioning detection in adult portable chest radiography for intensive care unit. Int. J. Comput. Assist. Radiol. Surg. 2016, 11, 2049–2057. [Google Scholar] [CrossRef] [PubMed]
- Lakhani, P. Deep Convolutional Neural Networks for Endotracheal Tube Position and X-ray Image Classification: Chal-lenges and Opportunities. J. Digit. Imaging 2017, 30, 460–468. [Google Scholar] [CrossRef] [PubMed]
- Lakhani, P.; Flanders, A.; Gorniak, R. Endotracheal Tube Position Assessment on Chest Radiographs Using Deep Learning. Radiol. Artif. Intell. 2020, 3, e200026. [Google Scholar] [CrossRef]
- Kara, S.; Akers, J.Y.; Chang, P.D. Identification and Localization of Endotracheal Tube on Chest Radiographs Using a Cascaded Convolutional Neural Network Approach. J. Digit. Imaging 2021, 34, 898–904. [Google Scholar] [CrossRef]
- Schultheis, W.G.; Lakhani, P. Using Deep Learning Segmentation for Endotracheal Tube Position Assessment. J. Thorac. Imaging 2022, 37, 125–131. [Google Scholar] [CrossRef]
- Kim, C.; Kang, H.; Lim, T.H.; Choi, B.Y.; Shin, Y.J.; Choi, H.J. What factors affect the success rate of the first attempt at endotracheal intubation in emergency departments? Emerg. Med. J. 2013, 30, 888–892. [Google Scholar] [CrossRef]
- Lin, T.-Y.; Maire, M.; Belongie, S.; Hays, J.; Perona, P.; Ramanan, D.; Dollár, P.; Zitnick, C.L. Microsoft coco: Common objects in context. In Proceedings of the European Conference on Computer Vision, Zürich, Switzerland, 5–12 September 2014; pp. 740–755. [Google Scholar] [CrossRef]
- Lorensen, W.E.; Cline, H.E. Marching cubes: A high resolution 3D surface construction algorithm. ACM Siggraph Comput. Graph. 1987, 21, 163–169. [Google Scholar] [CrossRef]
- Tan, M.; Le, Q. Efficientnet: Rethinking model scaling for convolutional neural networks. In Proceedings of the International Conference on Machine Learning, Long Beach, CA, USA, 9–15 June 2019; pp. 6105–6114. [Google Scholar]
- He, K.; Gkioxari, G.; Dollár, P.; Girshick, R. Mask r-cnn. In Proceedings of the IEEE International Conference on Computer Vision, Venice, Italy, 22–29 October 2017; pp. 2961–2969. [Google Scholar]
- He, K.; Zhang, X.; Ren, S.; Sun, J. Deep residual learning for image recognition. In Proceedings of the IEEE Conference on Computer Vision and Pattern Recognition, Caesars Palace, NV, USA, 1–26 June 2016; pp. 770–778. [Google Scholar]
- Lin, T.-Y.; Dollár, P.; Girshick, R.; He, K.; Hariharan, B.; Belongie, S. Feature pyramid networks for object detection. In Proceedings of the IEEE Conference on Computer Vision and Pattern Recognition, Honolulu, HI, USA, 21–26 July 2017; pp. 2117–2125. [Google Scholar]
- Deng, J.; Dong, W.; Socher, R.; Li, L.-J.; Li, K.; Fei-Fei, L. Imagenet: A large-scale hierarchical image database. In Proceedings of the 2009 IEEE Conference on Computer Vision and Pattern Recognition, Miami, FL, USA, 20–25 June 2009; pp. 248–255. [Google Scholar]
- Kingma, D.P.; Ba, J. Adam: A method for stochastic optimization. arXiv 2014, arXiv:1412.6980. [Google Scholar] [CrossRef]
- Yi, X.; Adams, S.J.; Henderson, R.D.E.; Babyn, P. Computer-aided Assessment of Catheters and Tubes on Radiographs: How Good Is Artificial Intelligence for Assessment? Radiol. Artif. Intell. 2020, 2, e190082. [Google Scholar] [CrossRef] [PubMed]
- Kao, E.F.; Jaw, T.S.; Li, C.W.; Chou, M.C.; Liu, G.C. Automated detection of endotracheal tubes in paediatric chest radiographs. Comput. Methods Programs Biomed. 2015, 118, 1–10. [Google Scholar] [CrossRef] [PubMed]
- Frid-Adar, M.; Amer, R.; Greenspan, H. (Eds.) Endotracheal tube detection and segmentation in chest radiographs using synthetic data. In International Conference on Medical Image Computing and Computer-Assisted Intervention; Springer: Cham, Switzerland, 2019. [Google Scholar] [CrossRef] [Green Version]

| The Distance from the Carina to Tip of the ETT, Mean (SD) | ||||
|---|---|---|---|---|
| Segmented Data For the Training and 5-Fold Validation | Non-Segmented Data For the Test | p-Value | ||
| Labels | Absence | - | - | - |
| Shallow, mm | 78.76 (9.83) | 78.56 (6.79) | 0.915 | |
| Proper, mm | 48.68 (11.79) | 47.60 (10.53) | 0.343 | |
| Deep, mm | 20.56 (6.85) | 19.09 (8.32) | 0.261 | |
| 1-Fold | 2-Fold | 3-Fold | 4-Fold | 5-Fold | Average of 5-Fold, Mean (SD) | |||
|---|---|---|---|---|---|---|---|---|
| Segmentation | ||||||||
| Dice of the trachea, mean (SD) | 0.840 (0.069) | 0.843 (0.044) | 0.847 (0.057) | 0.846 (0.070) | 0.832 (0.068) | 0.841 (0.063) | ||
| Dice of the ETT, mean (SD) | 0.895 (0.065) | 0.881 (0.132) | 0.886 (0.060) | 0.908 (0.041) | 0.896 (0.056) | 0.893 (0.078) | ||
| Shallow | Proper | Deep | ||||||
| 0.879 (0.113) | 0.908 (0.055) | 0.892 (0.045) | ||||||
| Classification | ||||||||
| Overall accuracy (F1 score) | 0.942 | 0.867 | 0.882 | 0.899 | 0.856 | 0.889 (0.034) | ||
| (A) Confusion Matrix | Prediction | |||||
| Absence | Shallow | Proper | Deep | Sum | ||
| Labels | Absence | 580 | 5 | 4 | 4 | 593 |
| Shallow | 3 | 27 | 2 | 0 | 32 | |
| Proper | 3 | 102 | 522 | 90 | 717 | |
| Deep | 2 | 0 | 3 | 42 | 47 | |
| Sum | 588 | 134 | 531 | 136 | ||
| (B) Outcomes | Prediction | |||||
| Absence | Shallow | Proper | Deep | Total (n) | ||
| True Positive, n | 580 | 27 | 522 | 42 | 1171 | |
| False Positive, n | 8 | 107 | 9 | 94 | 218 | |
| True Negative, n | 788 | 1250 | 663 | 1248 | 3949 | |
| False Negative, n | 13 | 5 | 195 | 5 | 218 | |
| Accuracy | 0.985 | 0.919 | 0.853 | 0.929 | 0.922 | |
| Precision | 0.986 | 0.201 | 0.983 | 0.309 | 0.843 | |
| Sensitivity | 0.978 | 0.844 | 0.728 | 0.894 | 0.843 | |
| Specificity | 0.990 | 0.921 | 0.987 | 0.930 | 0.922 | |
| F1 score | 0.982 | 0.325 | 0.837 | 0.459 | 0.843 | |
Publisher’s Note: MDPI stays neutral with regard to jurisdictional claims in published maps and institutional affiliations. |
© 2022 by the authors. Licensee MDPI, Basel, Switzerland. This article is an open access article distributed under the terms and conditions of the Creative Commons Attribution (CC BY) license (https://creativecommons.org/licenses/by/4.0/).
Share and Cite
Jung, H.C.; Kim, C.; Oh, J.; Kim, T.H.; Kim, B.; Lee, J.; Chung, J.H.; Byun, H.; Yoon, M.S.; Lee, D.K. Position Classification of the Endotracheal Tube with Automatic Segmentation of the Trachea and the Tube on Plain Chest Radiography Using Deep Convolutional Neural Network. J. Pers. Med. 2022, 12, 1363. https://doi.org/10.3390/jpm12091363
Jung HC, Kim C, Oh J, Kim TH, Kim B, Lee J, Chung JH, Byun H, Yoon MS, Lee DK. Position Classification of the Endotracheal Tube with Automatic Segmentation of the Trachea and the Tube on Plain Chest Radiography Using Deep Convolutional Neural Network. Journal of Personalized Medicine. 2022; 12(9):1363. https://doi.org/10.3390/jpm12091363
Chicago/Turabian StyleJung, Heui Chul, Changjin Kim, Jaehoon Oh, Tae Hyun Kim, Beomgyu Kim, Juncheol Lee, Jae Ho Chung, Hayoung Byun, Myeong Seong Yoon, and Dong Keon Lee. 2022. "Position Classification of the Endotracheal Tube with Automatic Segmentation of the Trachea and the Tube on Plain Chest Radiography Using Deep Convolutional Neural Network" Journal of Personalized Medicine 12, no. 9: 1363. https://doi.org/10.3390/jpm12091363
APA StyleJung, H. C., Kim, C., Oh, J., Kim, T. H., Kim, B., Lee, J., Chung, J. H., Byun, H., Yoon, M. S., & Lee, D. K. (2022). Position Classification of the Endotracheal Tube with Automatic Segmentation of the Trachea and the Tube on Plain Chest Radiography Using Deep Convolutional Neural Network. Journal of Personalized Medicine, 12(9), 1363. https://doi.org/10.3390/jpm12091363