
Comparison of Pneumonia Severity Indices, qCSI, 4C-Mortality Score and qSOFA in Predicting Mortality in Hospitalized Patients with COVID-19 Pneumonia

 , ,
, ,
Abstract
:1. Introduction
2. Materials and Methods
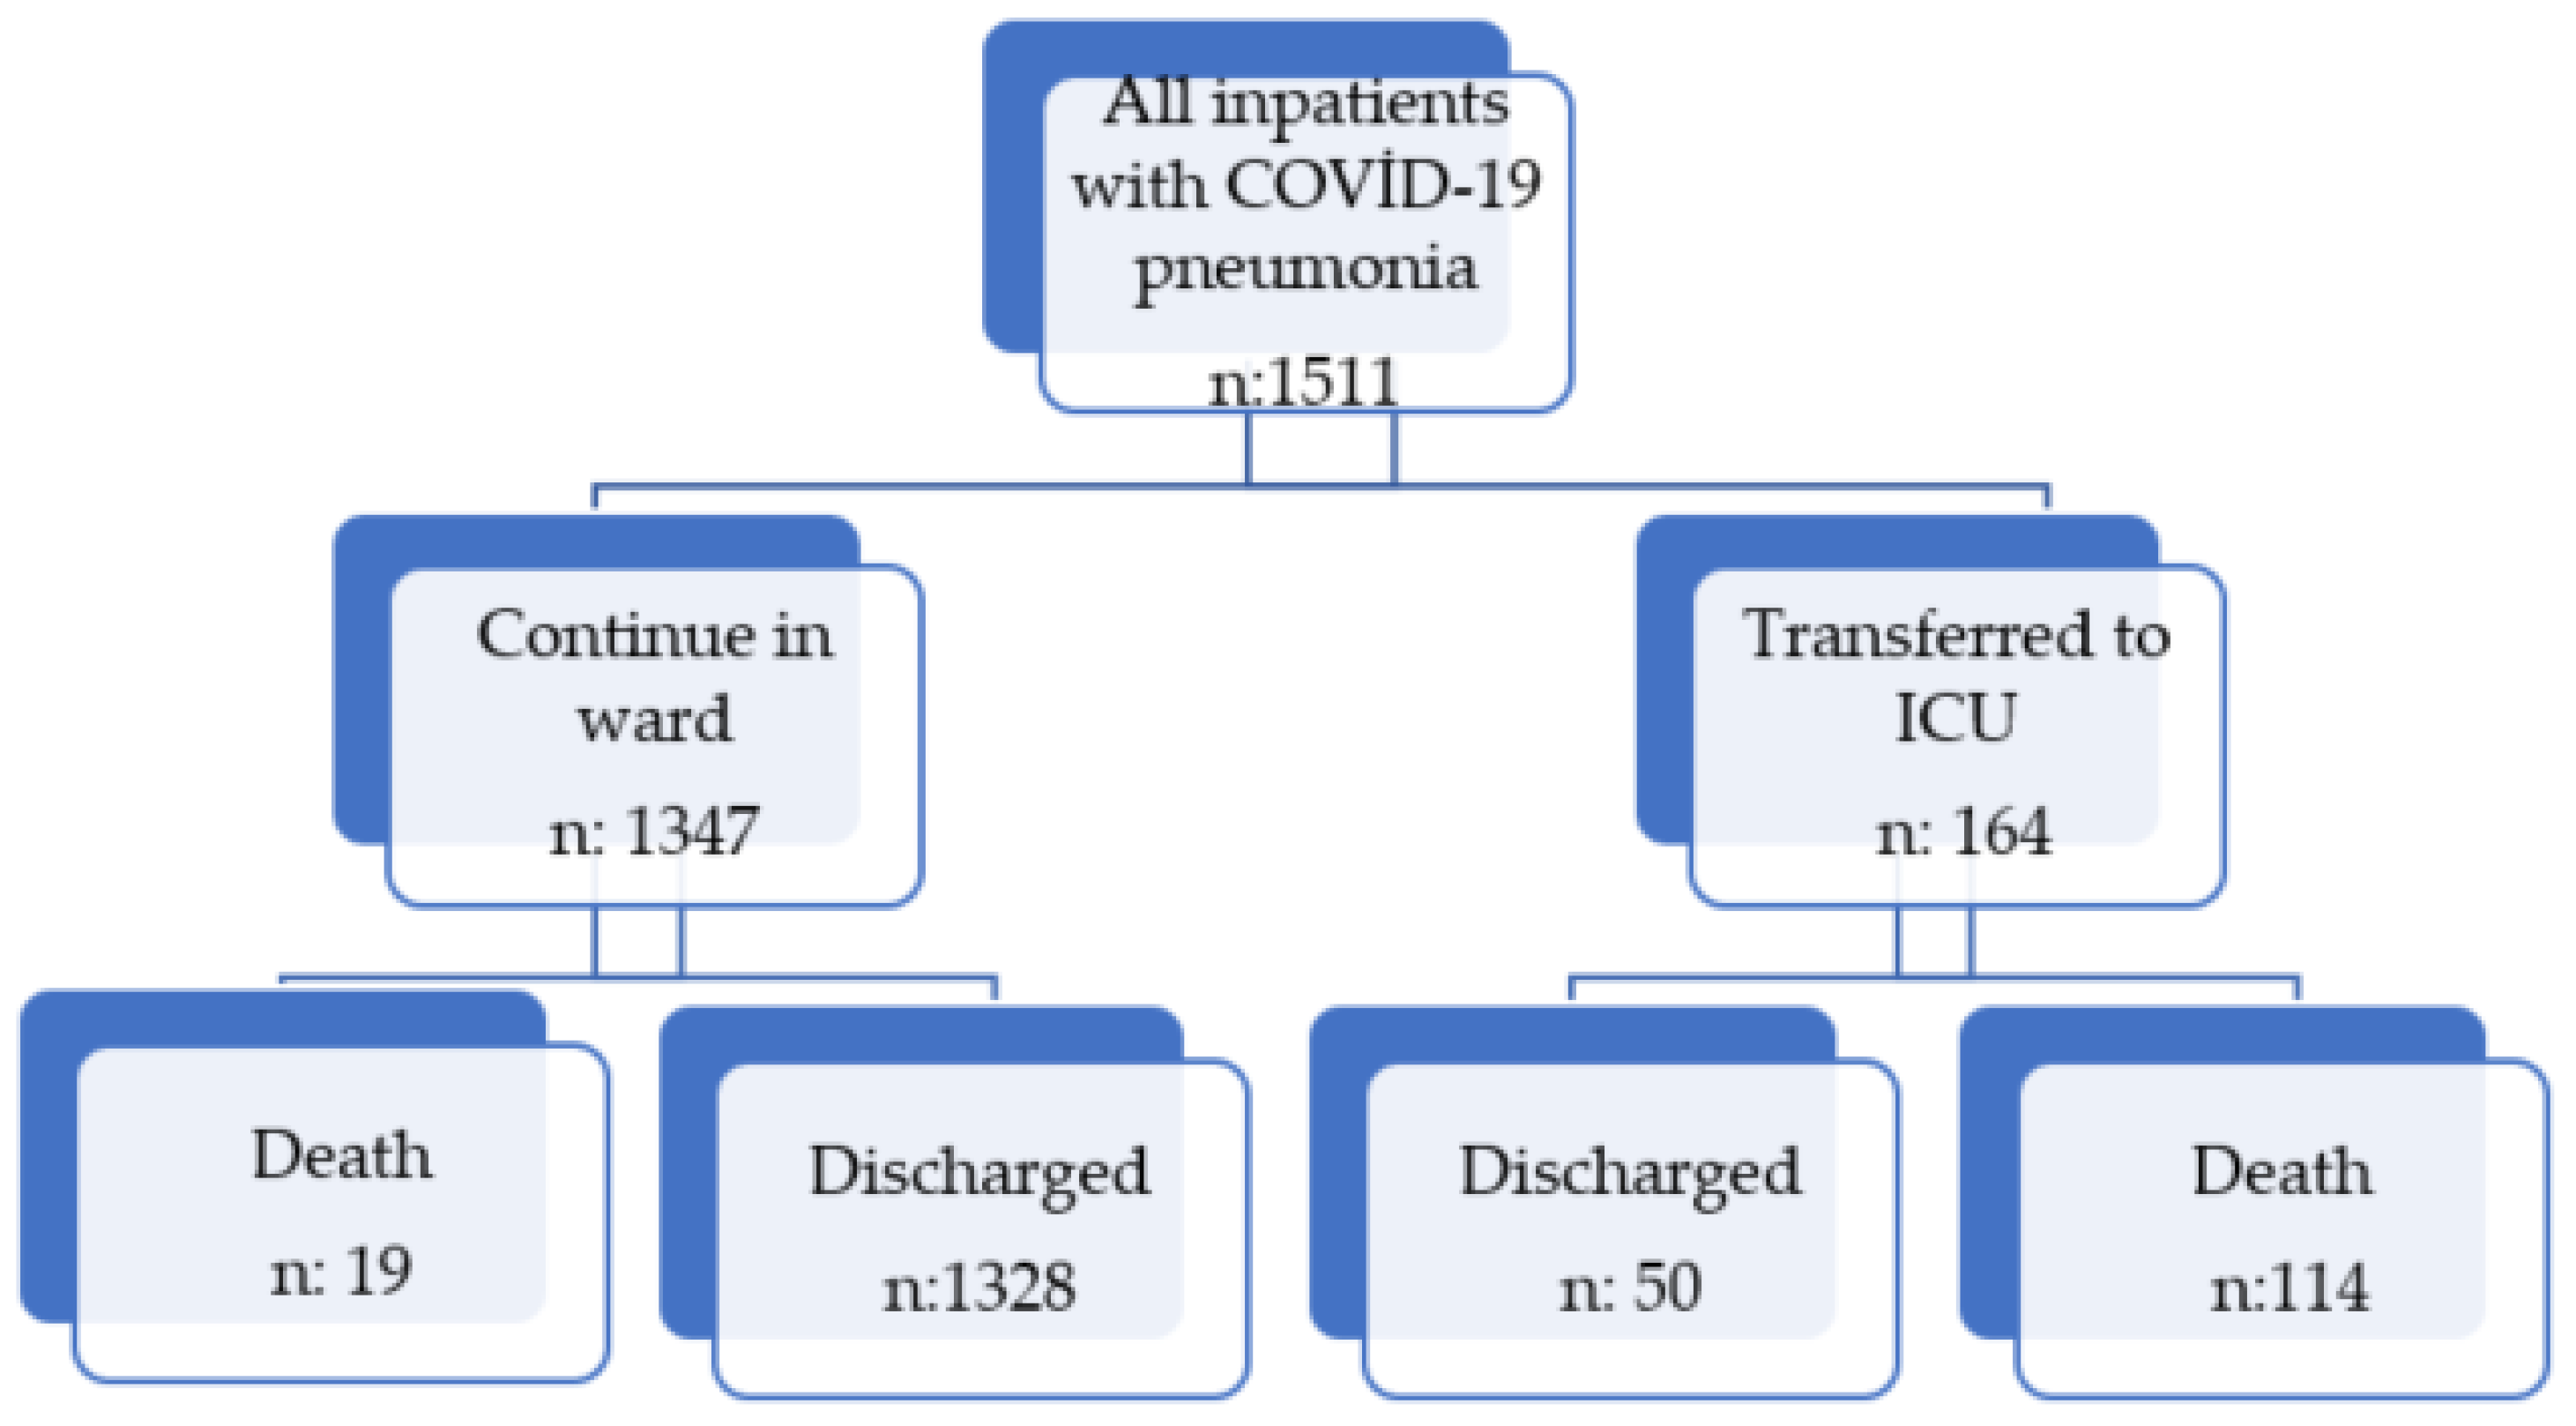
2.1. Study Design and Participants
2.2. Scores Selections and Definitions
2.3. Statistical Analysis
3. Results
3.1. Comparison of Basic Clinical Characteristics between the Two Groups
3.2. Comparison of Laboratory Tests and Chest CT Scans between the Two Groups
3.3. Score Distribution
3.4. Outcomes in Two Groups
4. Discussion
Limitation
5. Conclusions
Author Contributions
Funding
Institutional Review Board Statement
Informed Consent Statement
Data Availability Statement
Acknowledgments
Conflicts of Interest
References
- World Health Organization. WHO Coronavirus (COVID-19) Dashboard. Available online: https://covid19.who.int (accessed on 28 January 2022).
- Wu, Z.; McGoogan, J.M. Characteristics of and Important Lessons from the Coronavirus Disease 2019 (COVID-19) Outbreak in China: Summary of a Report of 72,314 Cases from the Chinese Center for Disease Control and Prevention. JAMA 2020, 323, 1239. [Google Scholar] [CrossRef] [PubMed]
- Rodriguez-Morales, A.J.; Cardona-Ospina, J.A.; Gutiérrez-Ocampo, E.; Villamizar-Peña, R.; Holguin-Rivera, Y.; Escalera-Antezana, J.P.; Alvarado-Arnez, L.E.; Bonilla-Aldana, D.K.; Franco-Paredes, C.; Henao-Martinez, A.F.; et al. Clinical, Laboratory and Imaging Features of COVID-19: A Systematic Review and Meta-Analysis. Travel Med. Infect. Dis. 2020, 34, 101623. [Google Scholar] [CrossRef] [PubMed]
- Duan, J.; Wang, X.; Chi, J.; Chen, H.; Bai, L.; Hu, Q.; Han, X.; Hu, W.; Zhu, L.; Wang, X.; et al. Correlation between the Variables Collected at Admission and Progression to Severe Cases during Hospitalization among Patients with COVID-19 in Chongqing. J. Med. Virol. 2020, 92, 2616–2622. [Google Scholar] [CrossRef]
- Middeldorp, S.; Coppens, M.; Haaps, T.F.; Foppen, M.; Vlaar, A.P.; Müller, M.C.A.; Bouman, C.C.S.; Beenen, L.F.M.; Kootte, R.S.; Heijmans, J.; et al. Incidence of Venous Thromboembolism in Hospitalized Patients with COVID-19. J. Thromb. Haemost. 2020, 18, 1995–2002. [Google Scholar] [CrossRef] [PubMed]
- Hu, B.; Huang, S.; Yin, L. The Cytokine Storm and COVID-19. J. Med. Virol. 2021, 93, 250–256. [Google Scholar] [CrossRef]
- Wu, C.; Chen, X.; Cai, Y.; Xia, J.; Zhou, X.; Xu, S.; Huang, H.; Zhang, L.; Zhou, X.; Du, C.; et al. Risk Factors Associated with Acute Respiratory Distress Syndrome and Death in Patients with Coronavirus Disease 2019 Pneumonia in Wuhan, China. JAMA Intern. Med. 2020, 180, 934. [Google Scholar] [CrossRef] [PubMed] [Green Version]
- Zhou, F.; Yu, T.; Du, R.; Fan, G.; Liu, Y.; Liu, Z.; Xiang, J.; Wang, Y.; Song, B.; Gu, X.; et al. Clinical Course and Risk Factors for Mortality of Adult Inpatients with COVID-19 in Wuhan, China: A Retrospective Cohort Study. Lancet 2020, 395, 1054–1062. [Google Scholar] [CrossRef]
- Chen, N.; Zhou, M.; Dong, X.; Qu, J.; Gong, F.; Han, Y.; Qiu, Y.; Wang, J.; Liu, Y.; Wei, Y.; et al. Epidemiological and Clinical Characteristics of 99 Cases of 2019 Novel Coronavirus Pneumonia in Wuhan, China: A Descriptive Study. Lancet 2020, 395, 507–513. [Google Scholar] [CrossRef] [Green Version]
- Wang, D.; Hu, B.; Hu, C.; Zhu, F.; Liu, X.; Zhang, J.; Wang, B.; Xiang, H.; Cheng, Z.; Xiong, Y.; et al. Clinical Characteristics of 138 Hospitalized Patients with 2019 Novel Coronavirus—Infected Pneumonia in Wuhan, China. JAMA 2020, 323, 1061–1069. [Google Scholar] [CrossRef]
- Donoso-Navarro, E.; Arribas Gómez, I.; Bernabeu-Andreu, F.A. IL-6 and Other Biomarkers Associated with Poor Prognosis in a Cohort of Hospitalized Patients with COVID-19 in Madrid. Biomark Insights 2021, 16, 117727192110133. [Google Scholar] [CrossRef]
- Ruan, Q.; Yang, K.; Wang, W.; Jiang, L.; Song, J. Clinical Predictors of Mortality Due to COVID-19 Based on an Analysis of Data of 150 Patients from Wuhan, China. Intensive Care Med. 2020, 46, 846–848. [Google Scholar] [CrossRef] [PubMed] [Green Version]
- Li, C.; Ye, J.; Chen, Q.; Hu, W.; Wang, L.; Fan, Y.; Lu, Z.; Chen, J.; Chen, Z.; Chen, S.; et al. Elevated Lactate Dehydrogenase (LDH) Level as an Independent Risk Factor for the Severity and Mortality of COVID-19. Aging 2020, 12, 15670–15681. [Google Scholar] [CrossRef] [PubMed]
- Umeh, C.; Tuscher, L.; Ranchithan, S.; Watanabe, K.; Gupta, R. Predictors of COVID-19 Mortality in Critically Ill ICU Patients: A Multicenter Retrospective Observational Study. Cureus 2022, 14, e20952. [Google Scholar] [CrossRef] [PubMed]
- Verity, R.; Okell, L.C.; Dorigatti, I.; Winskill, P.; Whittaker, C.; Imai, N.; Cuomo-Dannenburg, G.; Thompson, H.; Walker, P.G.T.; Fu, H.; et al. Estimates of the Severity of Coronavirus Disease 2019: A Model-Based Analysis. Lancet Infect. Dis. 2020, 20, 669–677. [Google Scholar] [CrossRef]
- Fan, G.; Tu, C.; Zhou, F.; Liu, Z.; Wang, Y.; Song, B.; Gu, X.; Wang, Y.; Wei, Y.; Li, H.; et al. Comparison of Severity Scores for COVID-19 Patients with Pneumonia: A Retrospective Study. Eur. Respir. J. 2020, 56, 2002113. [Google Scholar] [CrossRef]
- Hu, H.; Yao, N.; Qiu, Y. Predictive Value of 5 Early Warning Scores for Critical COVID-19 Patients. Disaster Med. Public Health Prep. 2020, 1–8. [Google Scholar] [CrossRef]
- García Clemente, M.M.; Herrero Huertas, J.; Fernández Fernández, A.; De La Escosura Muñoz, C.; Enríquez Rodríguez, A.I.; Pérez Martínez, L.; Gómez Mañas, S.; Iscar Urrutia, M.; López González, F.J.; Madrid Carbajal, C.J.; et al. Assessment of Risk Scores in COVID-19. Int. J. Clin. Pract. 2021, 75, e13705. [Google Scholar] [CrossRef]
- Haimovich, A.D.; Ravindra, N.G.; Stoytchev, S.; Young, H.P.; Wilson, F.P.; van Dijk, D.; Schulz, W.L.; Taylor, R.A. Development and Validation of the Quick COVID-19 Severity Index: A Prognostic Tool for Early Clinical Decompensation. Ann. Emerg. Med. 2020, 76, 442–453. [Google Scholar] [CrossRef]
- Knight, S.R.; Ho, A.; Pius, R.; Buchan, I.; Carson, G.; Drake, T.M.; Dunning, J.; Fairfield, C.J.; Gamble, C.; Green, C.A.; et al. Risk Stratification of Patients Admitted to Hospital with COVID-19 Using the ISARIC WHO Clinical Characterisation Protocol: Development and Validation of the 4C Mortality Score. BMJ 2020, 370, m3339. [Google Scholar] [CrossRef]
- Ji, D.; Zhang, D.; Xu, J.; Chen, Z.; Yang, T.; Zhao, P.; Chen, G.; Cheng, G.; Wang, Y.; Bi, J.; et al. Prediction for Progression Risk in Patients With COVID-19 Pneumonia: The CALL Score. Clin. Infect. Dis. 2020, 71, 1393–1399. [Google Scholar] [CrossRef] [Green Version]
- Grifoni, E.; Valoriani, A.; Cei, F.; Vannucchi, V.; Moroni, F.; Pelagatti, L.; Tarquini, R.; Landini, G.; Masotti, L. The CALL Score for Predicting Outcomes in Patients With COVID-19. Clin. Infect. Dis. 2020, 72, ciaa686. [Google Scholar] [CrossRef] [PubMed]
- Rodriguez-Nava, G.; Yanez-Bello, M.A.; Trelles-Garcia, D.P.; Chung, C.W.; Friedman, H.J.; Hines, D.W. Performance of the Quick COVID-19 Severity Index and the Brescia-COVID Respiratory Severity Scale in Hospitalized Patients with COVID-19 in a Community Hospital Setting. Int. J. Infect. Dis. 2021, 102, 571–576. [Google Scholar] [CrossRef] [PubMed]
- Al-Tawfiq, J.A.; Hinedi, K.; Ghandour, J.; Khairalla, H.; Musleh, S.; Ujayli, A.; Memish, Z.A. Middle East Respiratory Syndrome Coronavirus: A Case-Control Study of Hospitalized Patients. Clin. Infect. Dis. 2014, 59, 160–165. [Google Scholar] [CrossRef] [Green Version]
- Rainer, T.H.; Lee, N.; Ip, M.; Galvani, A.P.; Antonio, G.E.; Wong, K.T.; Chan, D.P.N.; Ng, A.W.H.; Shing, K.K.; Chau, S.S.L.; et al. Features Discriminating SARS from Other Severe Viral Respiratory Tract Infections. Eur. J. Clin. Microbiol. Infect. Dis. 2007, 26, 121–129. [Google Scholar] [CrossRef]
- Qu, J.-X.; Gu, L.; Pu, Z.-H.; Yu, X.-M.; Liu, Y.-M.; Li, R.; Wang, Y.-M.; Cao, B.; Wang, C.; For Beijing Network for Adult Community-Acquired Pneumonia (BNACAP). Viral Etiology of Community-Acquired Pneumonia among Adolescents and Adults with Mild or Moderate Severity and Its Relation to Age and Severity. BMC Infect. Dis. 2015, 15, 89. [Google Scholar] [CrossRef] [PubMed] [Green Version]
- Kim, M.-A.; Park, J.S.; Lee, C.W.; Choi, W.-I. Pneumonia Severity Index in Viral Community Acquired Pneumonia in Adults. PLoS ONE 2019, 14, e0210102. [Google Scholar] [CrossRef]
- Zhou, F.; Wang, Y.; Liu, Y.; Liu, X.; Gu, L.; Zhang, X.; Pu, Z.; Yang, G.; Liu, B.; Nie, Q.; et al. Disease Severity and Clinical Outcomes of Community-Acquired Pneumonia Caused by Non-Influenza Respiratory Viruses in Adults: A Multicentre Prospective Registry Study from the CAP-China Network. Eur. Respir. J. 2019, 54, 1802406. [Google Scholar] [CrossRef]
- Zhan, Y.; Yang, Z.; Chen, R.; Wang, Y.; Guan, W.; Zhao, S. Respiratory Virus Is a Real Pathogen in Immunocompetent Community-Acquired Pneumonia: Comparing to Influenza like Illness and Volunteer Controls. BMC Pulm. Med. 2014, 14, 144. [Google Scholar] [CrossRef]
- Fine, M.J.; Auble, T.E.; Yealy, D.M.; Hanusa, B.H.; Weissfeld, L.A.; Singer, D.E.; Coley, C.M.; Marrie, T.J.; Kapoor, W.N. A Prediction Rule to Identify Low-Risk Patients with Community-Acquired Pneumonia. N. Engl. J. Med. 1997, 336, 243–250. [Google Scholar] [CrossRef]
- Miyashita, N.; Matsushima, T.; Oka, M. The JRS Guidelines for the Management of Community-Acquired Pneumonia in Adults:An Update and New Recommendations. Intern. Med. 2006, 45, 419–428. [Google Scholar] [CrossRef] [Green Version]
- Royal College of Physicians. National Early Warning Score (NEWS) 2: Standardising the Assesment of Acute-Ilness Severity in the NHS. Updated Report of Working Party; RCP: London, UK, 2017; Available online: https://www.rcplondon.ac.uk/projects/outputs/national-early-warning-score-news-2 (accessed on 28 January 2022).
- Subbe, C.P. Validation of a Modified Early Warning Score in Medical Admissions. QJM 2001, 94, 521–526. [Google Scholar] [CrossRef] [PubMed] [Green Version]
- Lim, W.S. Defining Community Acquired Pneumonia Severity on Presentation to Hospital: An International Derivation and Validation Study. Thorax 2003, 58, 377–382. [Google Scholar] [CrossRef] [PubMed] [Green Version]
- Liu, J.; Xu, F.; Zhou, H.; Wu, X.; Shi, L.; Lu, R.; Farcomeni, A.; Venditti, M.; Zhao, Y.; Luo, S.; et al. Expanded CURB-65: A New Score System Predicts Severity of Community-Acquired Pneumonia with Superior Efficiency. Sci. Rep. 2016, 6, 22911. [Google Scholar] [CrossRef] [PubMed]
- Seymour, C.W.; Liu, V.X.; Iwashyna, T.J.; Brunkhorst, F.M.; Rea, T.D.; Scherag, A.; Rubenfeld, G.; Kahn, J.M.; Shankar-Hari, M.; Singer, M.; et al. Assessment of Clinical Criteria for Sepsis: For the Third International Consensus Definitions for Sepsis and Septic Shock (Sepsis-3). JAMA 2016, 315, 762. [Google Scholar] [CrossRef] [PubMed] [Green Version]
- Satici, C.; Demirkol, M.A.; Sargin Altunok, E.; Gursoy, B.; Alkan, M.; Kamat, S.; Demirok, B.; Surmeli, C.D.; Calik, M.; Cavus, Z.; et al. Performance of Pneumonia Severity Index and CURB-65 in Predicting 30-Day Mortality in Patients with COVID-19. Int. J. Infect. Dis. 2020, 98, 84–89. [Google Scholar] [CrossRef] [PubMed]
- Holten, A.R.; Nore, K.G.; Tveiten, C.E.V.W.K.; Olasveengen, T.M.; Tonby, K. Predicting Severe COVID-19 in the Emergency Department. Resusc. Plus 2020, 4, 100042. [Google Scholar] [CrossRef]
- Wynants, L.; Van Calster, B.; Collins, G.S.; Riley, R.D.; Heinze, G.; Schuit, E.; Bonten, M.M.J.; Dahly, D.L.; Damen, J.A.; Debray, T.P.A.; et al. Prediction Models for Diagnosis and Prognosis of COVID-19: Systematic Review and Critical Appraisal. BMJ 2020, 369, m1328. [Google Scholar] [CrossRef] [Green Version]
- Ferreira, M.; Blin, T.; Collercandy, N.; Szychowiak, P.; Dequin, P.-F.; Jouan, Y.; Guillon, A. Critically Ill SARS-CoV-2-Infected Patients Are Not Stratified as Sepsis by the QSOFA. Ann. Intensive Care 2020, 10, 43. [Google Scholar] [CrossRef] [Green Version]
- Gidari, A.; De Socio, G.V.; Sabbatini, S.; Francisci, D. Predictive Value of National Early Warning Score 2 (NEWS2) for Intensive Care Unit Admission in Patients with SARS-CoV-2 Infection. Infect. Dis. 2020, 52, 698–704. [Google Scholar] [CrossRef]
- Jang, J.G.; Hur, J.; Hong, K.S.; Lee, W.; Ahn, J.H. Prognostic Accuracy of the SIRS, QSOFA, and NEWS for Early Detection of Clinical Deterioration in SARS-CoV-2 Infected Patients. J. Korean Med. Sci. 2020, 35, e234. [Google Scholar] [CrossRef]
- Myrstad, M.; Ihle-Hansen, H.; Tveita, A.A.; Andersen, E.L.; Nygård, S.; Tveit, A.; Berge, T. National Early Warning Score 2 (NEWS2) on Admission Predicts Severe Disease and in-Hospital Mortality from COVID-19—A Prospective Cohort Study. Scand. J. Trauma Resusc. Emerg. Med. 2020, 28, 66. [Google Scholar] [CrossRef] [PubMed]
- Sai, F.; Liu, X.; Li, L.; Ye, Y.; Zhu, C.; Hang, Y.; Huang, C.; Tian, L.; Huang, H.; Xu, X. Clinical Characteristics and Risk Factors for Mortality in Patients with Coronavirus Disease 2019 in Intensive Care Unit: A Single- Center, Retrospective, Observational Study in China. Ann. Palliat. Med. 2021, 10, 2859–2868. [Google Scholar] [CrossRef] [PubMed]
- Martín-Rodríguez, F.; Martín-Conty, J.L.; Sanz-García, A.; Rodríguez, V.C.; Rabbione, G.O.; Cebrían Ruíz, I.C.; Oliva Ramos, J.R.; Castro Portillo, E.; Polonio-López, B.; Enríquez de Salamanca Gambarra, R.; et al. Early Warning Scores in Patients with Suspected COVID-19 Infection in Emergency Departments. J. Pers. Med. 2021, 11, 170. [Google Scholar] [CrossRef] [PubMed]
- World Health Organization. WHO Coronavirus Disease (COVID-19)/Technical Guidance. Available online: https://www.who.int/emergencies/diseases/novel-coronavirus-2019/technical-guidance-publications (accessed on 28 January 2022).
- Republic of Turkey Ministry of Health. COVID-19 (SARS-CoV-2 Infection) Guide. Available online: https://covid19.saglik.gov.tr/TR-66926/eriskin-hasta-tedavisi.html (accessed on 28 January 2022).
- National Institutes of Health (NIH). Coronavirus Disease 2019 (COVID-19) Treatment Guidelines. Available online: http://www.covid19treatmentguidelines.nih.gov/overview/clinical-spectrum (accessed on 28 January 2022).
- Yang, R.; Li, X.; Liu, H.; Zhen, Y.; Zhang, X.; Xiong, Q.; Luo, Y.; Gao, C.; Zeng, W. Chest CT Severity Score: An Imaging Tool for Assessing Severe COVID-19. Radiol. Cardiothorac. Imaging 2020, 2, e200047. [Google Scholar] [CrossRef] [PubMed] [Green Version]
- Huang, C.; Wang, Y.; Li, X.; Ren, L.; Zhao, J.; Hu, Y.; Zhang, L.; Fan, G.; Xu, J.; Gu, X.; et al. Clinical Features of Patients Infected with 2019 Novel Coronavirus in Wuhan, China. Lancet 2020, 395, 497–506. [Google Scholar] [CrossRef] [Green Version]
- Xie, J.; Covassin, N.; Fan, Z.; Singh, P.; Gao, W.; Li, G.; Kara, T.; Somers, V.K. Association Between Hypoxemia and Mortality in Patients With COVID-19. Mayo Clin. Proc. 2020, 95, 1138–1147. [Google Scholar] [CrossRef]
- Cummings, M.J.; Baldwin, M.R.; Abrams, D.; Jacobson, S.D.; Meyer, B.J.; Balough, E.M.; Aaron, J.G.; Claassen, J.; Rabbani, L.E.; Hastie, J.; et al. Epidemiology, Clinical Course, and Outcomes of Critically Ill Adults with COVID-19 in New York City: A Prospective Cohort Study. Lancet 2020, 395, 1763–1770. [Google Scholar] [CrossRef]
- Petrilli, C.M.; Jones, S.A.; Yang, J.; Rajagopalan, H.; O’Donnell, L.; Chernyak, Y.; Tobin, K.A.; Cerfolio, R.J.; Francois, F.; Horwitz, L.I. Factors Associated with Hospital Admission and Critical Illness among 5279 People with Coronavirus Disease 2019 in New York City: Prospective Cohort Study. BMJ 2020, 369, m1966. [Google Scholar] [CrossRef]
- Rath, D.; Petersen-Uribe, Á.; Avdiu, A.; Witzel, K.; Jaeger, P.; Zdanyte, M.; Heinzmann, D.; Tavlaki, E.; Müller, K.; Gawaz, M.P. Impaired Cardiac Function Is Associated with Mortality in Patients with Acute COVID-19 Infection. Clin. Res. Cardiol. 2020, 109, 1491–1499. [Google Scholar] [CrossRef]
- Liang, W.; Liang, H.; Ou, L.; Chen, B.; Chen, A.; Li, C.; Li, Y.; Guan, W.; Sang, L.; Lu, J.; et al. Development and Validation of a Clinical Risk Score to Predict the Occurrence of Critical Illness in Hospitalized Patients With COVID-19. JAMA Intern. Med. 2020, 180, 1081. [Google Scholar] [CrossRef]
- Gao, J.; Zhong, L.; Wu, M.; Ji, J.; Liu, Z.; Wang, C.; Xie, Q.; Liu, Z. Risk Factors for Mortality in Critically Ill Patients with COVID-19: A Multicenter Retrospective Case-Control Study. BMC Infect. Dis. 2021, 21, 602. [Google Scholar] [CrossRef] [PubMed]
- Shi, Y.; Pandita, A.; Hardesty, A.; McCarthy, M.; Aridi, J.; Weiss, Z.F.; Beckwith, C.G.; Farmakiotis, D. Validation of Pneumonia Prognostic Scores in a Statewide Cohort of Hospitalised Patients with COVID-19. Int. J. Clin. Pract. 2021, 75, e13926. [Google Scholar] [CrossRef]
- Yuan, M.; Yin, W.; Tao, Z.; Tan, W.; Hu, Y. Association of Radiologic Findings with Mortality of Patients Infected with 2019 Novel Coronavirus in Wuhan, China. PLoS ONE 2020, 15, e0230548. [Google Scholar] [CrossRef] [Green Version]
- Gallo Marin, B.; Aghagoli, G.; Lavine, K.; Yang, L.; Siff, E.J.; Chiang, S.S.; Salazar-Mather, T.P.; Dumenco, L.; Savaria, M.C.; Aung, S.N.; et al. Predictors of COVID-19 Severity: A Literature Review. Rev. Med. Virol. 2021, 31, 1–10. [Google Scholar] [CrossRef] [PubMed]
- Artero, A.; Madrazo, M.; Fernández-Garcés, M.; Muiño Miguez, A.; González García, A.; Crestelo Vieitez, A.; García Guijarro, E.; Fonseca Aizpuru, E.M.; García Gómez, M.; Areses Manrique, M.; et al. Severity Scores in COVID-19 Pneumonia: A Multicenter, Retrospective, Cohort Study. J. Gen. Intern. Med. 2021, 36, 1338–1345. [Google Scholar] [CrossRef] [PubMed]
- The PROGRESS Study Group; Ahnert, P.; Creutz, P.; Horn, K.; Schwarzenberger, F.; Kiehntopf, M.; Hossain, H.; Bauer, M.; Brunkhorst, F.M.; Reinhart, K.; et al. Sequential Organ Failure Assessment Score Is an Excellent Operationalization of Disease Severity of Adult Patients with Hospitalized Community Acquired Pneumonia—Results from the Prospective Observational PROGRESS Study. Crit. Care 2019, 23, 110. [Google Scholar] [CrossRef] [PubMed] [Green Version]
- Asai, N.; Watanabe, H.; Shiota, A.; Kato, H.; Sakanashi, D.; Hagihara, M.; Koizumi, Y.; Yamagishi, Y.; Suematsu, H.; Mikamo, H. Efficacy and Accuracy of QSOFA and SOFA Scores as Prognostic Tools for Community-Acquired and Healthcare-Associated Pneumonia. Int. J. Infect. Dis. 2019, 84, 89–96. [Google Scholar] [CrossRef]
- Liu, D.; Cui, P.; Zeng, S.; Wang, S.; Feng, X.; Xu, S.; Li, R.; Gao, Y.; Yu, R.; Wang, Y.; et al. Risk Factors for Developing into Critical COVID-19 Patients in Wuhan, China: A Multicenter, Retrospective, Cohort Study. EClinicalMedicine 2020, 25, 100471. [Google Scholar] [CrossRef]
- Gupta, S.; Hayek, S.S.; Wang, W.; Chan, L.; Mathews, K.S.; Melamed, M.L.; Brenner, S.K.; Leonberg-Yoo, A.; Schenck, E.J.; Radbel, J.; et al. Factors Associated with Death in Critically Ill Patients with Coronavirus Disease 2019 in the US. JAMA Intern. Med. 2020, 180, 1436. [Google Scholar] [CrossRef]
- Shindo, Y.; Sato, S.; Maruyama, E.; Ohashi, T.; Ogawa, M.; Imaizumi, K.; Hasegawa, Y. Comparison of Severity Scoring Systems A-DROP and CURB-65 for Community-Acquired Pneumonia. Respirology 2008, 13, 731–735. [Google Scholar] [CrossRef]
- Kohno, S.; Seki, M.; Watanabe, A.; the CAP Study Group. Evaluation of an Assessment System for the JRS 2005: A-DROP for the Management of CAP in Adults. Intern. Med. 2011, 50, 1183–1191. [Google Scholar] [CrossRef] [PubMed] [Green Version]
- Miyashita, N.; Nakamori, Y.; Ogata, M.; Fukuda, N.; Yamura, A.; Ishiura, Y.; Nomura, S. A Warning Related to Predicting the Severity of COVID-19 Pneumonia Using the A-DROP Scoring System. J. Infect. Chemother. 2022, 28, 359–360. [Google Scholar] [CrossRef] [PubMed]
- Ucan, E.S.; Ozgen Alpaydin, A.; Ozuygur, S.S.; Ercan, S.; Unal, B.; Sayiner, A.A.; Ergan, B.; Gokmen, N.; Savran, Y.; Kilinc, O.; et al. Pneumonia Severity Indices Predict Prognosis in Coronavirus Disease-2019. Respir. Med. Res. 2021, 79, 100826. [Google Scholar] [CrossRef] [PubMed]
- Bradley, P.; Frost, F.; Tharmaratnam, K.; Wootton, D.G. Utility of Established Prognostic Scores in COVID-19 Hospital Admissions: Multicentre Prospective Evaluation of CURB-65, NEWS2 and QSOFA. BMJ Open Respir. Res. 2020, 7, e000729. [Google Scholar] [CrossRef]
- Grasselli, G.; Zangrillo, A.; Zanella, A.; Antonelli, M.; Cabrini, L.; Castelli, A.; Cereda, D.; Coluccello, A.; Foti, G.; Fumagalli, R.; et al. Baseline Characteristics and Outcomes of 1591 Patients Infected With SARS-CoV-2 Admitted to ICUs of the Lombardy Region, Italy. JAMA 2020, 323, 1574. [Google Scholar] [CrossRef] [Green Version]
- Covino, M.; De Matteis, G.; Burzo, M.L.; Russo, A.; Forte, E.; Carnicelli, A.; Piccioni, A.; Simeoni, B.; Gasbarrini, A.; Franceschi, F.; et al. Predicting In-Hospital Mortality in COVID-19 Older Patients with Specifically Developed Scores. J. Am. Geriatr. Soc. 2021, 69, 37–43. [Google Scholar] [CrossRef]
- Lazar Neto, F.; Marino, L.O.; Torres, A.; Cilloniz, C.; Meirelles Marchini, J.F.; Garcia de Alencar, J.C.; Palomeque, A.; Albacar, N.; Brandão Neto, R.A.; Souza, H.P.; et al. Community-Acquired Pneumonia Severity Assessment Tools in Patients Hospitalized with COVID-19: A Validation and Clinical Applicability Study. Clin. Microbiol. Infect. 2021, 27, e1–e1037. [Google Scholar] [CrossRef]
- Covino, M.; Sandroni, C.; Santoro, M.; Sabia, L.; Simeoni, B.; Bocci, M.G.; Ojetti, V.; Candelli, M.; Antonelli, M.; Gasbarrini, A.; et al. Predicting Intensive Care Unit Admission and Death for COVID-19 Patients in the Emergency Department Using Early Warning Scores. Resuscitation 2020, 156, 84–91. [Google Scholar] [CrossRef]
- CURB-65 plus Hypoalbuminemia: A New Score System for Prediction of the in-Hospital Mortality Risk in Patients with SARS-CoV-2 Pneumonia. Infez Med. 2021, 29, 408–415. [CrossRef]
- Kodama, T.; Obinata, H.; Mori, H.; Murakami, W.; Suyama, Y.; Sasaki, H.; Kouzaki, Y.; Kawano, S.; Kawana, A.; Mimura, S. Prediction of an Increase in Oxygen Requirement of SARS-CoV-2 Pneumonia Using Three Different Scoring Systems. J. Infect. Chemother. 2021, 27, 336–341. [Google Scholar] [CrossRef]
- Shi, S.; Liu, X.; Xiao, J.; Wang, H.; Chen, L.; Li, J.; Han, K. Prediction of Adverse Clinical Outcomes in Patients with Coronavirus Disease 2019. J. Clin. Lab. Anal. 2021, 35, e23598. [Google Scholar] [CrossRef] [PubMed]


| Non-Survivor Group (n: 133) | Survivors (n: 1378) | p | |
|---|---|---|---|
| Age, years | 72.8 ± 11.8 | 59.9 ± 14.7 | <0.001 |
| Male sex, n (%) 879 (58.17) | 80 (60.15) | 799 (58) | NS |
| Comorbidity no, % | <0.001 | ||
| 0 | 12 (9) | 420 (30.47) | |
| 1 (386, 25.54) | 17 (12.78) | 369 (26.77) | |
| ≥2 (693, 45.86) | 104 (78.19) | 589 (42.74) | |
| Comorbidities, n (%) | |||
| Hypertension, 726 (48.04) | 92 (69.6) | 634 (46.2) | <0.001 |
| Diabetes, 503 (33.28) | 52 (39.3) | 451(32.9) | NS |
| Coronary artery disease, 217 (14.36) | 41 (31) | 176 (12.8) | <0.001 |
| Atrial fibrillation, 85 (5.62) | 25 (18.79) | 60 (4.35) | <0.001 |
| Congestive heart failure, 91 (6.02) | 22 (16.54) | 69 (5) | <0.001 |
| Dyslipidemia, 73 (4.83) | 8 (6.01) | 65 (4.71) | NS |
| Cerebrovascular disease, 53 (3.5) | 14 (10.6) | 39 (2.8) | <0.001 |
| Chronic obstructive pulmonary disease, 62 (4.1) | 9 (6.8) | 53 (3.8) | NS |
| Asthma, 135 (8.93) | 12 (9) | 123 (8.9) | NS |
| Malignancy, 75 (4.96) | 13 (9.77) | 62 (4.49) | 0.01 |
| Chronic kidney disease, 67 (4.43) | 12 (9) | 55 (4) | 0.01 |
| Physical findings | |||
| Body temperature, °C | 36.95 ± 0.64 | 36.91 ± 0.67 | NS |
| Respiratory rate, per minute | 30.26 ± 4.64 | 20.08 ± 4.34 | <0.001 |
| SpO2, under oxygen support, mean | 92.95 ± 2.19 | 94.46 ± 1.90 | <0.001 |
| O2 support, L/per min | 15.77 ± 9.94 | 3.86 ± 5.88 | <0.001 |
| Systolic blood pressure, mmHg | 129.50 ± 22.28 | 126.51 ± 18.23 | NS |
| Diastolic blood pressure, mmHg | 70.14 ± 12.29 | 70.69 ± 10.28 | NS |
| Heart rate, per minute | 86.18 ± 20.58 | 82.68 ± 14.23 | 0.01 |
| Non-Survivor Group (n: 133) | Survivors (n: 1378) | p | |
|---|---|---|---|
| Laboratory findings | |||
| Neutrophil count, cells/mL | 6.87 ± 3.76 | 5.40 ± 2.89 | <0.001 |
| Lymphocytes count, cells/mL | 0.83 ± 0.56 | 1.21 ± 0.58 | <0.001 |
| N/L ratio (neutrophil/lymphocytes) | 11.52 ± 9.99 | 5.74 ± 5.05 | <0.001 |
| Platelet count, 103/mm3 | 215.30 ± 103.60 | 250.74 ± 105.14 | <0.001 |
| Hematocrit, % | 36.70 ± 5.58 | 37.52 ± 4.72 | NS |
| Glucose, mg/dL | 171.91 ± 73.92 | 151.46 ± 71.50 | 0.003 |
| Urea, mg/dL | 71.80 ± 48.31 | 39.94 ± 25.62 | <0.001 |
| Creatinine, mg/dL | 1.43 ± 1.54 | 0.94 ± 0.80 | <0.001 |
| Alanine transaminase, ALT, U/L | 35.17 ± 30.87 | 43.66 ± 39.94 | 0.01 |
| Aspartate aminotransferase, AST, U/L | 49.42 ± 35.30 | 42.82 ± 30.90 | 0.04 |
| Lactate dehydrogenase, LDH, U/L | 480.73 ± 226. 37 | 344.84 ± 155.73 | <0.001 |
| Potassium, mEq/L | 4.27 ± 0.60 | 4.22 ± 0.51 | NS |
| Sodium, mEq/L | 136.83 ± 5.70 | 137.19 ± 3.81 | NS |
| C-reactive protein, mg/L | 145.04 ± 78.54 | 101.63 ± 77.11 | <0.001 |
| Procalcitonin, ng/mL | 0.79 ± 2.28 | 0.69 ± 7.87 | NS |
| Ferritin, (µg/L) | 770.39 ± 693.89 | 502.60 ± 562.91 | <0.001 |
| D-dimer, (µg FEU/mL) | 1.32 ± 1.33 | 0.84 ± 1.21 | <0.001 |
| Fibrinogen, mg/dL | 545.66 ± 146.22 | 511.43 ± 134.19 | 0.01 |
| International normalized ratio, INR | 1.16 ± 0.29 | 1.06 ± 0.20 | <0.001 |
| Troponin I, ng/mL | 123.63 ± 449.44 | 18.49 ± 119.07 | <0.001 |
| Albumin, g/dL | 32.78 ± 5.10 | 35.93 ± 5.23 | <0.001 |
| Disease Severity Status n (%) | <0.001 | ||
| Moderate, 596 (39.44) | 3 (2.25) | 593(43.03) | |
| Severe, 915 (60.56) | 130 (97.75) | 785 (56.97) | |
| CT involvement n, (%) | <0.001 | ||
| Mild, 329 (21.77) | 13 (9.77) | 316 (22.93) | |
| Moderate, 727 (48.11) | 44 (33.8) | 683 (49.56) | |
| Severe, 455 (30.11) | 76 (56.43) | 379 (27.50) | |
| Outcomes, n (%) | |||
| Hospital length of stay, days | 14.52 ± 8.78 | 11.27 ± 6.50 | <0.001 |
| Admission to ICU, 164 (10.85) | 114 (85.71) | 50 (3.62) | <0.001 |
| Score, Mean ± SD | Non-Survivor Group | Survivors | p | |
|---|---|---|---|---|
| CURB-65 | Mean ± SD | 2.33 ± 1.05 | 0.75 ± 0.84 | <0.001 |
| Median (Q1–Q3) | 2 (2–3) | 1 (0–1) | ||
| Expanded CURB-65 | Mean ± SD | 4.18 ± 1.36 | 2.34 ± 1.85 | <0.001 |
| Median (Min–Max) | 4 (1–7) | 2 (0–6) | ||
| A-DROP | Mean ± SD | 2.56 ± 0.94 | 0.57 ± 0.78 | <0.001 |
| Median (Q1–Q3) | 3 (2–3) | 0 (0–1) | ||
| qSOFA | Mean ± SD | 1.41 ± 0.61 | 0.52 ± 0.61 | <0.001 |
| Median (Q1–Q3) | 1 (1–2) | 0 (0–1) | ||
| qCSI | Mean ± SD | 7.02 ± 2.03 | 2.75 ± 2.90 | <0.001 |
| Median (Q1–Q3) | 7 (6–9) | 2 (0–5) | ||
| PSI/PORT | Mean ± SD | 144.38 ± 28.64 | 67.17 ± 25.63 | <0.001 |
| Median (Q1–Q3) | 145 (124–168) | 62 (49–81) | ||
| NEWS2 | Mean ± SD | 8.29 ± 2.21 | 3.92 ± 2.71 | <0.001 |
| Median (Q1–Q3) | 8 (7–10) | 4 (2–6) | ||
| MEWS | Mean ± SD | 3.44 ± 1.20 | 1.69 ± 1.05 | <0.001 |
| Median (Q1–Q3) | 3 (3–4) | 2 (1–2) | ||
| 4C Mortality | Mean ± SD | 13.96 ± 3.45 | 7.77 ± 3.99 | <0.001 |
| Median (Min–Max) | 14 (3–20) | 8 (0–21) |
| Risk Scores | No of Patients n (%) | Death n (%) | ICU Admission n (%) | Death in ICU n (%) |
|---|---|---|---|---|
| CURB-65 | ||||
| 0–1 | 1114 (73.72) | 26 (1.72) | 53 (3.5) | 21 (1.38) |
| ≥2 | 397 (26.27) | 107 (7) | 111 (7.34) | 93 (6.16) |
| ≥3 | 100 (6.61) | 65 (4.3) | 66 (4.36) | 60 (3.97) |
| 4 | 17 (1.12) | 15 (0.99) | 15 (0.99) | 14 (0.92) |
| EXPANDED CURB-65 | ||||
| 0–1 | 402 (26.6) | 4 (0.26) | 8 (0.52) | 4 (0.26) |
| ≥2 | 1109 (73.09) | 129 (8.53) | 156 (10.32) | 110 (7.27) |
| ≥3 | 689 (45.59) | 118 (7.8) | 138 (9.13) | 102 (6.75) |
| ≥4 | 338 (22.36) | 94 (6.22) | 102 (6.75) | 81 (5.36) |
| A-DROP | ||||
| 0–1 | 1208 (79.94) | 21 (1.38) | 54 (3.57) | 20 (1.32) |
| ≥2 | 303 (20.05) | 112 (7.41) | 110 (7.27) | 94 (6.22) |
| ≥3 | 103 (6.81) | 75 (4.96) | 70 (4.63) | 65 (4.3) |
| PSI/PORT | ||||
| ≤70 (CLASS II) | 872 (57.71) | 0 | 8 (0.53) | 0 |
| 71–90 (CLASS III) | 282 (18.66) | 5 (0.33) | 12 (0.8) | 2 (0.13) |
| 91–130 (CLASS IV) | 242 (16) | 42 (2.77) | 57 (3.77) | 36 (2.38) |
| >130 (CLASS V) | 115 (7.61) | 86 (5.69) | 87 (5.75) | 76 (5) |
| ≥107 | 341 (22.56) | 122 (8.07) | 132 (8.73) | 108 (7.14) |
| MEWS | ||||
| 0–2 | 1175 (77.76) | 25 (1.65) | 42 (2.77) | 17 (1.12) |
| 3 | 336 (22.23) | 108 (7.14) | 122 (8.07) | 97 (6.41) |
| 3–4 | 289 (19.12) | 84 (5.55) | 95 (6.28) | 74 (4.89) |
| ≥5 | 47 (3.11) | 24 (1.58) | 27 (1.78) | 23 (1.52) |
| NEWS2 | ||||
| 0–4 | 801 (53) | 3 (0.19) | 12 (0.79) | 2 (0.13) |
| 5–6 | 339 (22.43) | 26 (1.72) | 30 (1.98) | 20 (1.32) |
| ≥6 | 547 (36.2) | 118 (7.8) | 136 (9) | 101 (6.68) |
| ≥7 | 371 (24.55) | 104 (6.88) | 122 (8) | 92 (6) |
| qCSI | ||||
| ≤3 | 741 (49) | 8 (0.52) | 13 (0.86) | 4 (0.26) |
| 4–6 | 544 (36) | 31 (2) | 37 (2.44) | 24 (1.58) |
| ≥6 | 439 (29) | 114 (7.54) | 135 (8.93) | 103 (6.81) |
| 7–9 | 222 (14.69) | 93 (6.15) | 110 (7.27) | 85 (5.6) |
| 10–12 | 4 (0.26) | 1 (0.06) | 4 (0.26) | 1 (0.06) |
| 4C MORTALITY | ||||
| 0–3 | 223 (14.75) | 1 (0.06) | 2 (0.13) | 0 |
| 4–8 | 589 (38.98) | 8 (0.53) | 20 (1.32) | 7 (0.46) |
| 9–14 | 573 (37.92) | 49 (3.2) | 79 (5.22) | 49 (3.2) |
| ≥15 | 126 (8.33) | 66 (4.36) | 63 (4.16) | 58 (3.83) |
| ≥12 | 363 (24) | 109 (7.21) | 112 (7.41) | 94 (6.22) |
| qSOFA | ||||
| 0 | 751 (49.7) | 4 (0.26) | 14 (0.92) | 2 (0.13) |
| 1 | 629 (41.6) | 77 (5) | 96 (6.35) | 67 (4.43) |
| 2 | 117 (7.74) | 46 (3) | 47 (3.11) | 40 (82.64) |
| 3 | 14 (0.92) | 6 (0.39) | 7 (0.46) | 5 (0.33) |
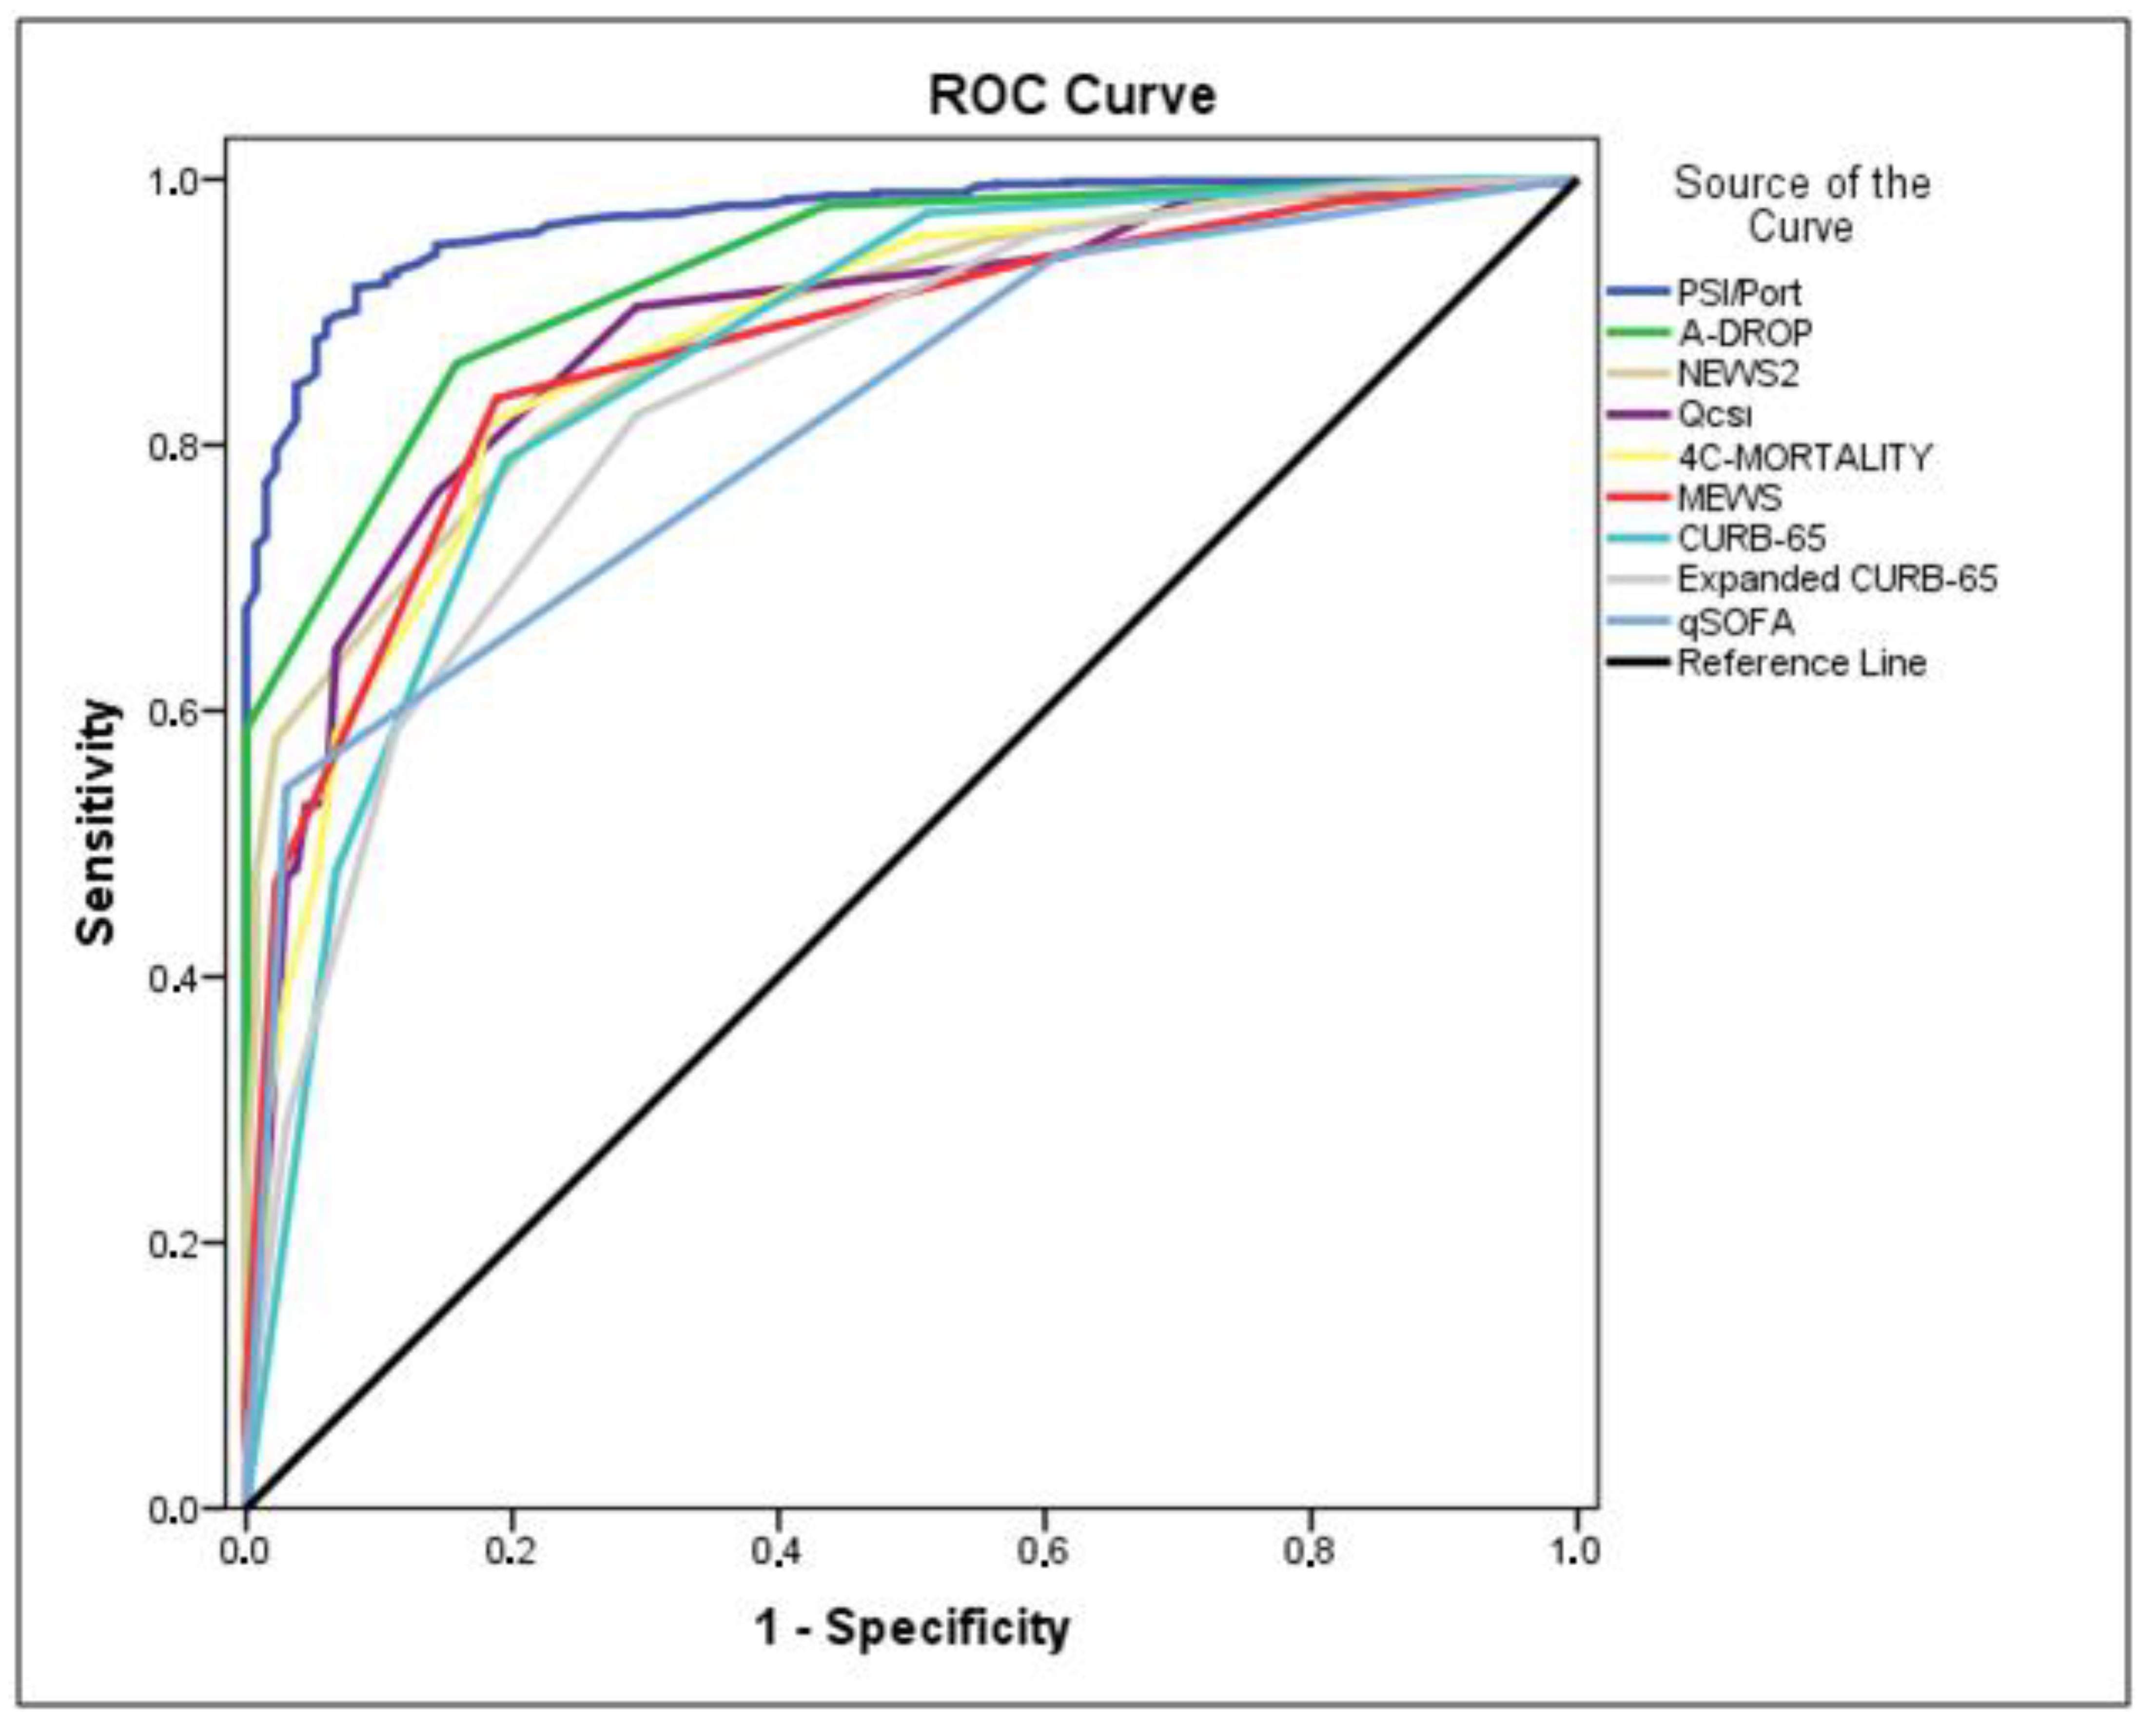
| Scores | AUROC (95% CI) | Std. Error | Cutoff | Se (%) | Sp (%) | PPV | NPV | p |
|---|---|---|---|---|---|---|---|---|
| PSI/PORT | 0.971 (0.961–0.981) | 0.005 | ≥107 | 91.7 | 91.9 | 52,1 | 99.1 | <0.001 |
| A-DROP | 0.929 (0.911–0.948) | 0.009 | ≥2 | 84.2 | 86.1 | 37.0 | 98.3 | <0.001 |
| NEWS2 | 0.885 (0.860–0.909) | 0.012 | ≥7 | 78.2 | 80.6 | 28.0 | 97.5 | <0.001 |
| qCSI | 0.882 (0.853–0.911) | 0.015 | ≥6 | 85.7 | 76.4 | 26.0 | 98.2 | <0.001 |
| 4C-MORTALITY | 0.875 (0.845–0.906) | 0.016 | ≥12 | 81.9 | 81.6 | 30.0 | 97.9 | <0.001 |
| MEWS | 0.870 (0.842–0.898) | 0.014 | ≥3 | 81.2 | 83.5 | 32.1 | 97.9 | <0.001 |
| CURB-65 | 0.859 (0.823–0.896) | 0.019 | ≥2 | 80.5 | 78.9 | 27.0 | 97.7 | <0.001 |
| EXPANDED CURB-65 | 0.836 (0.800–0.873) | 0.018 | ≥4 | 70.7 | 82.3 | 27.8 | 96.7 | <0.001 |
| qSOFA | 0.818 (0.786–0.850) | 0.016 | ≥1 | 97.0 | 54.2 | 17.0 | 99.5 | <0.001 |
| p | Odds Ratio | %95 CI | ||
|---|---|---|---|---|
| Lower | Upper | |||
| PSI/PORT (≥107) | 0.001 ** | 25.172 | 11.232 | 56.413 |
| A-DROP (≥2) | 0.001 ** | 4.686 | 2.303 | 9.532 |
| MEWS (≥3) | 0.009 ** | 2.458 | 1.255 | 4.814 |
| qSOFA (≥1) | 0.003 ** | 5.714 | 1.774 | 18.399 |
| O2 support, L/per min | 0.001 ** | 1.065 | 1.027 | 1.105 |
| Platelet count, PLT, 103/mm3 | 0.024 * | 0.997 | 0.995 | 1.000 |
| C-reactive protein, CRP, mg/L | 0.046 * | 0.996 | 0.992 | 1.000 |
| Lactate dehydrogenase, LDH, U/L | 0.002 ** | 1.003 | 1.001 | 1.004 |
| Constant | 0.001 ** | 0.001 | ||
Publisher’s Note: MDPI stays neutral with regard to jurisdictional claims in published maps and institutional affiliations. |
© 2022 by the authors. Licensee MDPI, Basel, Switzerland. This article is an open access article distributed under the terms and conditions of the Creative Commons Attribution (CC BY) license (https://creativecommons.org/licenses/by/4.0/).
Share and Cite
Kibar Akilli, I.; Bilge, M.; Uslu Guz, A.; Korkusuz, R.; Canbolat Unlu, E.; Kart Yasar, K. Comparison of Pneumonia Severity Indices, qCSI, 4C-Mortality Score and qSOFA in Predicting Mortality in Hospitalized Patients with COVID-19 Pneumonia. J. Pers. Med. 2022, 12, 801. https://doi.org/10.3390/jpm12050801
Kibar Akilli I, Bilge M, Uslu Guz A, Korkusuz R, Canbolat Unlu E, Kart Yasar K. Comparison of Pneumonia Severity Indices, qCSI, 4C-Mortality Score and qSOFA in Predicting Mortality in Hospitalized Patients with COVID-19 Pneumonia. Journal of Personalized Medicine. 2022; 12(5):801. https://doi.org/10.3390/jpm12050801
Chicago/Turabian StyleKibar Akilli, Isil, Muge Bilge, Arife Uslu Guz, Ramazan Korkusuz, Esra Canbolat Unlu, and Kadriye Kart Yasar. 2022. "Comparison of Pneumonia Severity Indices, qCSI, 4C-Mortality Score and qSOFA in Predicting Mortality in Hospitalized Patients with COVID-19 Pneumonia" Journal of Personalized Medicine 12, no. 5: 801. https://doi.org/10.3390/jpm12050801
APA StyleKibar Akilli, I., Bilge, M., Uslu Guz, A., Korkusuz, R., Canbolat Unlu, E., & Kart Yasar, K. (2022). Comparison of Pneumonia Severity Indices, qCSI, 4C-Mortality Score and qSOFA in Predicting Mortality in Hospitalized Patients with COVID-19 Pneumonia. Journal of Personalized Medicine, 12(5), 801. https://doi.org/10.3390/jpm12050801