
Tumor Volume Regression during and after Radiochemotherapy: A Macroscopic Description


Abstract
1. Introduction
- in a transplantable rat tumor, it was shown that control and regrowth curves could be fitted by the same Gompertzian law [15];
2. Materials and Methods
2.1. Macroscopic Growth Law and Carrying Capacity: General Formulas
2.2. Carrying Capacity and Radiotherapy
2.3. Experimental Settings and Data Collection
2.4. Regression during and after Preoperative Radiochemotherapy for Rectal Cancer
3. Results
4. Discussion
5. Conclusions
Author Contributions
Funding
Institutional Review Board Statement
Informed Consent Statement
Data Availability Statement
Acknowledgments
Conflicts of Interest
Abbreviations
| GL | Gompertz Law |
| RT | Radiation Therapy |
| CC | Carrying Capacity |
| GTV | Gross Tumor Volume |
| MRI | Magnetic Resonance Imaging |
| PR | Partial Recovery |
| CR | Complete recovery |
| NT | No Treatment |
| LL | Logistic Law |
Appendix A
References
- Siegel, R.L.; Miller, K.D.; Fuchs, H.E.; Jemal, A. Cancer statistics, 2022. CA Cancer J. Clin. 2022, 72, 7–33. [Google Scholar] [CrossRef] [PubMed]
- Thomas, M.; Rübe, C.; Hoffknecht, P.; Macha, H.N.; Freitag, L.; Linder, A.; Willich, N.; Hamm, M.; Sybrecht, G.W.; Ukena, D.; et al. Effect of preoperative chemoradiation in addition to preoperative chemotherapy: A randomised trial in stage III non-small-cell lung cancer. Lancet Oncol. 2008, 9, 636–648. [Google Scholar] [CrossRef]
- Albain, K.S.; Rusch, V.W.; Crowley, J.J.; Rice, T.W.; Turrisi, A.T., 3rd; Weick, J.K.; Lonchyna, V.A.; Presant, C.A.; McKenna, R.J.; Gandara, D.R. Concurrent cisplatin/etoposide plus chest radiotherapy followed by surgery for stages IIIA (N2) and IIIB non-small-cell lung cancer: Mature results of Southwest Oncology Group phase II study 8805. J. Clin. Oncol. 1995, 13, 1880–1892. [Google Scholar] [PubMed]
- Choi, N.C.; Carey, R.W.; Daly, W.; Mathisen, D.; Wain, J.; Wright, C.; Lynch, T.; Grossbard, M.; Grillo, H. Potential impact on survival of improved tumor downstaging and resection rate by preoperative twice-daily radiation and concurrent chemotherapy in stage IIIA non-small-cell lung cancer. J. Clin. Oncol. 1997, 15, 712–722. [Google Scholar] [CrossRef]
- Spolverato, G.; Pucciarelli, S.; Bertorelle, R.; Rossi, A.D.; Nitti, D. Predictive factors of the response of rectal cancer to neoadjuvant radiochemotherapy. Cancers 2011, 3, 2176–2194. [Google Scholar] [CrossRef]
- Baskar, R.; Dai, J.; Wenlong, N.; Yeo, R.; Yeoh, K.W. Biological response of cancer cells to radiation treatment. Front. Mol. Biosci. 2014, 1, 24. [Google Scholar] [CrossRef]
- Fleming, F.; Påhlman, L.; Monson, J. Neoadjuvant therapy in rectal cancer. Dis. Colon Rectum 2011, 54, 901–902. [Google Scholar] [CrossRef]
- Hahnfeldt, P.; Panigrahy, D.; Folkman, J.; Hlatky, L. Tumor development under angiogenic signaling: A dynamical theory of tumor growth, treatment response, and postvascular dormancy. Cancer Res. 1999, 59, 4770–4775. [Google Scholar]
- Steel, G.G. Growth Kinetics of Tumours; Clarendon Press: Oxford, UK, 1977. [Google Scholar]
- Wheldon, T.E. Mathematical Models in Cancer Research; Adam Hilger Publisher: Bristol, UK, 1988. [Google Scholar]
- Norton, L. A Gompertzian model of human breast cancer growth. Cancer Res. 1988, 48, 7067–7071. [Google Scholar]
- Yorke, E.; Fuks, Z.; Norton, L.; Whitmore, W.; Ling, C.C. Modeling the development of metastases from primary and locally recurrent tumors: Comparison with a clinical data base for prostatic cancer. Cancer Res. 1993, 53, 2987–2993. [Google Scholar]
- Vaghi, C.; Rodallec, A.; Fanciullino, R.; Ciccolini, J.; Mochel, J.P.; Mastri, M.; Benzekry, S. Population modeling of tumor growth curves and the reduced Gompertz model improve prediction of the age of experimental tumors. PLoS Comput. Biol. 2020, 16, e1007178. [Google Scholar] [CrossRef] [PubMed]
- Gompertz, B. On the nature of the function expressive of the law of human mortality and a new mode of determining life contingencies. Philos. Trans. R. Soc. 1825, 115, 513–583. [Google Scholar]
- Jung, H.; Kruger, H.J.; Brammer, I.; Zywietz, F.; Beck-Bomholdt, H.P. Cell population kinetics of the rhabdomyosarcoma R1H of the rat after single doses of X rays. Int. J. Radiat. Biol. 1990, 57, 567–589. [Google Scholar] [CrossRef] [PubMed]
- Hansen, O.; Grau, C.; Bentzen, S.M.; Overgaard, J. Repopulation in the SCCVII squamous cell carcinoma assessed by an in vivo-in vitro excision essay. Radioth. Oncol. 1996, 32, 137–144. [Google Scholar] [CrossRef]
- O’Donoghue, J.A. The response of tumours with Gompertzian growth characteristics to fractionated radiotherapy. Int. J. Radiat. Biol. 1997, 72, 325–339. [Google Scholar] [CrossRef]
- Norton, L.; Simon, R. Tumor size, sensitivity to therapy and the design of treatment protocols. Cancer Treat. Rep. 1976, 61, 1307–1317. [Google Scholar]
- Norton, L.; Simon, R. The Norton-Simon hypothesis revisited. Cancer Treat. Rep. 1986, 70, 163–169. [Google Scholar]
- Dzutsev, A.; Goldszmid, R.S.; Viaud, S.; Zitvogel, L.; Trinchieri, G. The role of the microbiota in inflammation, carcinogenesis, and cancer therapy. Eur. J. Immunol. 2015, 45, 17–31. [Google Scholar] [CrossRef]
- Serna, G.; Ruiz-Pace, F.; Hernando, J.; Alonso, L.; Fasani, R.; Landolfi, S.; Comas, R.; Jimenez, J.; Elez, E.; Bullman, S.; et al. Fusobacterium nucleatum persistence and risk of recurrence after preoperative treatment in locally advanced rectal cancer. Ann. Oncol. 2020, 31, 1366–1375. [Google Scholar] [CrossRef]
- Yi, Y.; Shen, L.; Shi, W.; Xia, F.; Zhang, H.; Wang, Y.; Zhang, J.; Wang, Y.; Sun, X.; Zhang, Z.; et al. Gut Microbiome Components Predict Response to Neoadjuvant Chemoradiotherapy in Patients with Locally Advanced Rectal Cancer: A Prospective, Longitudinal Study. Clin. Cancer Res. 2021, 27, 1329–1340. [Google Scholar] [CrossRef]
- Amugongo, L.; Green, A.; Cobben, D.; van Herk, M.; McWilliam, A.; Osorio, E. Identification of modes of tumor regression in non-small cell lung cancer patients during radiotherapy. Med. Phys. 2022, 49, 370–381. [Google Scholar] [CrossRef] [PubMed]
- Dahlberg, W.; Azzam, E.; Yu, Y.; Little, J. Response of human tumor cells of varying radiosensitivity and radiocurability to fractionated irradiation. Cancer Res. 1999, 59, 5365–5369. [Google Scholar] [PubMed]
- Lewin, T.D.; Byrne, H.M.; Maini, P.K.; Caudell, J.J.; Moros, E.G.; Enderling, H. The importance of dead material within a tumour on the dynamics in response to radiotherapy. Phys. Med. Biol. 2020, 65, 015007. [Google Scholar] [CrossRef] [PubMed]
- Zahid, M.U.; Mohsin, N.; Mohamed, A.S.; Caudell, J.J.; Harrison, L.B.; Fuller, C.D.; Moros, E.G.; Enderling, H. Forecasting Individual Patient Response to Radiotherapy in Head and Neck Cancer with a Dynamic Carrying Capacity Model. Int. J. Radiat. Oncol. Biol. Phys. 2021, 111, 693–704. [Google Scholar] [CrossRef]
- Castorina, P.; Castorina, L.; Ferini, G. Non-Homogeneous Tumor Growth and Its Implications for Radiotherapy: A Phenomenological Approach. J. Pers. Med. 2021, 11, 527. [Google Scholar] [CrossRef]
- Ferini, G.; Valenti, V.; Tripoli, A.; Illari, S.I.; Molino, L.; Parisi, S.; Cacciola, A.; Lillo, S.; Giuffrida, D.; Pergolizzi, S. Lattice or oxygen-guided radiotherapy: What if they converge? Possible future directions in the era of immunotherapy. Cancers 2021, 13, 3290. [Google Scholar] [CrossRef]
- Ferini, G.; Castorina, P.; Valenti, V.; Illari, S.; Sachpazidis, I.; Castorina, L.; Marrale, M.; Pergolizzi, S. A Novel Radiotherapeutic Approach to Treat Bulky Metastases Even From Cutaneous Squamous Cell Carcinoma: Its Rationale and a Look at the Reliability of the Linear-Quadratic Model to Explain Its Radiobiological Effects. Front. Oncol. 2022, 12, 809279. [Google Scholar] [CrossRef]
- El-Benhawy, S.; Sadek, N.; Kamel, M.; Sharaf, A.; Abderhman, I.; Morsi, M.; Abobakr, A. Study the relationship of endothelial damage / dysfunction due to occupational exposure to low dose ionizing radiation versus high dose exposure during radiotherapy. Cancer Treat. Res. Commun. 2020, 25, 100215. [Google Scholar] [CrossRef]
- Vadalà, R.; Santacaterina, A.; Sindoni, A.; Platania, A.; Arcudi, A.; Ferini, G.; Mazzei, M.; Marletta, D.; Rifatto, C.; Risoleti, E.; et al. Stereotactic body radiotherapy in non-operable lung cancer patients. Clin. Transl. Oncol. 2016, 18, 1158–1159. [Google Scholar] [CrossRef]
- Parisi, S.; Ferini, G.; Cacciola, A.; Lillo, S.; Tamburella, C.; Santacaterina, A.; Bottari, A.; Brogna, A.; Ferrantelli, G.; Pontoriero, A.; et al. A non-surgical COMBO-therapy approach for locally advanced unresectable pancreatic adenocarcinoma: Preliminary results of a prospective study. Radiol. Medica 2022, 127, 214–219. [Google Scholar] [CrossRef]
- Mattonen, S.; Ward, A.; Palma, D. Pulmonary imaging after stereotactic radiotherapy-does RECIST still apply? Br. J. Radiol. 2016, 89, 20160113. [Google Scholar] [CrossRef] [PubMed]
- Mattonen, S.; Huang, K.; Ward, A.; Senan, S.; Palma, D. New techniques for assessing response after hypofractionated radiotherapy for lung cancer. J. Thorac. Dis. 2014, 6, 375–386. [Google Scholar] [PubMed]
- Castorina, P.; Delsanto, P.P.; Guiot, C. Classification Scheme for Phenomenological Universalities in Growth Problems in Physics and Other Sciences. Phys. Rev. Lett. 2006, 96, 188701. [Google Scholar] [CrossRef] [PubMed]
- Castorina, P.; Blanchard, P. Unified approach to growth and aging in biological, technical and biotechnical systems. SpringerPlus 2012, 1, 7. [Google Scholar] [CrossRef][Green Version]
- Meyer, P.S.; Ausubel, J.H. Carrying Capacity: A Model with Logistically Varying Limits. Technol. Forecast. Soc. Chang. 1999, 61, 209–214. [Google Scholar] [CrossRef]
- Royama, T. Analytical Population Dynamics; Springer Science & Business Media: Berlin/Heidelberg, Germany, 2012; Volume 10. [Google Scholar]
- Begin, R.; Kleijnen, J.P.; Engels, B.; Philippens, M.; Asselen, B.; Raaymakers, B.; Reerink, O.; Ridder, M.; Intven, M. Tumor volume regression during preoperative chemoradiotherapy for rectal cancer: A prospective observational study with weekly MRI. Acta Oncol. 2018, 57, 723–727. [Google Scholar] [CrossRef]
- Bostel, T.; Dreher, C.; Wollschläger, D.; Mayer, A.; König, F.; Bickelhaupt, S.; Schlemmer, H.; Huber, P.; Sterzing, F.; Bäumer, P.; et al. Exploring MR regression patterns in rectal cancer during neoadjuvant radiochemotherapy with daily T2- and diffusion-weighted MRI. Radiat. Oncol. 2020, 15, 171. [Google Scholar] [CrossRef]
- Puglisi, C.; Giuffrida, R.; Borzì, G.; Mattia, P.D.; Costa, A.; Colarossi, C.; Deiana, E.; Picardo, M.; Colarossi, L.; Mare, M.; et al. Radiosensitivity of Cancer Stem Cells Has Potential Predictive Value for Individual Responses to Radiotherapy in Locally Advanced Rectal Cancer. Cancers 2020, 12, 3672. [Google Scholar] [CrossRef]


| Cell Line/Dose | Day | + 15 Days | + 30 Days |
|---|---|---|---|
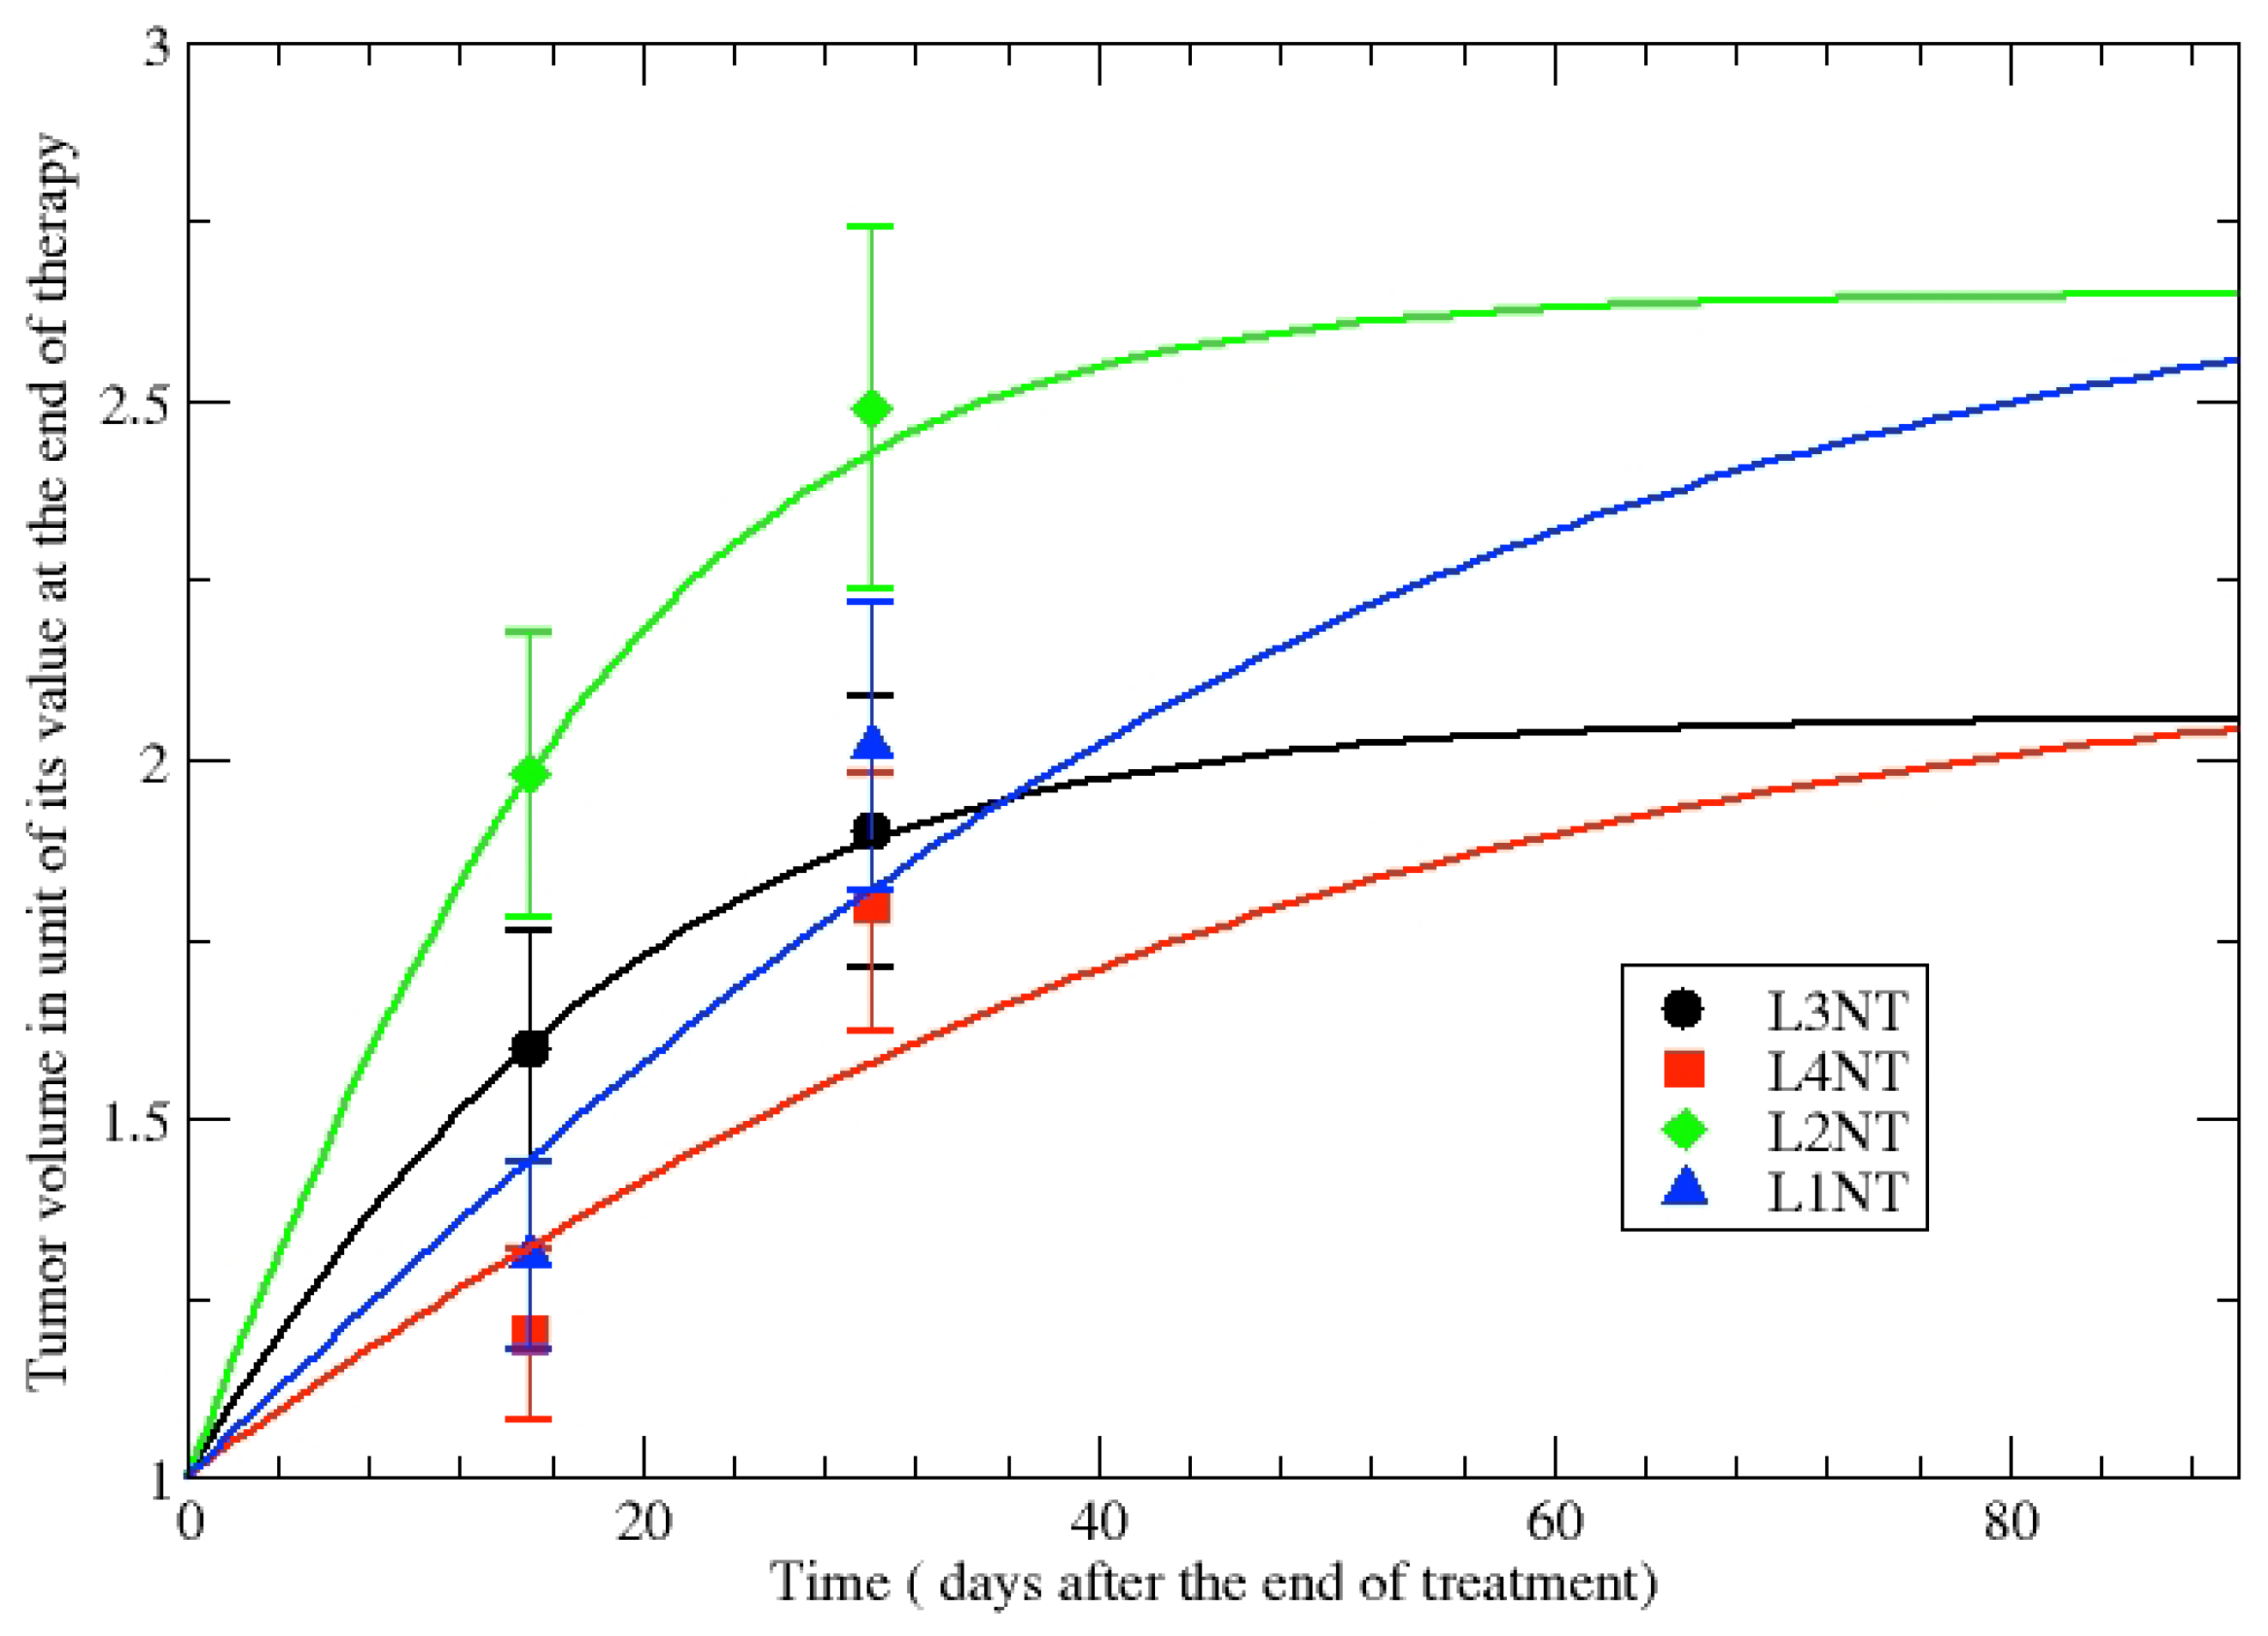
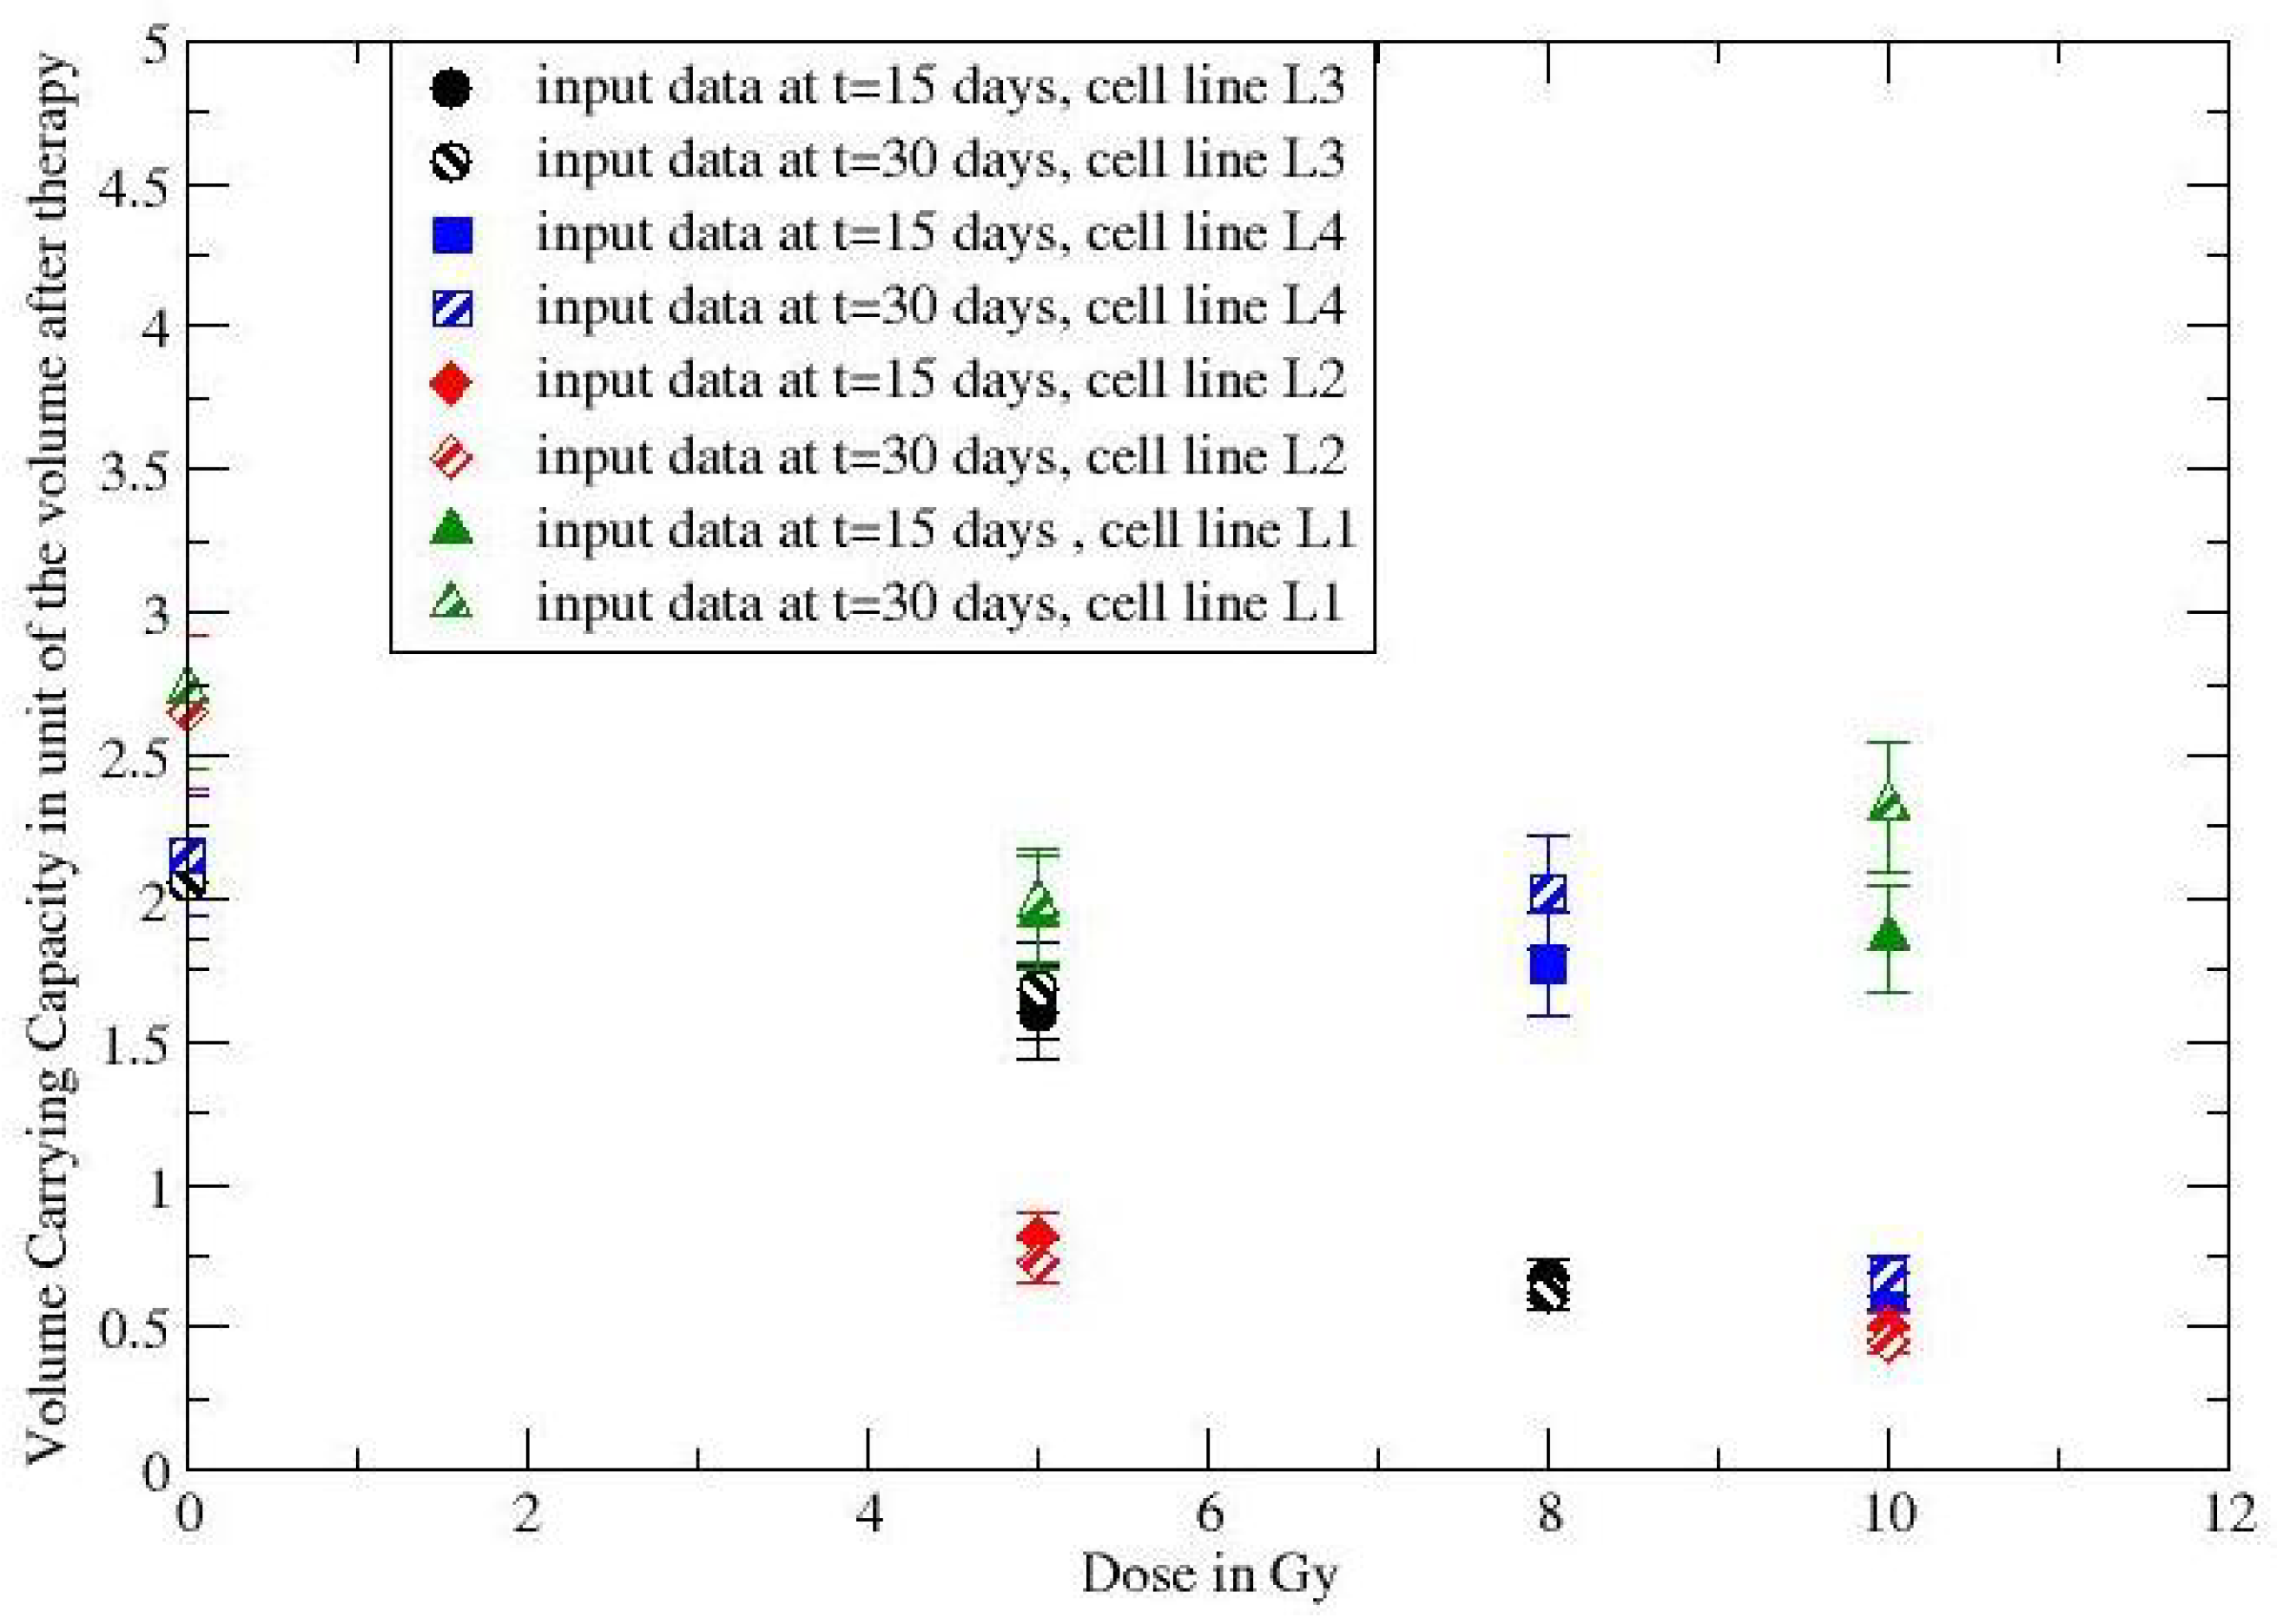
| L3-NT | 1 | 1.6 | 1.9 |
| L3-5Gy | 1 | 1.36 | 1.58 |
| L3-8Gy | 1 | 0.77 | 0.66 |
| L4-NT | 1 | 1.2 | 1.81 |
| L4-8Gy | 1 | 1.23 | 1.79 |
| L4-10Gy | 1 | 0.85 | 0.8 |
| L2-NT | 1 | 1.98 | 2.49 |
| L2-5Gy | 1 | 0.87 | 0.75 |
| L2-10Gy | 1 | 0.62 | 0.49 |
| L1-NT | 1 | 1.32 | 2.02 |
| L1-5Gy | 1 | 1.27 | 1.51 |
| L1-10Gy | 1 | 1.25 | 1.65 |
| Cell Line | in cm | k in Day |
|---|---|---|
| L3-NT | 2.06 | 0.07 |
| L4-NT | 2.15 | 0.03 |
| L2-NT | 2.65 | 0.08 |
| L1-NT | 2.73 | 0.03 |
| Patient | k per Day | per Day | |
|---|---|---|---|
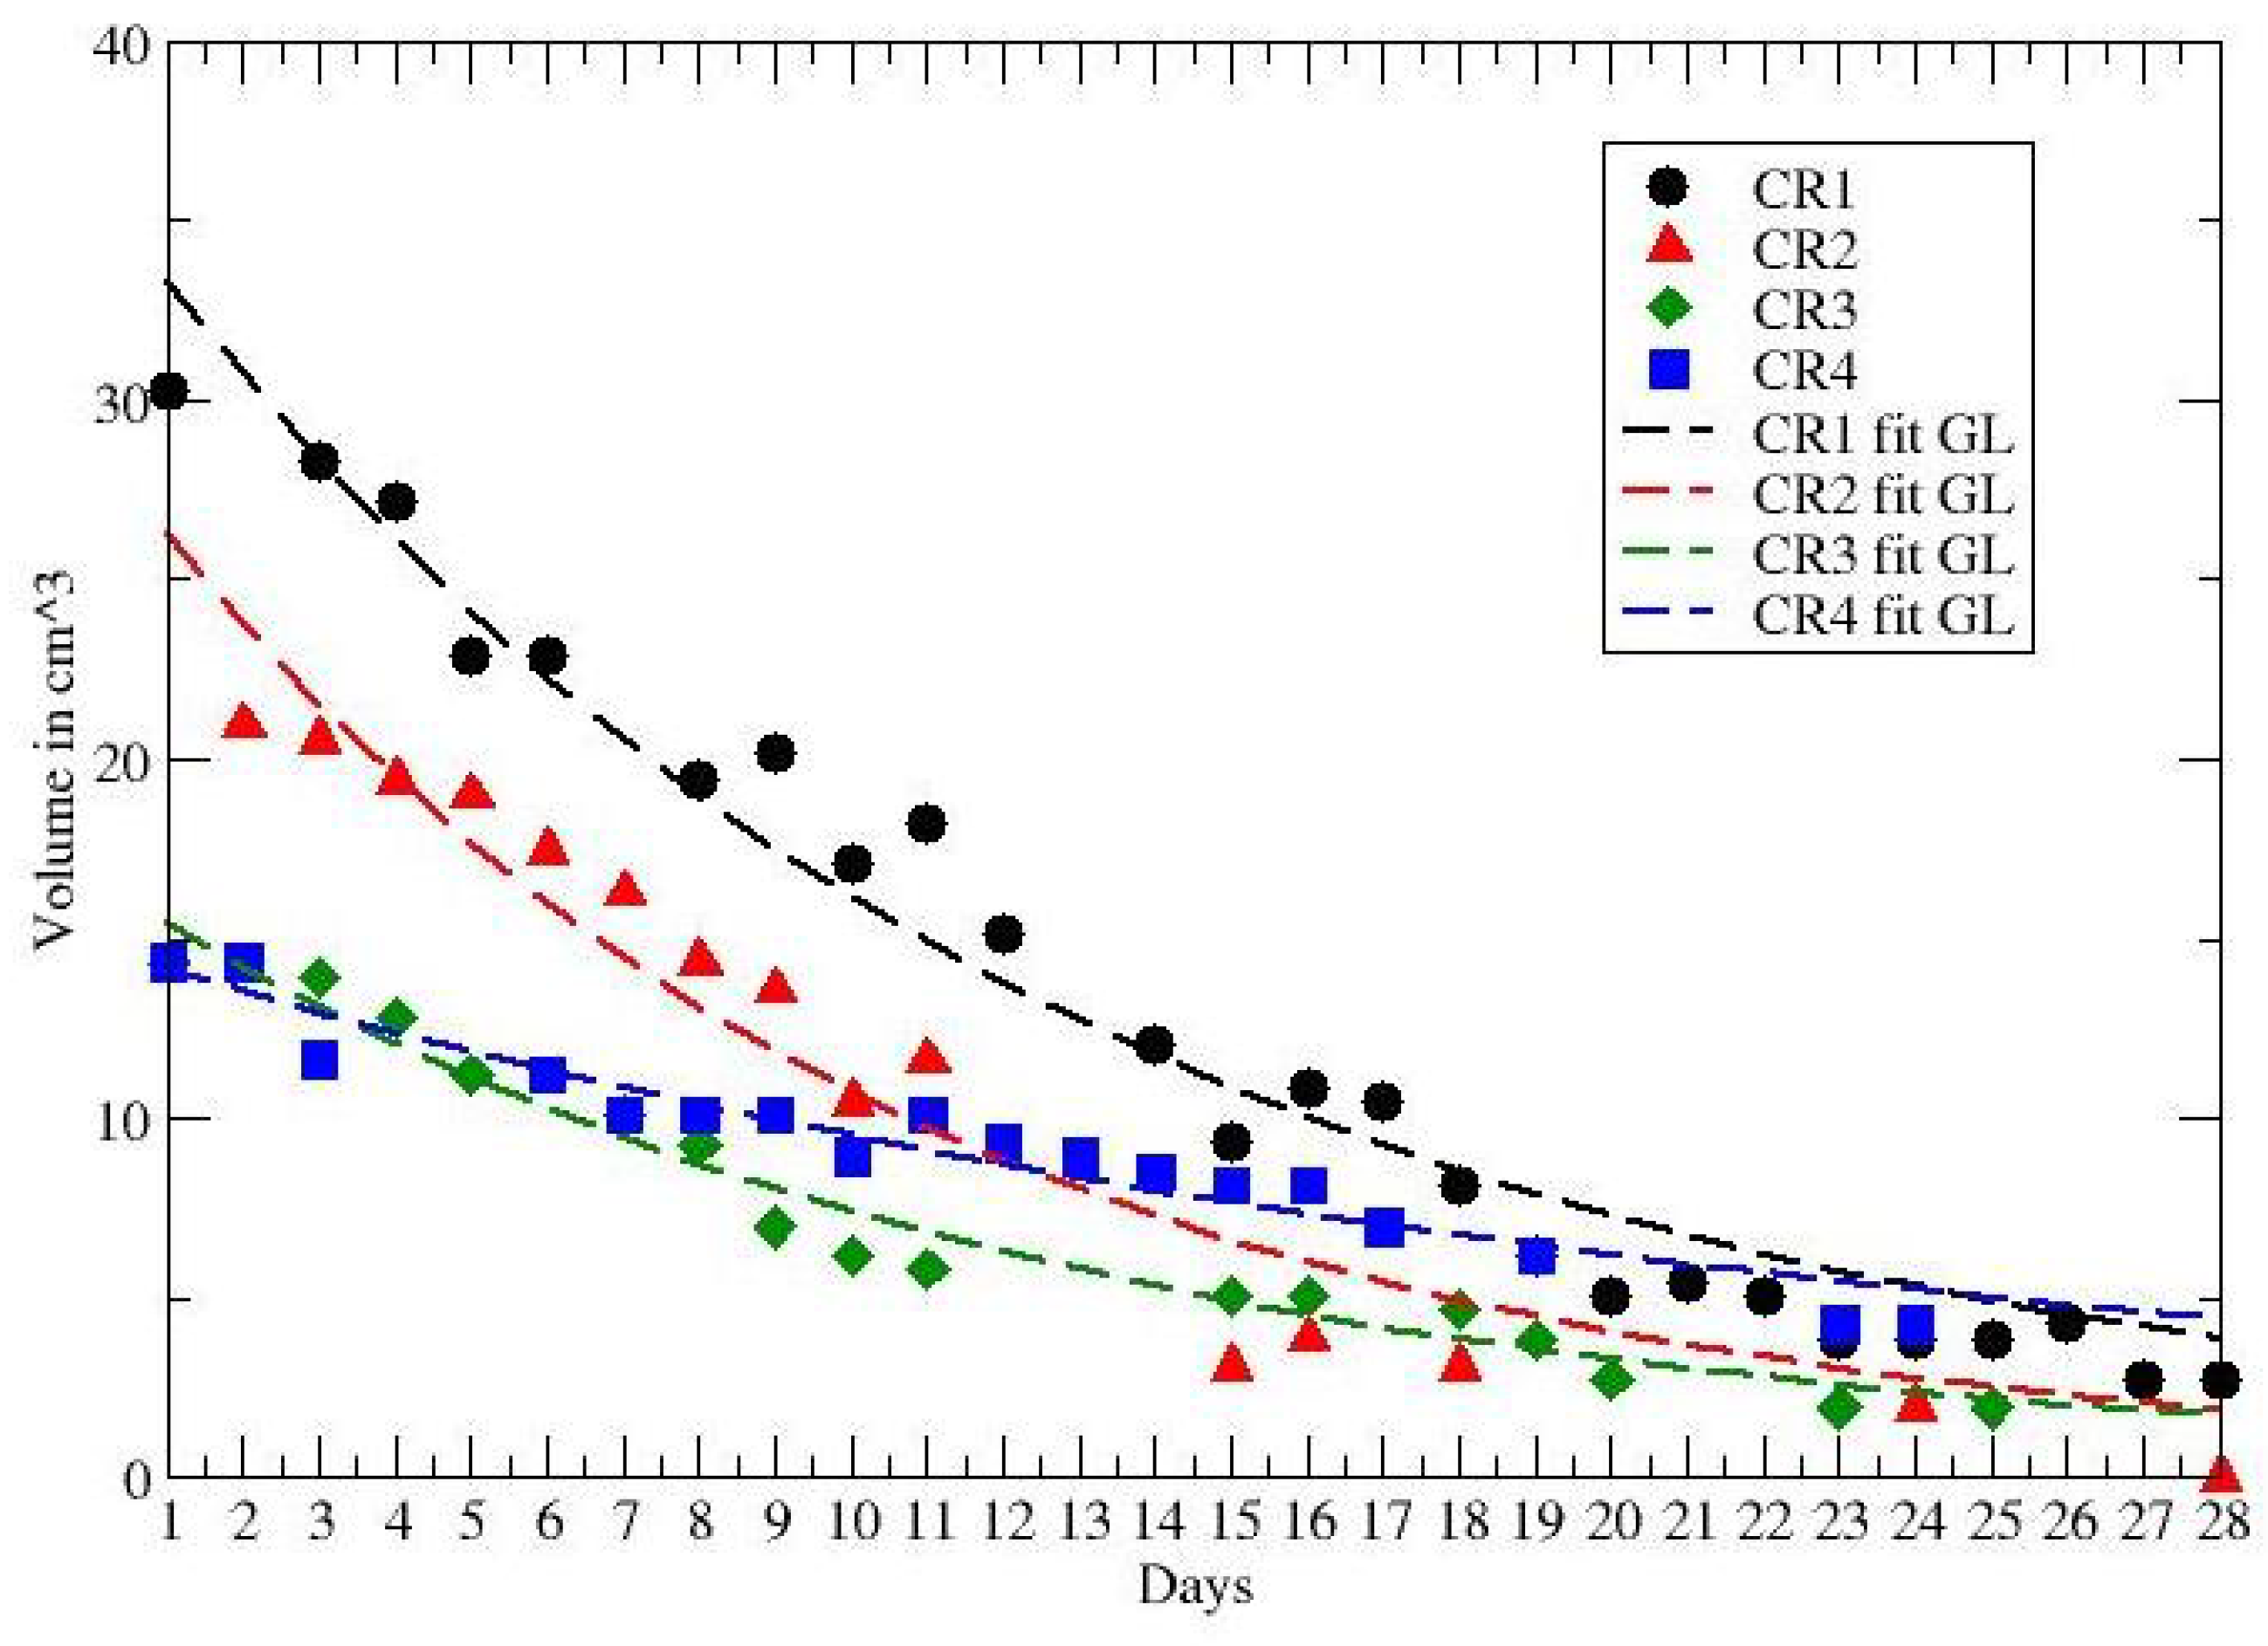
| CR1 | <0.0896 | <0.0335 | 0.0808 * |
| CR2 | ≃ | ≃0.006 | 0.1 * |
| CR3 | <0.135 | >0.041 | 0.0828 * |
| CR4 | <0.075 | >0.064 | 0.0426 |
| Patient | k per Day | per Day | |
|---|---|---|---|
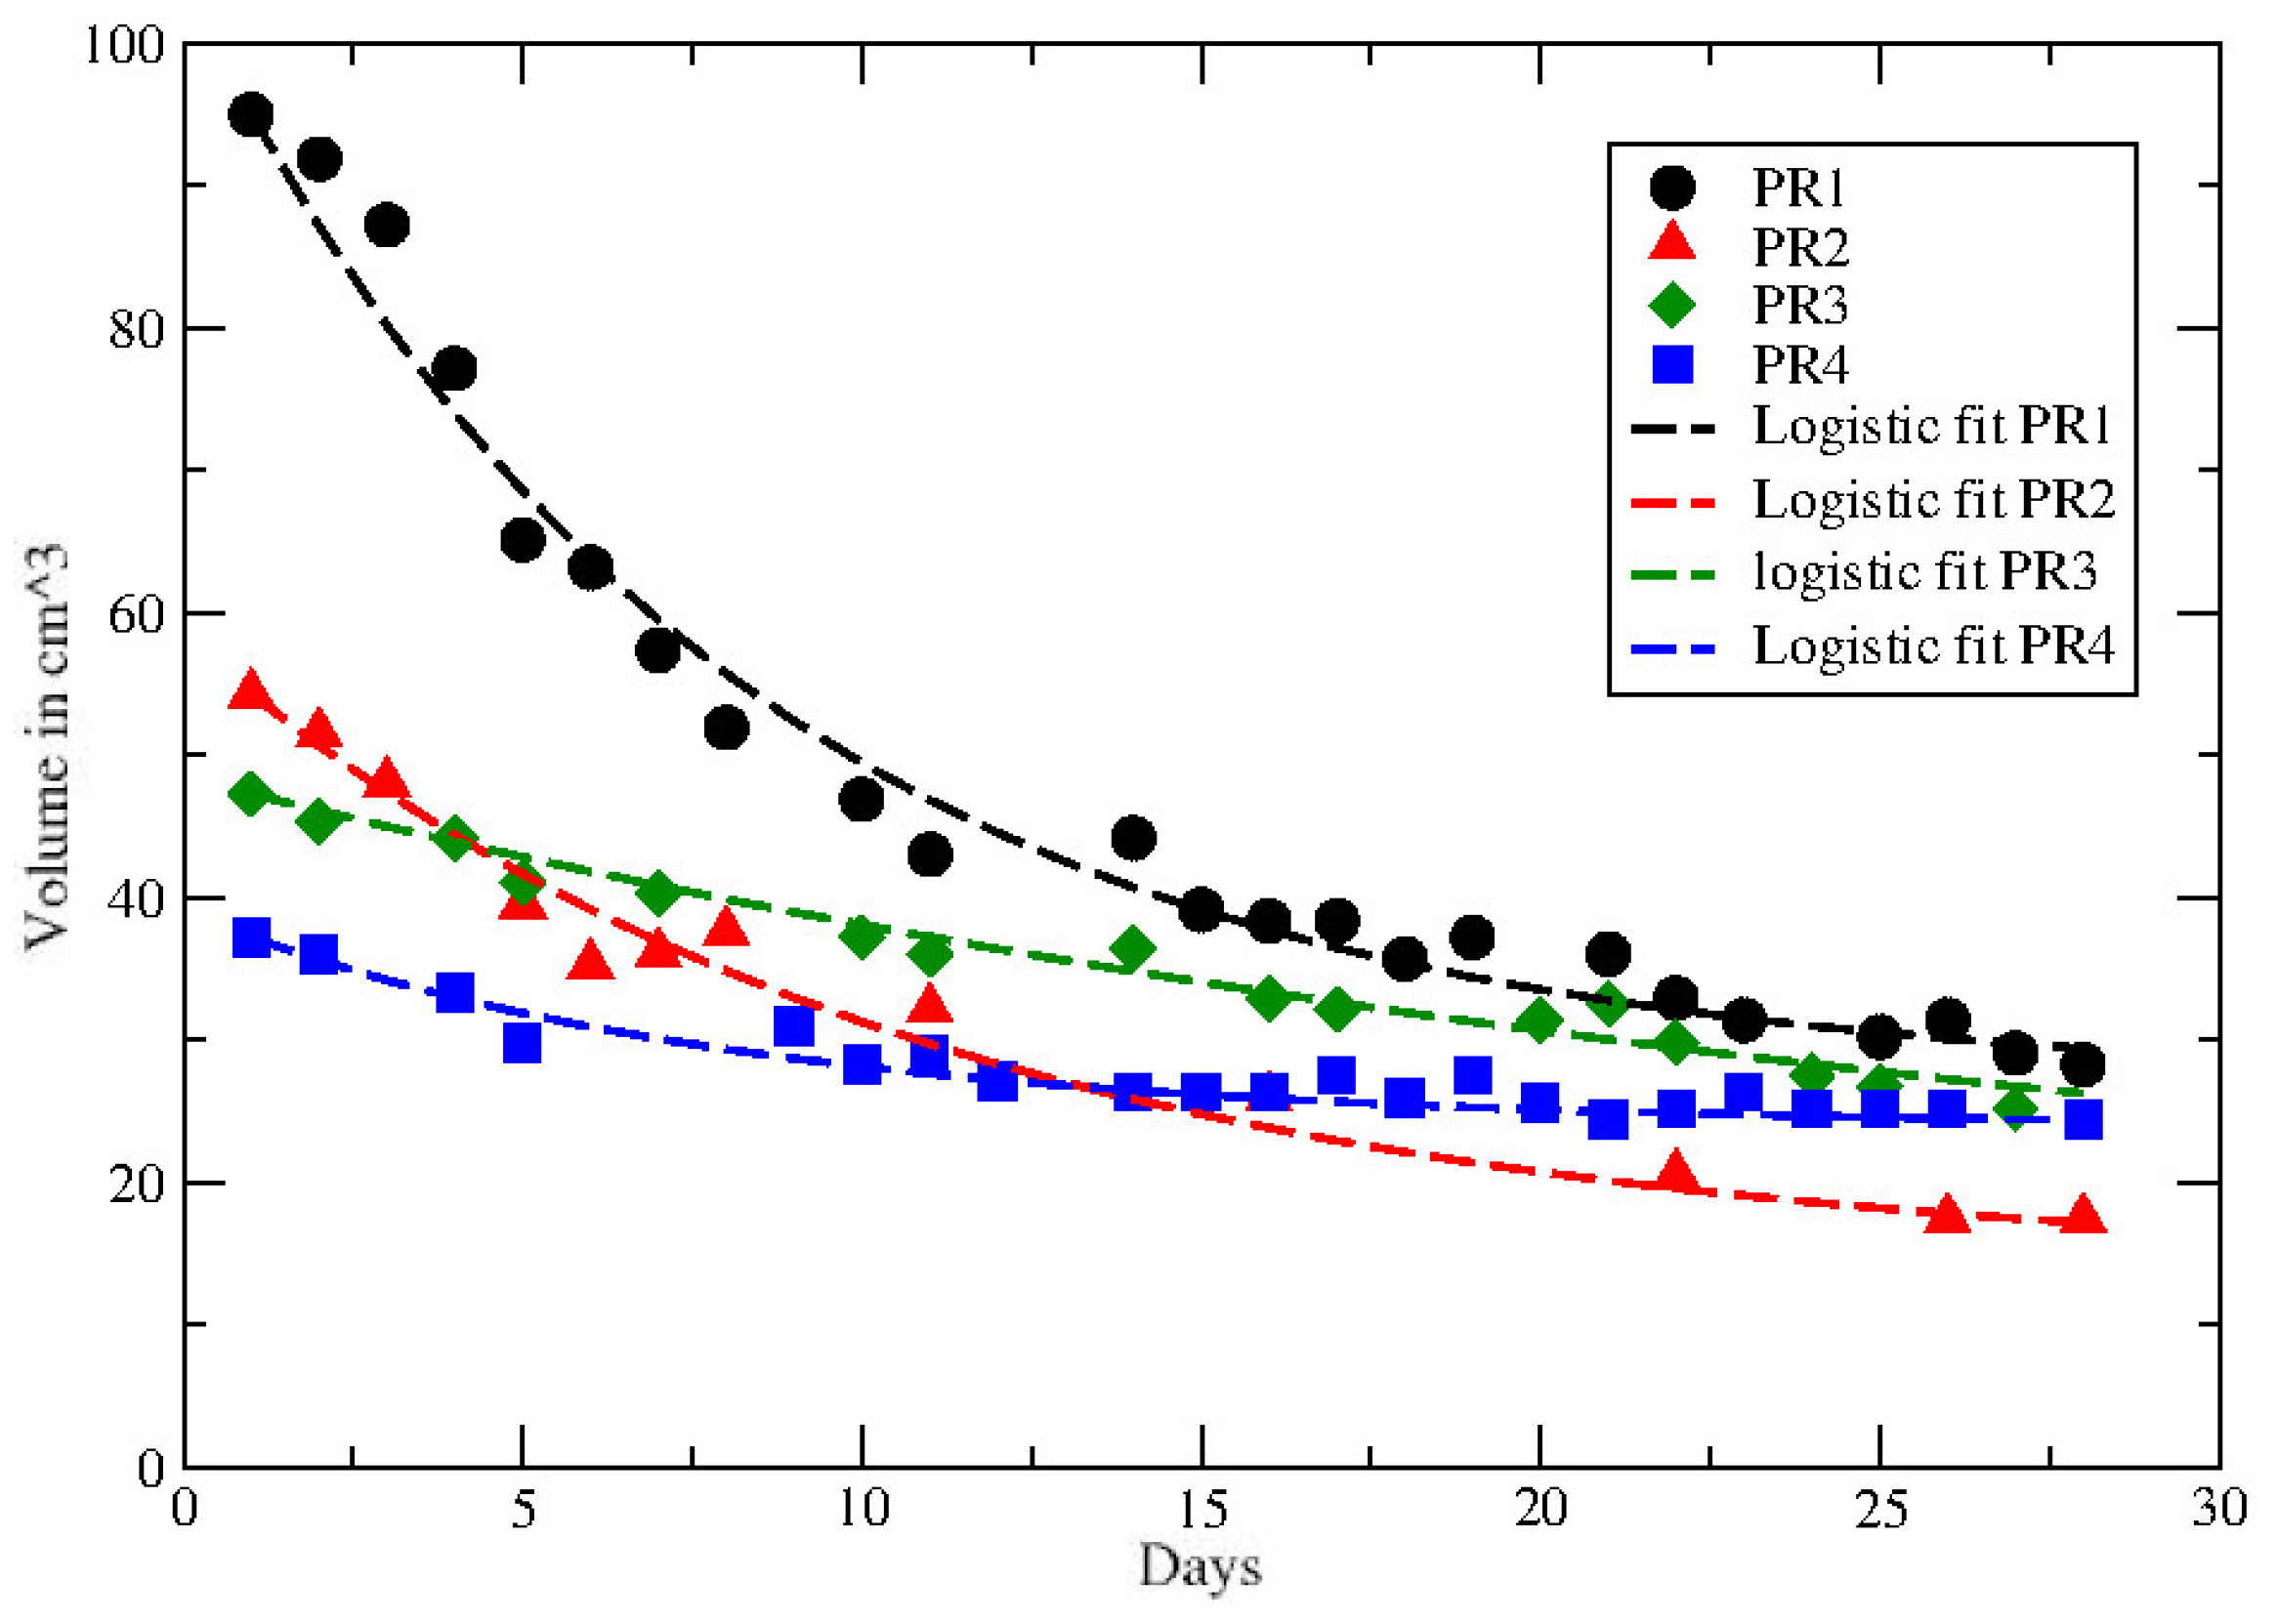
| PR1 | 0.26 * | 0.0825 * | 0.11 |
| PR2 | 0.21 * | 0.0473 * | 0.074 |
| PR3 | <0.53 | >0.034 | 0.0218 * |
| PR4 | 0.64 * | 0.107 * | 0.048 |
| Patient | in cm | per Day |
|---|---|---|
| PR1 | 27 | 0.123 |
| PR2 | 14 | 0.094 |
| PR3 | 12 | 0.0035 |
| PR4 | 24 | 0.129 |
| CR1 | <5 × 10 | 0.0808 |
| CR2 | <5 × 10 | 0.1 |
| CR3 | <5 × 10 | 0.083 |
| CR4 | 3.74 × 10 | 0.0483 |
Publisher’s Note: MDPI stays neutral with regard to jurisdictional claims in published maps and institutional affiliations. |
© 2022 by the authors. Licensee MDPI, Basel, Switzerland. This article is an open access article distributed under the terms and conditions of the Creative Commons Attribution (CC BY) license (https://creativecommons.org/licenses/by/4.0/).
Share and Cite
Castorina, P.; Ferini, G.; Martorana, E.; Forte, S. Tumor Volume Regression during and after Radiochemotherapy: A Macroscopic Description. J. Pers. Med. 2022, 12, 530. https://doi.org/10.3390/jpm12040530
Castorina P, Ferini G, Martorana E, Forte S. Tumor Volume Regression during and after Radiochemotherapy: A Macroscopic Description. Journal of Personalized Medicine. 2022; 12(4):530. https://doi.org/10.3390/jpm12040530
Chicago/Turabian StyleCastorina, Paolo, Gianluca Ferini, Emanuele Martorana, and Stefano Forte. 2022. "Tumor Volume Regression during and after Radiochemotherapy: A Macroscopic Description" Journal of Personalized Medicine 12, no. 4: 530. https://doi.org/10.3390/jpm12040530
APA StyleCastorina, P., Ferini, G., Martorana, E., & Forte, S. (2022). Tumor Volume Regression during and after Radiochemotherapy: A Macroscopic Description. Journal of Personalized Medicine, 12(4), 530. https://doi.org/10.3390/jpm12040530