
Sex and Age Differences Modulate Association of Vitamin D with Serum Triglyceride Levels

 , and
, and
Abstract
:1. Introduction
2. Methods
2.1. Participants
2.2. Biochemical Measurements
2.3. Statistical Analysis
3. Results
3.1. General Characteristics
3.2. Sex Differences Associated with Serum Vitamin D
3.3. Age Associated with Serum Vitamin D
3.4. Biomarkers Independently Associated with Serum Vitamin D: Age, Sex, and Triglycerides
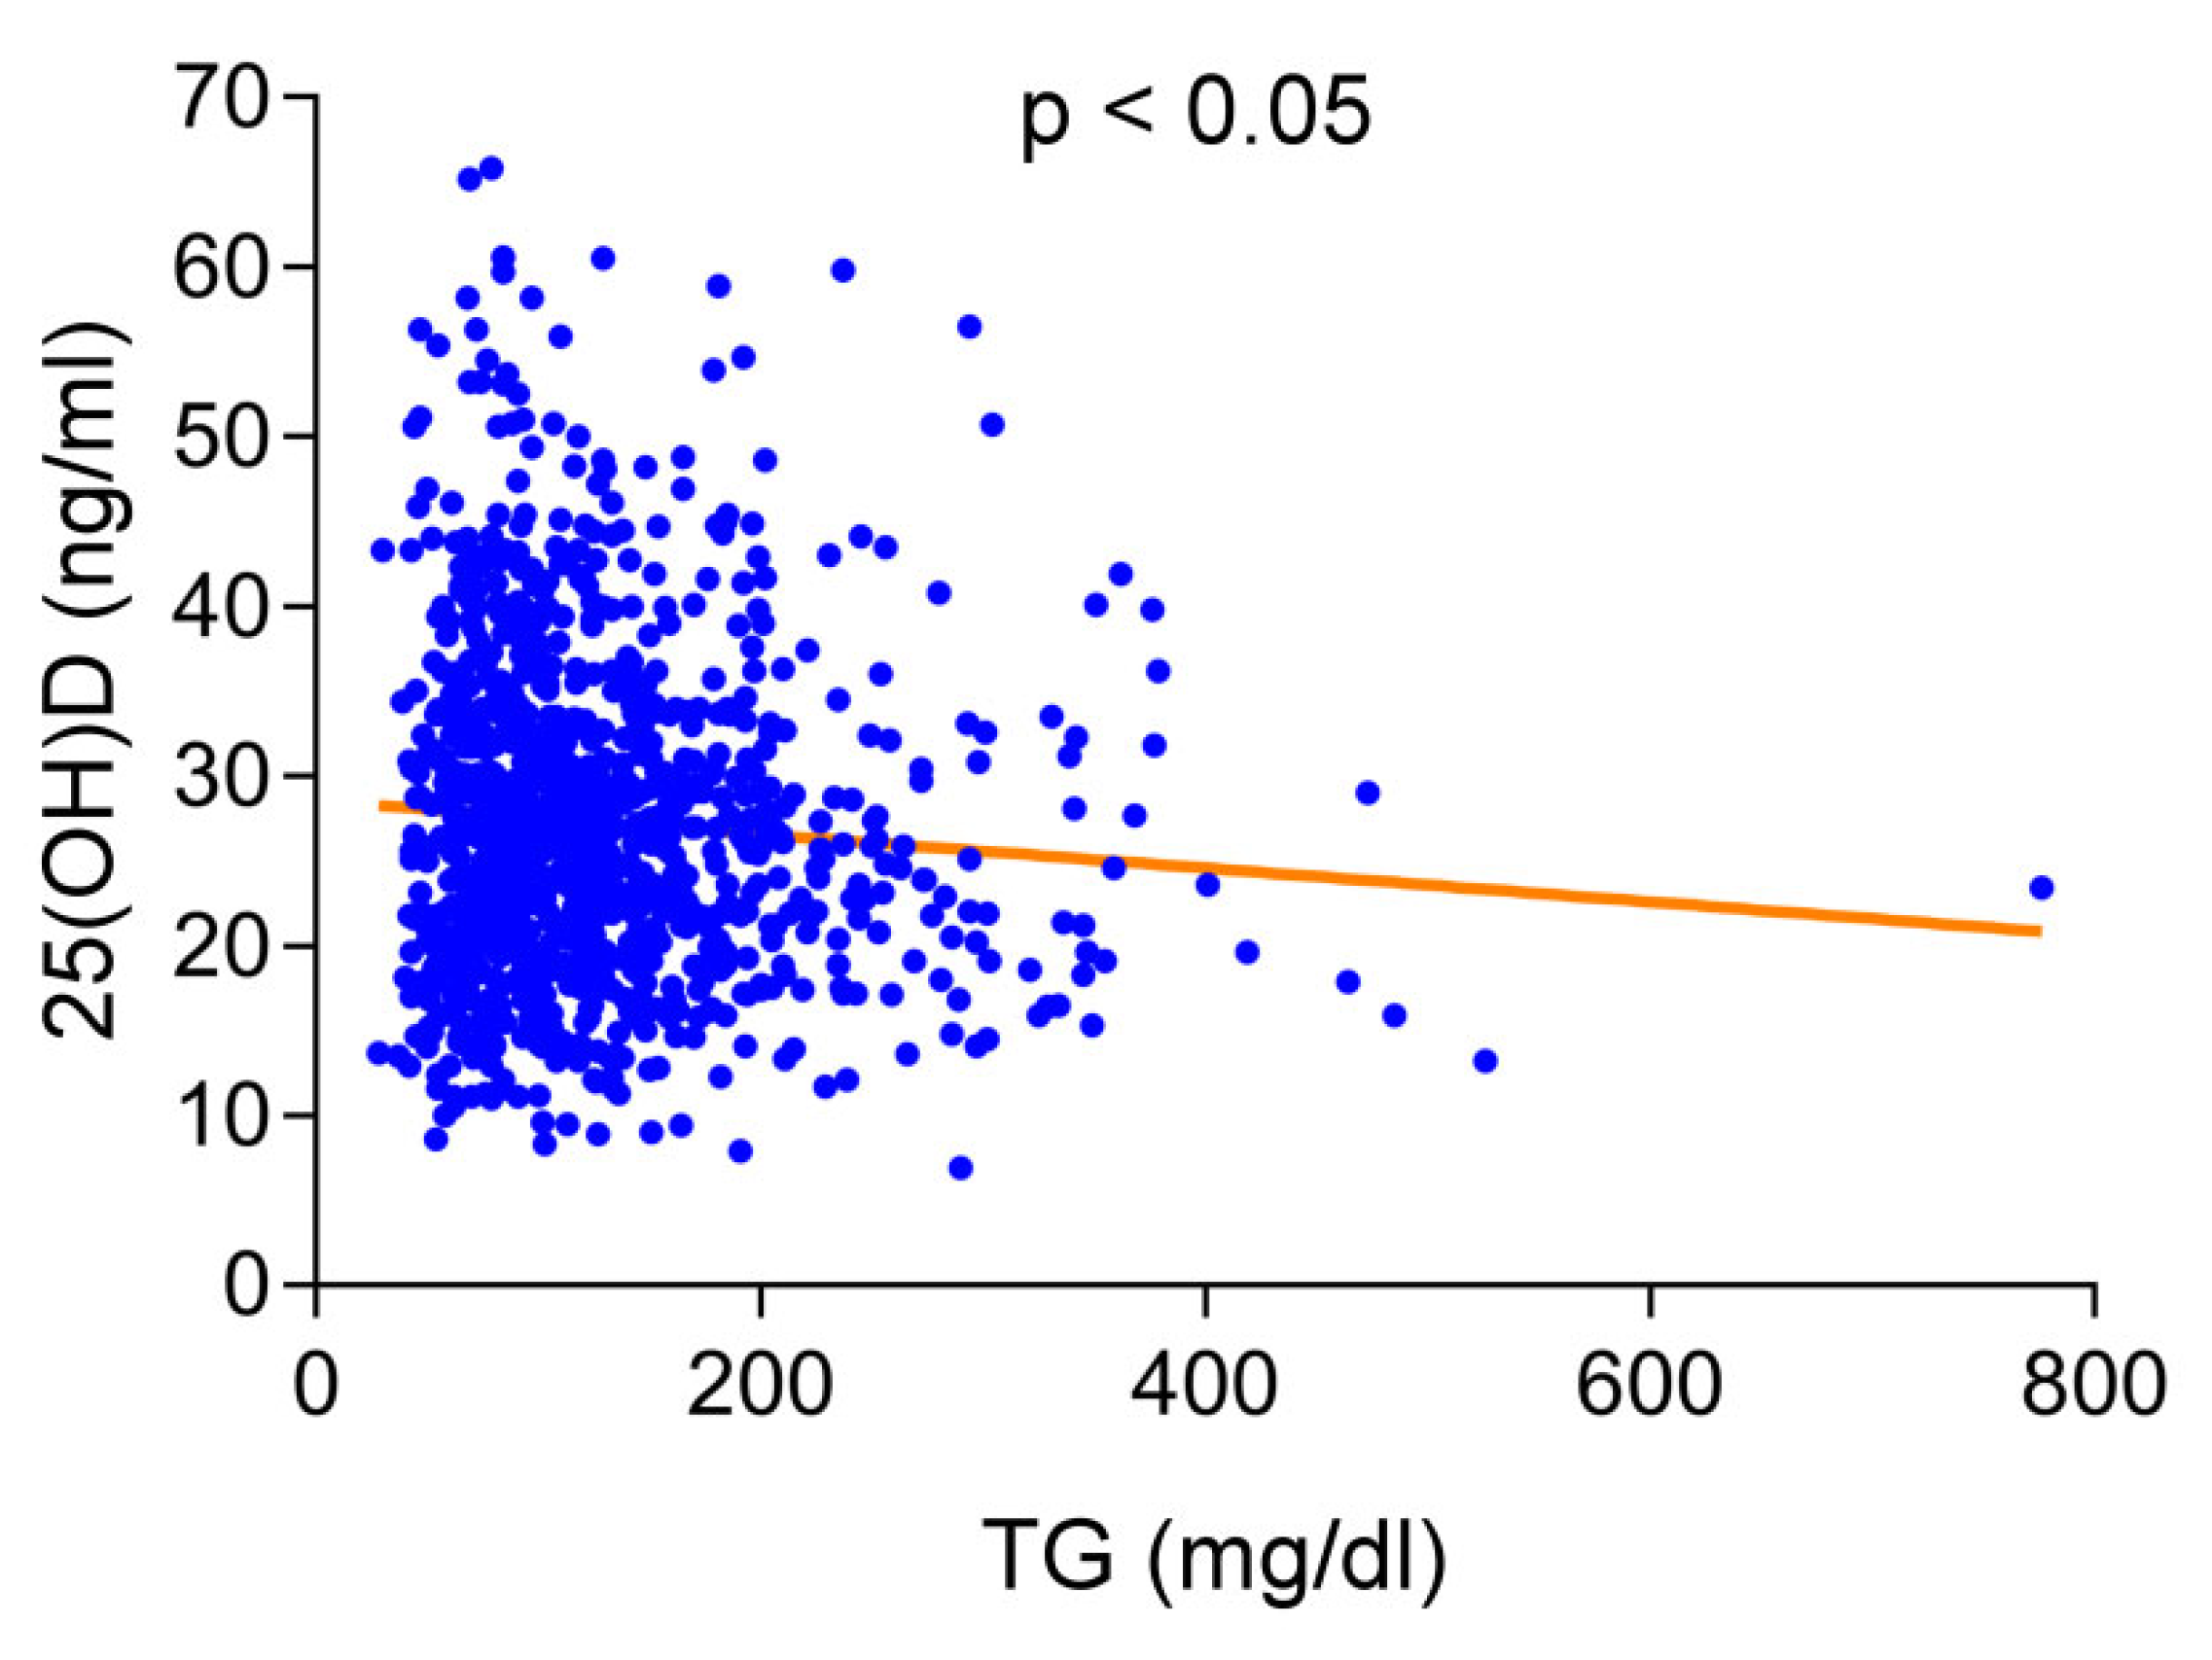
3.5. Relationship between Vitamin D and TG Levels Differs by Sex and Age
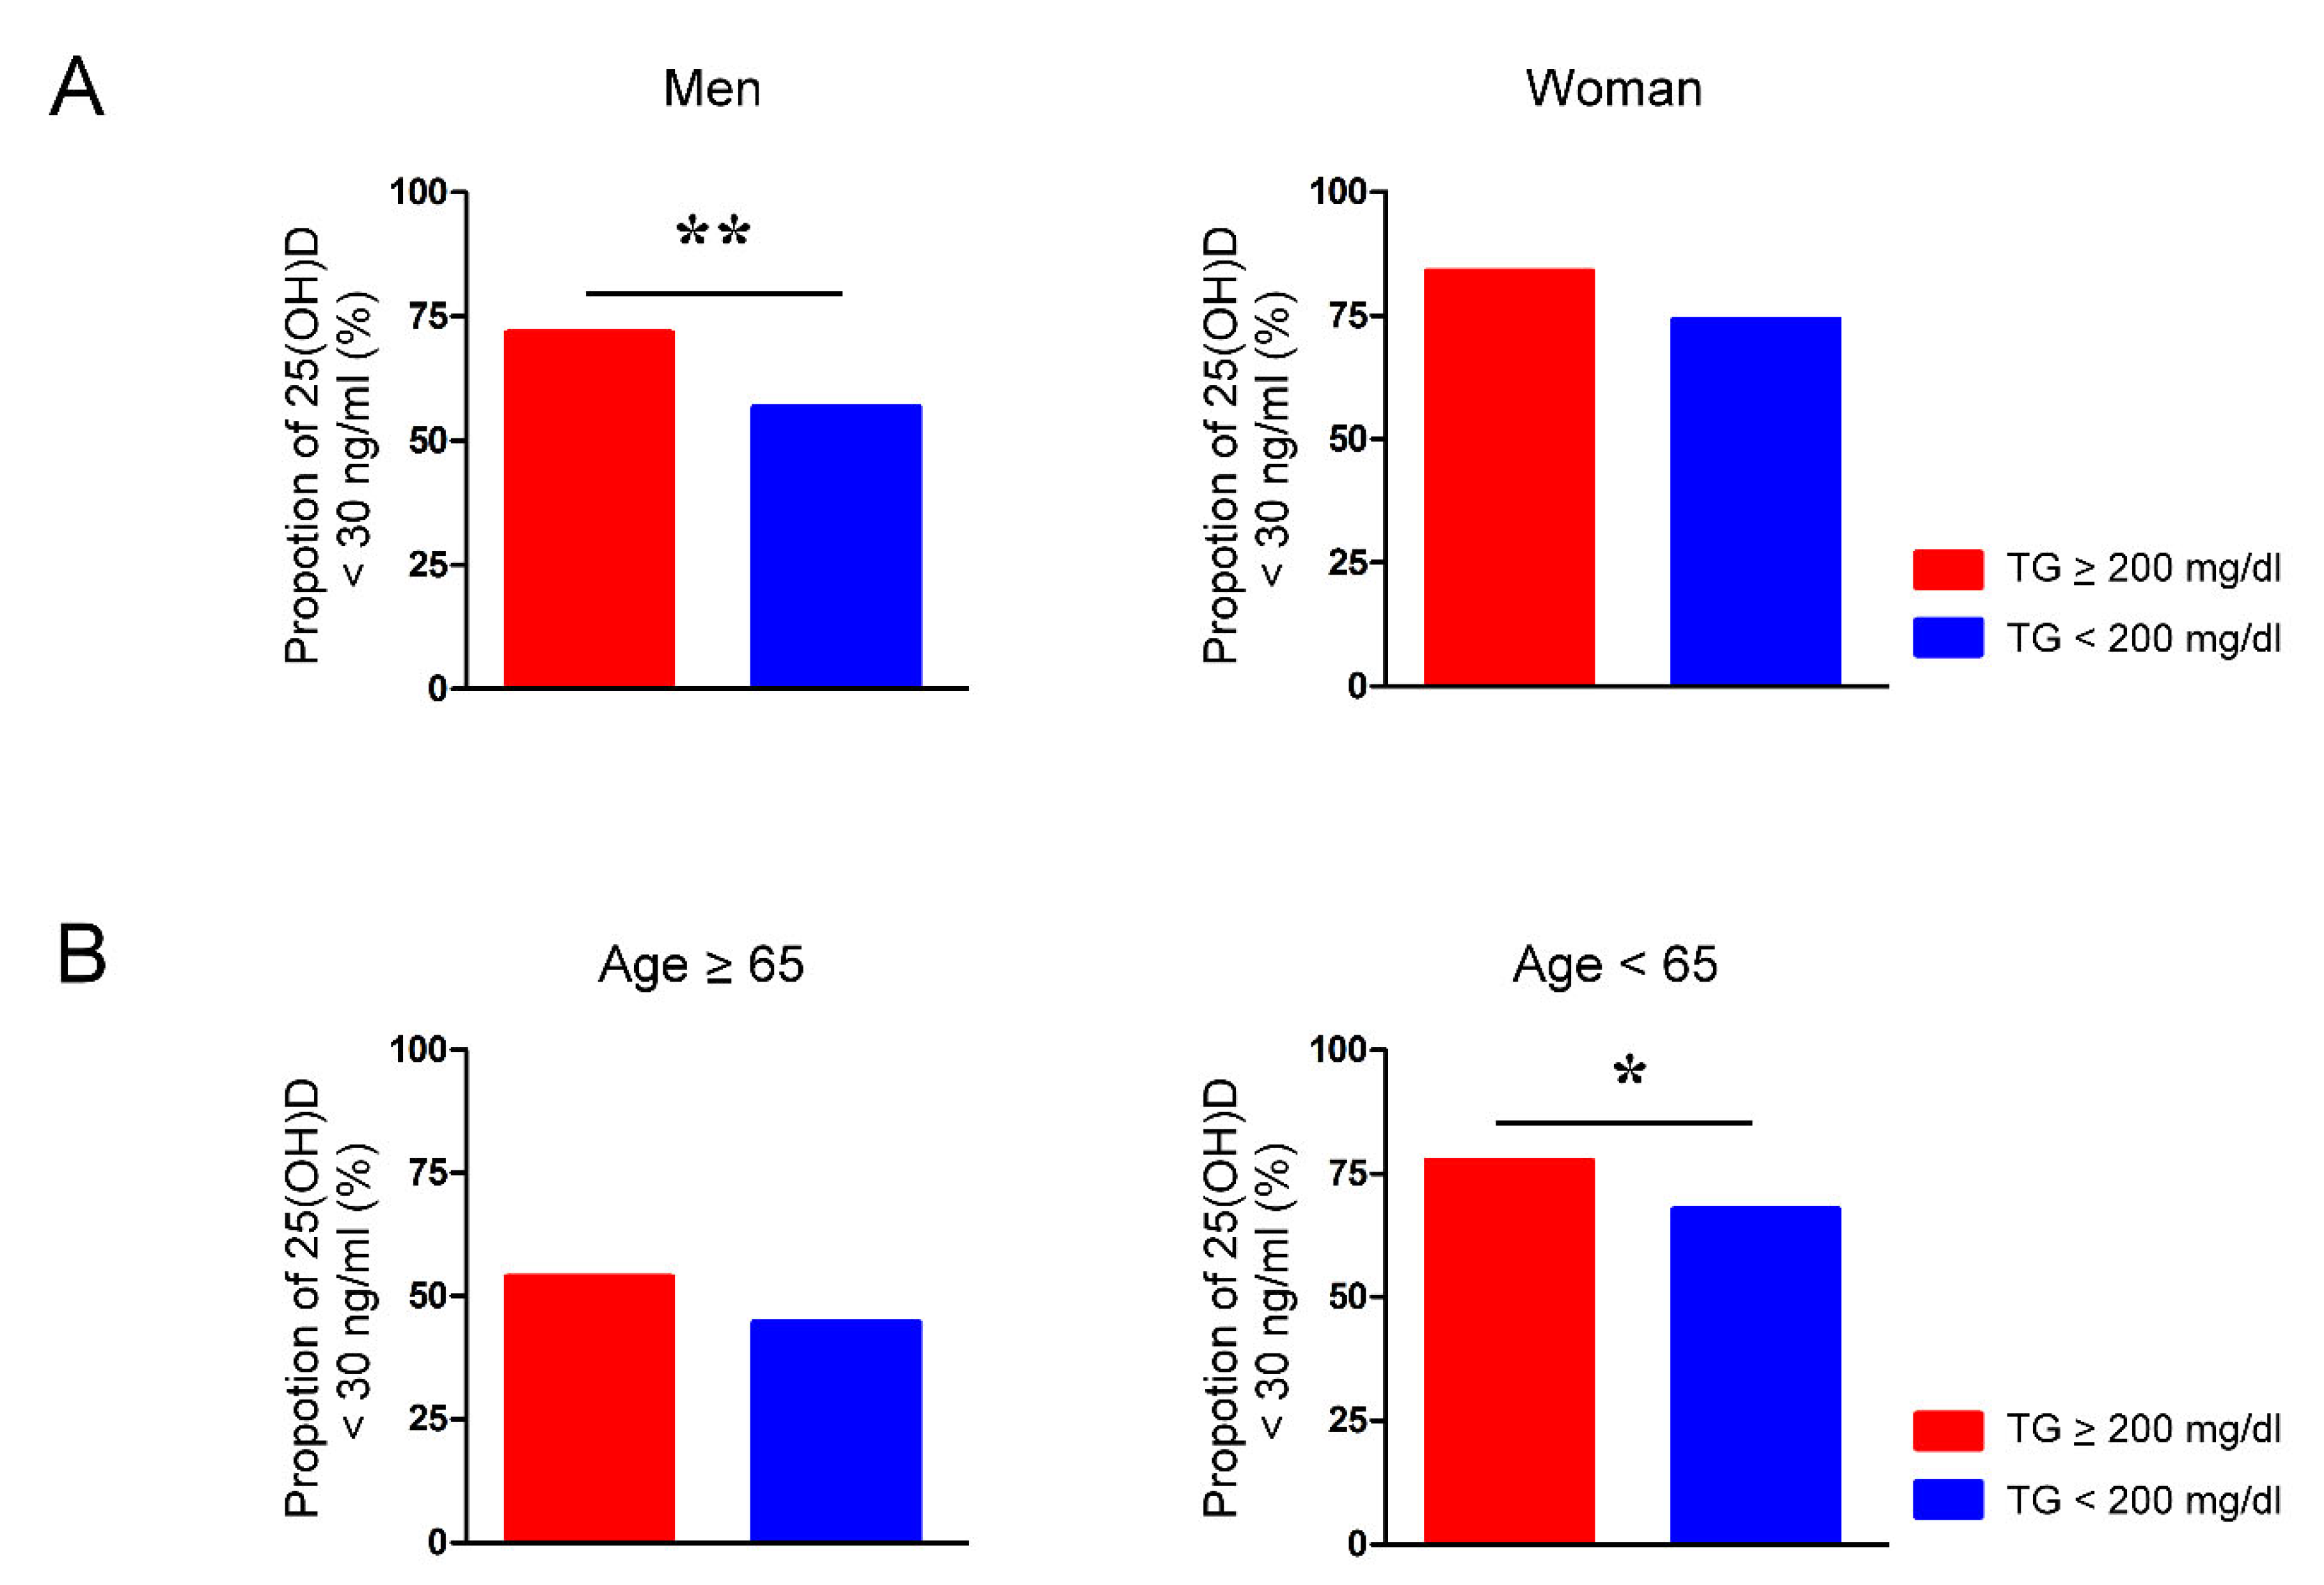
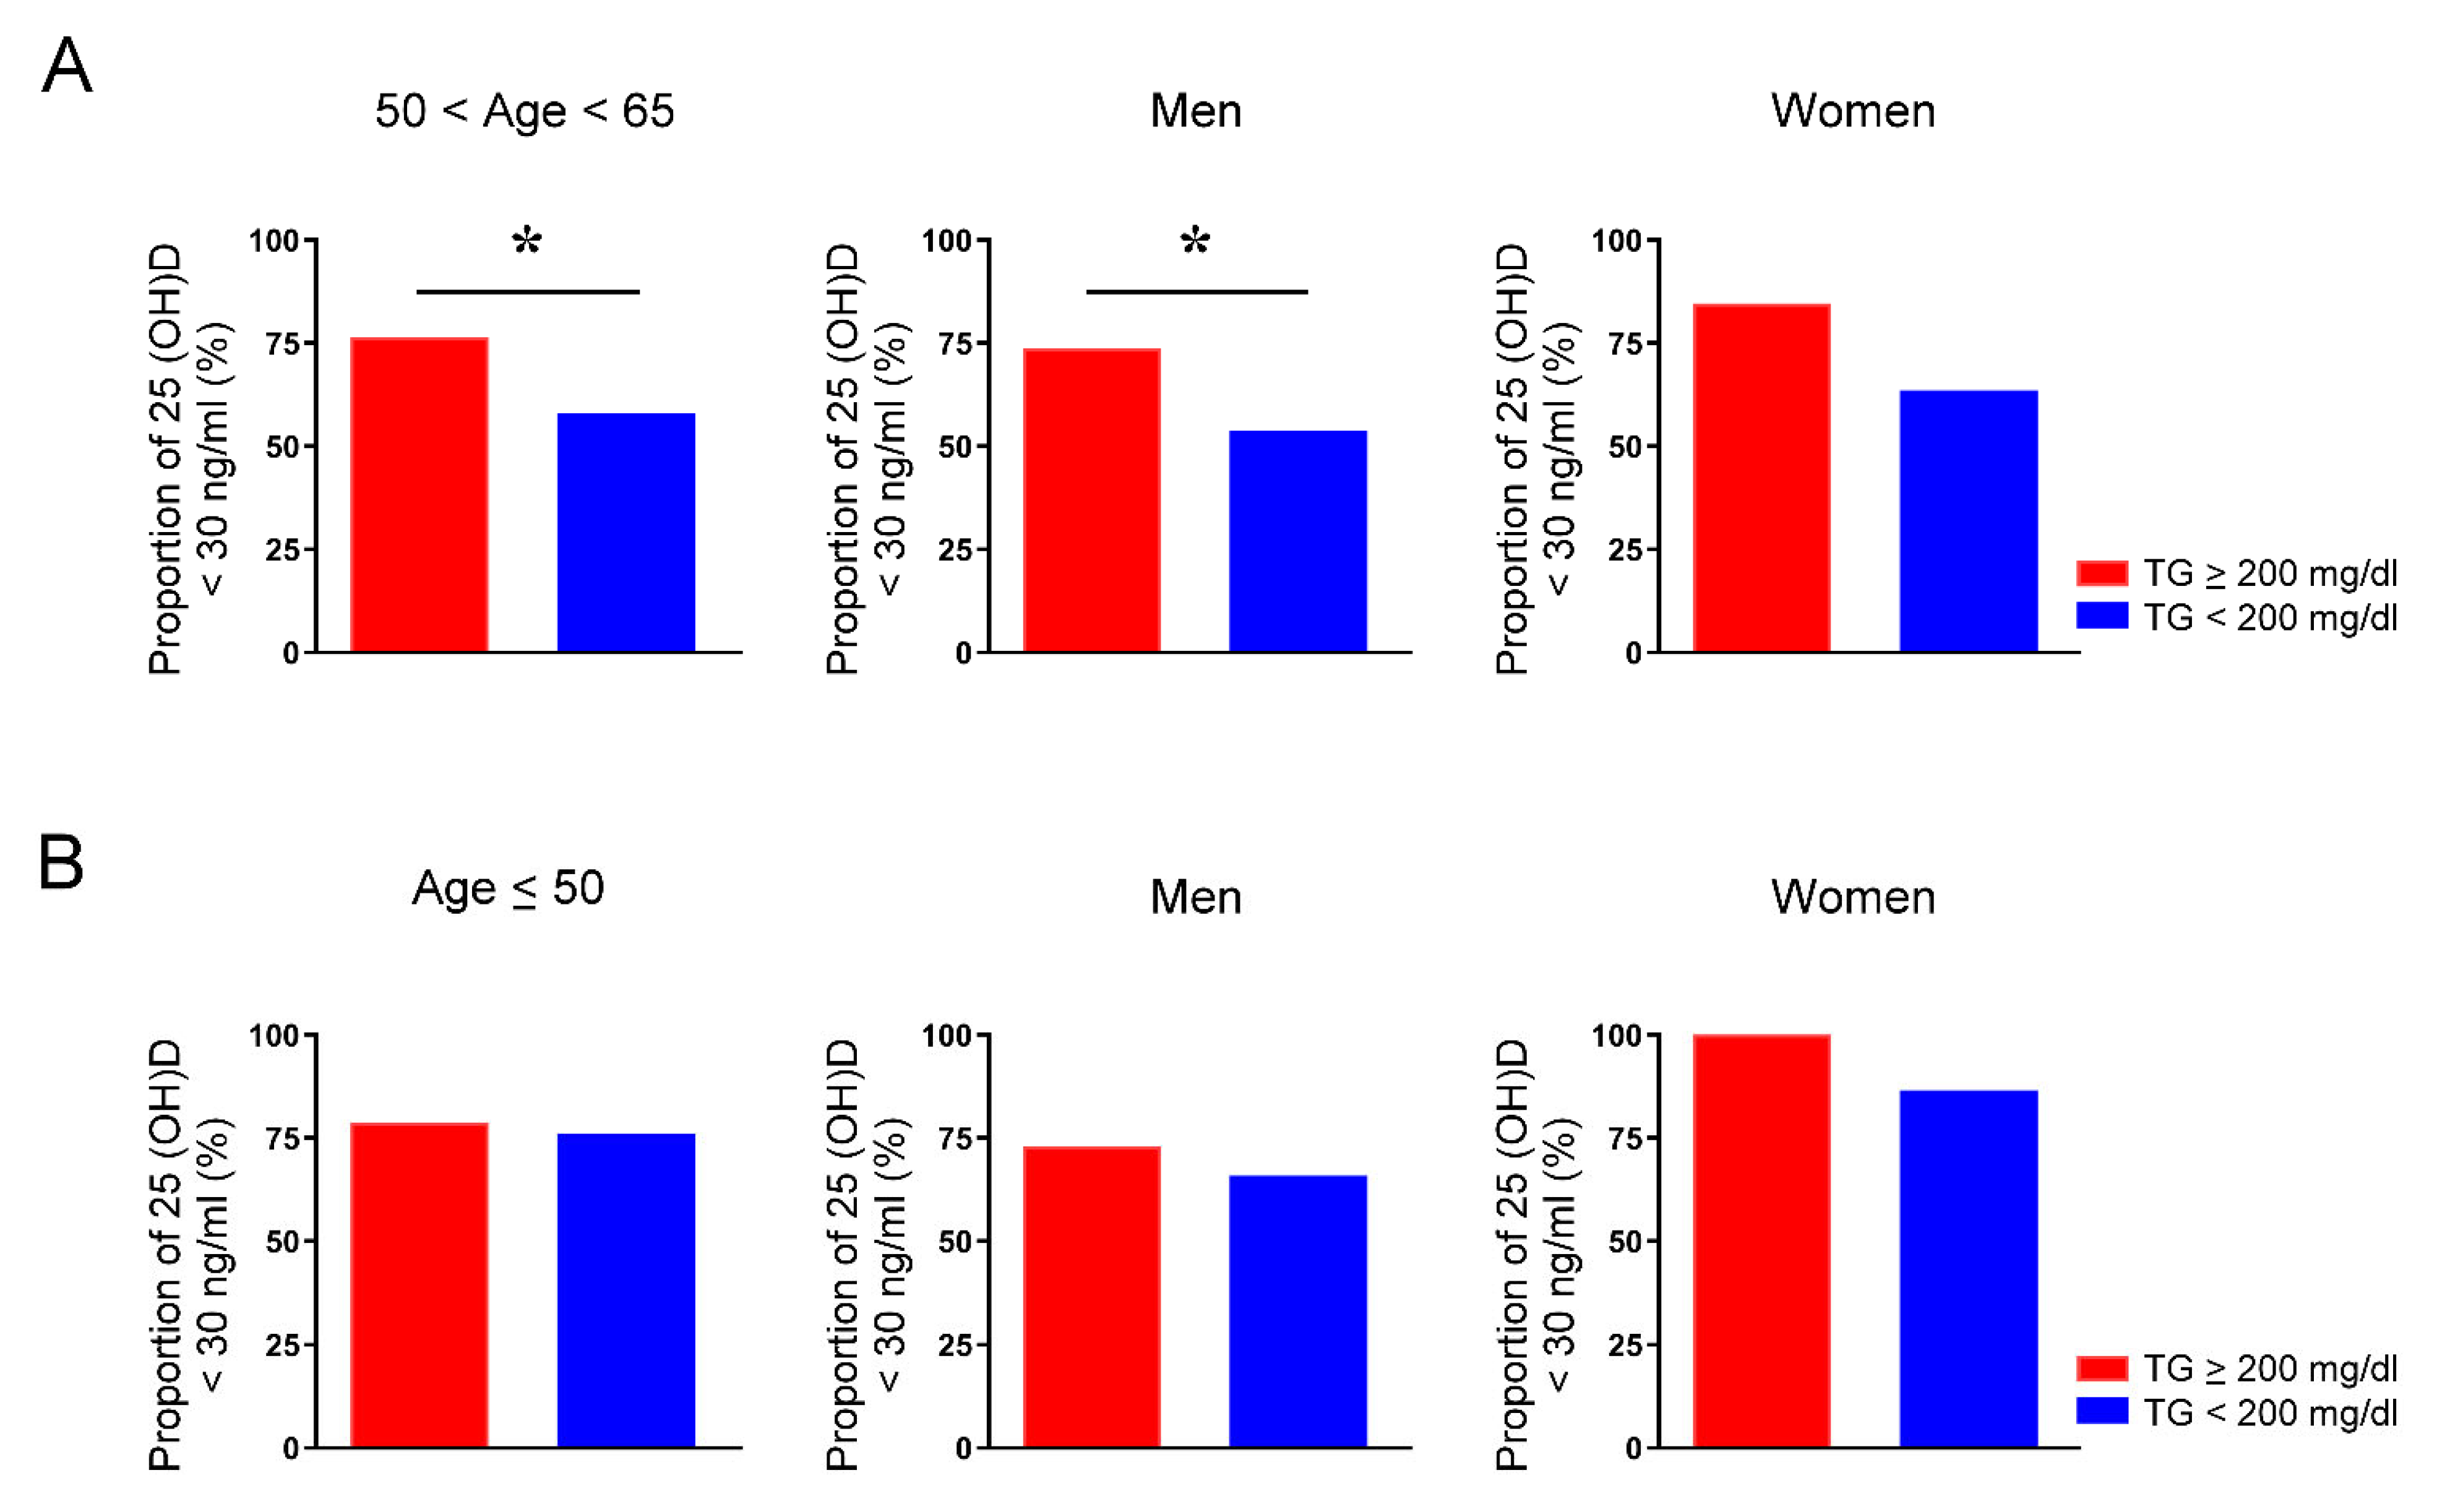
3.6. Vitamin D Deficiency Is Associated with Hypertriglyceridemia Only among Middle-Aged Men
4. Discussion
5. Conclusions
Author Contributions
Funding
Institutional Review Board Statement
Informed Consent Statement
Data Availability Statement
Conflicts of Interest
References
- Amrein, K.; Scherkl, M.; Hoffmann, M.; Neuwersch-Sommeregger, S.; Köstenberger, M.; Tmava Berisha, A.; Martucci, G.; Pilz, S.; Malle, O. Vitamin D deficiency 2.0: An update on the current status worldwide. Eur. J. Clin. Nutr. 2020, 74, 1498–1513. [Google Scholar] [CrossRef] [PubMed]
- Palacios, C.; Gonzalez, L. Is vitamin D deficiency a major global public health problem? J. Steroid Biochem. Mol. Biol. 2014, 144, 138–145. [Google Scholar] [CrossRef] [PubMed] [Green Version]
- Gil, Á.; Plaza-Diaz, J.; Mesa, M.D. Vitamin D: Classic and Novel Actions. Ann. Nutr. Metab. 2018, 72, 87–95. [Google Scholar] [CrossRef] [PubMed]
- Lee, T.W.; Kao, Y.H.; Chen, Y.J.; Chao, T.F.; Lee, T.I. Therapeutic potential of vitamin D in AGE/RAGE-related cardiovascular diseases. Cell. Mol. Life Sci. 2019, 76, 4103–4115. [Google Scholar] [CrossRef]
- Lee, T.W.; Lee, T.I.; Chang, C.J.; Lien, G.S.; Kao, Y.H.; Chao, T.F.; Chen, Y.J. Potential of vitamin D in treating diabetic cardiomyopathy. Nutr. Res. 2015, 35, 269–279. [Google Scholar] [CrossRef]
- Jorde, R.; Grimnes, G. Vitamin D and metabolic health with special reference to the effect of vitamin D on serum lipids. Prog. Lipid Res. 2011, 50, 303–312. [Google Scholar] [CrossRef]
- Parva, N.R.; Tadepalli, S.; Singh, P.; Qian, A.; Joshi, R.; Kandala, H.; Nookala, V.K.; Cheriyath, P. Prevalence of Vitamin D Deficiency and Associated Risk Factors in the US Population (2011–2012). Cureus 2018, 10, e2741. [Google Scholar] [CrossRef] [Green Version]
- Theodoratou, E.; Tzoulaki, I.; Zgaga, L.; Ioannidis, J.P. Vitamin D and multiple health outcomes: Umbrella review of systematic reviews and meta-analyses of observational studies and randomised trials. BMJ 2014, 348, g2035. [Google Scholar] [CrossRef] [Green Version]
- Zhen, D.; Liu, L.; Guan, C.; Zhao, N.; Tang, X. High prevalence of vitamin D deficiency among middle-aged and elderly individuals in northwestern China: Its relationship to osteoporosis and lifestyle factors. Bone 2015, 71, 1–6. [Google Scholar] [CrossRef]
- Chailurkit, L.O.; Aekplakorn, W.; Ongphiphadhanakul, B. Regional variation and determinants of vitamin D status in sunshine-abundant Thailand. BMC Public Health 2011, 11, 853. [Google Scholar] [CrossRef] [Green Version]
- Jang, H.; Koo, F.K.; Ke, L.; Clemson, L.; Cant, R.; Fraser, D.R.; Seibel, M.J.; Tseng, M.; Mpofu, E.; Mason, R.S.; et al. Culture and sun exposure in immigrant East Asian women living in Australia. Women Health 2013, 53, 504–518. [Google Scholar] [CrossRef] [PubMed]
- Lee, A.; Garbutcheon-Singh, K.B.; Dixit, S.; Brown, P.; Smith, S.D. The influence of age and gender in knowledge, behaviors and attitudes towards sun protection: A cross-sectional survey of Australian outpatient clinic attendees. Am. J. Clin. Dermatol. 2015, 16, 47–54. [Google Scholar] [CrossRef] [PubMed]
- MacLaughlin, J.; Holick, M.F. Aging decreases the capacity of human skin to produce vitamin D3. J. Clin. Investig. 1985, 76, 1536–1538. [Google Scholar] [CrossRef] [Green Version]
- Wyskida, M.; Wieczorowska-Tobis, K.; Chudek, J. Prevalence and factors promoting the occurrence of vitamin D deficiency in the elderly. Postep. Hig. Med. Dosw. 2017, 71, 198–204. [Google Scholar] [CrossRef]
- Chalcraft, J.R.; Cardinal, L.M.; Wechsler, P.J.; Hollis, B.W.; Gerow, K.G.; Alexander, B.M.; Keith, J.F.; Larson-Meyer, D.E. Vitamin D Synthesis Following a Single Bout of Sun Exposure in Older and Younger Men and Women. Nutrients 2020, 12, 2237. [Google Scholar] [CrossRef]
- Fan, P.; Wang, Q.; Li, J.; Lu, C.; Xu, Y.; Cao, H.; Xie, X.; Wu, X.; Guo, Y.; Liu, T.; et al. Poor Status of Vitamin D: A Survey of Area with Lowest Sunlight Radiation in Sichuan, China. Front. Endocrinol. 2021, 12, 626983. [Google Scholar] [CrossRef]
- Yu, H.J.; Kwon, M.J.; Woo, H.Y.; Park, H. Analysis of 25-Hydroxyvitamin D Status According to Age, Gender, and Seasonal Variation. J. Clin. Lab. Anal. 2016, 30, 905–911. [Google Scholar] [CrossRef] [Green Version]
- Andersen, S.; Jakobsen, A.; Laurberg, P. Vitamin D status in North Greenland is influenced by diet and season: Indicators of dermal 25-hydroxy vitamin D production north of the Arctic Circle. Br. J. Nutr. 2013, 110, 50–57. [Google Scholar] [CrossRef] [Green Version]
- Papadakis, G.; Keramidas, I.; Kakava, K.; Pappa, T.; Villiotou, V.; Triantafillou, E.; Drosou, A.; Tertipi, A.; Kaltzidou, V.; Pappas, A. Seasonal variation of serum vitamin D among Greek female patients with osteoporosis. Vivo 2015, 29, 409–413. [Google Scholar]
- Gocho, Y.; Tanaka, M.; Sugawara, H.; Furuhashi, M.; Moniwa, N.; Yamashita, T.; Takizawa, H.; Mukai, H.; Ohno, K.; Maeda, T.; et al. Seasonal variation of serum 25-hydroxyvitamin D level in hemodialysis patients in the northernmost island of Japan. Clin. Exp. Nephrol. 2021, 25, 1360–1366. [Google Scholar] [CrossRef]
- Andersen, R.; Brot, C.; Jakobsen, J.; Mejborn, H.; Mølgaard, C.; Skovgaard, L.T.; Trolle, E.; Tetens, I.; Ovesen, L. Seasonal changes in vitamin D status among Danish adolescent girls and elderly women: The influence of sun exposure and vitamin D intake. Eur. J. Clin. Nutr. 2013, 67, 270–274. [Google Scholar] [CrossRef]
- Huta-Osiecka, A.; Wochna, K.; Kasprzak, Z.; Nowak, A. Seasonal variation of 25-Hydroxyvitamin D and indices of carbohydrate and lipid metabolism in postmenopausal women. PeerJ 2021, 9, e11341. [Google Scholar] [CrossRef] [PubMed]
- Chang, K.-C.; Yen, W.-L.; Liu, C.-W. Solar Global Radiation Information of Taiwan in Terms of the Typical Meteorological Year between 2004 and 2013. J. Taiwan Energy 2016, 3, 89–101. [Google Scholar]
- Choi, H.S.; Oh, H.J.; Choi, H.; Choi, W.H.; Kim, J.G.; Kim, K.M.; Kim, K.J.; Rhee, Y.; Lim, S.K. Vitamin D insufficiency in Korea--a greater threat to younger generation: The Korea National Health and Nutrition Examination Survey (KNHANES) 2008. J Clin. Endocrinol. Metab. 2011, 96, 643–651. [Google Scholar] [CrossRef]
- AlQuaiz, A.M.; Kazi, A.; Fouda, M.; Alyousefi, N. Age and gender differences in the prevalence and correlates of vitamin D deficiency. Arch. Osteoporos. 2018, 13, 49. [Google Scholar] [CrossRef]
- Muscogiuri, G.; Barrea, L.; Somma, C.D.; Laudisio, D.; Salzano, C.; Pugliese, G.; de Alteriis, G.; Colao, A.; Savastano, S. Sex Differences of Vitamin D Status across BMI Classes: An Observational Prospective Cohort Study. Nutrients 2019, 11, 3034. [Google Scholar] [CrossRef] [Green Version]
- Yan, X.; Zhang, N.; Cheng, S.; Wang, Z.; Qin, Y. Gender Differences in Vitamin D Status in China. Med. Sci. Monit. 2019, 25, 7094–7099. [Google Scholar] [CrossRef]
- Park, Y.C.; Kim, J.; Seo, M.S.; Hong, S.W.; Cho, E.S.; Kim, J.K. Inverse relationship between vitamin D levels and platelet indices in Korean adults. Hematology 2017, 22, 623–629. [Google Scholar] [CrossRef] [Green Version]
- Perlstein, T.S.; Pande, R.; Berliner, N.; Vanasse, G.J. Prevalence of 25-hydroxyvitamin D deficiency in subgroups of elderly persons with anemia: Association with anemia of inflammation. Blood 2011, 117, 2800–2806. [Google Scholar] [CrossRef]
- Sim, J.J.; Lac, P.T.; Liu, I.L.; Meguerditchian, S.O.; Kumar, V.A.; Kujubu, D.A.; Rasgon, S.A. Vitamin D deficiency and anemia: A cross-sectional study. Ann. Hematol. 2010, 89, 447–452. [Google Scholar] [CrossRef] [Green Version]
- Smith, E.M.; Tangpricha, V. Vitamin D and anemia: Insights into an emerging association. Curr. Opin. Endocrinol. Diabetes Obes. 2015, 22, 432–438. [Google Scholar] [CrossRef] [PubMed] [Green Version]
- Jiang, X.; Peng, M.; Chen, S.; Wu, S.; Zhang, W. Vitamin D deficiency is associated with dyslipidemia: A cross-sectional study in 3788 subjects. Curr. Med. Res. Opin. 2019, 35, 1059–1063. [Google Scholar] [CrossRef] [PubMed]
- Jorde, R.; Figenschau, Y.; Hutchinson, M.; Emaus, N.; Grimnes, G. High serum 25-hydroxyvitamin D concentrations are associated with a favorable serum lipid profile. Eur. J. Clin. Nutr. 2010, 64, 1457–1464. [Google Scholar] [CrossRef] [PubMed]
- Yang, K.; Liu, J.; Fu, S.; Tang, X.; Ma, L.; Sun, W.; Niu, Y.; Jing, G.; Niu, Q. Vitamin D Status and Correlation with Glucose and Lipid Metabolism in Gansu Province, China. Diabetes Metab. Syndr. Obes. 2020, 13, 1555–1563. [Google Scholar] [CrossRef] [PubMed]
- Dibaba, D.T. Effect of vitamin D supplementation on serum lipid profiles: A systematic review and meta-analysis. Nutr. Rev. 2019, 77, 890–902. [Google Scholar] [CrossRef] [PubMed]
- Huang, F.; Liu, Q.; Zhang, Q.; Wan, Z.; Hu, L.; Xu, R.; Cheng, A.; Lv, Y.; Wang, L. Sex-Specific Association between Serum Vitamin D Status and Lipid Profiles: A Cross-Sectional Study of a Middle-Aged and Elderly Chinese Population. J. Nutr. Sci. Vitaminol. 2020, 66, 105–113. [Google Scholar] [CrossRef]
- Wang, Y.; Si, S.; Liu, J.; Wang, Z.; Jia, H.; Feng, K.; Sun, L.; Song, S.J. The Associations of Serum Lipids with Vitamin D Status. PLoS ONE 2016, 11, e0165157. [Google Scholar] [CrossRef]
- Toxqui, L.; Blanco-Rojo, R.; Wright, I.; Pérez-Granados, A.M.; Vaquero, M.P. Changes in blood pressure and lipid levels in young women consuming a vitamin D-fortified skimmed milk: A randomised controlled trial. Nutrients 2013, 5, 4966–4977. [Google Scholar] [CrossRef] [Green Version]
- Busnatu, S.S.; Salmen, T.; Pana, M.A.; Rizzo, M.; Stallone, T.; Papanas, N.; Popovic, D.; Tanasescu, D.; Serban, D.; Stoian, A.P. The Role of Fructose as a Cardiovascular Risk Factor: An Update. Metabolites 2022, 12, 67. [Google Scholar] [CrossRef]
- Mohan, D.; Mente, A.; Dehghan, M.; Rangarajan, S.; O’Donnell, M.; Hu, W.; Dagenais, G.; Wielgosz, A.; Lear, S.; Wei, L.; et al. Associations of Fish Consumption with Risk of Cardiovascular Disease and Mortality Among Individuals with or without Vascular Disease from 58 Countries. JAMA Intern. Med. 2021, 181, 631–649. [Google Scholar] [CrossRef]
- Subramanian, S. Approach to the Patient with Moderate Hypertriglyceridemia. J. Clin. Endocrinol. Metab. 2022, dgac085, Online ahead of print. [Google Scholar] [CrossRef] [PubMed]
- Dalamaga, M.; Muscogiuri, G.; Paganitsa, G.; Parvouleskou, G.; Syriou, V.; Karagkoynis, P.; Stratigou, T.; Vallianou, N.; Christodoulatos, G.S.; Karampela, I.; et al. Adherence to the Mediterranean diet is an independent predictor of circulating vitamin D levels in normal weight and non-smoker adults: An observational cross-sectional study. Int. J. Food Sci. Nutr. 2021, 72, 848–860. [Google Scholar] [CrossRef] [PubMed]
- Bima, A.I.; Mahdi, A.S.; Al Fayez, F.F.; Khawaja, T.M.; Abo El-Khair, S.M.; Elsamanoudy, A.Z. Cellular Senescence and Vitamin D Deficiency Play a Role in the Pathogenesis of Obesity-Associated Subclinical Atherosclerosis: Study of the Potential Protective Role of Vitamin D Supplementation. Cells 2021, 10, 920. [Google Scholar] [CrossRef] [PubMed]
- Lee, H.; Lee, H.; Lim, Y. Vitamin D(3) improves lipophagy-associated renal lipid metabolism and tissue damage in diabetic mice. Nutr. Res. 2020, 80, 55–65. [Google Scholar] [CrossRef] [PubMed]
- Babaei, P.; Damirchi, A.; Hoseini, R. The interaction effects of aerobic exercise training and vitamin D supplementation on plasma lipid profiles and insulin resistance in ovariectomized rats. J. Exerc. Nutr. Biochem. 2015, 19, 173–182. [Google Scholar] [CrossRef] [Green Version]
- Radagdam, S.; Asoudeh-Fard, A.; Karimi, M.A.; Faridvand, Y.; Gholinejad, Z.; Gerayesh Nejad, S. Calcitriol modulates cholesteryl ester transfer protein (CETP) levels and lipid profile in hypercholesterolemic male rabbits: A pilot study. Int. J. Vitam. Nutr. Res. 2021, 91, 212–216. [Google Scholar] [CrossRef]
- Asano, L.; Watanabe, M.; Ryoden, Y.; Usuda, K.; Yamaguchi, T.; Khambu, B.; Takashima, M.; Sato, S.I.; Sakai, J.; Nagasawa, K.; et al. Vitamin D Metabolite, 25-Hydroxyvitamin D, Regulates Lipid Metabolism by Inducing Degradation of SREBP/SCAP. Cell Chem. Biol. 2017, 24, 207–217. [Google Scholar] [CrossRef] [Green Version]

| Vitamin D < 30 ng/mL (n = 665) | Vitamin D ≥ 30 ng/mL (n = 344) | p Value | |
|---|---|---|---|
| Age (years) | 50.02 ± 10.99 | 55.62 ± 11.65 | <0.001 |
| Female (%) | 326 (49) | 110 (32) | <0.001 |
| BW (kg) | 67.47 ± 14.21 | 67.39 ± 12.89 | 0.93 |
| BMI (kg/m2) | 24.48 ± 3.87 | 24.28 ± 3.39 | 0.39 |
| WBC (103/μL) | 6.21 ± 1.73 | 6.01 ± 1.65 | 0.07 |
| RBC (106/μL) | 4.89 ± 0.51 | 4.92 ± 0.52 | 0.37 |
| Hb (g/dL) | 14.56 ± 1.58 | 14.93 ± 1.33 | <0.001 |
| Hct (%) | 43.14 ± 4.25 | 44.19 ± 3.60 | <0.001 |
| MCH (pg) | 29.89 ± 2.90 | 30.51 ± 2.58 | <0.001 |
| MCV (fL) | 88.52 ± 7.16 | 90.22 ± 6.52 | <0.001 |
| MCHC (g/dL) | 33.71 ± 0.95 | 33.78 ± 0.84 | 0.25 |
| Platelets (103/μL) | 247.1 ± 59.18 | 230.5 ± 54.03 | <0.001 |
| MPV (fL) | 8.46 ± 0.89 | 8.50 ± 0.88 | 0.48 |
| Fasting glucose (mg/dL) | 96.85 ± 22.96 | 99.13 ± 22.52 | 0.13 |
| HbA1c (%) | 5.63 ± 0.78 | 5.74 ± 0.88 | <0.05 |
| BUN (mg/dL) | 10.49 ± 3.55 | 11.37 ± 3.55 | <0.001 |
| Creatinine (mg/dL) | 0.80 ± 0.24 | 0.85 ± 0.18 | <0.005 |
| Uric acid (mg/dL) | 5.80 ± 1.42 | 5.95 ± 1.38 | 0.11 |
| AST (U/L) | 20.70 ± 8.48 | 22.26 ± 8.91 | <0.01 |
| ALT (U/L) | 23.31 ± 16.77 | 24.01 ± 16.97 | 0.53 |
| r-GT (U/L) | 25.55 ± 26.28 | 27.14 ± 24.90 | 0.35 |
| Alk-p (U/L) | 58.73 ± 18.61 | 57.38 ± 15.31 | 0.22 |
| Total bilirubin (mg/dL) | 1.03 ± 0.45 | 1.07 ± 0.42 | 0.18 |
| Total protein (g/dL) | 7.15 ± 0.39 | 7.09 ± 0.40 | <0.05 |
| Albumin (g/dL) | 4.46 ± 0.25 | 4.44 ± 0.25 | 0.16 |
| Globulin (g/dL) | 2.69 ± 0.34 | 2.65 ± 0.36 | 0.10 |
| TG (mg/dL) | 133.2 ± 76.04 | 119.9 ± 64.28 | <0.005 |
| Total cholesterol (mg/dL) | 192.8 ± 39.05 | 193.1 ± 38.21 | 0.91 |
| HDL-C (mg/dL) | 51.26 ± 14.17 | 52.38 ± 14.60 | 0.24 |
| LDL-C (mg/dL) | 124.4 ± 34.06 | 125.4 ± 34.38 | 0.66 |
| TSH (μIU/mL) | 2.36 ± 3.50 | 2.03 ± 1.42 | <0.05 |
| T3 (ng/dL) | 101.9 ± 18.76 | 102.7 ± 17.36 | 0.50 |
| Free T4 (ng/dL) | 0.94 ± 0.23 | 0.92 ± 0.13 | 0.19 |
| Men | Women | |||||
|---|---|---|---|---|---|---|
| Vitamin D < 30 (n = 339) | Vitamin D ≥ 30 (n = 234) | p Value | Vitamin D < 30 (n = 326) | Vitamin D ≥ 30 (n = 110) | p Value | |
| Age (years) | 50.30 ± 10.95 | 55.07 ± 11.91 | <0.001 | 49.72 ± 11.04 | 56.77 ± 11.06 | <0.001 |
| BW (kg) | 76.21 ± 12.33 | 72.80 ± 11.23 | <0.001 | 58.38 ± 9.59 | 55.90 ± 7.58 | <0.01 |
| BMI (kg/m2) | 25.86 ± 3.64 | 25.18 ± 3.29 | <0.05 | 23.05 ± 3.57 | 22.36 ± 2.76 | <0.05 |
| WBC (103/μL) | 6.52 ± 1.70 | 6.21 ± 1.62 | <0.05 | 5.88 ± 1.70 | 5.58 ± 1.65 | 0.10 |
| RBC (106/μL) | 5.12 ± 0.50 | 5.09 ± 0.48 | 0.38 | 4.64 ± 0.40 | 4.56 ± 0.40 | 0.06 |
| Hb (g/dL) | 15.42 ± 1.30 | 15.41 ± 1.22 | 0.95 | 13.66 ± 1.33 | 13.91 ± 0.91 | <0.05 |
| Hct (%) | 45.52 ± 3.56 | 45.54 ± 3.18 | 0.93 | 40.66 ± 3.42 | 41.30 ± 2.63 | <0.05 |
| MCH (pg) | 30.22 ± 2.64 | 30.46 ± 2.86 | 0.29 | 29.55 ± 3.11 | 30.61 ± 1.88 | <0.001 |
| MCV (fL) | 89.15 ± 6.67 | 89.95 ± 7.16 | 0.17 | 87.87 ± 7.59 | 90.81 ± 4.86 | <0.001 |
| MCHC (g/dL) | 33.86 ± 0.86 | 33.82 ± 0.90 | 0.63 | 33.56 ± 1.02 | 33.69 ± 0.69 | 0.13 |
| Platelets (103/μL) | 236.5 ± 60.34 | 224.0 ± 48.86 | <0.01 | 258.0 ± 55.94 | 244.2 ± 61.98 | <0.05 |
| MPV (fL) | 8.45 ± 0.87 | 8.50 ± 0.88 | 0.52 | 8.47 ± 0.91 | 8.50 ± 0.89 | 0.71 |
| Fasting glucose (mg/dL) | 100.8 ± 24.49 | 100.7 ± 23.35 | 0.97 | 92.76 ± 20.52 | 95.78 ± 20.36 | 0.18 |
| HbA1c (%) | 5.74 ± 0.91 | 5.81 ± 0.97 | 0.42 | 5.51 ± 0.61 | 5.62 ± 0.65 | 0.14 |
| BUN (mg/dL) | 11.54 ± 3.68 | 11.95 ± 3.44 | 0.18 | 9.40 ± 3.05 | 10.14 ± 3.49 | <0.05 |
| Creatinine (mg/dL) | 0.95 ± 0.25 | 0.93 ± 0.14 | 0.35 | 0.65 ± 0.09 | 0.67 ± 0.10 | 0.14 |
| Uric acid (mg/dL) | 6.57 ± 1.28 | 6.42 ± 1.27 | 0.19 | 5.01 ± 1.09 | 4.94 ± 1.03 | 0.55 |
| AST (U/L) | 22.18 ± 9.68 | 22.83 ± 9.40 | 0.42 | 19.15 ± 6.70 | 21.04 ± 7.65 | <0.05 |
| ALT (U/L) | 28.41 ± 19.22 | 25.92 ± 17.73 | 0.11 | 18.02 ± 11.63 | 19.95 ± 14.48 | 0.20 |
| r-GT (U/L) | 31.75 ± 32.72 | 30.79 ± 28.15 | 0.70 | 19.11 ± 14.67 | 19.32 ± 12.77 | 0.89 |
| Alk-p (U/L) | 60.02 ± 19.54 | 57.00 ± 14.38 | <0.05 | 57.39 ± 17.52 | 58.20 ± 17.15 | 0.67 |
| Total bilirubin (mg/dL) | 1.13 ± 0.49 | 1.13 ± 0.43 | 0.99 | 0.92 ± 0.37 | 0.94 ± 0.36 | 0.75 |
| Total protein (g/dL) | 7.12 ± 0.38 | 7.08 ± 0.38 | 0.20 | 7.19 ± 0.40 | 7.12 ± 0.43 | 0.12 |
| Albumin (g/dL) | 4.51 ± 0.26 | 4.46 ± 0.26 | 0.06 | 4.41 ± 0.24 | 4.38 ± 0.22 | 0.23 |
| Globulin (g/dL) | 2.61 ± 0.33 | 2.61 ± 0.35 | 0.95 | 2.77 ± 0.34 | 2.73 ± 0.36 | 0.29 |
| TG (mg/dL) | 152.1 ± 83.64 | 128.8 ± 70.04 | <0.001 | 113.6 ± 61.47 | 101.0 ± 44.50 | <0.05 |
| Total cholesterol (mg/dL) | 187.6 ± 36.89 | 186.8 ± 38.65 | 0.78 | 198.2 ± 40.53 | 206.6 ± 33.63 | <0.05 |
| HDL-C (mg/dL) | 44.16 ± 9.62 | 47.48 ± 11.46 | <0.001 | 58.65 ± 14.38 | 62.80 ± 15.14 | <0.05 |
| LDL-C (mg/dL) | 124.8 ± 32.88 | 123.8 ± 36.08 | 0.72 | 124.1 ± 35.29 | 128.9 ± 30.29 | 0.19 |
| TSH (μIU/mL) | 2.08 ± 1.40 | 2.01 ± 1.48 | 0.57 | 2.64 ± 4.79 | 2.08 ± 1.30 | 0.06 |
| T3 (ng/dL) | 104.8 ± 18.85 | 103.2 ± 16.12 | 0.30 | 98.9 ± 18.23 | 101.5 ± 19.77 | 0.20 |
| Free T4 (ng/dL) | 0.96 ± 0.27 | 0.93 ± 0.13 | 0.14 | 0.92 ± 0.17 | 0.90 ± 0.11 | 0.34 |
| Age ≥ 65 Years | Age < 65 Years | |||||
|---|---|---|---|---|---|---|
| Vitamin D < 30 (n = 60) | Vitamin D ≥ 30 (n = 72) | p Value | Vitamin D < 30 (n = 605) | Vitamin D ≥ 30 (n = 272) | p Value | |
| Female (%) | 28 (46.67) | 23 (31.94) | 0.08 | 298 (49.26) | 87 (31.99) | <0.001 |
| BW (kg) | 63.76 ± 11.16 | 62.53 ± 12.12 | 0.54 | 67.84 ± 14.43 | 68.68 ± 12.80 | 0.38 |
| BMI (kg/m2) | 24.86 ± 3.22 | 23.68 ± 3.44 | <0.05 | 24.44 ± 0.92 | 24.44 ± 3.37 | 0.98 |
| WBC (103/μL) | 6.20 ± 1.65 | 5.66 ± 1.29 | <0.05 | 6.21 ± 1.74 | 6.10 ± 1.72 | 0.38 |
| RBC (106/μL) | 4.65 ± 0.47 | 4.76 ± 0.51 | 0.20 | 4.91 ± 0.51 | 4.96 ± 0.52 | 0.20 |
| Hb (g/dL) | 14.40 ± 1.32 | 14.62 ± 1.25 | 0.32 | 14.57 ± 1.60 | 15.01 ± 1.34 | <0.001 |
| Hct (%) | 42.55 ± 3.74 | 43.24 ± 3.37 | 0.26 | 43.19 ± 4.29 | 44.44 ± 3.63 | <0.001 |
| MCH (pg) | 31.02 ± 2.07 | 30.85 ± 2.59 | 0.67 | 29.78 ± 2.94 | 30.42 ± 2.58 | <0.005 |
| MCV (fL) | 91.60 ± 5.04 | 91.19 ± 6.79 | 0.69 | 88.22 ± 7.27 | 89.97 ± 6.43 | <0.001 |
| MCHC (g/dL) | 33.85 ± 0.76 | 33.81 ± 0.73 | 0.75 | 33.70 ± 0.97 | 33.77 ± 0.87 | 0.28 |
| Platelets (103/μL) | 221.6 ± 45.85 | 215.3 ± 47.09 | 0.43 | 249.6 ± 59.79 | 234.5 ± 55.10 | <0.001 |
| MPV (fL) | 8.66 ± 0.85 | 8.61 ± 0.92 | 0.72 | 8.44 ± 0.89 | 8.47 ± 0.87 | 0.60 |
| Fasting glucose (mg/dL) | 105.8 ± 25.36 | 106.8 ± 28.55 | 0.83 | 95.97 ± 22.54 | 97.12 ± 20.22 | 0.45 |
| HbA1c (%) | 5.96 ± 0.86 | 6.14 ± 1.28 | 0.32 | 5.60 ± 0.77 | 5.64 ± 0.71 | 0.45 |
| BUN (mg/dL) | 12.56 ± 5.04 | 13.25 ± 3.74 | 0.38 | 10.29 ± 3.30 | 10.87 ± 3.34 | <0.05 |
| Creatinine (mg/dL) | 0.86 ± 0.48 | 0.85 ± 0.19 | 0.94 | 0.80 ± 0.20 | 0.85 ± 0.17 | <0.001 |
| Uric acid (mg/dL) | 5.92 ± 1.50 | 5.84 ± 1.35 | 0.74 | 5.79 ± 1.42 | 5.98 ± 1.39 | 0.06 |
| AST (U/L) | 22.38 ± 9.46 | 22.13 ± 5.74 | 0.86 | 20.53 ± 8.37 | 22.29 ± 9.58 | <0.01 |
| ALT (U/L) | 20.86 ± 12.40 | 20.54 ± 7.83 | 0.86 | 23.55 ± 17.13 | 24.93 ± 18.56 | 0.28 |
| r-GT (U/L) | 27.65 ± 40.88 | 25.69 ± 20.97 | 0.73 | 25.34 ± 24.40 | 27.53 ± 25.86 | 0.23 |
| Alk-p (U/L) | 63.01 ± 17.45 | 61.37 ± 15.82 | 0.57 | 58.30 ± 18.69 | 56.33 ± 15.02 | 0.09 |
| Total bilirubin (mg/dL) | 0.96 ± 0.31 | 1.03 ± 0.44 | 0.26 | 1.04 ± 0.46 | 1.08 ± 0.42 | 0.21 |
| Total protein (g/dL) | 7.08 ± 0.40 | 7.05 ± 0.46 | 0.77 | 7.16 ± 0.39 | 7.10 ± 0.30 | <0.05 |
| Albumin (g/dL) | 4.33 ± 0.25 | 4.31 ± 0.25 | 0.54 | 4.47 ± 0.25 | 4.47 ± 0.23 | 0.92 |
| Globulin (g/dL) | 2.74 ± 0.38 | 2.74 ± 0.42 | 0.94 | 2.68 ± 0.34 | 2.62 ± 0.34 | <0.05 |
| TG (mg/dL) | 134.4 ± 69.92 | 114.2 ± 65.68 | 0.08 | 133.1 ± 76.68 | 121.5 ± 63.94 | <0.05 |
| Total cholesterol (mg/dL) | 192.1 ± 41.31 | 186.5 ± 36.71 | 0.40 | 129.9 ± 38.85 | 194.8 ± 38.47 | 0.48 |
| HDL-C (mg/dL) | 51.03 ± 13.09 | 50.91 ± 13.40 | 0.96 | 51.29 ± 14.28 | 52.77 ± 14.90 | 0.16 |
| LDL-C (mg/dL) | 121.9 ± 40.36 | 120.5 ± 34.92 | 0.83 | 124.7 ± 33.33 | 126.7 ± 34.18 | 0.41 |
| TSH (μIU/mL) | 3.94 ± 10.61 | 2.29 ± 2.18 | 0.24 | 2.20 ± 1.49 | 1.96 ± 1.13 | <0.05 |
| T3 (ng/dL) | 98.72 ± 20.26 | 100.60 ± 20.44 | 0.59 | 102.2 ± 18.60 | 103.2 ± 16.44 | 0.40 |
| Free T4 (ng/dL) | 0.90 ± 0.16 | 0.91 ± 0.13 | 0.71 | 0.94 ± 0.23 | 0.92 ± 0.13 | 0.21 |
| Men Younger than 50 Years | Women Younger than 50 Years | |||||
|---|---|---|---|---|---|---|
| Vitamin D < 30 (n = 168) | Vitamin D ≥ 30 (n = 82) | p Value | Vitamin D < 30 (n = 186) | Vitamin D ≥ 30 (n = 27) | p Value | |
| Age (years) | 41.58 ± 7.11 | 41.61 ± 6.08 | 0.98 | 41.97 ± 6.64 | 41.33 ± 6.27 | 0.64 |
| BW (kg) | 78.49 ± 13.39 | 76.52 ± 12.97 | 0.27 | 59.15 ± 9.99 | 55.77 ± 4.65 | 0.08 |
| BMI (kg/m2) | 25.88 ± 4.09 | 25.56 ± 3.97 | 0.57 | 22.81 ± 3.57 | 21.57 ± 2.04 | 0.08 |
| WBC (103/μL) | 6.67 ± 1.80 | 6.41 ± 1.72 | 0.28 | 5.88 ± 1.80 | 5.60 ± 1.61 | 0.20 |
| RBC (106/μL) | 5.22 ± 0.50 | 5.19 ± 0.49 | 0.61 | 4.66 ± 0.43 | 4.46 ± 0.34 | <0.05 |
| Hb (g/dL) | 15.52 ± 1.31 | 15.65 ± 0.99 | 0.42 | 13.51 ± 1.46 | 13.72 ± 0.96 | 0.48 |
| Hct (%) | 45.88 ± 3.53 | 46.21 ± 2.59 | 0.44 | 40.35 ± 3.77 | 40.59 ± 2.96 | 0.75 |
| MCH (pg) | 29.87 ± 2.77 | 30.34 ± 2.53 | 0.19 | 29.17 ± 3.41 | 30.81 ± 1.31 | <0.05 |
| MCV (fL) | 88.23 ± 6.95 | 89.55 ± 6.59 | 0.15 | 87.01 ± 8.32 | 91.18 ± 3.48 | <0.05 |
| MCHC (g/dL) | 33.81 ± 0.91 | 33.86 ± 0.75 | 0.69 | 33.45 ± 1.08 | 33.80 ± 0.61 | 0.10 |
| Platelets (103/μL) | 236.5 ± 60.34 | 224.0 ± 48.86 | 0.16 | 268.2 ± 58.24 | 268.4 ± 85.49 | 0.99 |
| MPV (fL) | 8.44 ± 0.88 | 8.57 ± 0.88 | 0.26 | 8.46 ± 0.95 | 8.26 ± 0.90 | 0.30 |
| Fasting glucose (mg/dL) | 96.19 ± 15.71 | 93.73 ± 16.00 | 0.25 | 88.44 ± 19.96 | 88.15 ± 8.23 | 0.94 |
| HbA1c (%) | 5.56 ± 0.60 | 5.52 ± 0.75 | 0.65 | 5.33 ± 0.53 | 5.26 ± 0.28 | 0.48 |
| BUN (mg/dL) | 10.82 ± 3.29 | 10.90 ± 3.11 | 0.85 | 8.29 ± 2.39 | 7.37 ± 1.96 | 0.06 |
| Creatinine (mg/dL) | 0.95 ± 0.21 | 0.93 ± 0.12 | 0.42 | 0.65 ± 0.08 | 0.68 ± 0.08 | <0.05 |
| Uric acid (mg/dL) | 6.72 ± 1.26 | 6.55 ± 1.3 | 0.32 | 4.83 ± 0.99 | 4.94 ± 0.82 | 0.09 |
| AST (U/L) | 22.3 ± 10.71 | 24.37 ± 13.00 | 0.18 | 17.58 ± 6.58 | 16.89 ± 2.99 | 0.59 |
| ALT (U/L) | 29.76 ± 21.73 | 30.20 ± 24.74 | 0.89 | 16.1 ± 12.03 | 13.11 ± 3.56 | 0.20 |
| r-GT (U/L) | 30.93 ± 21.24 | 29.39 ± 19.97 | 0.58 | 16.45 ± 9.70 | 12.93 ± 4.68 | 0.06 |
| Alk-p (U/L) | 59.6± 15.68 | 55.88 ± 12.21 | 0.06 | 50.71 ± 15.01 | 42.07 ± 12.37 | <0.01 |
| Total bilirubin (mg/dL) | 1.17 ± 0.55 | 1.19 ± 0.48 | 0.75 | 0.95 ± 0.40 | 0.96 ± 0.39 | 0.97 |
| Total protein (g/dL) | 7.21 ± 0.37 | 7.12 ± 0.36 | 0.06 | 7.18 ± 0.44 | 7.09 ± 0.42 | 0.32 |
| Albumin (g/dL) | 4.58 ± 0.25 | 4.56 ± 0.24 | 0.50 | 4.41 ± 0.25 | 4.42 ± 0.24 | 0.85 |
| Globulin (g/dL) | 2.63 ± 0.35 | 2.56 ± 0.34 | 0.14 | 2.77 ± 0.35 | 2.67 ± 0.36 | 0.17 |
| TG (mg/dL) | 151.1 ± 80.28 | 134.2 ± 76.94 | 0.11 | 106.7 ± 58.31 | 85.07 ± 26.82 | 0.06 |
| Total cholesterol (mg/dL) | 189.6 ± 33.05 | 192.2 ± 39.57 | 0.59 | 188.7 ± 36.63 | 198.1 ± 37.69 | 0.21 |
| HDL-C (mg/dL) | 43.37 ± 8.89 | 49.2 ± 13.15 | <0.001 | 57.76 ± 13.45 | 67.74 ± 14.96 | <0.001 |
| LDL-C (mg/dL) | 129.0 ± 29.98 | 128.1 ± 36.74 | 0.85 | 117.7 ± 33.03 | 116.0 ± 32.25 | 0.80 |
| TSH (μIU/mL) | 2.00 ± 1.13 | 1.92 ± 1.15 | 0.60 | 2.40 ±1.84 | 1.87 ± 0.98 | 0.14 |
| T3 (ng/dL) | 107.4 ± 16.32 | 104.5 ± 15.22 | 0.18 | 99.41 ± 18.75 | 98.78 ± 21.03 | 0.87 |
| Free T4 (ng/dL) | 0.95 ± 0.13 | 0.94 ± 0.13 | 0.51 | 0.93 ± 0.19 | 0.89 ± 0.11 | 0.29 |
| Men Aged between 50 and 65 Years | Women Aged between 50 and 65 Years | |||||
|---|---|---|---|---|---|---|
| Vitamin D < 30 (n = 135) | Vitamin D ≥ 30 (n = 100) | p Value | Vitamin D < 30 (n = 105) | Vitamin D ≥ 30 (n = 56) | p Value | |
| Age (years) | 56.55 ± 4.14 | 57.97 ± 4.01 | <0.01 | 57.19 ± 3.98 | 58.05 ± 4.23 | 0.20 |
| BW (kg) | 74.95 ± 10.53 | 72.97 ± 9.31 | 0.13 | 57.36 ± 9.18 | 57.29 ± 7.63 | 0.95 |
| BMI (kg/m2) | 25.96 ± 3.17 | 25.29 ± 2.8 | 0.09 | 23.02 ± 3.50 | 22.94 ± 2.89 | 0.87 |
| WBC (103/μL) | 6.36 ± 1.61 | 6.30 ± 1.69 | 0.74 | 5.55 ± 1.48 | 5.59 ± 1.84 | 0.88 |
| RBC (106/μL) | 5.11 ± 0.47 | 5.08 ± 0.45 | 0.67 | 4.66 ± 0.32 | 4.67 ± 0.46 | 0.85 |
| Hb (g/dL) | 15.40 ± 1.28 | 15.41 ± 1.32 | 0.92 | 13.90 ± 1.18 | 14.04 ± 0.92 | 0.45 |
| Hct (%) | 45.44 ± 3.48 | 45.55 ± 3.36 | 0.81 | 41.15 ± 2.96 | 41.75 ± 2.59 | 0.21 |
| MCH (pg) | 30.24 ± 2.57 | 30.50 ± 3.14 | 0.50 | 29.91 ± 2.70 | 30.22 ± 2.23 | 0.47 |
| MCV (fL) | 89.25 ± 6.54 | 90.04 ± 7.54 | 0.39 | 88.54 ± 6.59 | 89.79 ± 5.63 | 0.23 |
| MCHC (g/dL) | 33.85 ± 0.83 | 33.81 ± 1.06 | 0.70 | 33.74 ± 0.97 | 33.63 ± 0.78 | 0.47 |
| Platelets (103/μL) | 235.9 ± 72.80 | 223.4 ± 50.39 | 0.14 | 245.7 ± 53.23 | 240.8 ± 51.92 | 0.58 |
| MPV (fL) | 8.43 ± 0.88 | 8.47 ± 0.85 | 0.72 | 8.43 ± 0.85 | 8.44 ± 0.87 | 0.95 |
| Fasting glucose (mg/dL) | 105.1 ± 31.59 | 102.6 ± 25.36 | 0.52 | 96.04 ± 16.47 | 95.34 ± 17.58 | 0.80 |
| HbA1c (%) | 5.95 ± 1.16 | 5.80 ± 0.81 | 0.28 | 5.68 ± 0.52 | 5.64 ± 0.55 | 0.60 |
| BUN (mg/dL) | 12.00 ± 3.10 | 12.09 ± 3.17 | 0.83 | 10.62 ± 3.30 | 9.91 ± 2.84 | 0.18 |
| Creatinine (mg/dL) | 0.94 ± 0.15 | 0.95 ± 0.15 | 0.71 | 0.67 ± 0.11 | 0.65 ± 0.10 | 0.46 |
| Uric acid (mg/dL) | 6.44 ± 1.27 | 6.39 ± 1.24 | 0.76 | 5.21 ± 1.11 | 5.07 ± 1.04 | 0.47 |
| AST (U/L) | 21.87 ± 7.62 | 21.80 ± 6.82 | 0.94 | 21.04 ± 6.77 | 22.45 ± 9.40 | 0.28 |
| ALT (U/L) | 27.91 ± 16.68 | 24.86 ± 13.17 | 0.13 | 21.31 ± 11.67 | 23.08 ± 18.65 | 0.45 |
| r-GT (U/L) | 29.26 ± 17.68 | 33.53 ± 34.96 | 0.22 | 22.90 ± 18.12 | 20.23 ± 10.72 | 0.32 |
| Alk-p (U/L) | 60.99 ± 24.11 | 56.98 ± 15.43 | 0.15 | 66.22 ± 17.00 | 61.50 ± 15.90 | 0.09 |
| Total bilirubin (mg/dL) | 1.10 ± 0.46 | 1.11 ± 0.41 | 0.81 | 0.91 ± 0.36 | 0.95 ± 0.33 | 0.51 |
| Total protein (g/dL) | 7.07 ± 0.38 | 7.04 ± 0.36 | 0.50 | 7.18 ± 0.38 | 7.23 ± 0.41 | 0.51 |
| Albumin (g/dL) | 4.47 ± 0.25 | 4.47 ± 0.23 | 0.83 | 4.44 ± 0.24 | 4.42 ± 0.24 | 0.64 |
| Globulin (g/dL) | 2.60 ± 0.32 | 2.57 ± 0.31 | 0.54 | 2.75 ± 0.31 | 2.81 ± 0.34 | 0.25 |
| TG (mg/dL) | 161.6 ± 92.25 | 131.0 ± 65.82 | <0.01 | 117.1 ± 58.62 | 103.5 ± 40.49 | 0.12 |
| Total cholesterol (mg/dL) | 185.9 ± 41.41 | 186.5 ± 37.74 | 0.91 | 211.5 ± 41.89 | 215.0 ± 31.42 | 0.59 |
| HDL-C (mg/dL) | 44.11 ± 9.56 | 46.38 ± 9.30 | 0.07 | 60.56 ± 15.21 | 62.91 ± 17.49 | 0.38 |
| LDL-C (mg/dL) | 120.2 ± 34.84 | 125.0 ± 35.79 | 0.31 | 133.8 ± 34.51 | 135.7 ± 27.04 | 0.72 |
| TSH (μIU/mL) | 2.10 ± 1.48 | 1.96 ± 1.13 | 0.44 | 2.41 ±1.36 | 2.00 ± 1.13 | 0.06 |
| T3 (ng/dL) | 103.3 ± 20.93 | 103.9 ± 15.73 | 0.80 | 97.89 ± 16.79 | 100.6 ± 16.45 | 0.33 |
| Free T4 (ng/dL) | 0.97 ± 0.40 | 0.94 ± 0.14 | 0.42 | 0.92 ± 0.14 | 0.92 ± 0.12 | 0.76 |
Publisher’s Note: MDPI stays neutral with regard to jurisdictional claims in published maps and institutional affiliations. |
© 2022 by the authors. Licensee MDPI, Basel, Switzerland. This article is an open access article distributed under the terms and conditions of the Creative Commons Attribution (CC BY) license (https://creativecommons.org/licenses/by/4.0/).
Share and Cite
Cheng, Y.-L.; Lee, T.-W.; Lee, T.-I.; Kao, Y.-H.; Wu, C.-Y.; Chen, Y.-J. Sex and Age Differences Modulate Association of Vitamin D with Serum Triglyceride Levels. J. Pers. Med. 2022, 12, 440. https://doi.org/10.3390/jpm12030440
Cheng Y-L, Lee T-W, Lee T-I, Kao Y-H, Wu C-Y, Chen Y-J. Sex and Age Differences Modulate Association of Vitamin D with Serum Triglyceride Levels. Journal of Personalized Medicine. 2022; 12(3):440. https://doi.org/10.3390/jpm12030440
Chicago/Turabian StyleCheng, Ying-Lien, Ting-Wei Lee, Ting-I Lee, Yu-Hsun Kao, Chih-Yin Wu, and Yi-Jen Chen. 2022. "Sex and Age Differences Modulate Association of Vitamin D with Serum Triglyceride Levels" Journal of Personalized Medicine 12, no. 3: 440. https://doi.org/10.3390/jpm12030440
APA StyleCheng, Y.-L., Lee, T.-W., Lee, T.-I., Kao, Y.-H., Wu, C.-Y., & Chen, Y.-J. (2022). Sex and Age Differences Modulate Association of Vitamin D with Serum Triglyceride Levels. Journal of Personalized Medicine, 12(3), 440. https://doi.org/10.3390/jpm12030440