
Artificial Intelligence-Enabled Electrocardiogram Estimates Left Atrium Enlargement as a Predictor of Future Cardiovascular Disease


 ,
,  , and
, and 
Abstract
:1. Introduction
2. Materials and Methods
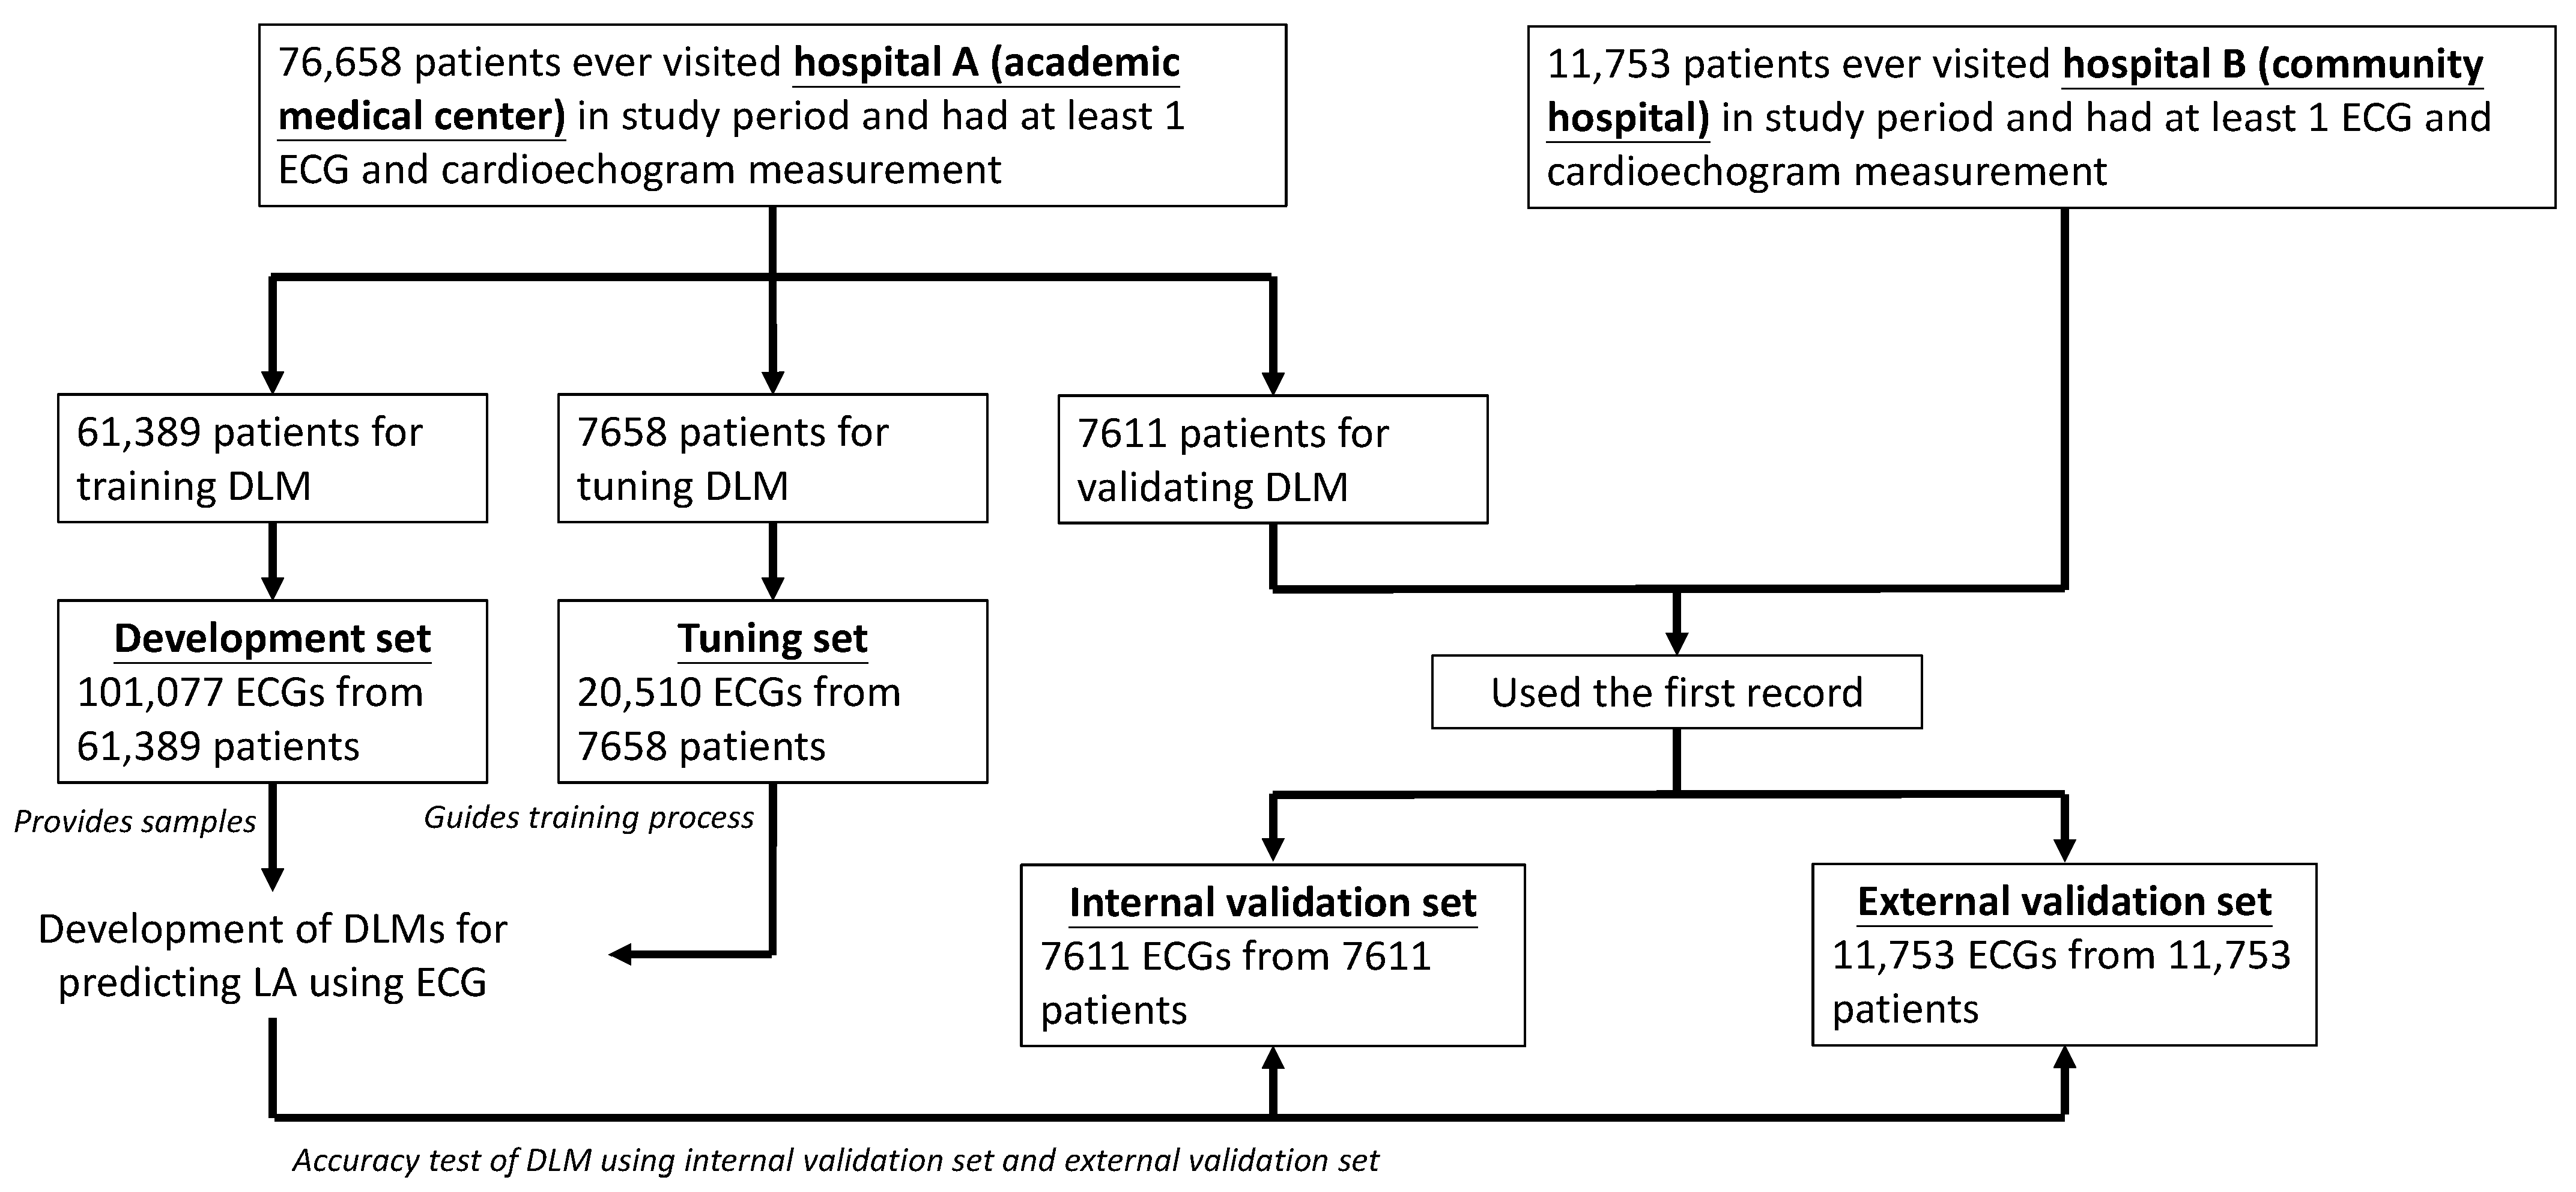
2.1. Data Source and Population
2.2. Data Collection
2.3. Deep Learning Model for Estimating Left Atrium Diameter
2.4. Statistical Analysis and Model Performance Assessment
3. Results
4. Discussion
5. Conclusions
Author Contributions
Funding
Institutional Review Board Statement
Informed Consent Statement
Data Availability Statement
Conflicts of Interest
Appendix A

Appendix B. Deep Learning Model Implementation
Appendix C. Categorywise Encoding Technology
Appendix D


Appendix E
References
- Pritchett, A.M.; Jacobsen, S.J.; Mahoney, D.W.; Rodeheffer, R.J.; Bailey, K.R.; Redfield, M.M. Left atrial volume as an index ofleft atrial size: A population-based study. J. Am. Coll. Cardiol. 2003, 41, 1036–1043. [Google Scholar] [CrossRef] [Green Version]
- Fang, D.; Wang, N.; Chen, Q.; Wu, G.; Wu, J.; Zhang, W.; Fu, G. The association between hyperuricemia and left atrial enlargement in healthy adults. Ann. Transl. Med. 2021, 9, 1176. [Google Scholar] [CrossRef]
- Milan, A.; Puglisi, E.; Magnino, C.; Naso, D.; Abram, S.; Avenatti, E.; Rabbia, F.; Mulatero, P.; Veglio, F. Left atrial enlargement in essential hypertension: Role in the assessment of subclinical hypertensive heart disease. Blood Press. 2012, 21, 88–96. [Google Scholar] [CrossRef]
- Su, G.; Cao, H.; Xu, S.; Lu, Y.; Shuai, X.; Sun, Y.; Liao, Y.; Li, J. Left atrial enlargement in the early stage of hypertensive heart disease: A common but ignored condition. J. Clin. Hypertens. 2014, 16, 192–197. [Google Scholar] [CrossRef] [Green Version]
- Xu, Y.; Zhao, L.; Zhang, L.; Han, Y.; Wang, P.; Yu, S. Left Atrial Enlargement and the Risk of Stroke: A Meta-Analysis of Prospective Cohort Studies. Front. Neurol. 2020, 11, 26. [Google Scholar] [CrossRef]
- Park, S.-M.; Park, S.W.; Casaclang-Verzosa, G.; Ommen, S.R.; Pellikka, P.A.; Miller, F.A.; Sarano, M.E.; Kubo, S.H.; Oh, J.K. Diastolic dysfunction and left atrial enlargement as contributing factors to functional mitral regurgitation in dilated cardiomyopathy: Data from the Acorn trial. Am. Heart J. 2009, 157, 762.e3–762.e10. [Google Scholar] [CrossRef]
- Tanimoto, M.; Pai, R.G. Effect of isolated left atrial enlargement on mitral annular size and valve competence. Am. J. Cardiol. 1996, 77, 769–774. [Google Scholar] [CrossRef]
- Vaziri, S.M.; Larson, M.G.; Benjamin, E.J.; Levy, D. Echocardiographic predictors of nonrheumatic atrial fibrillation. The Framingham Heart Study. Circulation 1994, 89, 724–730. [Google Scholar] [CrossRef] [PubMed] [Green Version]
- Le Tourneau, T.; Messika-Zeitoun, D.; Russo, A.; Detaint, D.; Topilsky, Y.; Mahoney, D.W.; Suri, R.; Enriquez-Sarano, M. Impact of left atrial volume on clinical outcome in organic mitral regurgitation. J. Am. Coll. Cardiol. 2010, 56, 570–578. [Google Scholar] [CrossRef] [Green Version]
- Patel, D.A.; Lavie, C.J.; Milani, R.V.; Shah, S.; Gilliland, Y. Clinical implications of left atrial enlargement: A review. Ochsner J. 2009, 9, 191–196. [Google Scholar] [PubMed]
- Iliadis, C.; Baldus, S.; Kalbacher, D.; Boekstegers, P.; Schillinger, W.; Ouarrak, T.; Zahn, R.; Butter, C.; Zuern, C.S.; von Bardeleben, R.S.; et al. Impact of left atrial diameter on outcome in patients undergoing edge-to-edge mitral valve repair: Results from the German TRAnscatheter Mitral valve Interventions (TRAMI) registry. Eur. J. Heart Fail. 2020, 22, 1202–1210. [Google Scholar] [CrossRef]
- Patel, K.; Mikhael, E.; Liu, M.; Rangaraju, S.; Ellis, D.; Duncan, A.; Belagaje, S.; Belair, T.; Henriquez, L.; Nahab, F. Anticoagulation Therapy Reduces Recurrent Stroke in Embolic Stroke of Undetermined Source Patients With Elevated Coagulation Markers or Severe Left Atrial Enlargement. Front. Neurol. 2021, 12, 695378. [Google Scholar] [CrossRef]
- Lang, R.M.; Badano, L.P.; Mor-Avi, V.; Afilalo, J.; Armstrong, A.; Ernande, L.; Flachskampf, F.A.; Foster, E.; Goldstein, S.A.; Kuznetsova, T.; et al. Recommendations for Cardiac Chamber Quantification by Echocardiography in Adults: An Update from the American Society of Echocardiography and the European Association of Cardiovascular Imaging. J. Am. Soc. Echocardiogr. 2015, 28, 1–39. [Google Scholar] [CrossRef] [Green Version]
- To, A.C.Y.; Flamm, S.D.; Marwick, T.H.; Klein, A.L. Clinical Utility of Multimodality LA Imaging: Assessment of Size, Function, and Structure. JACC Cardiovasc. Imaging 2011, 4, 788–798. [Google Scholar] [CrossRef] [PubMed] [Green Version]
- Lyon, A.; Mincholé, A.; Martínez, J.P.; Laguna, P.; Rodriguez, B. Computational techniques for ECG analysis and interpretation in light of their contribution to medical advances. J. R. Soc. Interface 2018, 15, 20170821. [Google Scholar] [CrossRef]
- Munuswamy, K.; Alpert, M.A.; Martin, R.H.; Whiting, R.B.; Mechlin, N.J. Sensitivity and specificity of commonly used electrocardiographic criteria for left atrial enlargement determined by M-mode echocardiography. Am. J. Cardiol. 1984, 53, 829–832. [Google Scholar] [CrossRef]
- Hazen, M.S.; Marwick, T.H.; Underwood, D.A. Diagnostic accuracy of the resting electrocardiogram in detection and estimation of left atrial enlargement: An echocardiographic correlation in 551 patients. Am. Heart J. 1991, 122, 823–828. [Google Scholar] [CrossRef]
- Tsao, C.W.; Josephson, M.E.; Hauser, T.H.; O’Halloran, T.D.; Agarwal, A.; Manning, W.J.; Yeon, S.B. Accuracy of electrocardiographic criteria for atrial enlargement: Validation with cardiovascular magnetic resonance. J. Cardiovasc. Magn. Reson. 2008, 10, 7. [Google Scholar] [CrossRef] [PubMed] [Green Version]
- Lee, K.S.; Appleton, C.P.; Lester, S.J.; Adam, T.J.; Hurst, R.T.; Moreno, C.A.; Altemose, G.T. Relation of electrocardiographic criteria for left atrial enlargement to two-dimensional echocardiographic left atrial volume measurements. Am. J. Cardiol. 2007, 99, 113–118. [Google Scholar] [CrossRef]
- Ng, C.; Ahmad, A.; Budhram, D.R.; He, M.; Balakrishnan, N.; Mondal, T. Accuracy of Electrocardiography and Agreement with Echocardiography in the Diagnosis of Pediatric Left Atrial Enlargement. Sci. Rep. 2020, 10, 10027. [Google Scholar] [CrossRef] [PubMed]
- Lin, C.S.; Lin, C.; Fang, W.H.; Hsu, C.J.; Chen, S.J.; Huang, K.H.; Lin, W.S.; Tsai, C.S.; Kuo, C.C.; Chau, T.; et al. A Deep-Learning Algorithm (ECG12Net) for Detecting Hypokalemia and Hyperkalemia by Electrocardiography: Algorithm Development. JMIR Med. Inform. 2020, 8, e15931. [Google Scholar] [CrossRef]
- Liu, W.C.; Lin, C.S.; Tsai, C.S.; Tsao, T.P.; Cheng, C.C.; Liou, J.T.; Lin, W.S.; Cheng, S.M.; Lou, Y.S.; Lee, C.C.; et al. A deep learning algorithm for detecting acute myocardial infarction. EuroIntervention 2021, 17, 765–773. [Google Scholar] [CrossRef] [PubMed]
- Lin, C.; Lin, C.S.; Lee, D.J.; Lee, C.C.; Chen, S.J.; Tsai, S.H.; Kuo, F.C.; Chau, T.; Lin, S.H. Artificial Intelligence-Assisted Electrocardiography for Early Diagnosis of Thyrotoxic Periodic Paralysis. J. Endocr. Soc. 2021, 5, bvab120. [Google Scholar] [CrossRef]
- Attia, Z.I.; Kapa, S.; Lopez-Jimenez, F.; McKie, P.M.; Ladewig, D.J.; Satam, G.; Pellikka, P.A.; Enriquez-Sarano, M.; Noseworthy, P.A.; Munger, T.M.; et al. Screening for cardiac contractile dysfunction using an artificial intelligence–enabled electrocardiogram. Nat. Med. 2019, 25, 70–74. [Google Scholar] [CrossRef]
- Raghunath, S.; Ulloa Cerna, A.E.; Jing, L.; vanMaanen, D.P.; Stough, J.; Hartzel, D.N.; Leader, J.B.; Kirchner, H.L.; Stumpe, M.C.; Hafez, A.; et al. Prediction of mortality from 12-lead electrocardiogram voltage data using a deep neural network. Nat. Med. 2020, 26, 886–891. [Google Scholar] [CrossRef]
- Tison, G.H.; Zhang, J.; Delling, F.N.; Deo, R.C. Automated and Interpretable Patient ECG Profiles for Disease Detection, Tracking, and Discovery. Circ. Cardiovasc. Qual. Outcomes 2019, 12, e005289. [Google Scholar] [CrossRef]
- Jiang, J.; Deng, H.; Xue, Y.; Liao, H.; Wu, S. Detection of Left Atrial Enlargement Using a Convolutional Neural Network-Enabled Electrocardiogram. Front. Cardiovasc. Med. 2020, 7, 609976. [Google Scholar] [CrossRef] [PubMed]
- Attia, Z.I.; Harmon, D.M.; Behr, E.R.; Friedman, P.A. Application of artificial intelligence to the electrocardiogram. Eur. Heart J. 2021, 42, 4717–4730. [Google Scholar] [CrossRef] [PubMed]
- American Diabetes Association. 2. Classification and Diagnosis of Diabetes: Standards of Medical Care in Diabetes—2021. Diabetes Care 2021, 44, S15. [Google Scholar] [CrossRef] [PubMed]
- Levin, A.; Stevens, P.E.; Bilous, R.W.; Coresh, J.; De Francisco, A.L.; De Jong, P.E.; Griffith, K.E.; Hemmelgarn, B.R.; Iseki, K.; Lamb, E.J.; et al. Kidney Disease: Improving Global Outcomes (KDIGO) CKD Work Group. KDIGO 2012 clinical practice guideline for the evaluation and management of chronic kidney disease. Kidney Int. Suppl. 2013, 3, 1–150. [Google Scholar]
- LeCun, Y.; Bengio, Y.; Hinton, G. Deep learning. Nature 2015, 521, 436–444. [Google Scholar] [CrossRef]
- Chang, D.-W.; Lin, C.-S.; Tsao, T.-P.; Lee, C.-C.; Chen, J.-T.; Tsai, C.-S.; Lin, W.-S.; Lin, C. Detecting Digoxin Toxicity by Artificial Intelligence-Assisted Electrocardiography. Int. J. Environ. Res. Public Health 2021, 18, 3839. [Google Scholar] [CrossRef]
- Gupta, S.; Matulevicius, S.A.; Ayers, C.R.; Berry, J.D.; Patel, P.C.; Markham, D.W.; Levine, B.D.; Chin, K.M.; de Lemos, J.A.; Peshock, R.M.; et al. Left atrial structure and function and clinical outcomes in the general population. Eur. Heart J. 2013, 34, 278–285. [Google Scholar] [CrossRef]
- Faletra, F.F.; Ho, S.Y.; Leo, L.A.; Paiocchi, V.L.; Mankad, S.; Vannan, M.; Moccetti, T. Which Cardiac Structure Lies Nearby? Revisiting Two-Dimensional Cross-Sectional Anatomy. J. Am. Soc. Echocardiogr. 2018, 31, 967–975. [Google Scholar] [CrossRef]
- Hoit, B.D. Left Atrial Size and Function: Role in Prognosis. J. Am. Coll. Cardiol. 2014, 63, 493–505. [Google Scholar] [CrossRef]
- Hannun, A.Y.; Rajpurkar, P.; Haghpanahi, M.; Tison, G.H.; Bourn, C.; Turakhia, M.P.; Ng, A.Y. Cardiologist-level arrhythmia detection and classification in ambulatory electrocardiograms using a deep neural network. Nat. Med. 2019, 25, 65–69. [Google Scholar] [CrossRef]
- Carey, R.M.; Muntner, P.; Bosworth, H.B.; Whelton, P.K. Prevention and Control of Hypertension: JACC Health Promotion Series. J. Am. Coll. Cardiol. 2018, 72, 1278–1293. [Google Scholar] [CrossRef]
- Zhang, H.; Thijs, L.; Staessen, J.A. Blood pressure lowering for primary and secondary prevention of stroke. Hypertension 2006, 48, 187–195. [Google Scholar] [CrossRef] [PubMed]
- Meschia, J.F.; Bushnell, C.; Boden-Albala, B.; Braun, L.T.; Bravata, D.M.; Chaturvedi, S.; Creager, M.A.; Eckel, R.H.; Elkind, M.S.; Fornage, M.; et al. Guidelines for the primary prevention of stroke: A statement for healthcare professionals from the American Heart Association/American Stroke Association. Stroke 2014, 45, 3754–3832. [Google Scholar] [CrossRef] [PubMed] [Green Version]
- Dziadzko, V.; Clavel, M.-A.; Dziadzko, M.; Medina-Inojosa, J.R.; Michelena, H.; Maalouf, J.; Nkomo, V.; Thapa, P.; Enriquez-Sarano, M. Outcome and undertreatment of mitral regurgitation: A community cohort study. Lancet 2018, 391, 960–969. [Google Scholar] [CrossRef]
- Boriani, G.; Laroche, C.; Diemberger, I.; Fantecchi, E.; Popescu, M.I.; Rasmussen, L.H.; Sinagra, G.; Petrescu, L.; Tavazzi, L.; Maggioni, A.P.; et al. Asymptomatic Atrial Fibrillation: Clinical Correlates, Management, and Outcomes in the EORP-AF Pilot General Registry. Am. J. Med. 2015, 128, 509–518.e502. [Google Scholar] [CrossRef] [PubMed]
- Gladstone, D.J.; Spring, M.; Dorian, P.; Panzov, V.; Thorpe, K.E.; Hall, J.; Vaid, H.; O’Donnell, M.; Laupacis, A.; Côté, R.; et al. Atrial fibrillation in patients with cryptogenic stroke. N. Engl. J. Med. 2014, 370, 2467–2477. [Google Scholar] [CrossRef] [Green Version]
- Attia, Z.I.; Friedman, P.A.; Noseworthy, P.A.; Lopez-Jimenez, F.; Ladewig, D.J.; Satam, G.; Pellikka, P.A.; Munger, T.M.; Asirvatham, S.J.; Scott, C.G.; et al. Age and Sex Estimation Using Artificial Intelligence From Standard 12-Lead ECGs. Circ. Arrhythmia Electrophysiol. 2019, 12, e007284. [Google Scholar] [CrossRef]
- Lima, E.M.; Ribeiro, A.H.; Paixão, G.M.M.; Ribeiro, M.H.; Pinto-Filho, M.M.; Gomes, P.R.; Oliveira, D.M.; Sabino, E.C.; Duncan, B.B.; Giatti, L.; et al. Deep neural network-estimated electrocardiographic age as a mortality predictor. Nat. Commun. 2021, 12, 5117. [Google Scholar] [CrossRef]
- Gatti Pianca, E.; da Rosa, L.G.B.; Barcellos, P.T.; Martins, S.C.O.; Foppa, M.; Pimentel, M.; Santos, A.B.S. Association between electrocardiographic and echocardiographic atrial abnormalities and prognosis in cryptogenic stroke. J. Stroke Cerebrovasc. Dis. 2020, 29, 105066. [Google Scholar] [CrossRef] [PubMed]
- Kamel, H.; Hunter, M.; Moon, Y.P.; Yaghi, S.; Cheung, K.; Di Tullio, M.R.; Okin, P.M.; Sacco, R.L.; Soliman, E.Z.; Elkind, M.S. Electrocardiographic Left Atrial Abnormality and Risk of Stroke: Northern Manhattan Study. Stroke 2015, 46, 3208–3212. [Google Scholar] [CrossRef] [PubMed] [Green Version]
- Cagirci, G.; Cay, S.; Karakurt, O.; Eryasar, N.; Acikel, S.; Dogan, M.; Yesilay, A.B.; Kilic, H.; Akdemir, R. P-wave dispersion increases in prehypertension. Blood Press. 2009, 18, 51–54. [Google Scholar] [CrossRef]
- Censi, F.; Corazza, I.; Reggiani, E.; Calcagnini, G.; Mattei, E.; Triventi, M.; Boriani, G. P-wave Variability and Atrial Fibrillation. Sci. Rep. 2016, 6, 26799. [Google Scholar] [CrossRef]
- Yao, X.; Rushlow, D.R.; Inselman, J.W.; McCoy, R.G.; Thacher, T.D.; Behnken, E.M.; Bernard, M.E.; Rosas, S.L.; Akfaly, A.; Misra, A.; et al. Artificial intelligence–enabled electrocardiograms for identification of patients with low ejection fraction: A pragmatic, randomized clinical trial. Nat. Med. 2021, 27, 815–819. [Google Scholar] [CrossRef]
- Jones, N.R.; Taylor, C.J.; Hobbs, F.D.R.; Bowman, L.; Casadei, B. Screening for atrial fibrillation: A call for evidence. Eur. Heart J. 2020, 41, 1075–1085. [Google Scholar] [CrossRef]
- Kaczorowski, J.; Chambers, L.W.; Dolovich, L.; Paterson, J.M.; Karwalajtys, T.; Gierman, T.; Farrell, B.; McDonough, B.; Thabane, L.; Tu, K.; et al. Improving cardiovascular health at population level: 39 community cluster randomised trial of Cardiovascular Health Awareness Program (CHAP). BMJ 2011, 342, d442. [Google Scholar] [CrossRef] [PubMed] [Green Version]
- Enriquez-Sarano, M.; Akins, C.W.; Vahanian, A. Mitral regurgitation. Lancet 2009, 373, 1382–1394. [Google Scholar] [CrossRef]


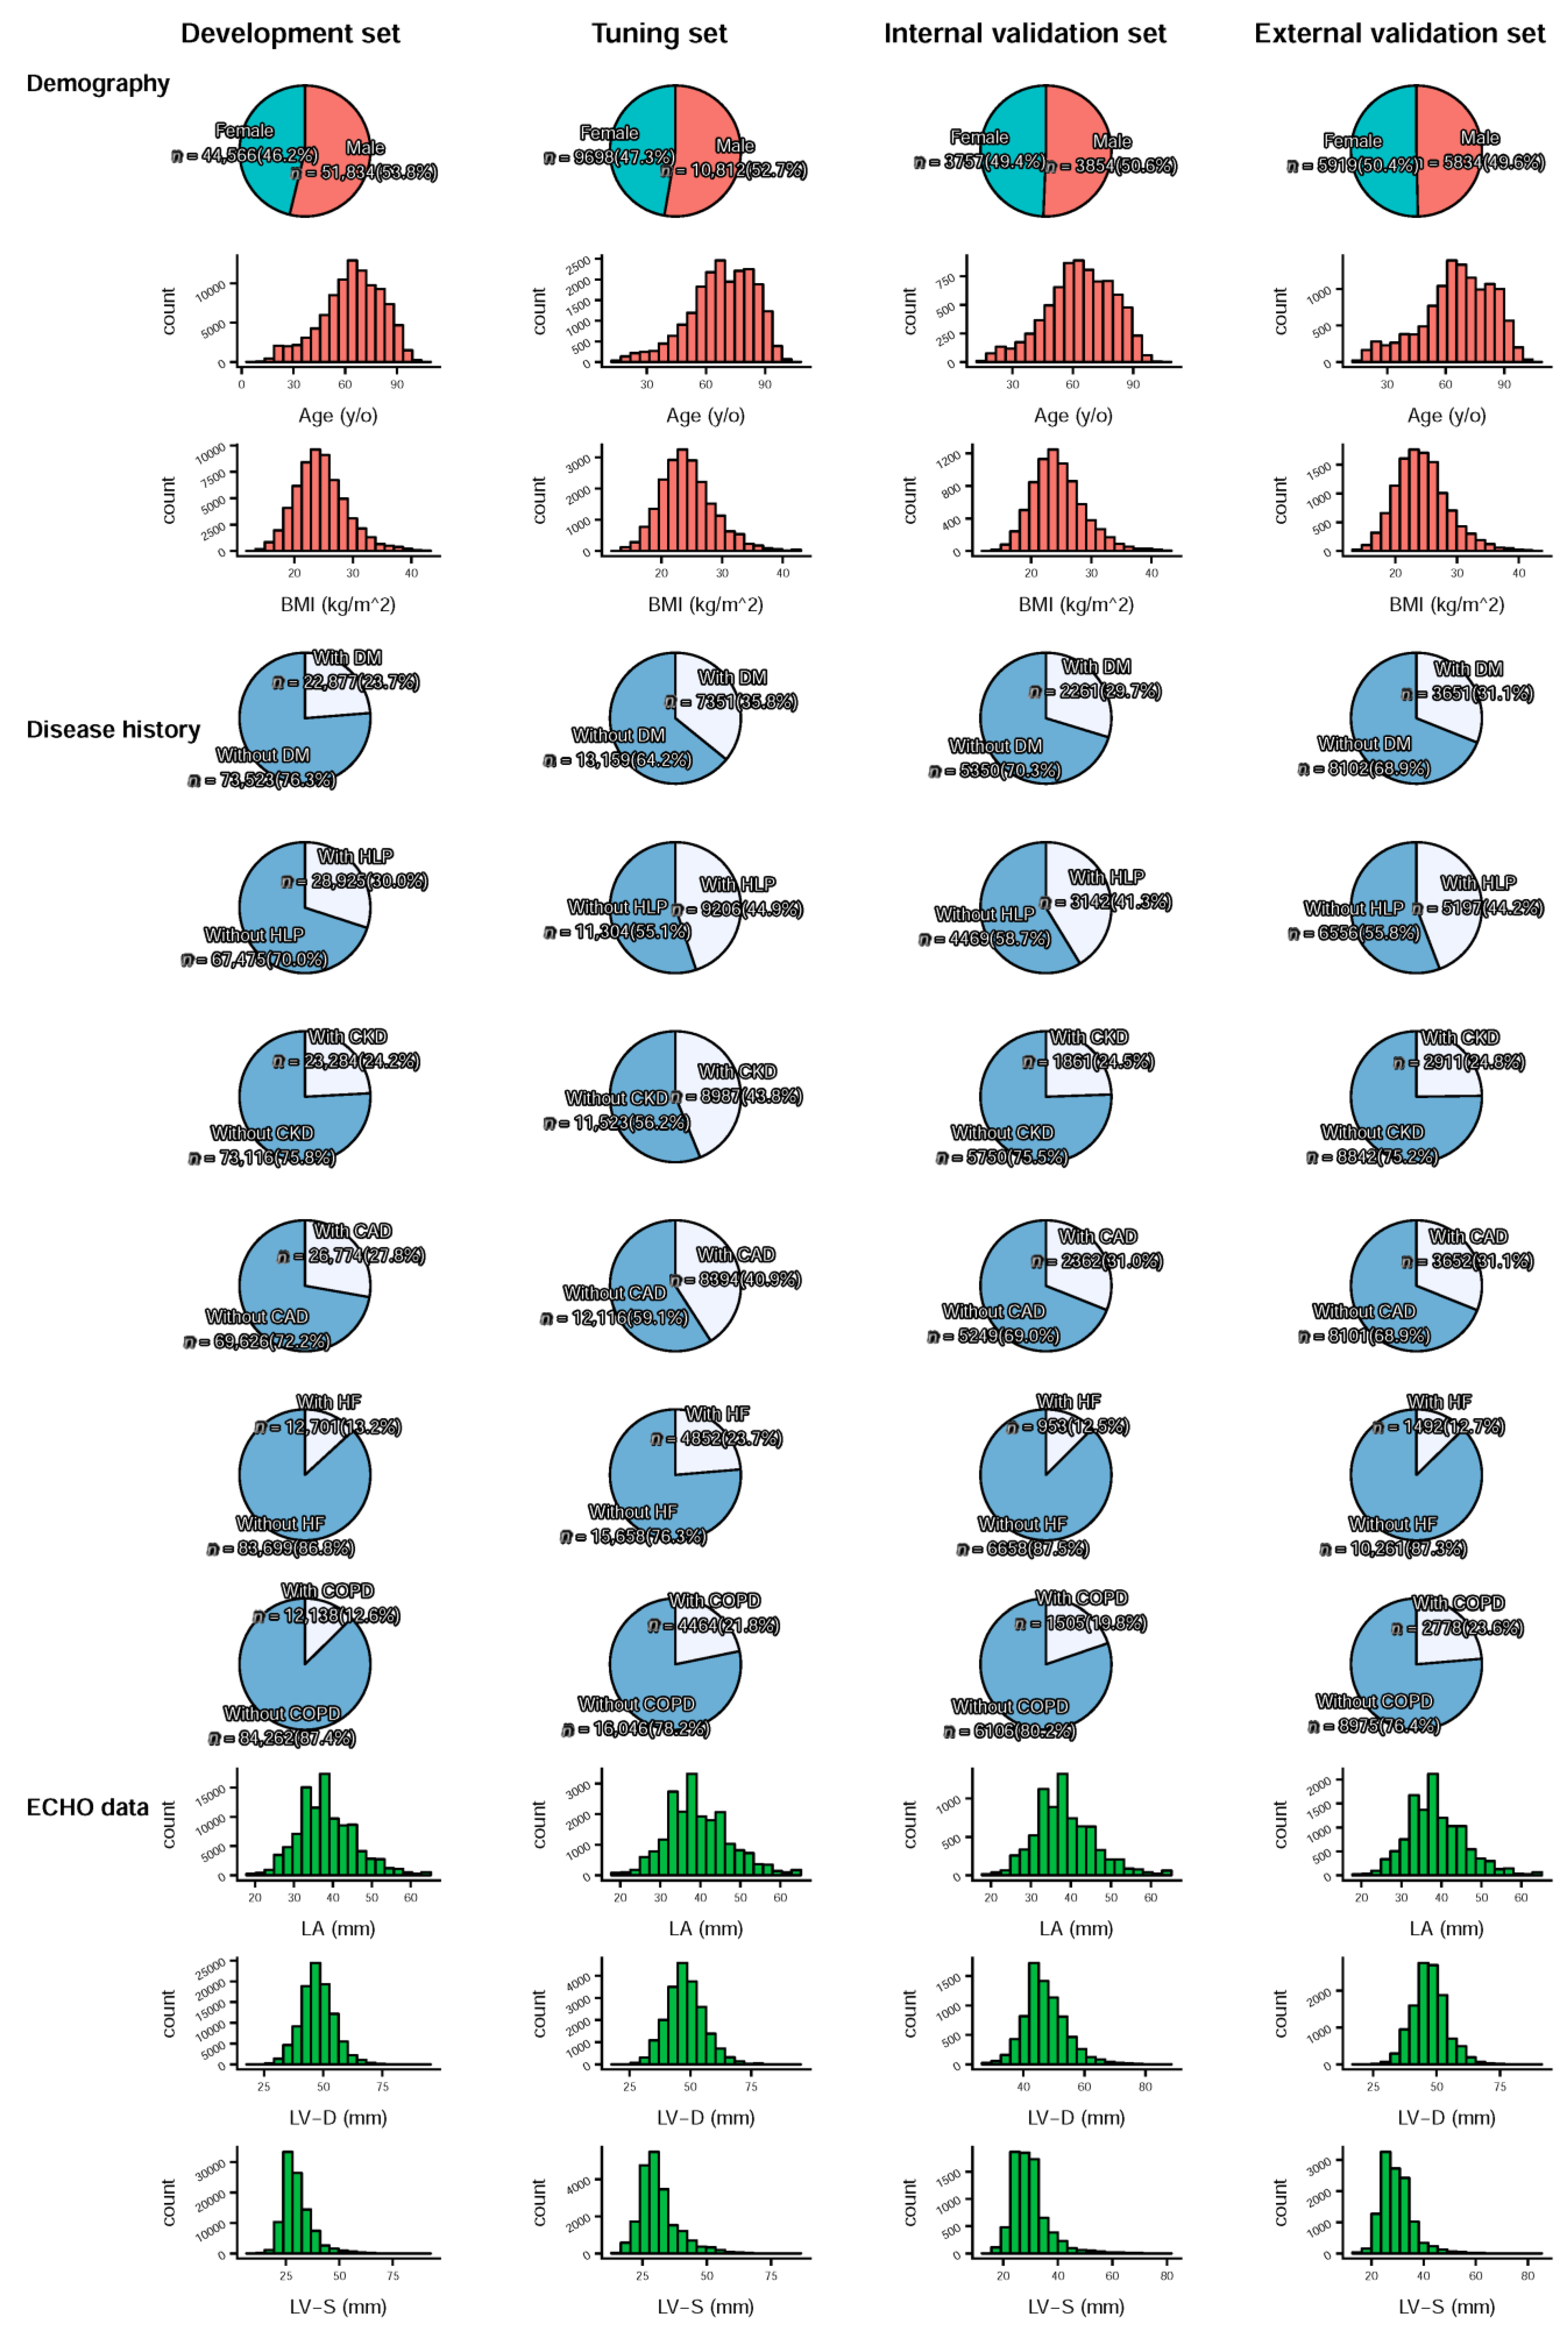
| Development Set | Tuning Set | Internal Validation Set | External Validation Set | p-Value | |
|---|---|---|---|---|---|
| Demography | |||||
| Sex (male) | 51,834 (53.8%) | 10,812 (52.7%) | 3854 (50.6%) | 5834 (49.6%) | <0.001 |
| Age (years) | 63.9 ± 17.4 | 68.1 ± 16.3 | 63.5 ± 16.6 | 65.8 ± 18.1 | <0.001 |
| BMI (kg/m2) | 24.6 ± 4.4 | 24.3 ± 4.4 | 24.5 ± 4.3 | 24.4 ± 4.3 | <0.001 |
| Disease history | |||||
| DM | 22,877 (23.7%) | 7351 (35.8%) | 2261 (29.7%) | 3651 (31.1%) | <0.001 |
| HLP | 28,925 (30.0%) | 9206 (44.9%) | 3142 (41.3%) | 5197 (44.2%) | <0.001 |
| CKD | 23,284 (24.2%) | 8987 (43.8%) | 1861 (24.5%) | 2911 (24.8%) | <0.001 |
| CAD | 26,774 (27.8%) | 8394 (40.9%) | 2362 (31.0%) | 3652 (31.1%) | <0.001 |
| HF | 12,701 (13.2%) | 4852 (23.7%) | 953 (12.5%) | 1492 (12.7%) | <0.001 |
| COPD | 12,138 (12.6%) | 4464 (21.8%) | 1505 (19.8%) | 2778 (23.6%) | <0.001 |
| Echocardiography data | |||||
| LA (mm) | 38.4 ± 7.4 | 39.5 ± 7.9 | 38.5 ± 7.5 | 38.7 ± 7.2 | <0.001 |
| LV-D (mm) | 47.5 ± 7.1 | 47.9 ± 7.8 | 47.3 ± 7.1 | 47.1 ± 6.8 | <0.001 |
| LV-S (mm) | 30.3 ± 6.9 | 31.2 ± 7.8 | 29.8 ± 6.8 | 29.6 ± 6.3 | <0.001 |
| IVS (mm) | 11.2 ± 2.6 | 11.5 ± 2.6 | 11.2 ± 2.6 | 11.1 ± 2.6 | <0.001 |
| LVPW (mm) | 9.3 ± 1.7 | 9.5 ± 1.8 | 9.3 ± 1.7 | 9.1 ± 1.7 | <0.001 |
| AO (mm) | 32.7 ± 4.4 | 33.1 ± 4.4 | 32.8 ± 4.5 | 32.8 ± 4.3 | <0.001 |
| RV (mm) | 23.8 ± 5.0 | 24.2 ± 5.1 | 24.1 ± 5.1 | 24.0 ± 4.9 | <0.001 |
| PASP (mmHg) | 33.3 ± 11.2 | 34.7 ± 12.4 | 32.1 ± 10.3 | 32.9 ± 10.7 | <0.001 |
| PE (mm) | 0.5 ± 2.1 | 0.6 ± 2.1 | 0.3 ± 1.8 | 0.4 ± 1.7 | <0.001 |
| EF (%) | 63.5 ± 12.6 | 61.0 ± 14.3 | 65.2 ± 11.4 | 65.4 ± 10.8 | <0.001 |
| Follow up data | |||||
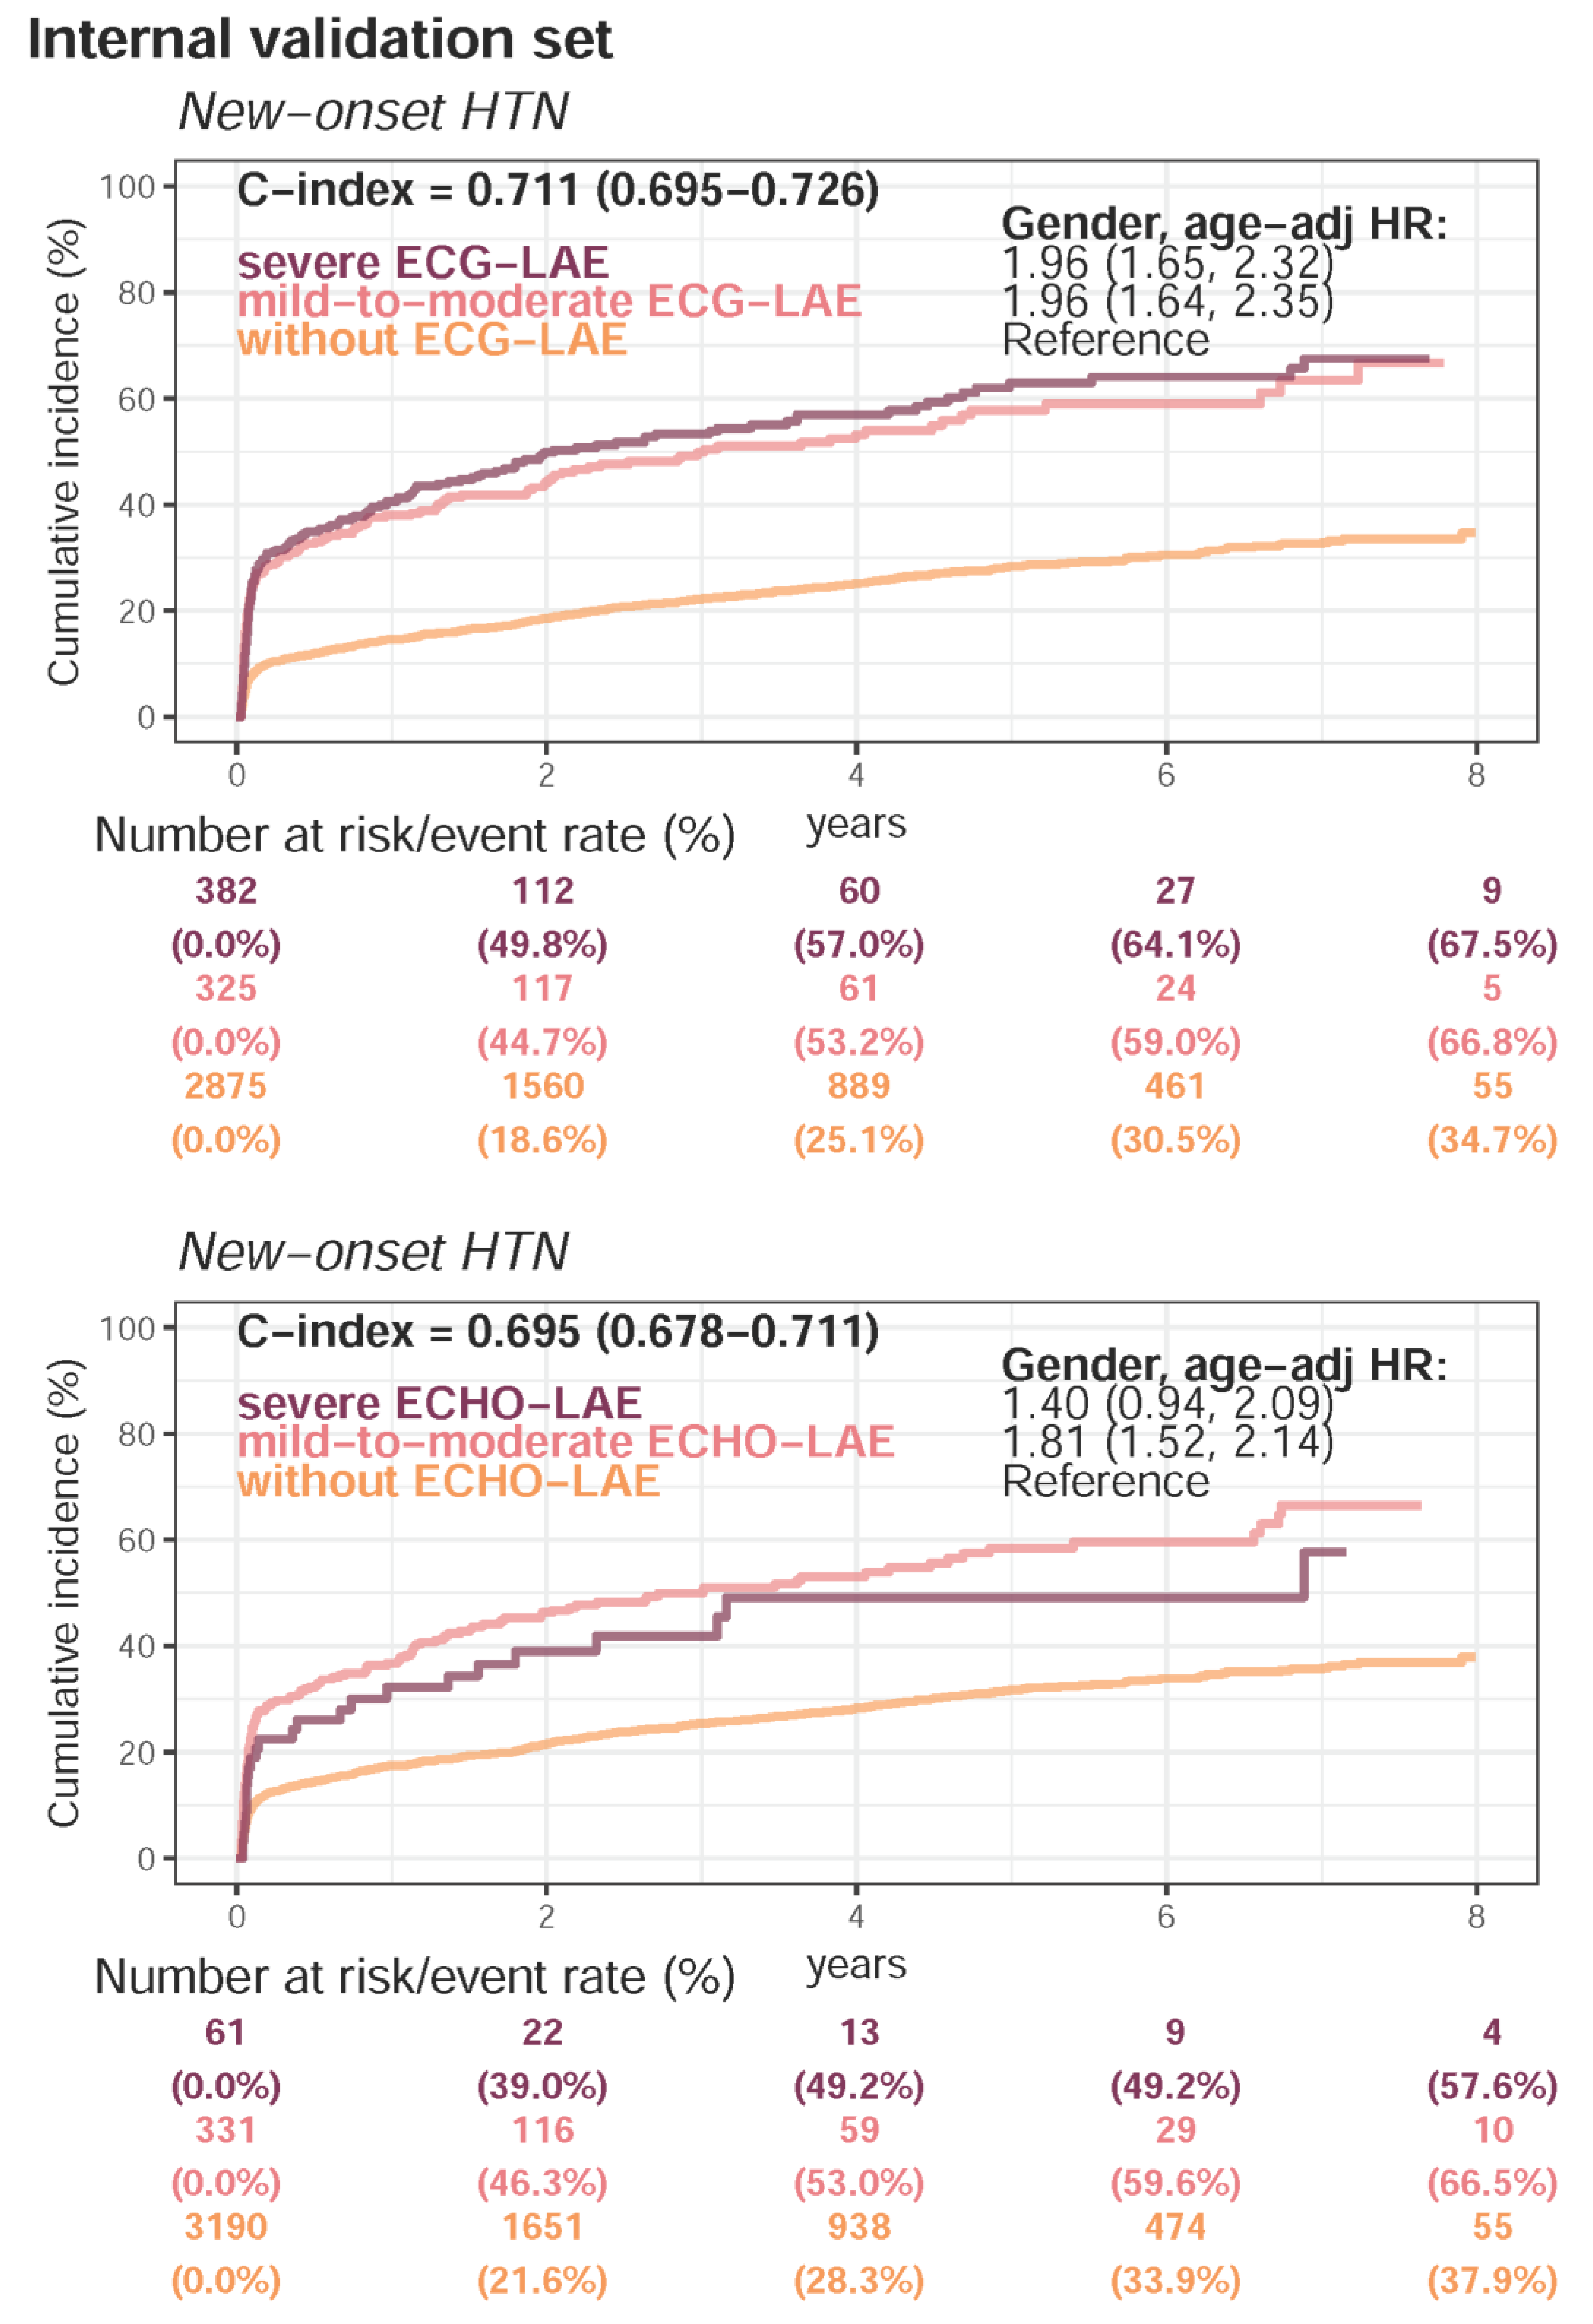
| Present HTN | 11,951 (58.3%) | 3971 (52.2%) | 6500 (55.3%) | <0.001 | |
| Follow-up (years), median (IQR) | 0.9 (0.1–2.8) | 2.0 (0.3–4.4) | 1.2 (0.2–3.2) | ||
| New-onset HTN | 2708 (32.4%) | 989 (27.6%) | 1186 (23.3%) | ||
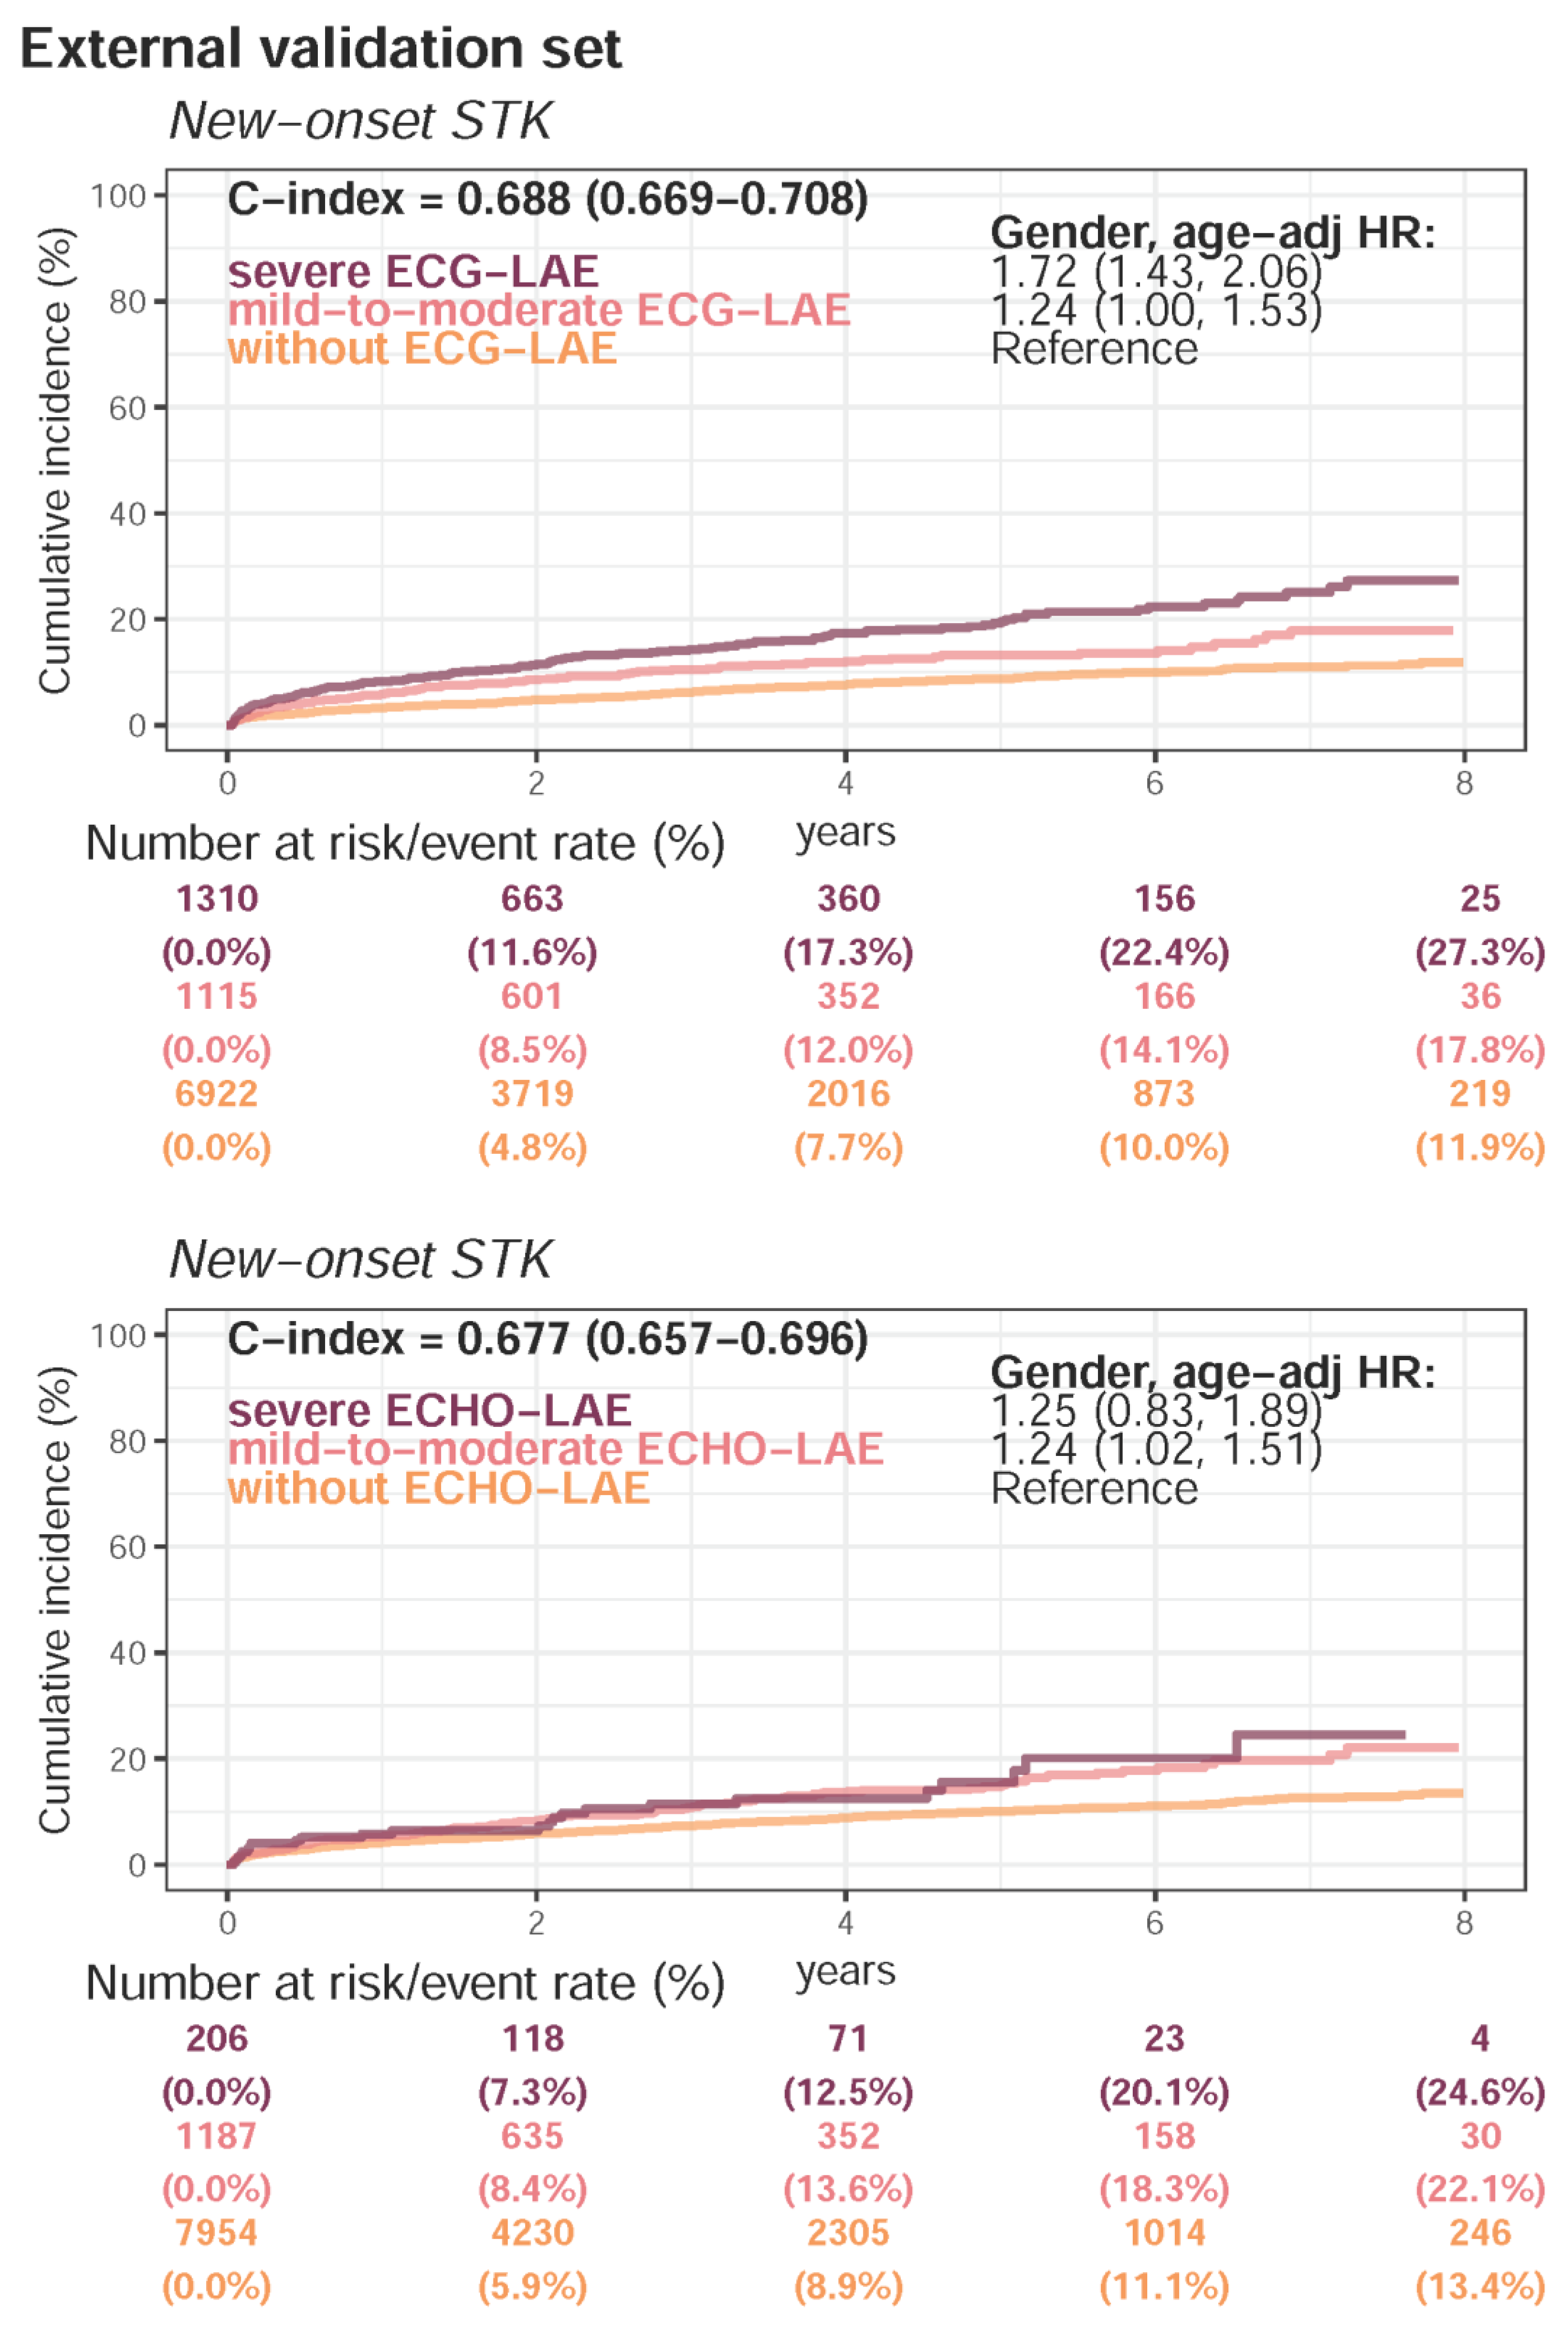
| Present STK | 4661 (22.7%) | 1286 (16.9%) | 2189 (18.6%) | <0.001 | |
| Follow-up (years), median (IQR) | 2.0 (0.5–3.3) | 3.2 (1.0–5.4) | 2.2 (0.6–4.4) | ||
| New-onset STK | 1274 (8.2%) | 592 (9.5%) | 693 (7.4%) | ||
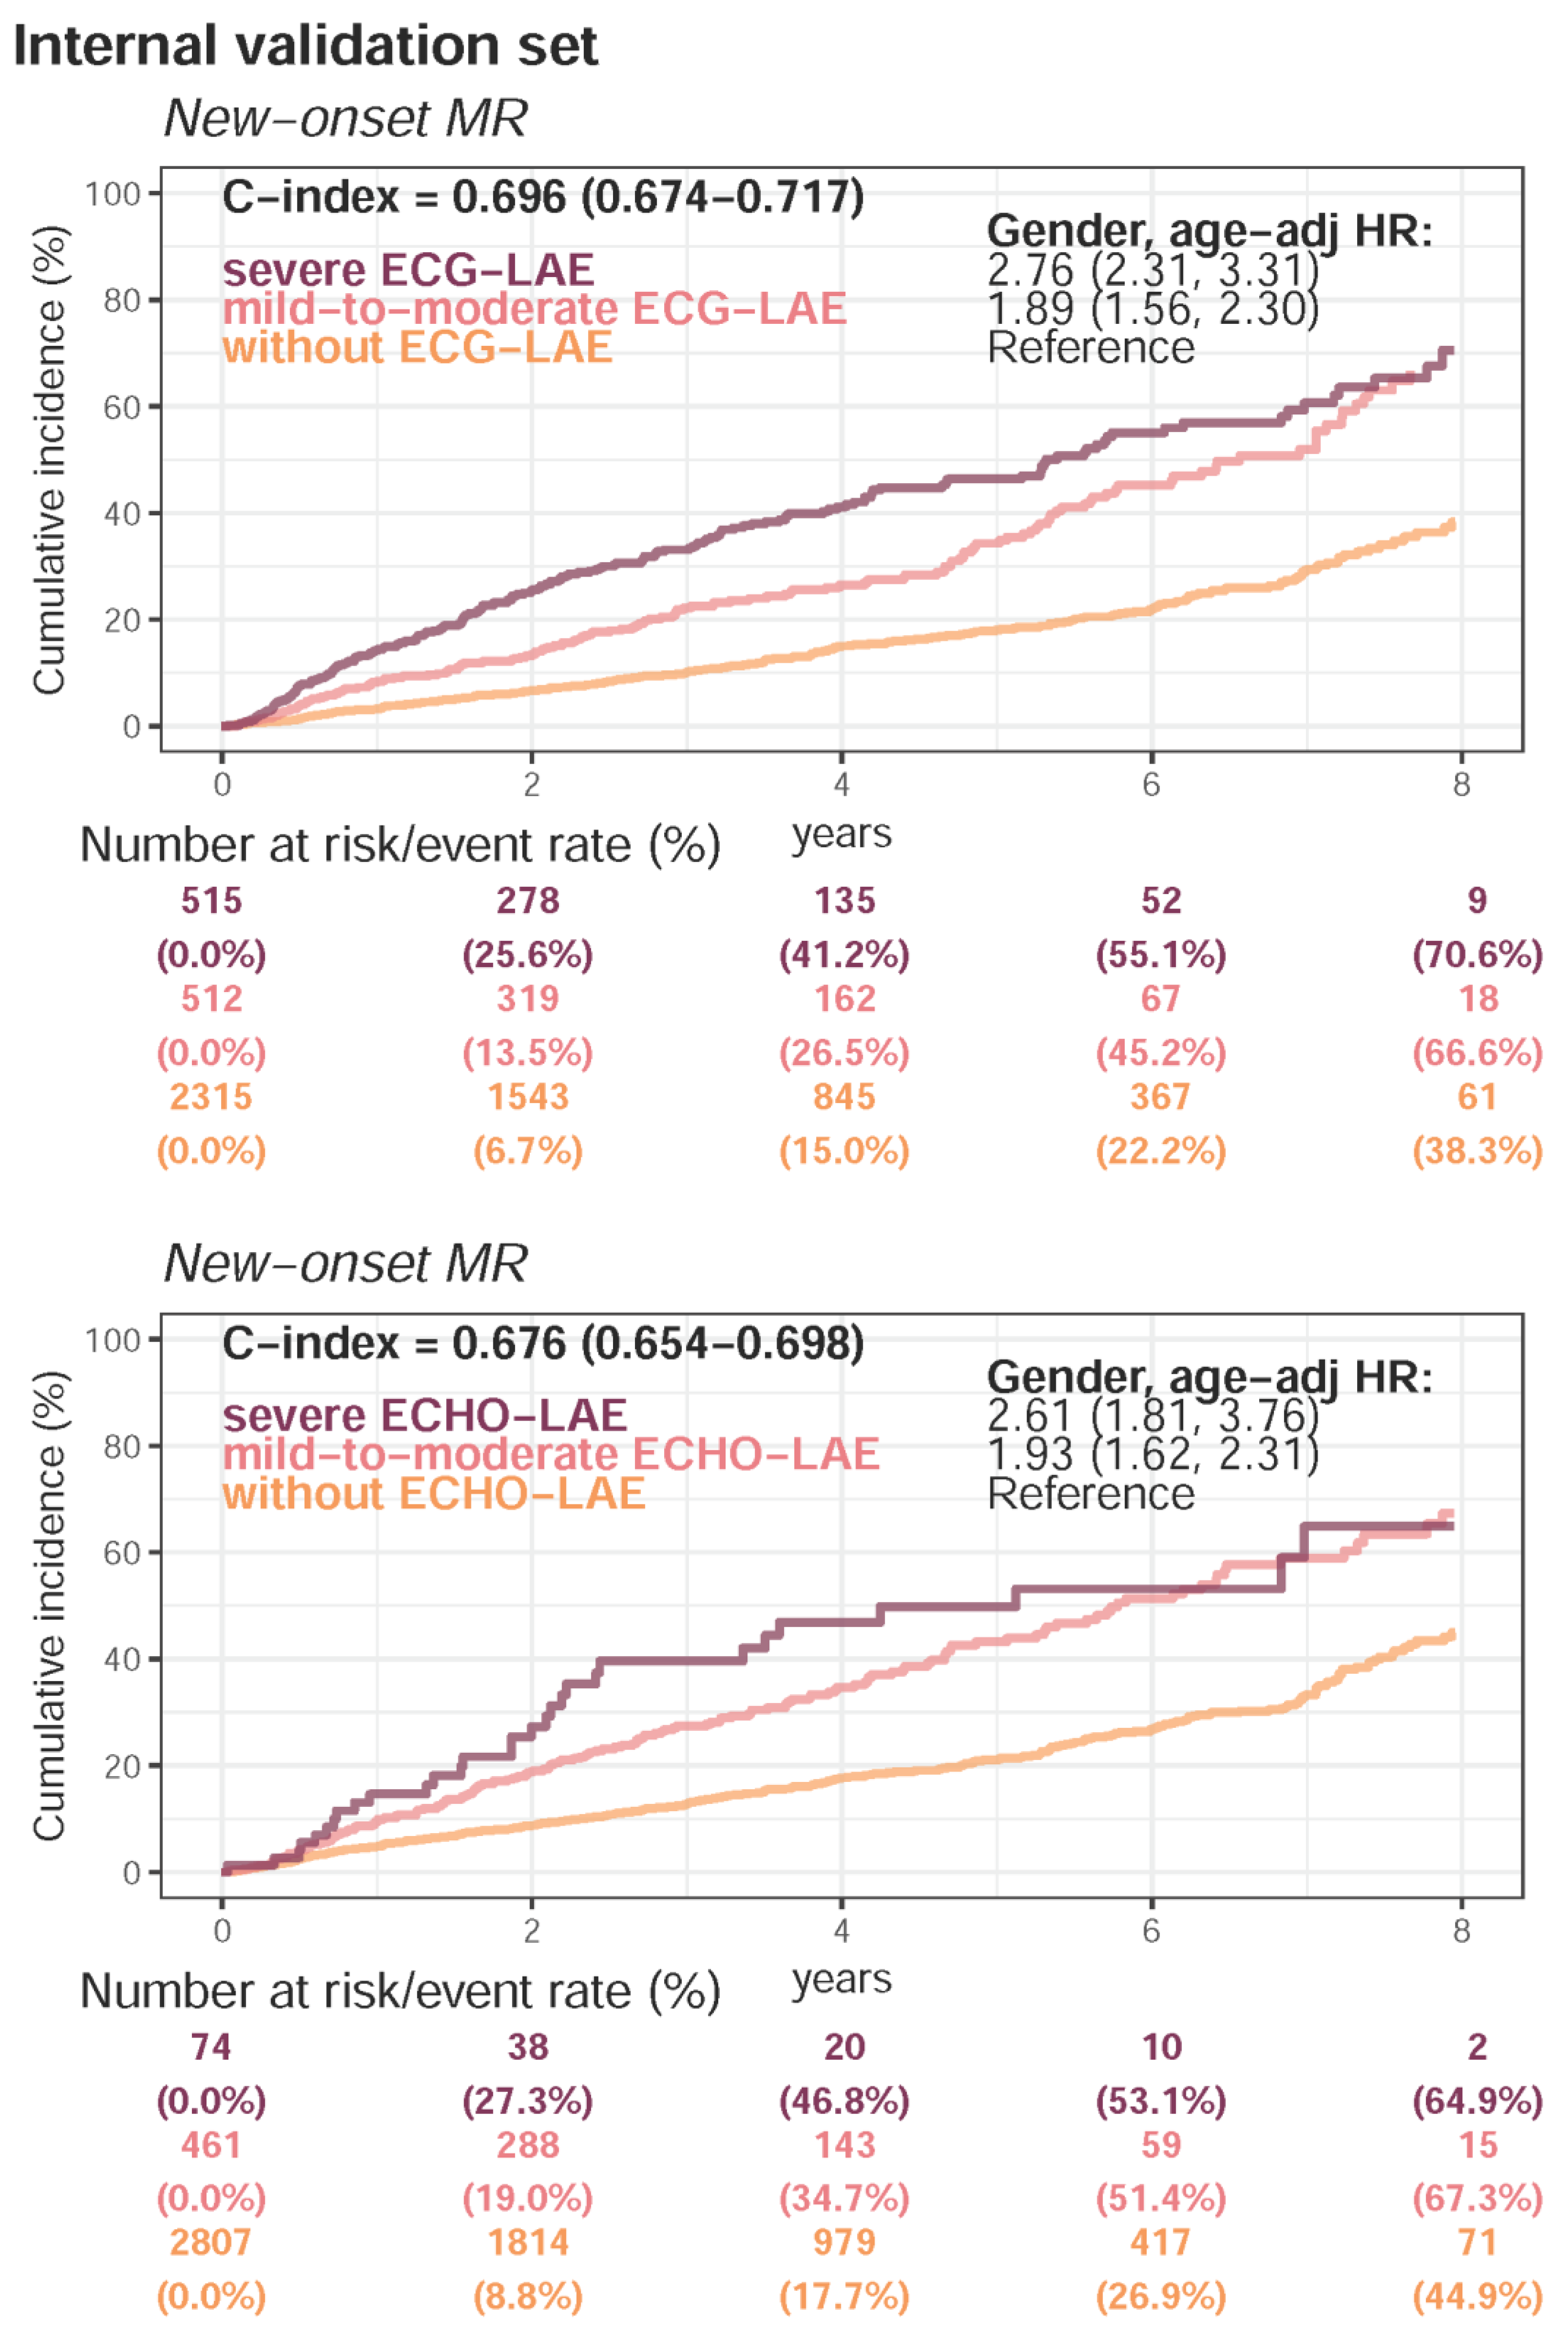
| Present MR | 3677 (17.9%) | 835 (10.9%) | 1324 (11.3%) | <0.001 | |
| Follow-up (years), median (IQR) | 1.8 (0.8–3.1) | 2.8 (1.3–4.8) | 2.6 (1.1–4.4) | ||
| New-onset MR | 1976 (22.8%) | 687 (20.6%) | 815 (18.1%) | ||
| Present Afib | 2622 (12.8%) | 496 (6.5%) | 756 (6.4%) | <0.001 | |
| Follow-up (years), median (IQR) | 1.8 (0.4–3.3) | 3.2 (1.0–5.5) | 2.3 (0.6–4.5) | ||
| New-onset Afib | 1670 (9.5%) | 494 (7.0%) | 745 (6.9%) |
Publisher’s Note: MDPI stays neutral with regard to jurisdictional claims in published maps and institutional affiliations. |
© 2022 by the authors. Licensee MDPI, Basel, Switzerland. This article is an open access article distributed under the terms and conditions of the Creative Commons Attribution (CC BY) license (https://creativecommons.org/licenses/by/4.0/).
Share and Cite
Lou, Y.-S.; Lin, C.-S.; Fang, W.-H.; Lee, C.-C.; Ho, C.-L.; Wang, C.-H.; Lin, C. Artificial Intelligence-Enabled Electrocardiogram Estimates Left Atrium Enlargement as a Predictor of Future Cardiovascular Disease. J. Pers. Med. 2022, 12, 315. https://doi.org/10.3390/jpm12020315
Lou Y-S, Lin C-S, Fang W-H, Lee C-C, Ho C-L, Wang C-H, Lin C. Artificial Intelligence-Enabled Electrocardiogram Estimates Left Atrium Enlargement as a Predictor of Future Cardiovascular Disease. Journal of Personalized Medicine. 2022; 12(2):315. https://doi.org/10.3390/jpm12020315
Chicago/Turabian StyleLou, Yu-Sheng, Chin-Sheng Lin, Wen-Hui Fang, Chia-Cheng Lee, Ching-Liang Ho, Chih-Hung Wang, and Chin Lin. 2022. "Artificial Intelligence-Enabled Electrocardiogram Estimates Left Atrium Enlargement as a Predictor of Future Cardiovascular Disease" Journal of Personalized Medicine 12, no. 2: 315. https://doi.org/10.3390/jpm12020315
APA StyleLou, Y.-S., Lin, C.-S., Fang, W.-H., Lee, C.-C., Ho, C.-L., Wang, C.-H., & Lin, C. (2022). Artificial Intelligence-Enabled Electrocardiogram Estimates Left Atrium Enlargement as a Predictor of Future Cardiovascular Disease. Journal of Personalized Medicine, 12(2), 315. https://doi.org/10.3390/jpm12020315