
Characteristics of Kidney Recipients of High Kidney Donor Profile Index Kidneys as Identified by Machine Learning Consensus Clustering

 , , ,
, , ,  ,
,  ,
,  ,
,  , , and
Abstract
:1. Introduction
2. Materials and Methods
2.1. Data Source and Study Population
2.2. Data Collection
2.3. Cluster Analysis
2.4. Outcomes
2.5. Statistical Analysis
3. Results
3.1. Clinical Characteristics Based on Clusters of Kidney Transplant Recipients from High KDPI Deceased Donors
3.2. Posttransplant Outcomes of Kidney Transplant Recipients from High KDPI Deceased Donors
4. Discussion
5. Conclusions
Supplementary Materials
Author Contributions
Funding
Institutional Review Board Statement
Informed Consent Statement
Data Availability Statement
Acknowledgments
Conflicts of Interest
References
- Schold, J.D.; Mohan, S.; Huml, A.; Buccini, L.D.; Sedor, J.R.; Augustine, J.J.; Poggio, E.D. Failure to Advance Access to Kidney Transplantation over Two Decades in the United States. J. Am. Soc. Nephrol. 2021, 32, 913–926. [Google Scholar] [CrossRef] [PubMed]
- Friedewald, J.J.; Samana, C.J.; Kasiske, B.L.; Israni, A.K.; Stewart, D.; Cherikh, W.; Formica, R.N. The Kidney Allocation System. Surg. Clin. N. Am. 2013, 93, 1395–1406. [Google Scholar] [CrossRef] [PubMed]
- Lentine, K.L.; Smith, J.M.; Hart, A.; Miller, J.; Skeans, M.A.; Larkin, L.; Robinson, A.; Gauntt, K.; Israni, A.K.; Hirose, R.; et al. OPTN/SRTR 2020 Annual Data Report: Kidney. Am. J. Transplant. 2022, 22 (Suppl. 2), 21–136. [Google Scholar] [CrossRef] [PubMed]
- Bachmann, Q.; Haberfellner, F.; Büttner-Herold, M.; Torrez, C.; Haller, B.; Assfalg, V.; Renders, L.; Amann, K.; Heemann, U.; Schmaderer, C.; et al. The Kidney Donor Profile Index (KDPI) Correlates with Histopathologic Findings in Post-reperfusion Baseline Biopsies and Predicts Kidney Transplant Outcome. Front. Med. 2022, 9, 875206. [Google Scholar] [CrossRef]
- Dahmen, M.; Becker, F.; Pavenstädt, H.; Suwelack, B.; Schütte-Nütgen, K.; Reuter, S. Validation of the Kidney Donor Profile Index (KDPI) to assess a deceased donor’s kidneys’ outcome in a European cohort. Sci. Rep. 2019, 9, 11234. [Google Scholar] [CrossRef] [Green Version]
- Krittanawong, C.; Virk, H.U.H.; Bangalore, S.; Wang, Z.; Johnson, K.W.; Pinotti, R.; Zhang, H.; Kaplin, S.; Narasimhan, B.; Kitai, T.; et al. Machine learning prediction in cardiovascular diseases: A meta-analysis. Sci. Rep. 2020, 10, 16057. [Google Scholar] [CrossRef] [PubMed]
- Sidey-Gibbons, J.A.M.; Sidey-Gibbons, C.J. Machine learning in medicine: A practical introduction. BMC Med. Res. Methodol. 2019, 19, 64. [Google Scholar] [CrossRef] [PubMed] [Green Version]
- Thongprayoon, C.; Mao, M.A.; Kattah, A.G.; Keddis, M.T.; Pattharanitima, P.; Erickson, S.B.; Dillon, J.J.; Garovic, V.D.; Cheungpasitporn, W. Subtyping hospitalized patients with hypokalemia by machine learning consensus clustering and associated mortality risks. Clin. Kidney J. 2021, 15, 253–261. [Google Scholar] [CrossRef]
- Thongprayoon, C.; Sy-Go, J.P.T.; Nissaisorakarn, V.; Dumancas, C.Y.; Keddis, M.T.; Kattah, A.G.; Pattharanitima, P.; Vallabhajosyula, S.; Mao, M.A.; Qureshi, F.; et al. Machine Learning Consensus Clustering Approach for Hospitalized Patients with Dysmagnesemia. Diagnostics 2021, 11, 2119. [Google Scholar] [CrossRef]
- Thongprayoon, C.; Vaitla, P.; Jadlowiec, C.C.; Leeaphorn, N.; Mao, S.A.; Mao, M.A.; Pattharanitima, P.; Bruminhent, J.; Khoury, N.J.; Garovic, V.D.; et al. Use of Machine Learning Consensus Clustering to Identify Distinct Subtypes of Black Kidney Transplant Recipients and Associated Outcomes. JAMA Surg. 2022, 157, e221286. [Google Scholar] [CrossRef]
- Van Buuren, S.; Groothuis-Oudshoorn, K. Mice: Multivariate imputation by chained equations in R. J. Stat. Softw. 2011, 45, 1–67. [Google Scholar] [CrossRef] [Green Version]
- Monti, S.; Tamayo, P.; Mesirov, J.; Golub, T. Consensus Clustering: A Resampling-Based Method for Class Discovery and Visualization of Gene Expression Microarray Data. Mach. Learn. 2003, 52, 91–118. [Google Scholar] [CrossRef]
- Wilkerson, M.D.; Hayes, D.N. ConsensusClusterPlus: A class discovery tool with confidence assessments and item tracking. Bioinformatics 2010, 26, 1572–1573. [Google Scholar] [CrossRef] [PubMed] [Green Version]
- Șenbabaoğlu, Y.; Michailidis, G.; Li, J.Z. Critical limitations of consensus clustering in class discovery. Sci. Rep. 2014, 4, 6207. [Google Scholar] [CrossRef] [Green Version]
- Bui, K.; Kilambi, V.; Mehrotra, S. Functional status-based risk–benefit analyses of high- KDPI kidney transplant versus dialysis. Transpl. Int. 2019, 32, 1297–1312. [Google Scholar] [CrossRef]
- Goldfarb-Rumyantzev, A.S.; Koford, J.K.; Baird, B.C.; Chelamcharla, M.; Habib, A.N.; Wang, B.-J.; Lin, S.-J.; Shihab, F.; Isaacs, R.B. Role of Socioeconomic Status in Kidney Transplant Outcome. Clin. J. Am. Soc. Nephrol. 2006, 1, 313–322. [Google Scholar] [CrossRef] [PubMed] [Green Version]
- Kasiske, B.L.; Snyder, J.J.; Matas, A.J.; Ellison, M.D.; Gill, J.S.; Kausz, A.T. Preemptive Kidney Transplantation: The Advantage and the Advantaged. J. Am. Soc. Nephrol. 2002, 13, 1358–1364. [Google Scholar] [CrossRef] [Green Version]
- Sheshadri, A.; Cullaro, G.; Johansen, K.L.; Lai, J.C. Association of Karnofsky Performance Status with waitlist mortality among older and younger adults awaiting kidney transplantation. Clin. Transplant. 2020, 34, e13848. [Google Scholar] [CrossRef]
- Kalil, R.S.; Heim-Duthoy, K.L.; Kasiske, B.L. Patients with a Low Income Have Reduced Renal Allograft Survival. Am. J. Kidney Dis. 1992, 20, 63–69. [Google Scholar] [CrossRef]
- Cheungpasitporn, W.; Lentine, K.L.; Tan, J.C.; Kaufmann, M.; Caliskan, Y.; Bunnapradist, S.; Lam, N.N.; Schnitzler, M.; Axelrod, D.A. Immunosuppression Considerations for Older Kidney Transplant Recipients. Curr. Transplant. Rep. 2021, 8, 100–110. [Google Scholar] [CrossRef]
- Chapman, J.R. Do protocol transplant biopsies improve kidney transplant outcomes? Curr. Opin. Nephrol. Hypertens. 2012, 21, 580–586. [Google Scholar] [CrossRef] [PubMed]
- Serón, D.; Moreso, F.; Bover, J.; Condom, E.; Gil-Vernet, S.; Cañas, C.; Fulladosa, X.; Torras, J.; Carrera, M.; Grinyó, J.M.; et al. Early protocol renal allograft biopsies and graft outcome. Kidney Int. 1997, 51, 310–316. [Google Scholar] [CrossRef] [PubMed] [Green Version]
- Peters-Sengers, H.; Houtzager, J.H.; Idu, M.M.; Heemskerk, M.B.; Van Heurn, E.L.; Van Der Heide, J.J.H.; Kers, J.; Berger, S.P.; Van Gulik, T.M.; Bemelman, F.J. Impact of Cold Ischemia Time on Outcomes of Deceased Donor Kidney Transplantation: An Analysis of a National Registry. Transplant. Direct 2019, 5, e448. [Google Scholar] [CrossRef] [PubMed]
- Lauronen, J.; Peräsaari, J.P.; Saarinen, T.; Jaatinen, T.; Lempinen, M.; Helanterä, I. Shorter Cold Ischemia Time in Deceased Donor Kidney Transplantation Reduces the Incidence of Delayed Graft Function Especially Among Highly Sensitized Patients and Kidneys from Older Donors. Transplant. Proc. 2020, 52, 42–49. [Google Scholar] [CrossRef]
- Gordon, E.J.; Ladner, D.P.; Caicedo, J.C.; Franklin, J. Disparities in Kidney Transplant Outcomes: A Review. Semin. Nephrol. 2010, 30, 81–89. [Google Scholar] [CrossRef] [Green Version]
- Isaacs, R.B.; Nock, S.L.; Spencer, C.E.; Connors, A.F., Jr.; Wang, X.-Q.; Sawyer, R.; Lobo, P.I. Racial disparities in renal transplant outcomes. Am. J. Kidney Dis. 1999, 34, 706–712. [Google Scholar] [CrossRef]
- Jannat-Khah, D.P.; Unterbrink, M.; McNairy, M.; Pierre, S.; Fitzgerald, D.W.; Pape, J.; Evans, A. Treating loss-to-follow-up as a missing data problem: A case study using a longitudinal cohort of HIV-infected patients in Haiti. BMC Public Health 2018, 18, 1269. [Google Scholar] [CrossRef] [Green Version]
- Knol, M.J.; Janssen, K.J.; Donders, A.R.; Egberts, A.C.; Heerdink, E.R.; Grobbee, D.E.; Moons, K.G.; Geerlings, M.I. Unpredictable bias when using the missing indicator method or complete case analysis for missing confounder values: An empirical example. J. Clin. Epidemiol. 2010, 63, 728. [Google Scholar] [CrossRef]
- White, I.R.; Carlin, J.B. Bias and efficiency of multiple imputation compared with complete-case analysis for missing covariate values. Stat. Med. 2010, 29, 2920–2931. [Google Scholar] [CrossRef]
- White, I.R.; Royston, P.; Wood, A.M. Multiple imputation using chained equations: Issues and guidance for practice. Stat. Med. 2011, 30, 377–399. [Google Scholar] [CrossRef]
- Hedden, S.L.; Woolson, R.F.; Carter, R.E.; Palesch, Y.; Upadhyaya, H.P.; Malcolm, R.J. The impact of loss to follow-up on hypothesis tests of the treatment effect for several statistical methods in substance abuse clinical trials. J. Subst. Abuse Treat. 2009, 37, 54–63. [Google Scholar] [CrossRef] [PubMed] [Green Version]
- Donders, A.R.T.; Van Der Heijden, G.J.; Stijnen, T.; Moons, K.G. A gentle introduction to imputation of missing values. J. Clin. Epidemiol. 2006, 59, 1087–1091. [Google Scholar] [CrossRef] [PubMed]


| All (n = 8935) | Cluster 1 (n = 1984) | Cluster 2 (n = 2135) | Cluster 3 (n = 357) | Cluster 4 (n = 335) | Cluster 5 (n = 1069) | Cluster 6 (n = 3055) | p-Value | |
|---|---|---|---|---|---|---|---|---|
| Recipient age (year) | 62.4 ± 9.5 | 57.2 ± 9.9 | 68.0 ± 6.9 | 57.3 ± 11.0 | 51.7 ± 13.7 | 63.3 ± 8.7 | 63.3 ± 7.2 | <0.001 |
| Recipient male sex | 5699 (63.8) | 1213 (61.1) | 1371 (64.2) | 223 (62.5) | 170 (50.8) | 598 (55.9) | 2124 (69.5) | <0.001 |
Recipient race
| 3341 (37.4) 3080 (34.5) 1549 (17.3) 965 (10.8) | 204 (10.3) 1298 (65.4) 308 (15.5) 174 (8.8) | 1554 (72.7) 200 (9.4) 185 (8.7) 196 (9.2) | 163 (45.6) 130 (36.4) 32 (9.0) 32 (9.0) | 85 (25.3) 82 (24.5) 71 (21.2) 97 (28.9) | 510 (47.7) 260 (24.3) 213 (19.9) 86 (8.1) | 825 (27.0) 1110 (36.3) 740 (24.2) 380 (12.5) | <0.001 |
ABO blood group
| 2846 (31.9) 1374 (15.4) 340 (3.8) 4375 (48.9) | 377 (19.0) 392 (19.8) 61 (3.1) 1154 (58.1) | 903 (42.3) 222 (10.4) 79 (3.7) 931 (43.6) | 112 (31.4) 63 (17.7) 18 (5.0) 164 (45.9) | 87 (26.0) 69 (20.6) 15 (4.5) 164 (48.9) | 381 (35.6) 145 (13.6) 40 (3.7) 503 (47.1) | 986 (32.3) 483 (15.8) 127 (4.2) 1459 (47.7) | <0.001 |
| Body mass index (kg/m2) | 28.5 ± 5.0 | 28.6 ± 5.3 | 27.3 ± 4.7 | 27.4 ± 5.4 | 24.8 ± 4.1 | 28.7 ± 5.0 | 29.6 ± 4.8 | <0.001 |
| Kidney retransplant | 364 (4.1) | 0 (0) | 0 (0) | 357 (100) | 7 (2.1) | 0 (0) | 0 (0) | <0.001 |
Dialysis duration
| 803 (9.0) 2234 (25.0) 775 (8.7) 5123 (57.3) | 99 (5.0) 315 (15.9) 107 (5.4) 1463 (73.7) | 359 (16.8) 661 (31.0) 253 (11.9) 862 (40.4) | 35 (9.8) 88 (24.7) 36 (10.1) 198 (55.5) | 35 (10.5) 112 (33.4) 39 (11.6) 149 (44.5) | 110 (10.3) 306 (28.6) 111 (10.4) 542 (50.7) | 165 (5.4) 752 (24.6) 229 (7.5) 1909 (62.5) | <0.001 |
Cause of end-stage kidney disease
| 3623 (40.5) 2525 (28.3) 1104 (12.4) 602 (6.7) 1081 (12.1) | 18 (0.9) 1318 (66.4) 328 (16.5) 164 (8.3) 156 (7.9) | 61 (2.9) 784 (36.7) 489 (22.9) 292 (13.7) 509 (23.8) | 32 (9.0) 61 (17.1) 48 (13.5) 14 (3.9) 202 (56.5) | 80 (23.9) 89 (26.5) 76 (22.7) 30 (9.0) 60 (17.9) | 460 (43.0) 253 (23.7) 139 (13.0) 84 (7.9) 133 (12.4) | 2972 (97.2) 20 (0.7) 24 (0.8) 18 (0.6) 21 (0.7) | <0.001 |
Comorbidity
| 4484 (50.2) 975 (10.9) 987 (11.1) | 331 (16.7) 123 (6.2) 107 (5.4) | 314 (14.7) 419 (19.6) 148 (6.9) | 116 (32.5) 49 (13.7) 30 (8.4) | 101 (30.2) 32 (9.6) 18 (5.4) | 567 (53.0) 129 (12.1) 119 (11.1) | 3055 (100.0) 223 (7.3) 565 (18.5) | <0.001 <0.001 <0.001 |
| PRA (%), median (IQR) | 0 (0–1) | 0 (0–4) | 0 (0–0) | 48 (0–95) | 0 (0–0) | 0 (0–17) | 0 (0–0) | <0.001 |
| Positive HCV serostatus | 455 (5.1) | 145 (7.3) | 70 (3.3) | 34 (9.5) | 9 (2.7) | 47 (4.4) | 150 (4.9) | <0.001 |
| Positive HBs antigen | 181 (2.0) | 43 (2.2) | 30 (1.4) | 14 (3.9) | 16 (4.8) | 24 (2.3) | 54 (1.8) | <0.001 |
| Positive HIV serostatus | 63 (0.7) | 31 (1.6) | 9 (0.4) | 0 (0.0) | 4 (1.2) | 5 (0.5) | 14 (0.5) | <0.001 |
Functional status
| 26 (0.3) 3723 (41.7) 5186 (58.0) | 4 (0.2) 859 (43.3) 1121 (56.5) | 6 (0.3) 709 (33.2) 1420 (66.5) | 0 (0.0) 143 (40.1) 214 (59.9) | 2 (0.6) 101 (30.2) 232 (69.2) | 3 (0.3) 429 (40.1) 637 (59.6) | 11 (0.4) 1482 (48.5) 1562 (51.1) | <0.001 |
| Working income | 1593 (17.8) | 415 (20.9) | 427 (20.0) | 71 (19.9) | 100 (29.8) | 192 (18.0) | 388 (12.7) | <0.001 |
| Public insurance | 7320 (81.9) | 1676 (84.5) | 1672 (78.3) | 297 (83.2) | 232 (69.3) | 865 (80.9) | 2578 (84.4) | <0.001 |
| US resident | 8872 (99.3) | 1966 (99.1) | 2127 (99.6) | 356 (99.7) | 323 (96.4) | 1060 (99.2) | 3040 (99.5) | <0.001 |
| Undergraduate education or above | 4400 (49.2) | 863 (43.5) | 1274 (59.7) | 188 (52.7) | 188 (56.1) | 530 (49.6) | 1357 (44.4) | <0.001 |
| Serum albumin (g/dL) | 3.9 ± 0.5 | 4.0 ± 0.5 | 4.0 ± 0.5 | 3.8 ± 0.6 | 4.0 ± 0.5 | 3.9 ± 0.5 | 3.9 ± 0.6 | <0.001 |
Kidney donor status
| 1673 (18.7) 7262 (81.3) | 484 (24.4) 1500 (75.6) | 184 (8.6) 1951 (91.4) | 80 (22.4) 277 (77.6) | 335 (100) 0 (0) | 155 (14.5) 914 (85.5) | 435 (14.2) 2620 (85.8) | <0.001 |
| Donor age (year) | 58.3 ± 13.2 | 58.1 ± 6.6 | 62.6 ± 6.3 | 58.4 ± 8.4 | 0.7 ± 3.1 | 61.1 ± 6.9 | 60.7 ± 6.7 | <0.001 |
| Donor male sex | 4124 (46.2) | 850 (42.8) | 944 (44.2) | 165 (46.2) | 189 (56.4) | 515 (48.2) | 1461 (47.8) | <0.001 |
Donor race
| 4532 (50.7) 2928 (32.7) 987 (11.1) 488 (5.5) | 605 (30.5) 1042 (52.5) 208 (10.5) 129 (6.5) | 1472 (68.9) 367 (17.2) 198 (9.3) 98 (4.6) | 158 (44.3) 139 (38.9) 35 (9.8) 25 (7.0) | 104 (31.0) 191 (57.0) 32 (9.6) 8 (2.4) | 677 (63.3) 206 (19.3) 138 (12.9) 48 (4.5) | 1516 (49.6) 983 (32.2) 376 (12.3) 180 (5.9) | <0.001 |
| Donor weight (kg) | 79 ± 26 | 82 ± 23 | 82 ± 22 | 81 ± 23 | 9 ± 9 | 81 ± 23 | 83 ± 22 | <0.001 |
| Donor Height (cm) | 163 ± 22 | 167 ± 10 | 167 ± 10 | 167 ± 13 | 67 ± 17 | 167 ± 11 | 168 ± 10 | <0.001 |
| Donor hypertension | 6833 (76.5) | 1633 (82.3) | 1648 (77.2) | 287 (80.4) | 6 (1.8) | 837 (78.3) | 2422 (79.3) | <0.001 |
| Donor diabetes | 2416 (27) | 571 (29) | 588 (28) | 93 (26) | 3 (1) | 306 (29) | 855 (28) | <0.001 |
| Donor positive HCV serostatus | 387 (4) | 110 (6) | 71 (3) | 28 (8) | 2 (1) | 45 (4) | 131 (4) | <0.001 |
| Donor cerebrovascular death | 6142 (69) | 1469 (74) | 1489 (70) | 257 (72) | 14 (4) | 744 (70) | 2169 (71) | <0.001 |
| Donor creatinine (mg/dL) | 1.3 ± 1.0 | 1.3 ± 0.0.7 | 1.3 ± 1.1 | 1.3 ± 0.6 | 1.0 ± 1.8 | 1.3 ± 1.1 | 1.3 ± 0.8 | <0.001 |
| KDPI (%) | 91 ± 4 | 91 ± 4 | 91 ± 4 | 90 ± 4 | 89 ± 4 | 91 ± 4 | 91 ± 4 | <0.001 |
| Dual kidney transplant | 840 (9.4) | 94 (4.7) | 189 (8.9) | 10 (2.8) | 280 (83.6) | 77 (7.2) | 190 (6.2) | <0.001 |
| Total HLA mismatch, median (IQR) | 5 (4-5) | 5 (4-6) | 5 (4-5) | 4 (3-5) | 5 (4-6) | 3 (2-3) | 5 (4-6) | <0.001 |
| Cold ischemia time (hours) | 20.2 ± 9.0 | 19.6 ± 9.0 | 20.5 ± 9.1 | 20.4 ± 9.1 | 21.7 ± 8.7 | 19.7 ± 8.4 | 20.4 ± 9.0 | <0.001 |
| Kidney on pump | 5428 (60.8) | 1171 (59.0) | 1400 (65.6) | 206 (57.7) | 143 (42.7) | 623 (58.3) | 1885 (61.7) | <0.001 |
Allocation type
| 5248 (58.7) 2264 (25.3) 1423 (16.0) | 1298 (65.4) 452 (22.8) 234 (11.8) | 1269 (59.4) 531 (24.9) 335 (15.7) | 169 (47.3) 86 (24.1) 102 (28.6) | 86 (25.7) 101 (30.1) 148 (44.2) | 608 (56.9) 261 (24.4) 200 (18.7) | 1818 (59.5) 833 (27.3) 404 (13.2) | <0.001 |
EBV status
| 23 (0.3) 8197 (91.7) 715 (8.0) | 2 (0.1) 1847 (93.1) 135 (6.8) | 8 (0.4) 1916 (89.7) 211 (9.9) | 0 (0) 327 (91.6) 30 (8.4) | 9 (2.7) 316 (94.3) 10 (3.0) | 1 (0.1) 979 (91.6) 89 (8.3) | 3 (0.1) 2812 (92.0) 240 (7.9) | <0.001 |
CMV status
| 722 (8.1) 1711 (19.1) 4777 (53.5) 1725 (19.3) | 68 (3.4) 254 (12.8) 1369 (69.0) 293 (14.8) | 270 (12.7) 468 (21.9) 796 (37.3) 601 (28.1) | 28 (7.8) 70 (19.6) 196 (54.9) 63 (17.7) | 25 (7.5) 151 (45.1) 116 (34.6) 43 (12.8) | 109 (10.2) 196 (18.3) 529 (49.5) 235 (22.0) | 222 (7.3) 572 (18.7) 1771 (58.0) 490 (16.0) | <0.001 |
Induction immunosuppression
| 5021 (56.2) 1382 (15.5) 2080 (23.3) 256 (2.9) 687 (7.7) | 1130 (57.0) 342 (17.2) 386 (19.5) 82 (4.1) 170 (8.6) | 1079 (50.5) 342 (16.0) 622 (29.1) 53 (2.5) 161 (7.5) | 211 (59.1) 57 (16.0) 51 (14.3) 16 (4.5) 34 (9.5) | 268 (80.0) 22 (6.6) 33 (9.8) 10 (3.0) 13 (3.9) | 577 (54.0) 176 (16.5) 258 (24.1) 29 (2.7) 82 (7.7) | 1756 (57.5) 443 (14.5) 730 (23.9) 66 (2.2) 227 (7.4) | <0.001 <0.001 <0.001 <0.001 0.050 |
Maintenance Immunosuppression
| 7983 (89.3) 115 (1.3) 8185 (91.6) 21 (0.2) 94 (1.1) 5910 (66.1) | 1766 (89.0) 23 (1.2) 1821 (91.8) 1 (0.1) 20 (1.0) 1330 (67.0) | 1896 (88.8) 31 (1.4) 1952 (91.4) 9 (0.4) 31 (1.5) 1341 (62.8) | 312 (87.4) 6 (1.7) 323 (90.5) 2 (0.6) 4 (1.1) 258 (72.3) | 298 (89.0) 4 (1.2) 307 (91.6) 1 (0.3) 1 (0.3) 160 (47.8) | 954 (89.2) 15 (1.4) 962 (90.0) 2 (0.2) 11 (1.0) 736 (68.9) | 2757 (90.2) 36 (1.2) 2820 (92.3) 6 (0.2) 27 (0.9) 2085 (68.3) | 0.419 0.905 0.274 0.155 0.307 <0.001 |
| Cluster 1 | Cluster 2 | Cluster 3 | Cluster 4 | Cluster 5 | Cluster 6 | |
|---|---|---|---|---|---|---|
| Primary non-function | 36 (1.8%) | 26 (1.2%) | 5 (1.4%) | 4 (1.2%) | 7 (0.7%) | 31 (1.0%) |
| Delayed graft function | 759 (38.3%) | 535 (25.1%) | 149 (41.7%) | 101 (30.2%) | 340 (31.8%) | 1247 (40.8%) |
| 1-year survival | 95.3% | 93.9% | 91.0% | 98.1% | 92.2% | 92.5% |
| 5-year survival | 79.2% | 68.6% | 62.1% | 90.5% | 68.9% | 67.0% |
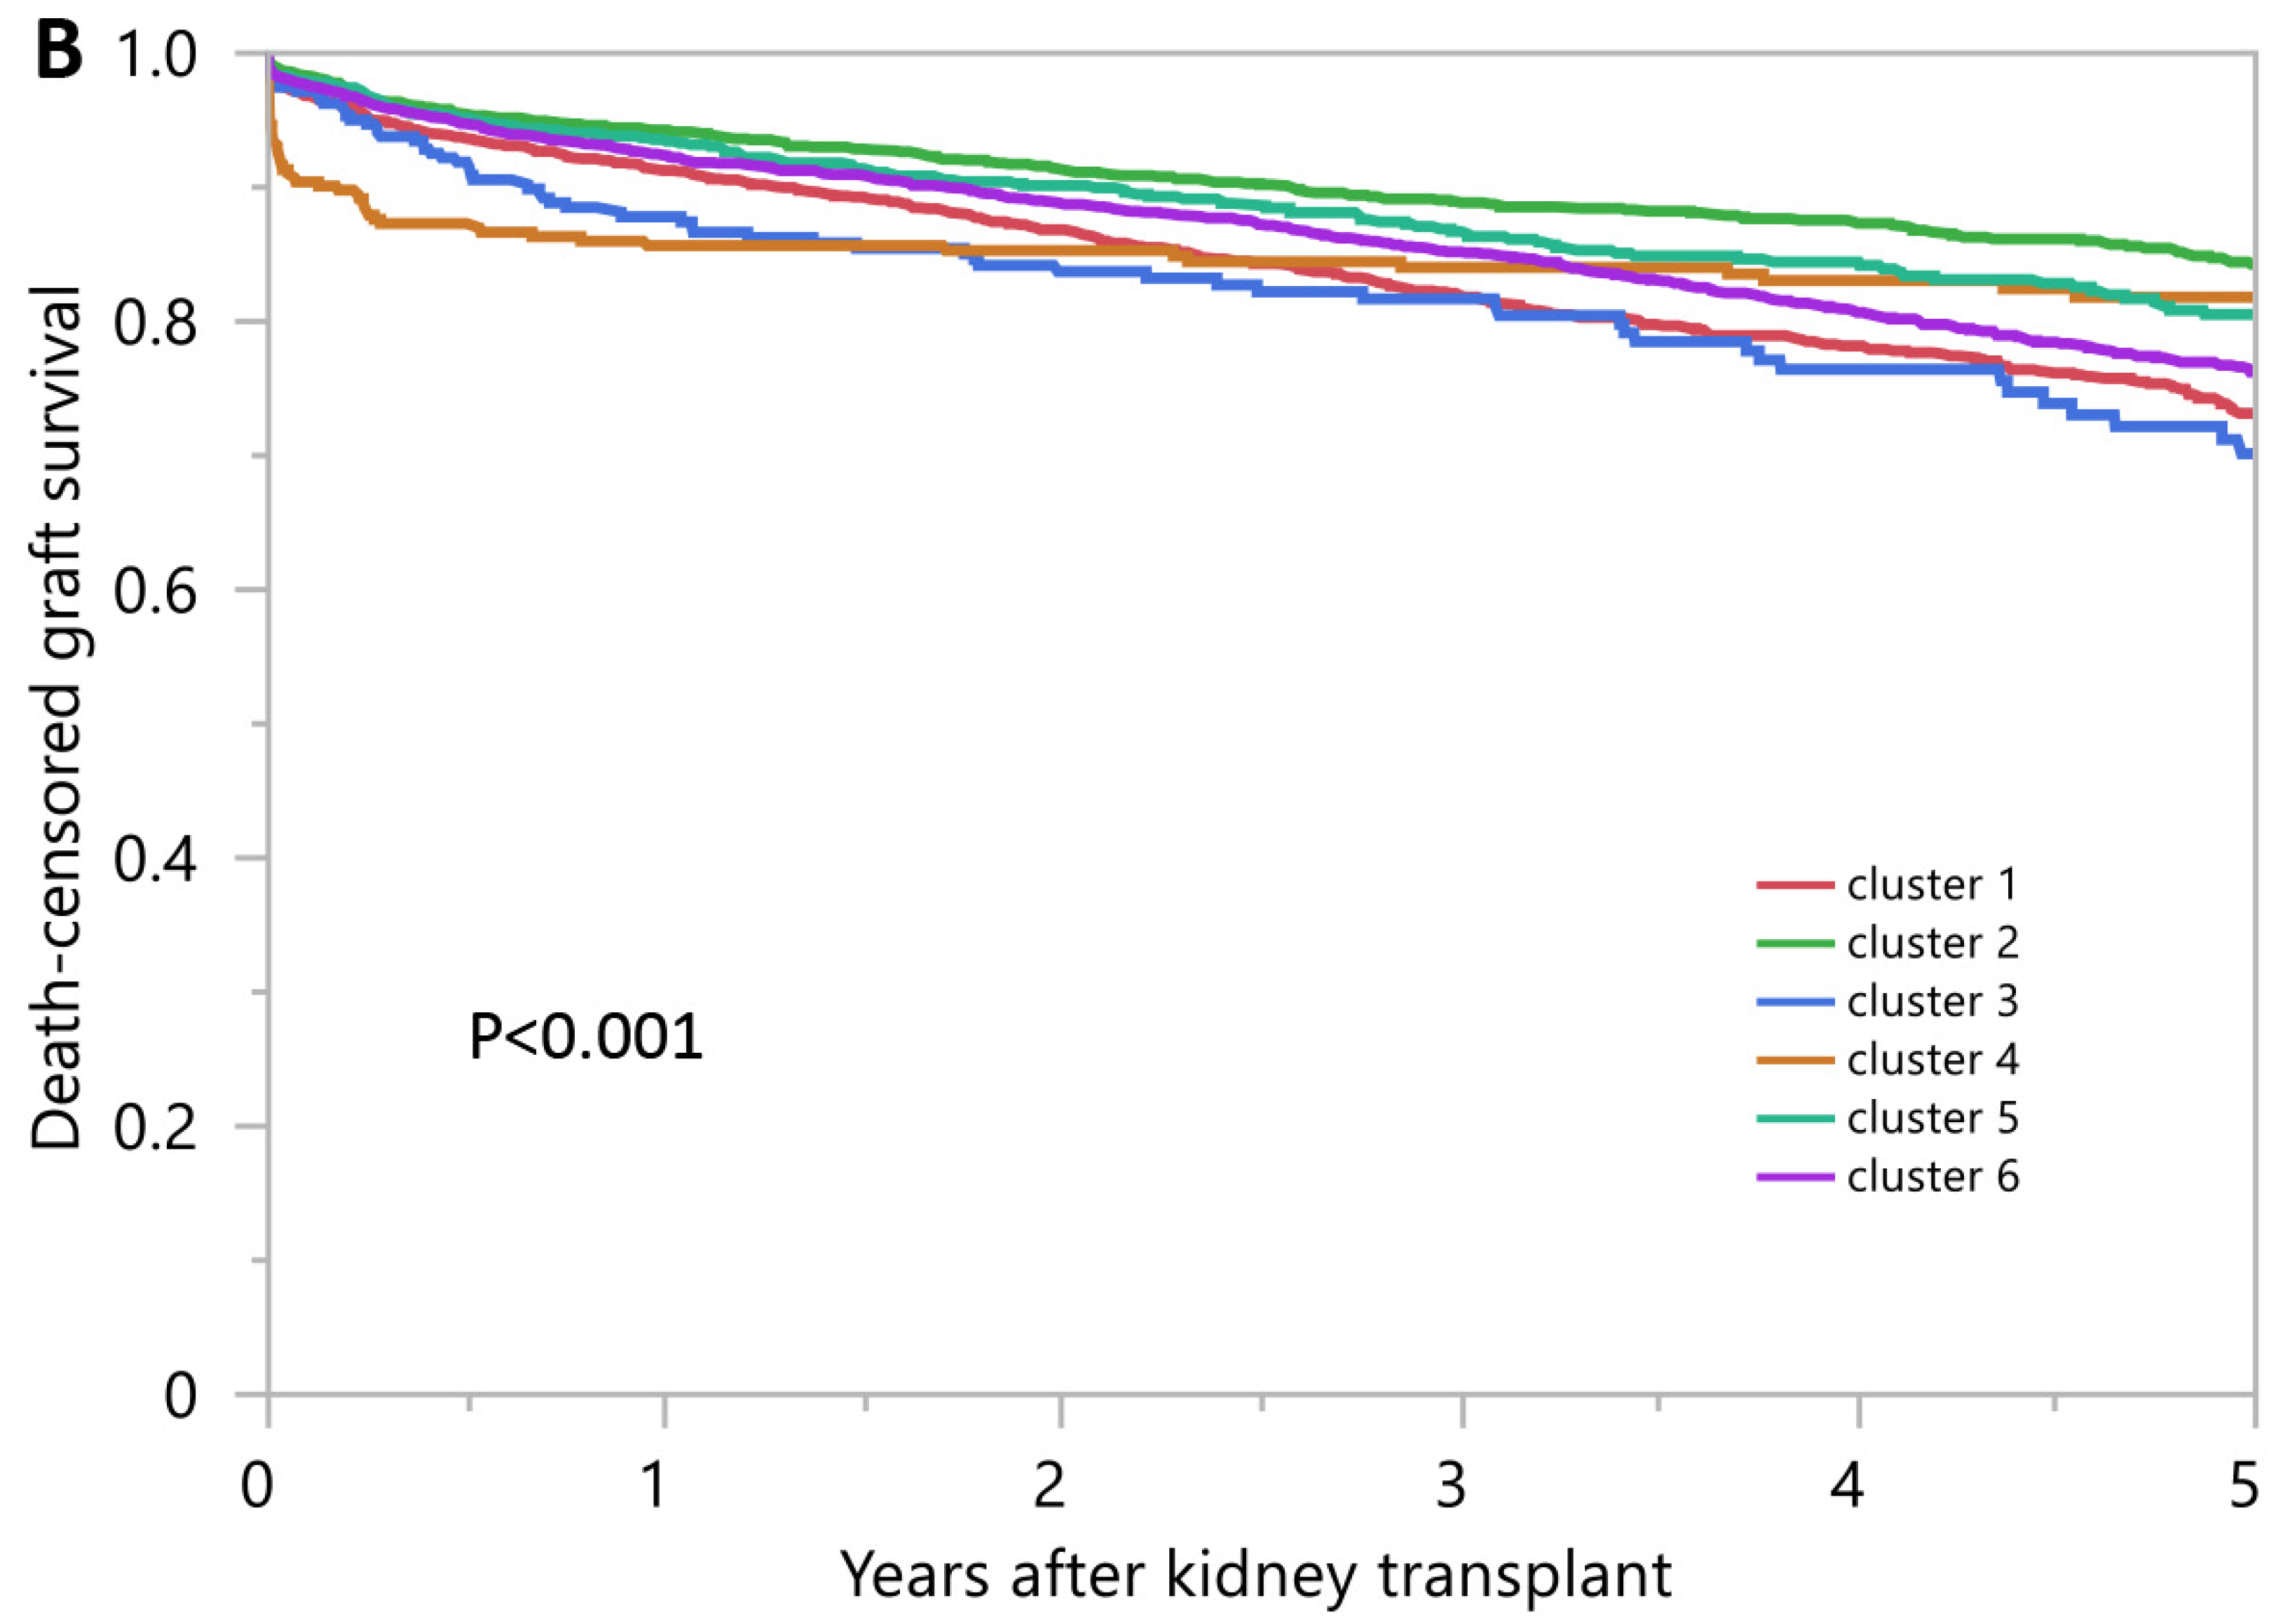
| 1-year death-censored graft survival | 91.2% | 94.3% | 87.8% | 85.6% | 93.4% | 92.3% |
| 5-year death-censored graft survival | 73.1% | 84.3% | 70.1% | 81.8% | 80.5% | 76.2% |
| 1-year graft survival | 88.1% | 90.2% | 81.8% | 84.8% | 88.6% | 87.3% |
| 5-year graft survival | 63.9% | 64.2% | 53.2% | 76.9% | 63.4% | 58.9% |
| 1-year acute rejection | 157 (7.9%) | 134 (6.3%) | 38 (10.6%) | 8 (2.4%) | 69 (6.5%) | 200 (6.6%) |
Publisher’s Note: MDPI stays neutral with regard to jurisdictional claims in published maps and institutional affiliations. |
© 2022 by the authors. Licensee MDPI, Basel, Switzerland. This article is an open access article distributed under the terms and conditions of the Creative Commons Attribution (CC BY) license (https://creativecommons.org/licenses/by/4.0/).
Share and Cite
Thongprayoon, C.; Radhakrishnan, Y.; Jadlowiec, C.C.; Mao, S.A.; Mao, M.A.; Vaitla, P.; Acharya, P.C.; Leeaphorn, N.; Kaewput, W.; Pattharanitima, P.; et al. Characteristics of Kidney Recipients of High Kidney Donor Profile Index Kidneys as Identified by Machine Learning Consensus Clustering. J. Pers. Med. 2022, 12, 1992. https://doi.org/10.3390/jpm12121992
Thongprayoon C, Radhakrishnan Y, Jadlowiec CC, Mao SA, Mao MA, Vaitla P, Acharya PC, Leeaphorn N, Kaewput W, Pattharanitima P, et al. Characteristics of Kidney Recipients of High Kidney Donor Profile Index Kidneys as Identified by Machine Learning Consensus Clustering. Journal of Personalized Medicine. 2022; 12(12):1992. https://doi.org/10.3390/jpm12121992
Chicago/Turabian StyleThongprayoon, Charat, Yeshwanter Radhakrishnan, Caroline C. Jadlowiec, Shennen A. Mao, Michael A. Mao, Pradeep Vaitla, Prakrati C. Acharya, Napat Leeaphorn, Wisit Kaewput, Pattharawin Pattharanitima, and et al. 2022. "Characteristics of Kidney Recipients of High Kidney Donor Profile Index Kidneys as Identified by Machine Learning Consensus Clustering" Journal of Personalized Medicine 12, no. 12: 1992. https://doi.org/10.3390/jpm12121992
APA StyleThongprayoon, C., Radhakrishnan, Y., Jadlowiec, C. C., Mao, S. A., Mao, M. A., Vaitla, P., Acharya, P. C., Leeaphorn, N., Kaewput, W., Pattharanitima, P., Tangpanithandee, S., Krisanapan, P., Nissaisorakarn, P., Cooper, M., & Cheungpasitporn, W. (2022). Characteristics of Kidney Recipients of High Kidney Donor Profile Index Kidneys as Identified by Machine Learning Consensus Clustering. Journal of Personalized Medicine, 12(12), 1992. https://doi.org/10.3390/jpm12121992