
Analysis of Genetic Variants Associated with COVID-19 Outcome Highlights Different Distributions among Populations

 , , ,
, , ,  , , , , ,
Abstract
1. Introduction
2. Materials and Methods
Statistical Analysis
3. Results and Discussion
Supplementary Materials
Author Contributions
Funding
Institutional Review Board Statement
Informed Consent Statement
Data Availability Statement
Conflicts of Interest
References
- World Health Organization. COVID-19 Weekly Epidemiological Update, 114th ed.; World Health Organization: Geneva, Switzerland, 2022. [Google Scholar]
- Liu, Y.C.; Kuo, R.L.; Shih, S.R. COVID-19: The first documented coronavirus pandemic in history. Biomed. J. 2020, 43, 328–333. [Google Scholar] [CrossRef] [PubMed]
- Caputo, V.; Termine, A.; Fabrizio, C.; Calvino, G.; Luzzi, L.; Fusco, C.; Ingrascì, A.; Peconi, C.; D’Alessio, R.; Mihali, S.; et al. Age and Sex Modulate SARS-CoV-2 Viral Load Kinetics: A Longitudinal Analysis of 1735 Subjects. J. Pers. Med. 2021, 11, 882. [Google Scholar] [CrossRef] [PubMed]
- Strafella, C.; Caputo, V.; Termine, A.; Barati, S.; Gambardella, S.; Borgiani, P.; Caltagirone, C.; Novelli, G.; Giardina, E.; Cascella, R. Analysis of ACE2 Genetic Variability among Populations Highlights a Possible Link with COVID-19-Related Neurological Complications. Genes 2020, 11, 741. [Google Scholar] [CrossRef] [PubMed]
- Long, S. SARS-CoV-2 Subgenomic RNAs: Characterization, Utility, and Perspectives. Viruses 2021, 13, 1923. [Google Scholar] [CrossRef] [PubMed]
- Qin, L.; Meng, J.; Ding, X.; Jiang, T. Mapping Genetic Events of SARS-CoV-2 Variants. Front. Microbiol. 2022, 13, 890590. [Google Scholar] [CrossRef] [PubMed]
- Caputo, V.; Calvino, G.; Strafella, C.; Termine, A.; Fabrizio, C.; Trastulli, G.; Ingrascì, A.; Peconi, C.; Bardini, S.; Rossini, A.; et al. Tracking the Initial Diffusion of SARS-CoV-2 Omicron Variant in Italy by RT-PCR and Comparison with Alpha and Delta Variants Spreading. Diagnostics 2022, 12, 467. [Google Scholar] [CrossRef] [PubMed]
- Strafella, C.; Caputo, V.; Termine, A.; Barati, S.; Caltagirone, C.; Giardina, E.; Cascella, R. Investigation of Genetic Variations of IL6 and IL6R as Potential Prognostic and Pharmacogenetics Biomarkers: Implications for COVID-19 and Neuroinflammatory Disorders. Life 2020, 10, 351. [Google Scholar] [CrossRef] [PubMed]
- Luo, X.; Lv, M.; Zhang, X.; Estill, J.; Yang, B.; Lei, R.; Ren, M.; Liu, Y.; Wang, L.; Liu, X.; et al. Clinical manifestations of COVID-19: An overview of 102 systematic reviews with evidence mapping. J. Evid. Based Med. 2022, 15, 201–215. [Google Scholar] [CrossRef] [PubMed]
- Cummings, M.J.; Baldwin, M.R.; Abrams, D.; Jacobson, S.D.; Meyer, B.J.; Balough, E.M.; Aaron, J.G.; Claassen, J.; Rabbani, L.E.; Hastie, J.; et al. Epidemiology, clinical course, and outcomes of critically ill adults with COVID-19 in New York City: A prospective cohort study. Lancet 2020, 395, 1763–1770. [Google Scholar] [CrossRef]
- Shelton, J.F.; Shastri, A.J.; Ye, C.; Weldon, C.H.; Filshtein-Sonmez, T.; Coker, D.; Symons, A.; Esparza-Gordillo, J.; 23andMe COVID-19 Team; Aslibekyan, S.; et al. Trans-ancestry analysis reveals genetic and nongenetic associations with COVID-19 susceptibility and severity. Nat. Genet. 2021, 53, 801–808. [Google Scholar] [CrossRef] [PubMed]
- Horowitz, J.E.; Kosmicki, J.A.; Damask, A.; Sharma, D.; Roberts, G.H.L.; Justice, A.E.; Banerjee, N.; Coignet, M.V.; Yadav, A.; Leader, J.B.; et al. Genome-wide analysis provides genetic evidence that ACE2 influences COVID-19 risk and yields risk scores associated with severe disease. Nat. Genet. 2022, 54, 382–392. [Google Scholar] [CrossRef]
- Clark, A.; Jit, M.; Warren-Gash, C.; Guthrie, B.; Wang, H.H.X.; Mercer, S.W.; Sanderson, C.; McKee, M.; Troeger, C.; Ong, K.L.; et al. Centre for the Mathematical Modelling of Infectious Diseases COVID-19 working group. Global, regional, and national estimates of the population at increased risk of severe COVID-19 due to underlying health conditions in 2020: A modelling study. Lancet Glob. Health 2020, 8, e1003–e1017. [Google Scholar] [CrossRef]
- Hashim, M.J.; Alsuwaidi, A.R.; Khan, G. Population Risk Factors for COVID-19 Mortality in 93 Countries. J. Epidemiol. Glob. Health 2020, 10, 204–208. [Google Scholar] [CrossRef] [PubMed]
- Marçalo, R.; Neto, S.; Pinheiro, M.; Rodrigues, A.J.; Sousa, N.; Santos, M.A.S.; Simão, P.; Valente, C.; Andrade, L.; Marques, A.; et al. Evaluation of the genetic risk for COVID-19 outcomes in COPD and differences among worldwide populations. PLoS ONE 2022, 17, e0264009. [Google Scholar] [CrossRef] [PubMed]
- Cunningham, F.; Amode, M.R.; Barrell, D.; Beal, K.; Billis, K.; Brent, S.; Carvalho-Silva, D.; Clapham, P.; Coates, G.; Fitzgerald, S.; et al. Ensembl 2015. Nucleic. Acids Res. 2015, 43, D662–D669. [Google Scholar] [CrossRef] [PubMed]
- Hollander, M.; Wolfe, D.A.; Chicken, E. Nonparametric Statistical Methods; John Wiley & Sons: New York, NY, USA, 1999; Volume 57, pp. 58–59. [Google Scholar]
- Booth, A.; Reed, A.B.; Ponzo, S.; Yassaee, A.; Aral, M.; Plans, D.; Labrique, A.; Mohan, D. Population risk factors for severe disease and mortality in COVID-19: A global systematic review and meta-analysis. PLoS ONE 2021, 16, e0247461. [Google Scholar] [CrossRef] [PubMed]
- COVID-19 Host Genetics Initiative. The COVID-19 Host Genetics Initiative, a global initiative to elucidate the role of host genetic factors in susceptibility and severity of the SARS-CoV-2 virus pandemic. Eur. J. Hum. Genet. 2020, 28, 715–718. [Google Scholar] [CrossRef] [PubMed]


| Phenotype | Comparison. | p-Value | Adjusted p-Value |
|---|---|---|---|
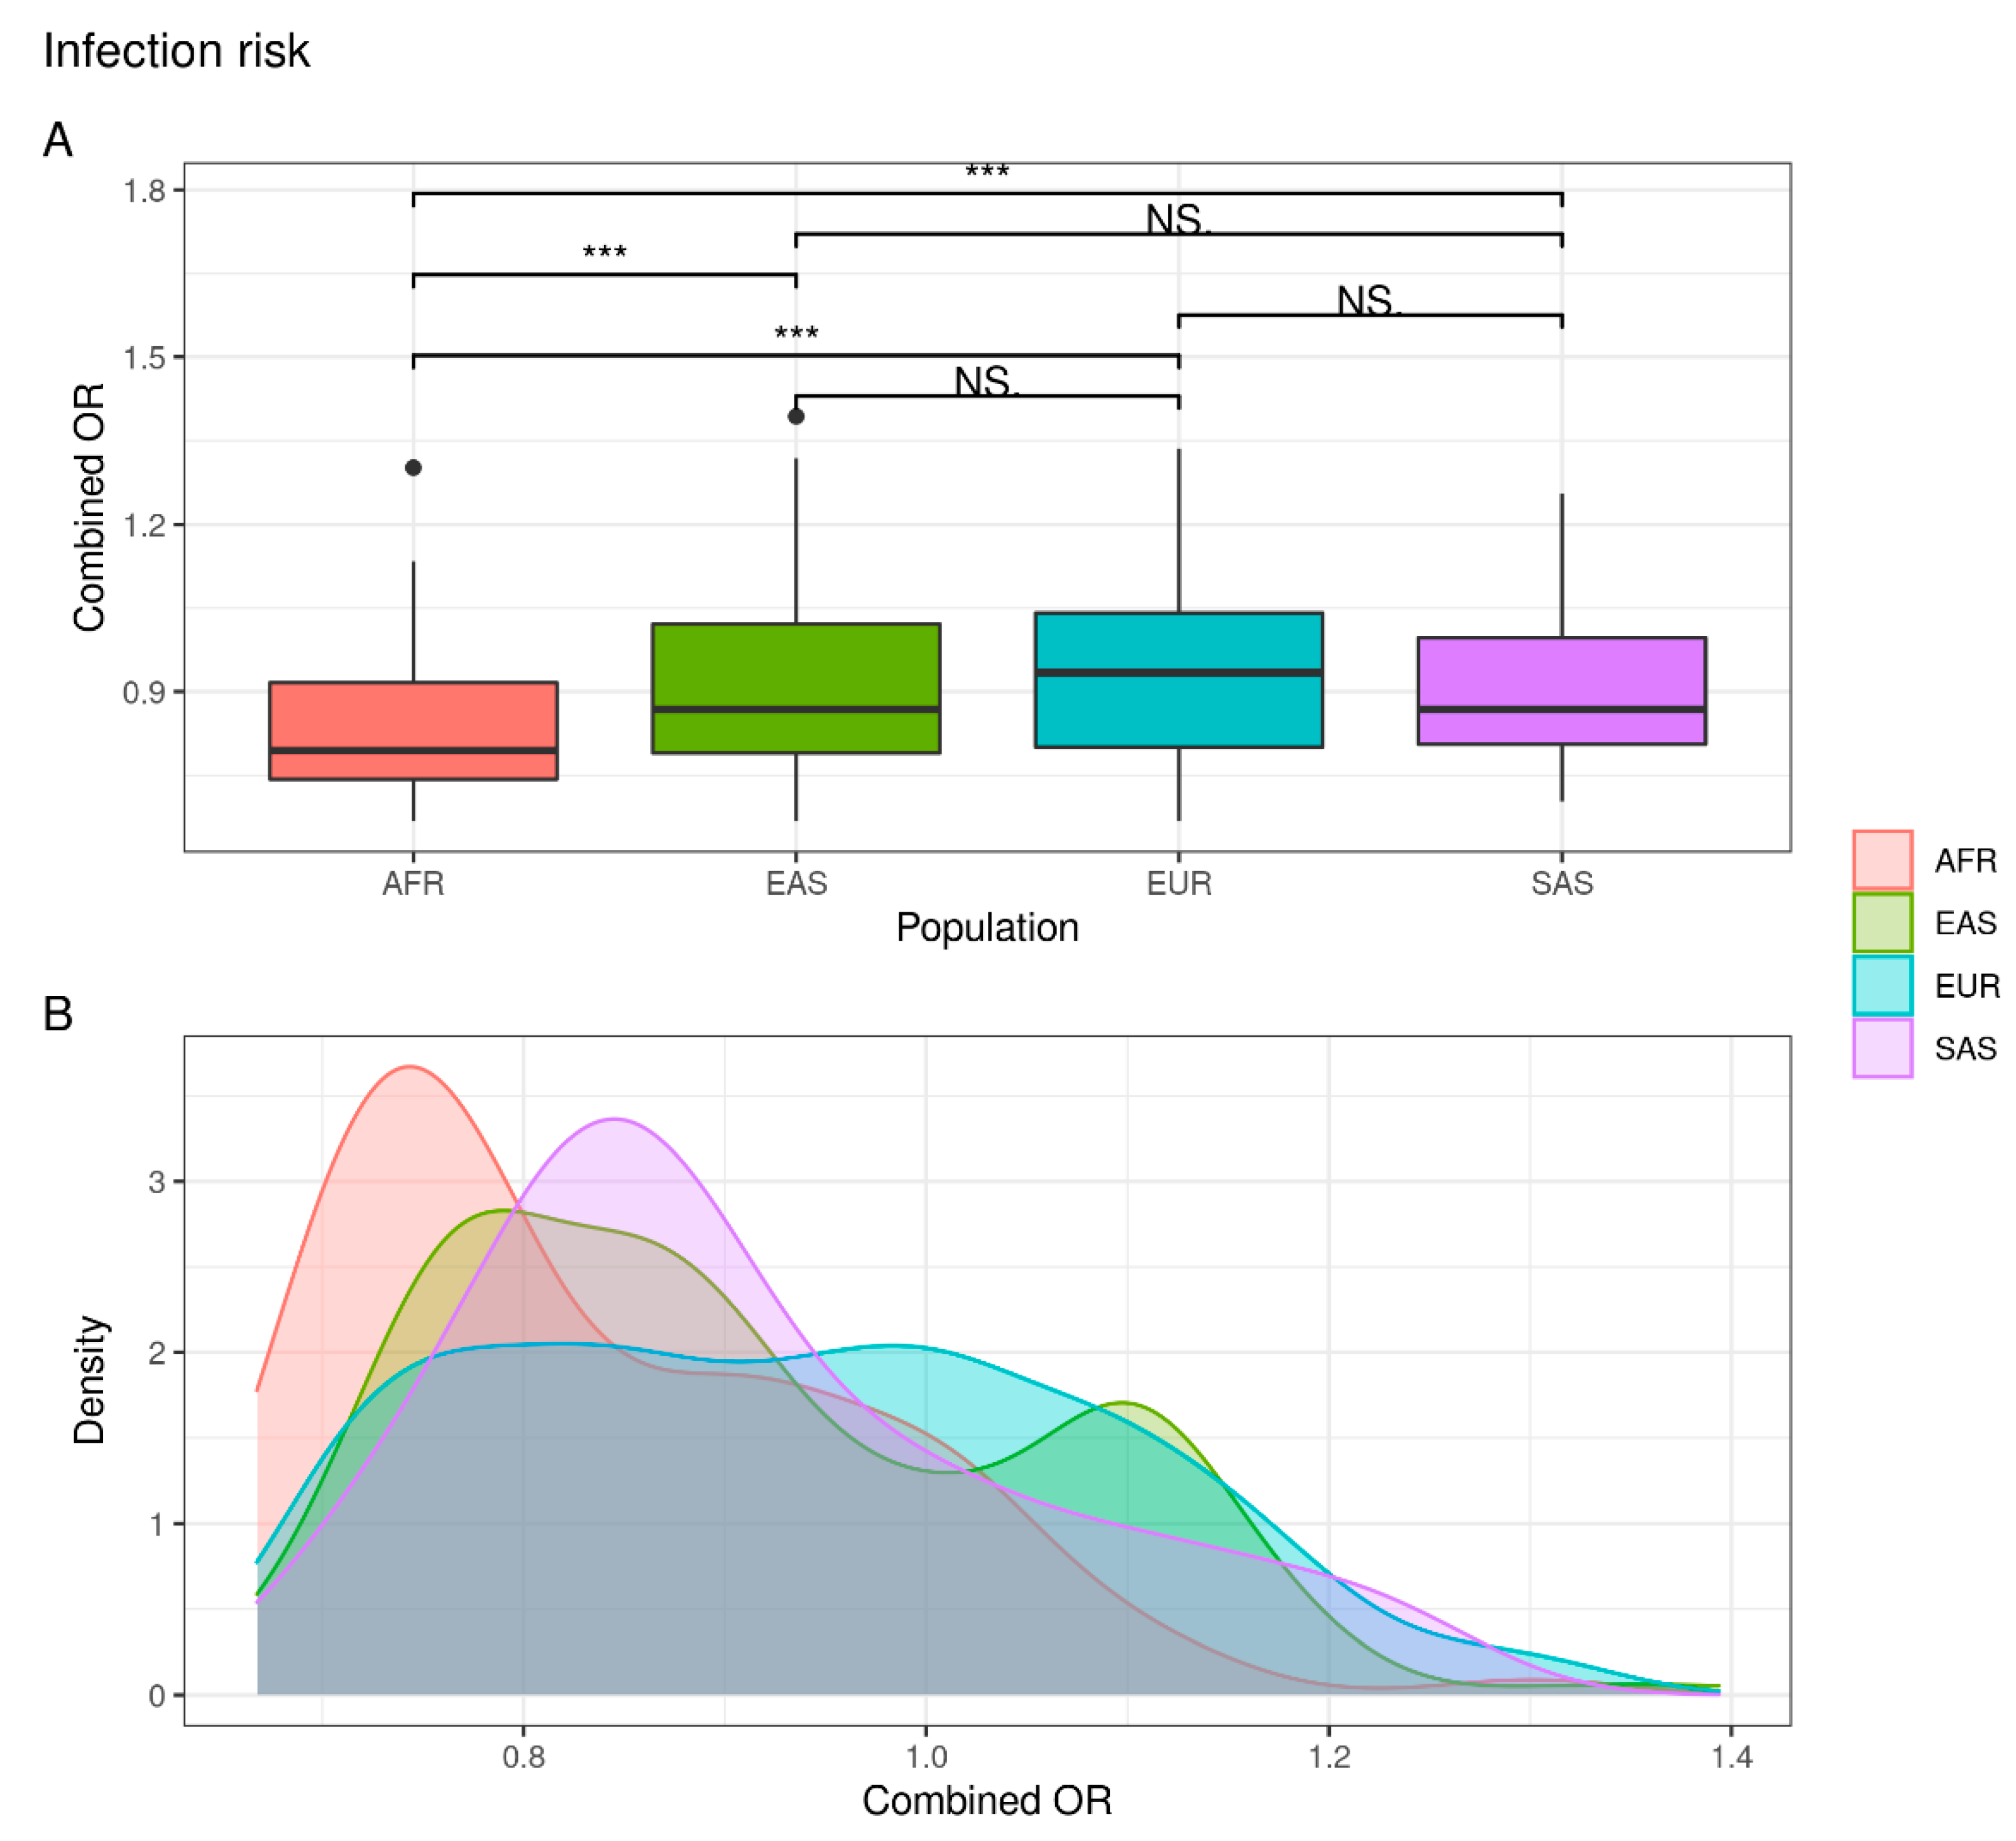
| Infection risk | EUR vs. EAS | NS | NS |
| EUR vs. AFR | 1.116 × 10⁻⁸ | 2.678 × 10⁻⁷ | |
| EUR vs. SAS | NS | NS | |
| EAS vs. AFR | 2.764 × 10⁻⁷ | 5.529 × 10⁻⁶ | |
| EAS vs. SAS | NS | NS | |
| AFR vs. SAS | 4.912 × 10⁻⁵ | 7.368 × 10⁻⁴ | |
| COVID-19 hospitalized | EUR vs. EAS | 4.724 × 10⁻⁸ | 1.039 × 10⁻⁶ |
| EUR vs. AFR | 6.699 × 10⁻¹¹ | 1.808 × 10⁻⁹ | |
| EUR vs. SAS | 2.645 × 10⁻³ | 2.381 × 10⁻² | |
| EAS vs. AFR | 7.099 × 10⁻⁴ | 7.099 × 10⁻³ | |
| EAS vs. SAS | 3.331 × 10⁻¹⁰ | 8.326 × 10⁻⁹ | |
| AFR vs. SAS | 5.187 × 10⁻¹² | 1.504 × 10⁻¹⁰ | |
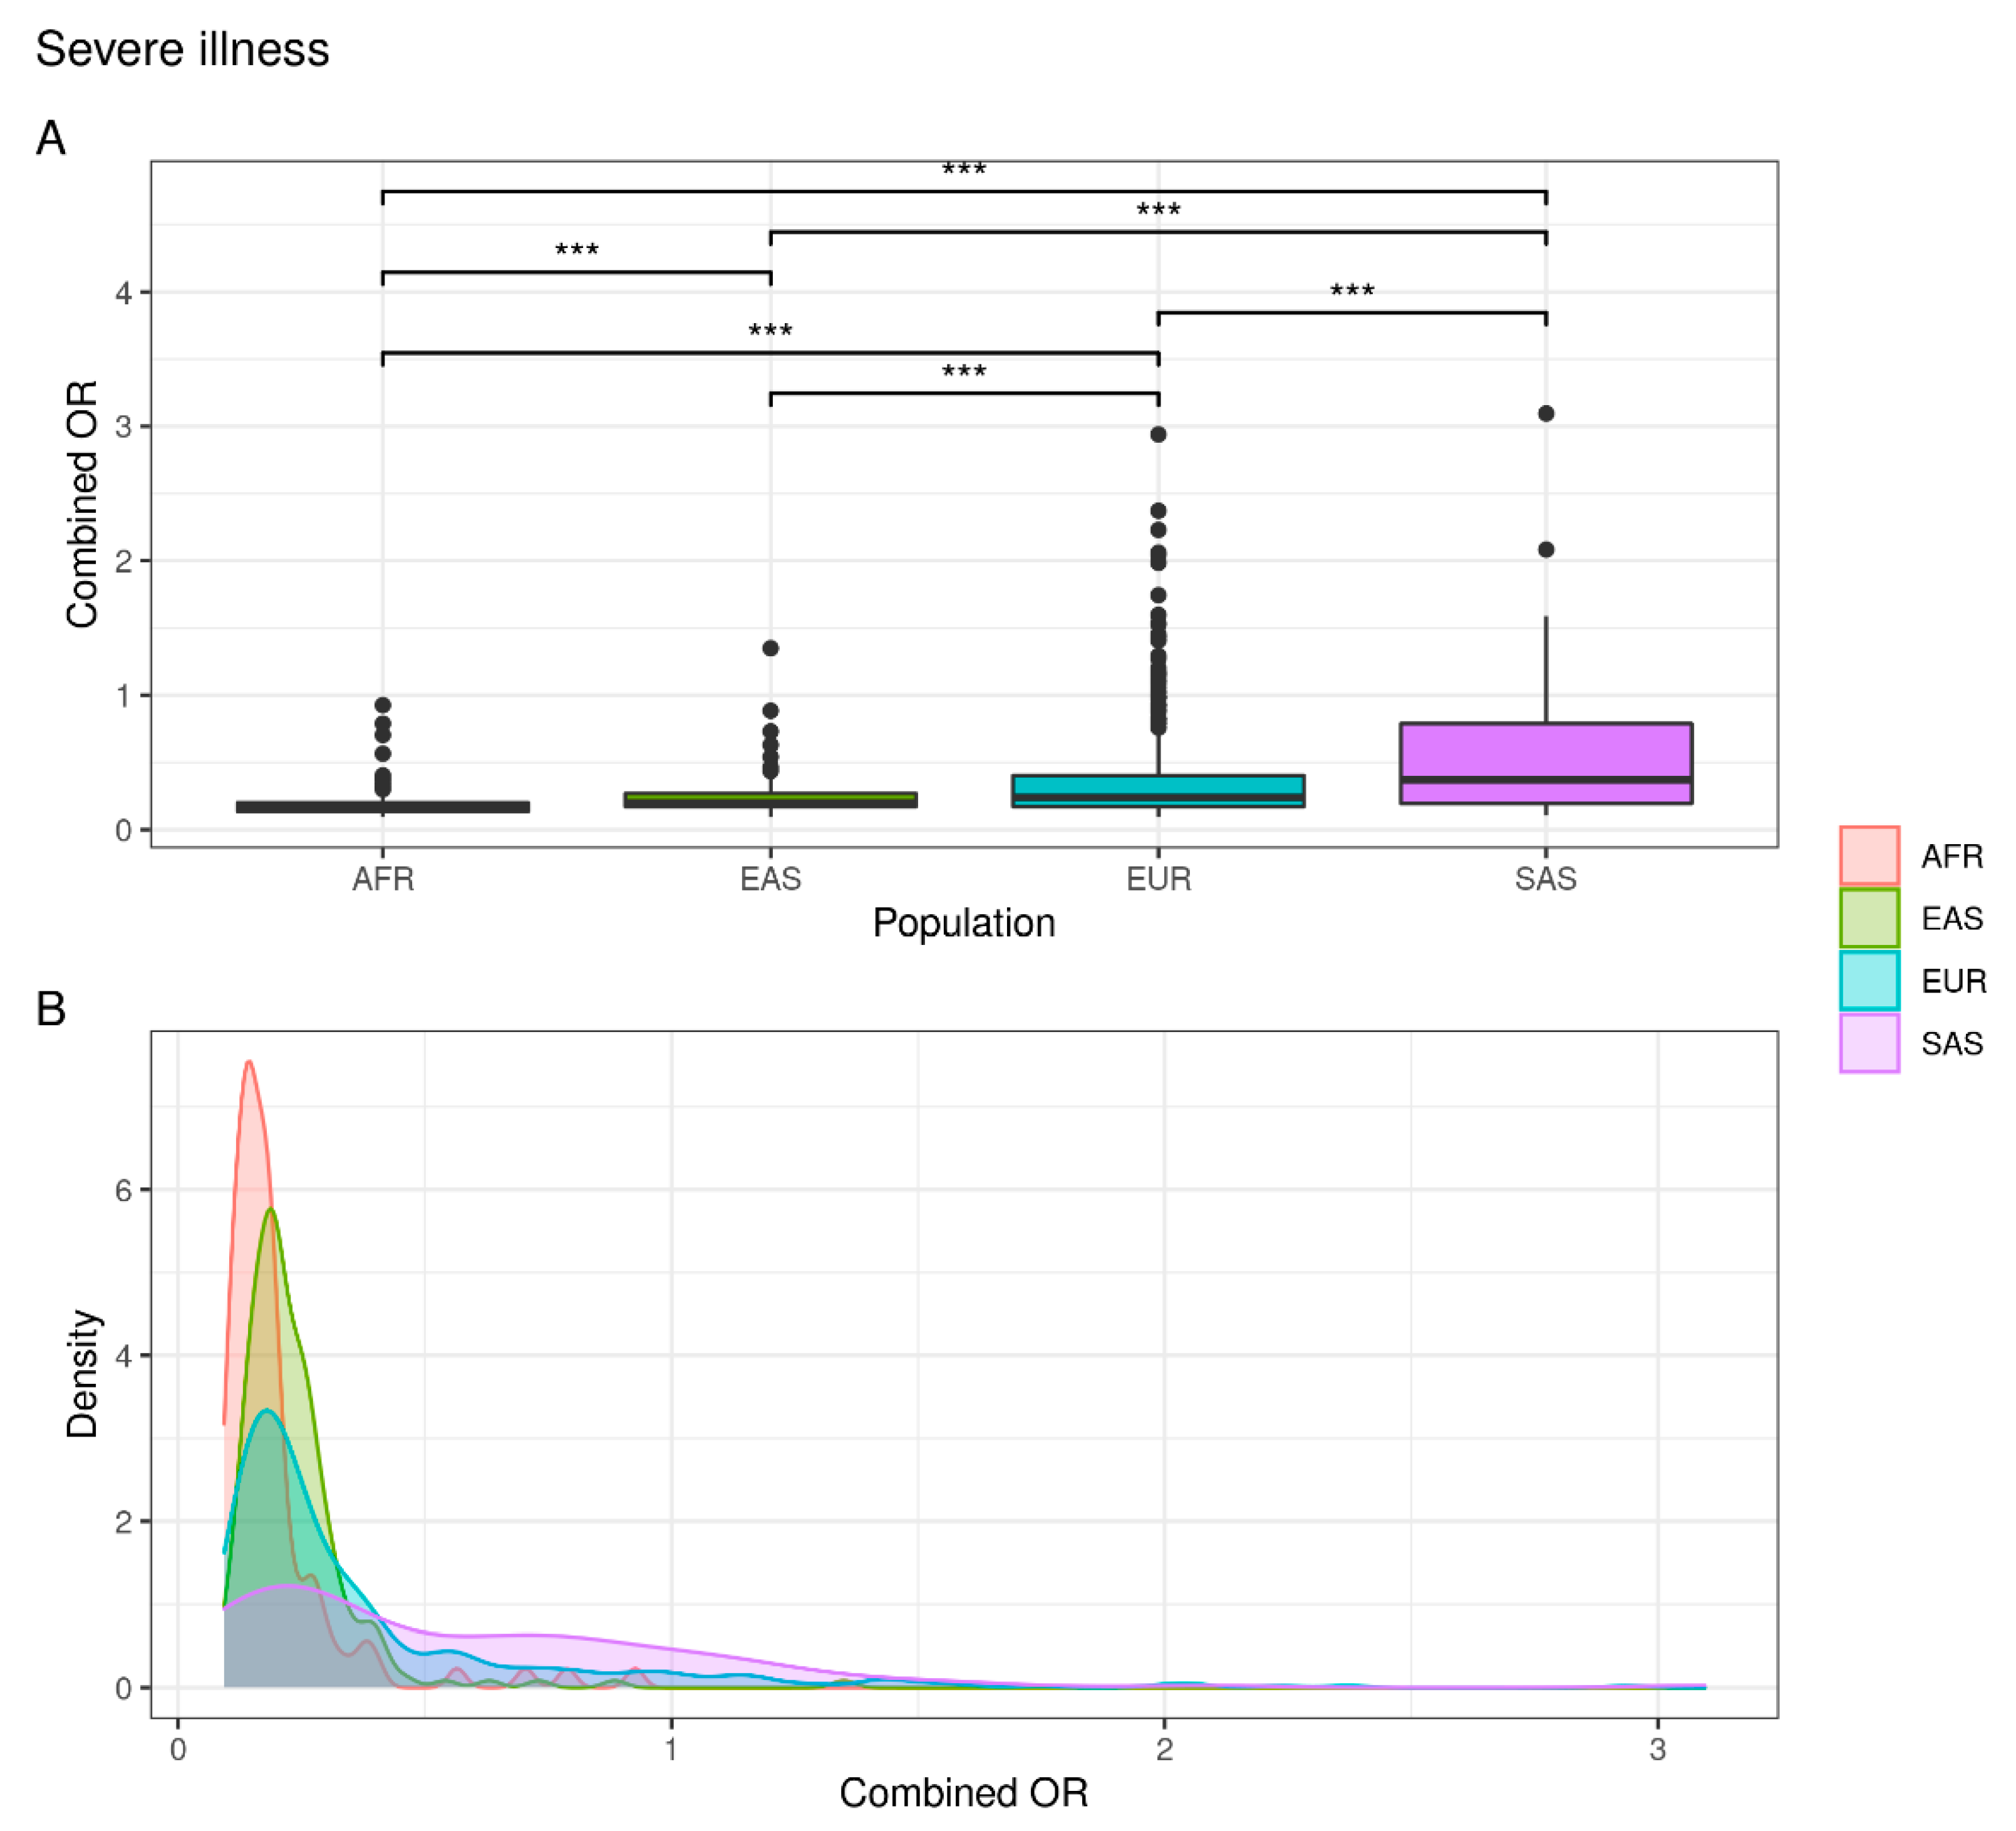
| Severe illness | EUR vs. EAS | 4.927 × 10⁻⁴ | 5.949 × 10⁻³ |
| EUR vs. AFR | 4.609 × 10⁻¹¹ | 1.290 × 10⁻⁹ | |
| EUR vs. SAS | 2.137 × 10⁻⁵ | 3.847 × 10⁻⁴ | |
| EAS vs. AFR | 2.408 × 10⁻⁷ | 5.058 × 10⁻⁶ | |
| EAS vs. SAS | 1.197 × 10⁻¹⁰ | 3.113 × 10⁻⁹ | |
| AFR vs. SAS | 1.036 × 10⁻¹⁴ | 3.110 × 10⁻¹³ |
Publisher’s Note: MDPI stays neutral with regard to jurisdictional claims in published maps and institutional affiliations. |
© 2022 by the authors. Licensee MDPI, Basel, Switzerland. This article is an open access article distributed under the terms and conditions of the Creative Commons Attribution (CC BY) license (https://creativecommons.org/licenses/by/4.0/).
Share and Cite
Fabrizio, C.; Termine, A.; Caputo, V.; Megalizzi, D.; Calvino, G.; Trastulli, G.; Ingrascì, A.; Ferrante, S.; Peconi, C.; Rossini, A.; et al. Analysis of Genetic Variants Associated with COVID-19 Outcome Highlights Different Distributions among Populations. J. Pers. Med. 2022, 12, 1851. https://doi.org/10.3390/jpm12111851
Fabrizio C, Termine A, Caputo V, Megalizzi D, Calvino G, Trastulli G, Ingrascì A, Ferrante S, Peconi C, Rossini A, et al. Analysis of Genetic Variants Associated with COVID-19 Outcome Highlights Different Distributions among Populations. Journal of Personalized Medicine. 2022; 12(11):1851. https://doi.org/10.3390/jpm12111851
Chicago/Turabian StyleFabrizio, Carlo, Andrea Termine, Valerio Caputo, Domenica Megalizzi, Giulia Calvino, Giulia Trastulli, Arcangela Ingrascì, Simona Ferrante, Cristina Peconi, Angelo Rossini, and et al. 2022. "Analysis of Genetic Variants Associated with COVID-19 Outcome Highlights Different Distributions among Populations" Journal of Personalized Medicine 12, no. 11: 1851. https://doi.org/10.3390/jpm12111851
APA StyleFabrizio, C., Termine, A., Caputo, V., Megalizzi, D., Calvino, G., Trastulli, G., Ingrascì, A., Ferrante, S., Peconi, C., Rossini, A., Salvia, A., Caltagirone, C., Strafella, C., Giardina, E., & Cascella, R. (2022). Analysis of Genetic Variants Associated with COVID-19 Outcome Highlights Different Distributions among Populations. Journal of Personalized Medicine, 12(11), 1851. https://doi.org/10.3390/jpm12111851