
Machine Learning in Predicting Tooth Loss: A Systematic Review and Risk of Bias Assessment

 , and
, and
Abstract
:1. Introduction
2. Materials and Methods
2.1. Focused Question
2.2. Search Strategy
2.3. Inclusion and Exclusion Selection Criteria
2.4. Data Extraction and Risk of Bias Assessment
3. Results
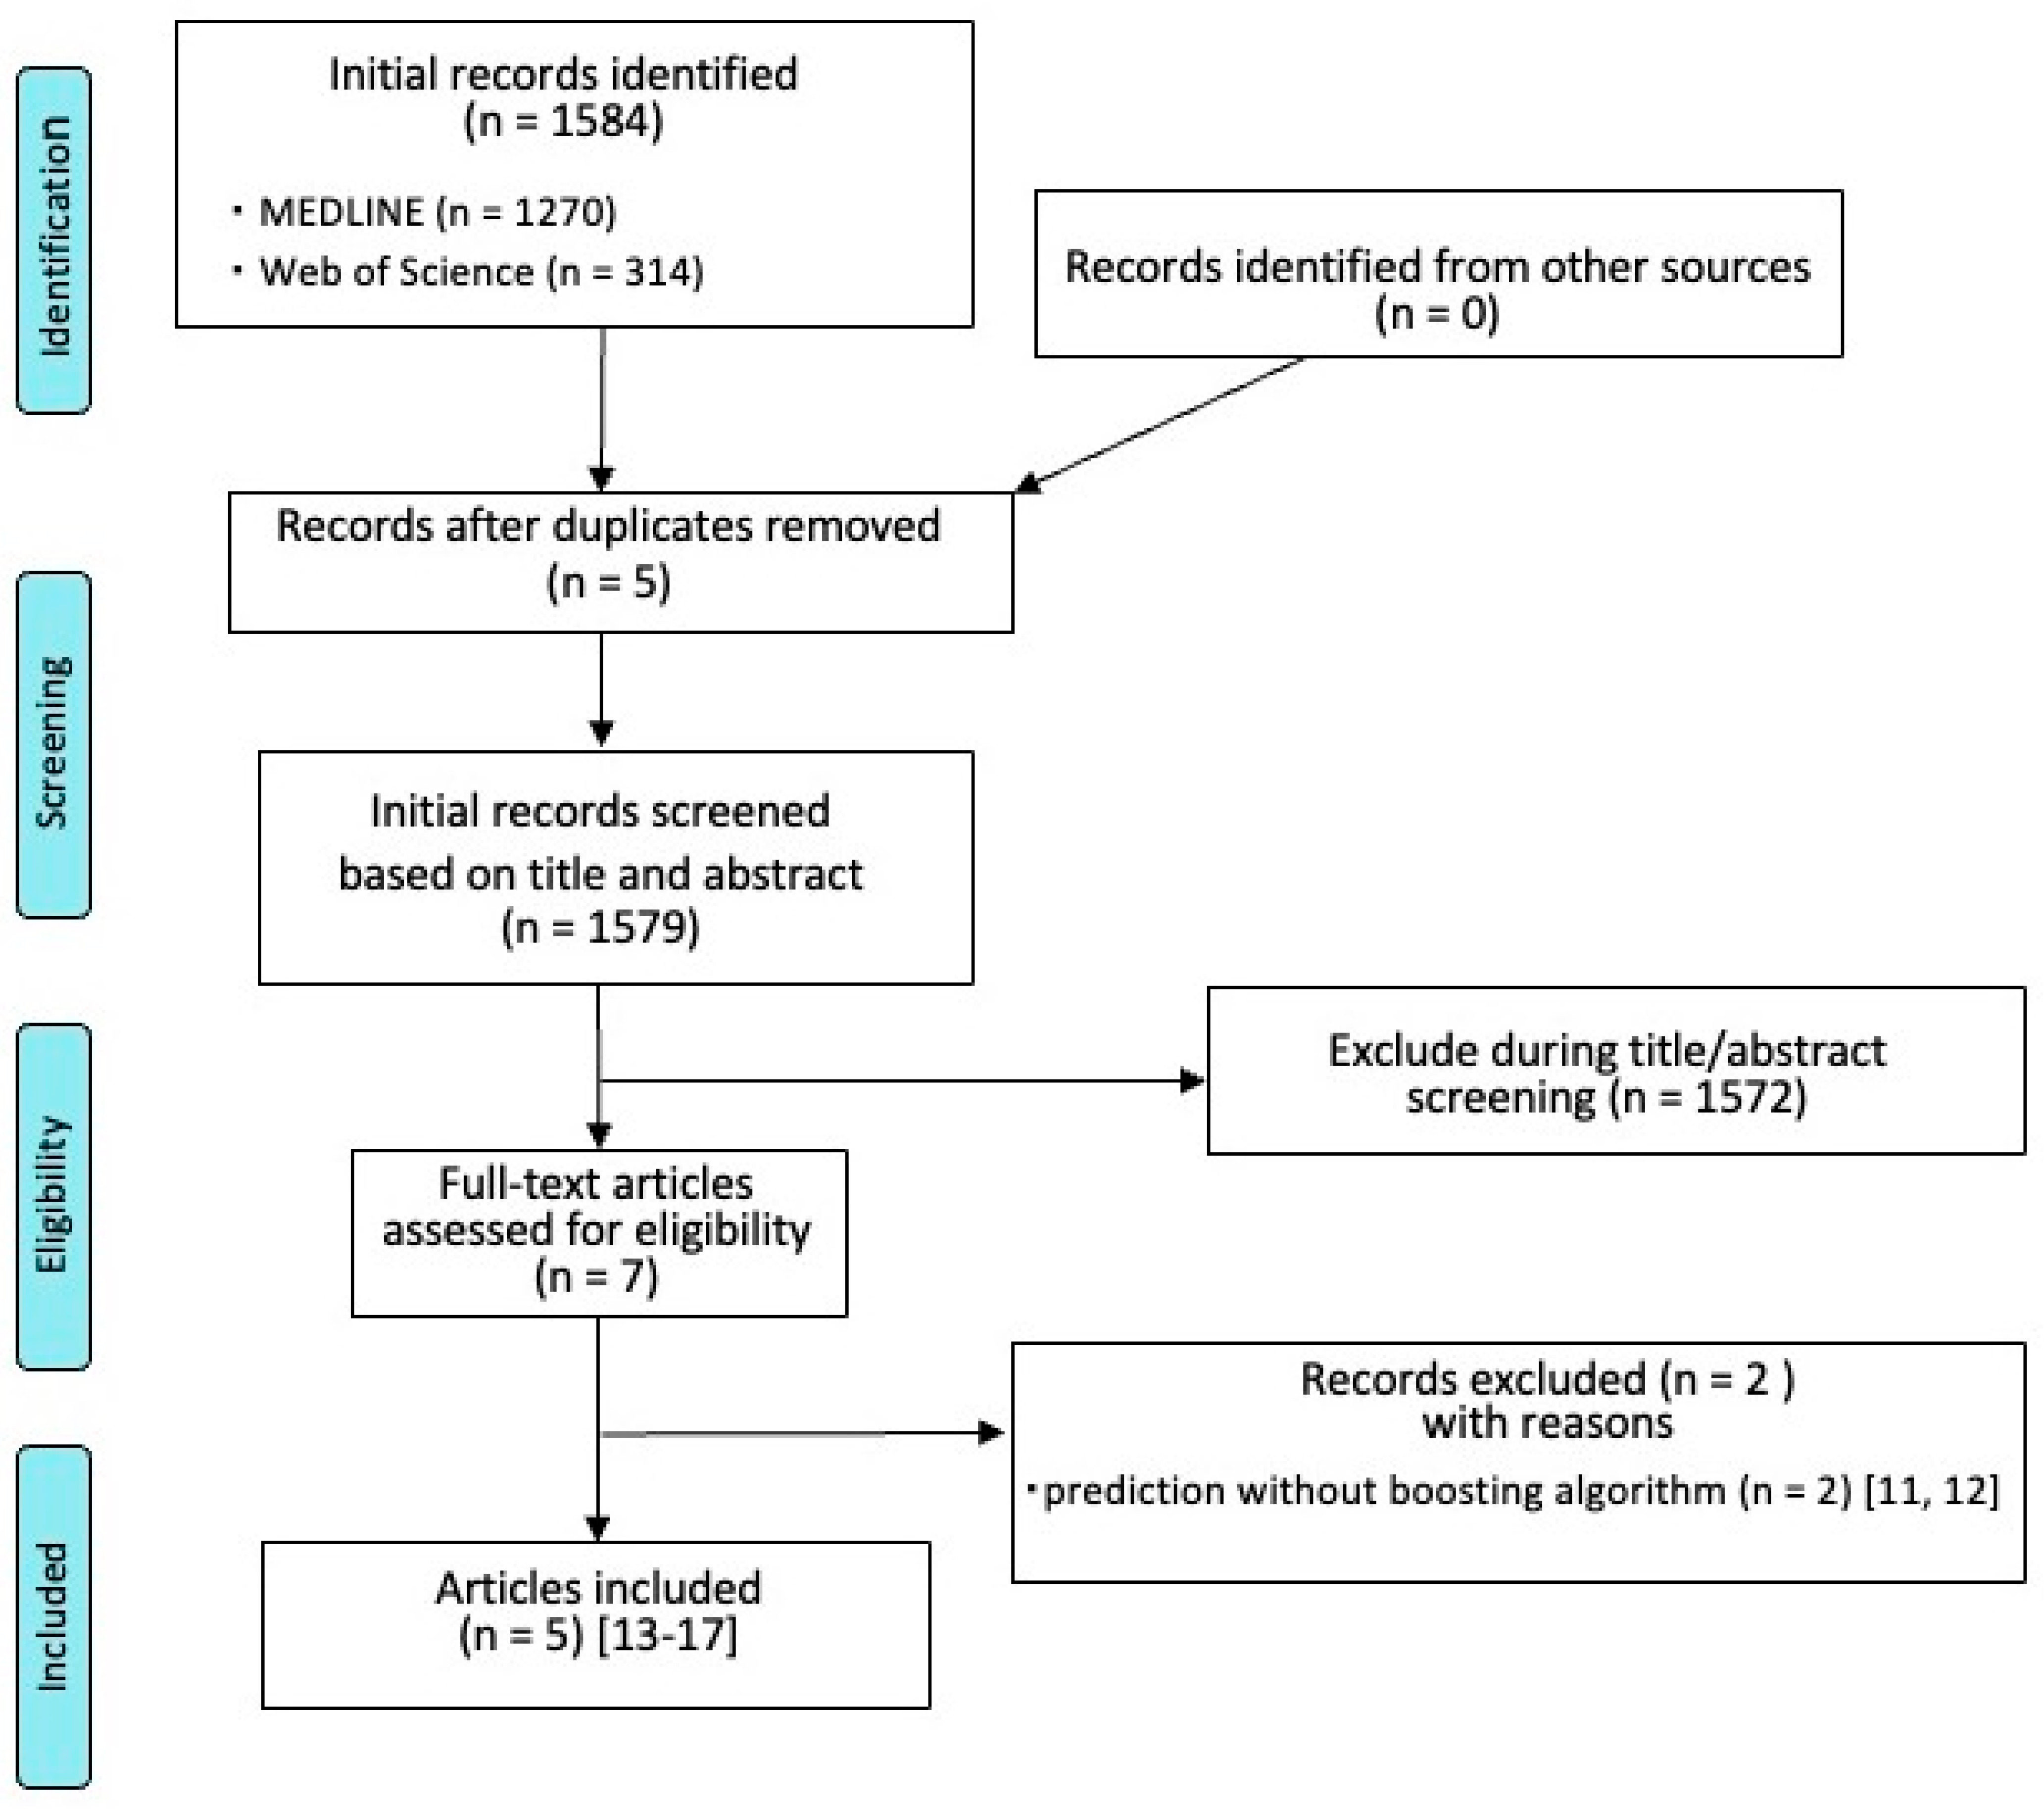
3.1. Search Results
3.2. General Study Characteristics and Results
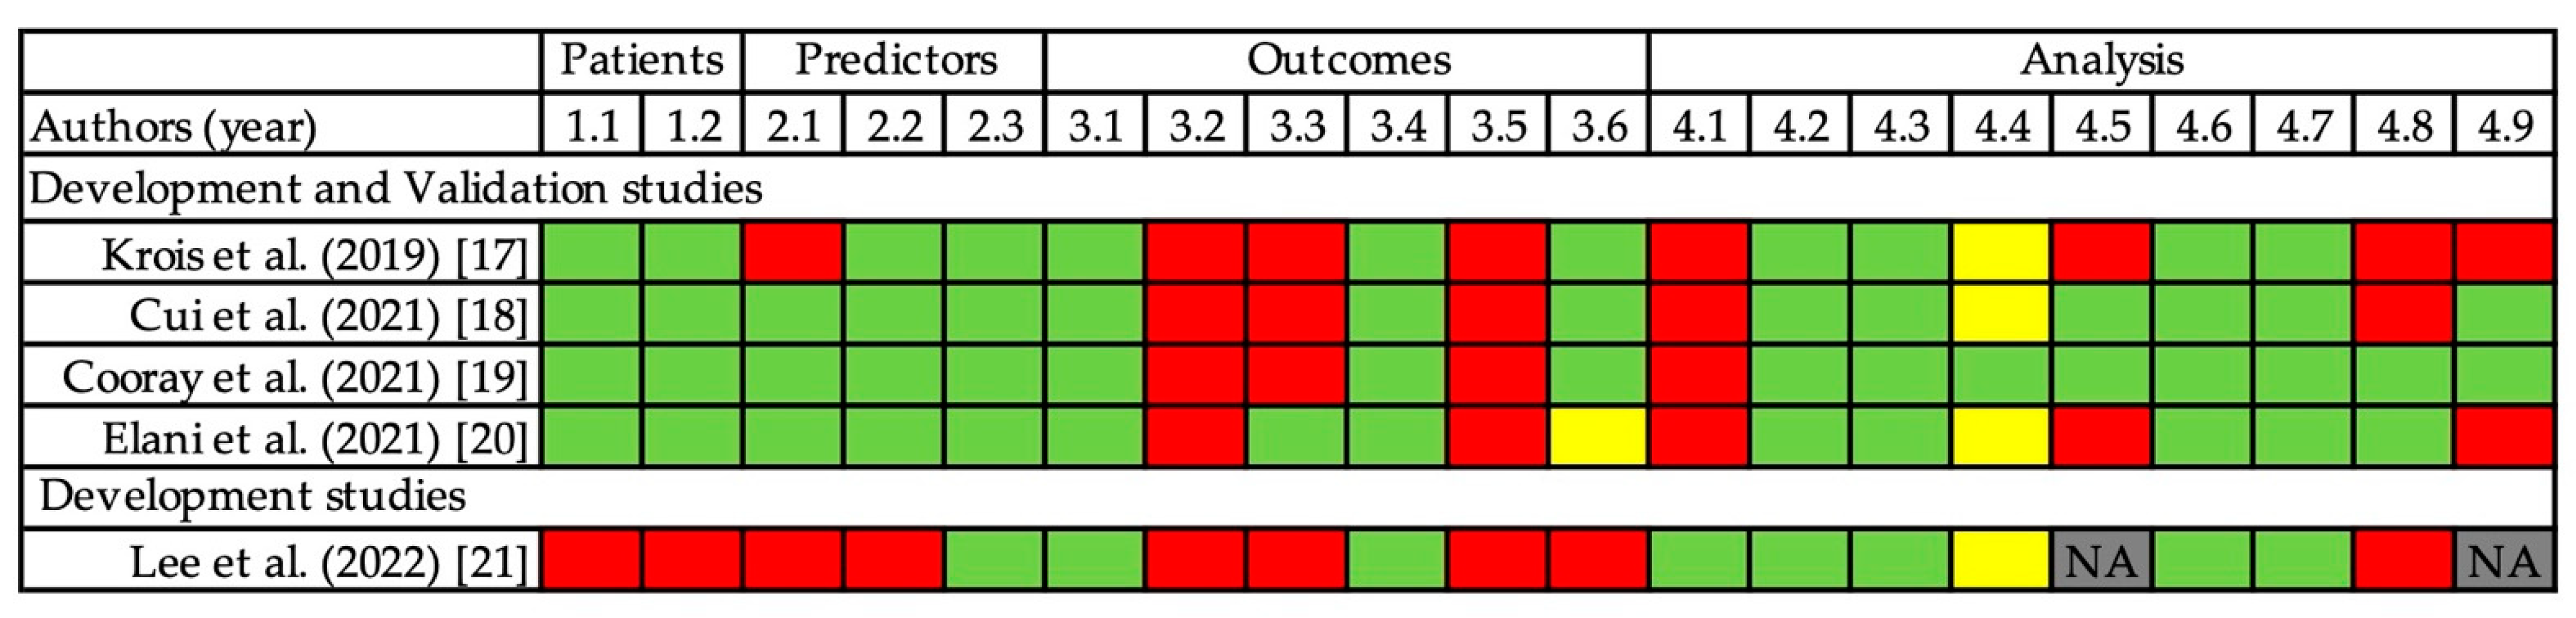
3.3. Risk of Bias Assessment
4. Discussion
5. Conclusions
Author Contributions
Funding
Institutional Review Board Statement
Informed Consent Statement
Data Availability Statement
Conflicts of Interest
References
- Saydzai, S.; Buontempo, Z.; Patel, P.; Hasan, F.; Sun, C.; Akcalı, A.; Lin, G.; Donos, N.; Nibali, L. Comparison of the efficacy of periodontal prognostic systems in predicting tooth loss. J. Clin. Periodontol. 2022, 49, 740–748. [Google Scholar] [CrossRef] [PubMed]
- Hirschfeld, L.; Wasserman, B. A Long-Term Survey of Tooth Loss in 600 Treated Periodontal Patients. J. Periodontol. 1978, 49, 225–237. [Google Scholar] [CrossRef] [PubMed] [Green Version]
- McGuire, M.K. Prognosis Versus Actual Outcome: A Long-Term Survey of 100 Treated Periodontal Patients Under Maintenance Care. J. Periodontol. 1991, 62, 51–58. [Google Scholar] [CrossRef] [Green Version]
- Kwok, V.; Caton, J.G. Commentary: Prognosis Revisited: A System for Assigning Periodontal Prognosis. J. Periodontol. 2007, 78, 2063–2071. [Google Scholar] [CrossRef]
- Avila, G.; Galindo-Moreno, P.; Soehren, S.; Misch, C.E.; Morelli, T.; Wang, H.-L. A Novel Decision-Making Process for Tooth Retention or Extraction. J. Periodontol. 2009, 80, 476–491. [Google Scholar] [CrossRef]
- Miller, P.D.; McEntire, M.L.; Marlow, N.M.; Gellin, R.G. An Evidenced-Based Scoring Index to Determine the Periodontal Prognosis on Molars. J. Periodontol. 2014, 85, 214–225. [Google Scholar] [CrossRef] [Green Version]
- Beck, J.D.; Philips, K.; Moss, K.; Divaris, K.; Morelli, T.; Offenbacher, S. Advances in precision oral health. Periodontol. 2000 2019, 82, 268–285. [Google Scholar] [CrossRef]
- Flores, M.; Glusman, G.; Brogaard, K.; Price, N.D.; Hood, L. P4 medicine: How systems medicine will transform the healthcare sector and society. Pers. Med. 2013, 10, 565–576. [Google Scholar] [CrossRef] [PubMed] [Green Version]
- Ma, J.; Schneider, L.; Lapuschkin, S.; Achtibat, R.; Duchrau, M.; Krois, J.; Schwendicke, F.; Samek, W. Towards Trustworthy AI in Dentistry. J. Dent. Res. 2022, 101, 1263–1268. [Google Scholar] [CrossRef]
- Deo, R.C. Machine Learning in Medicine. Circulation 2015, 132, 1920–1930. [Google Scholar] [CrossRef]
- Ngiam, K.Y.; Khor, I.W. Big data and machine learning algorithms for health-care delivery. Lancet Oncol. 2019, 20, e262–e273. [Google Scholar] [CrossRef]
- Alqaissi, E.Y.; Alotaibi, F.S.; Ramzan, M.S. Modern Machine-Learning Predictive Models for Diagnosing Infectious Diseases. Comput. Math. Methods Med. 2022, 2022, 6902321. [Google Scholar] [CrossRef] [PubMed]
- Bottino, F.; Tagliente, E.; Pasquini, L.; Di Napoli, A.; Lucignani, M.; Figà-Talamanca, L.; Napolitano, A. COVID Mortality Prediction with Machine Learning Methods: A Systematic Review and Critical Appraisal. J. Pers. Med. 2021, 11, 893. [Google Scholar] [CrossRef] [PubMed]
- Moons, K.G.; Wolff, R.F.; Riley, R.D.; Whiting, P.F.; Westwood, M.; Collins, G.S.; Reitsma, J.B.; Kleijnen, J.; Mallett, S. PROBAST: A Tool to Assess Risk of Bias and Applicability of Prediction Model Studies: Explanation and Elaboration. Ann. Intern. Med. 2019, 170, W1–W33. [Google Scholar] [CrossRef] [PubMed] [Green Version]
- Shi, S.; Meng, Y.; Li, W.; Jiao, J.; Meng, H.; Feng, X. A nomogram prediction for mandibular molar survival in Chinese patients with periodontitis: A 10-year retrospective cohort study. J. Clin. Periodontol. 2020, 47, 1121–1131. [Google Scholar] [CrossRef] [PubMed]
- Martinez-Canut, P.; Alcaraz, J.; Alvarez-Novoa, P.; Alvarez-Novoa, C.; Marcos, A.; Noguerol, B.; Noguerol, F.; Zabalegui, I. Introduction of a prediction model to assigning periodontal prognosis based on survival time. J. Clin. Periodontol. 2017, 45, 46–55. [Google Scholar] [CrossRef] [PubMed] [Green Version]
- Krois, J.; Graetz, C.; Holtfreter, B.; Brinkmann, P.; Kocher, T.; Schwendicke, F. Evaluating Modeling and Validation Strategies for Tooth Loss. J. Dent. Res. 2019, 98, 1088–1095. [Google Scholar] [CrossRef] [Green Version]
- Cui, Q.; Chen, Q.; Liu, P.; Liu, D.; Wen, Z. Clinical decision support model for tooth extraction therapy derived from electronic dental records. J. Prosthet. Dent. 2020, 126, 83–90. [Google Scholar] [CrossRef]
- Cooray, U.; Watt, R.G.; Tsakos, G.; Heilmann, A.; Hariyama, M.; Yamamoto, T.; Kuruppuarachchige, I.; Kondo, K.; Osaka, K.; Aida, J. Importance of socioeconomic factors in predicting tooth loss among older adults in Japan: Evidence from a machine learning analysis. Soc. Sci. Med. 2021, 291, 114486. [Google Scholar] [CrossRef]
- Elani, H.W.; Batista, A.F.M.; Thomson, W.M.; Kawachi, I.; Filho, A.D.P.C. Predictors of tooth loss: A machine learning approach. PLoS ONE 2021, 16, e0252873. [Google Scholar] [CrossRef]
- Lee, S.J.; Chung, D.; Asano, A.; Sasaki, D.; Maeno, M.; Ishida, Y.; Kobayashi, T.; Kuwajima, Y.; Da Silva, J.D.; Nagai, S. Diagnosis of Tooth Prognosis Using Artificial Intelligence. Diagnostics 2022, 12, 1422. [Google Scholar] [CrossRef] [PubMed]
- Collins, G.S.; Dhiman, P.; Navarro, C.L.A.; Ma, J.; Hooft, L.; Reitsma, J.B.; Logullo, P.; Beam, A.L.; Peng, L.; Van Calster, B.; et al. Protocol for development of a reporting guideline (TRIPOD-AI) and risk of bias tool (PROBAST-AI) for diagnostic and prognostic prediction model studies based on artificial intelligence. BMJ Open 2021, 11, e048008. [Google Scholar] [CrossRef] [PubMed]

| Patients | Predictors | Outcomes | Analysis | ||||||
|---|---|---|---|---|---|---|---|---|---|
| Authors (Year) | Country | Data Source | Training Data Set for Development (Training Set) | Test Data Set for Validation (Test Set) | Predictors/Variables | Level | Outcomes | Algorithms | Performance Metrics |
| Development and Validation studies | |||||||||
| Krois et al. (2019) [17] | Germany | Two cohorts of periodontal patients in two universities (Kiel & Greifswald) in Germany, 627 patients, 11,651 teeth | From data source, six specific cohorts were used for training in “Hold-out validation”. | From data source, six specific cohorts were assessed for validation in “Hold-out validation”. | 4 patient-level outcomes, 6 tooth-level | tooth | tooth loss during SPT | RFO, XGB, DTC, logR | AUC, sensitivity, specificity, the no-information rate |
| Cui et al. (2021) [18] | China | Cohorts of prosthodontic patients in Chinese University (Peking), 3559 patients, 26,005 teeth | From data source, randomly selected from data source (18182 teeth) in “Hold-out validation”. | From data source, randomly selected from data source (7823 teeth) in “Hold-out validation”. | 34 oral outcomes | tooth | tooth extraction/retention | DTC, AdaBoost, GBDT, LightGBM, XGB | AUC, sensitivity, specificity, accuracy, precision, F1 |
| Cooray et al. (2021) [19] | Japan | Japanese community cohort, 19,407 patients aged 65 and older | From data source,10-fold cross validation was used for model development. | From data source, 10-fold cross validation was used for model validation. | 14 oral and socioeconomic variables | patients | Tooth loss, Tooth loss number category | RFO, XGB | AUC, accuracy, precision, F1 |
| Elani et al. (2021) [20] | USA | National Health and Nutrition Examination Survey (NHANES) from 2011 to 2014 | NHANES 2011 to 2012 (n = 5,864) | NHANES 2013 to 2014 (n = 6,113) | (1) 28 items; socioeconomic characteristics, routine dental care, and chronic medical conditions, (2) the number of decayed teeth, periodontal disease, age, gender, race. | patients | edentulism, having fewer than 21 teeth, missing any tooth | logR, RFO, LightGBM, XGB, artificial neural networks. | AUC, accuracy, sensitivity, specificity, F1, positive predictive value, negative predictive value, the harmonic mean for sensitivity and specificity for each predictive model. |
| Development studies | |||||||||
| Lee et al. (2022) [21] | USA | Electric data at Harvard Medical School pf 94 patients with 2539 teeth | All of the data source | NA | 17 parameters including medical and dental conditions | tooth | tooth prognosis ranking 1 to 5 decided by 16 dentists (ModelA), and 13 prosthodontists (ModelB) | XGB, RFO, DTC | accuracy |
| Results | Conclusion | ||||
|---|---|---|---|---|---|
| Authors (Year) | Country | AUC | Accuracesy | Summary | |
| Development and Validation studies | |||||
| Krois et al. (2019) [17] | Germany | In Scenario1, RFO:0.84, XGB:0.84, DTC:0.76, logR:0.8 | In Scenario1, RFO:0.92, XGB:0.91, DTC:0.91, logR:0.92 | More complex models (RFO, XGB) had no consistent advantages over simpler ones (logR, DTC). | None of the developed models would be useful in a clinical setting, despite high accuracy. During modeling, rigorous development and external validation should be applied and reported accordingly. |
| Cui et al. (2021) [18] | China | In triple classification, DTC:0.931, AdaBoost:0.924, GBDT:0.966, LightGBM:0.975, XGBoost:0.969 | In triple classification, DTC:0.915, AdaBoost:0.895, GBDT:0.916, LightGBM:0.921, XGBoost:0.924 | The XGBoost outperformed the other 4 algorithms. | A clinical decision supportmodel for tooth extraction therapy achieved high performance in terms of decision-making derived from electronic dental records. |
| Cooray et al. (2021) [19] | Japan | In random oversampling analysis (with/without tooth loss = 1), RFO:0.827, XGB:0.905 | In random oversampling analysis (with/without tooth loss = 1), RFO:0.827, XGB:0.906 | XGB outperformed RF model, and predicted the tooth loss with a satisfactory level of accuracy. | In addition to oral health related and demographic factors, socioeconomic factors are important in predicting tooth loss. |
| Elani et al. (2021) [20] | USA | For edentulism; logR:0.865, RFO:0.885, LightGBM:0.884, XGB:0.887, artificial neural networks:0.877. For having fewer than 21 teeth, logR:0.872, RFO:0.876, LightGBM:0.877, XGB:0.883, artificial neural networks:0.881. For missing any teeth, logR:0.819, RFO,:0.827, LightGBM:0.819, XGB:0.832, artificial neural networks:0.831. | For edentulism; logR:0.837, RFO:0.843, LightGBM:0.827, XGB:0.838, artificial neural networks:0.822. For having fewer than 21 teeth, logR:0.819, RFO:0.817, LightGBM:0.825, XGB:0.815, artificial neural networks:0.826. For missing any teeth, logR:0.769, RFO:0.770, LightGBM:0.739, XGB:0.740, artificial neural networks:0.772. | XGB had the highest performance in predicting all outcomes. | Our findings support the application of machine-learning algorithms to predict tooth loss using socioeconomic and medical health characteristics. |
| Development studies | |||||
| Lee et al. (2022) [21] | USA | NA | For Model-A, XGB:0.689, RFO:0.8312, DTC:0.8413. For Model-B, XGB:0.6687, RFO:0.7421, DTC:0.7523. | DTC had the best accuracy among the three methods. Model-A indicated a higher accuracy than Model-B for al models. | AI-based machine-learning algorithm will be a helpful tool to determine tooth prognosis in consideration of the treatment plan. |
Publisher’s Note: MDPI stays neutral with regard to jurisdictional claims in published maps and institutional affiliations. |
© 2022 by the authors. Licensee MDPI, Basel, Switzerland. This article is an open access article distributed under the terms and conditions of the Creative Commons Attribution (CC BY) license (https://creativecommons.org/licenses/by/4.0/).
Share and Cite
Hasuike, A.; Watanabe, T.; Wakuda, S.; Kogure, K.; Yanagiya, R.; Byrd, K.M.; Sato, S. Machine Learning in Predicting Tooth Loss: A Systematic Review and Risk of Bias Assessment. J. Pers. Med. 2022, 12, 1682. https://doi.org/10.3390/jpm12101682
Hasuike A, Watanabe T, Wakuda S, Kogure K, Yanagiya R, Byrd KM, Sato S. Machine Learning in Predicting Tooth Loss: A Systematic Review and Risk of Bias Assessment. Journal of Personalized Medicine. 2022; 12(10):1682. https://doi.org/10.3390/jpm12101682
Chicago/Turabian StyleHasuike, Akira, Taito Watanabe, Shin Wakuda, Keisuke Kogure, Ryo Yanagiya, Kevin M. Byrd, and Shuichi Sato. 2022. "Machine Learning in Predicting Tooth Loss: A Systematic Review and Risk of Bias Assessment" Journal of Personalized Medicine 12, no. 10: 1682. https://doi.org/10.3390/jpm12101682
APA StyleHasuike, A., Watanabe, T., Wakuda, S., Kogure, K., Yanagiya, R., Byrd, K. M., & Sato, S. (2022). Machine Learning in Predicting Tooth Loss: A Systematic Review and Risk of Bias Assessment. Journal of Personalized Medicine, 12(10), 1682. https://doi.org/10.3390/jpm12101682