
Real-World Analysis of the Aging Effects on Visual Field Reliability Indices in Central 10-2 Tests


Abstract
1. Introduction
2. Materials and Methods
3. Results
4. Discussion
5. Conclusions
Author Contributions
Funding
Institutional Review Board Statement
Informed Consent Statement
Data Availability Statement
Conflicts of Interest
References
- Kang, J.M.; Tanna, A.P. Glaucoma. Med. Clin. North Am. 2021, 105, 493–510. [Google Scholar] [CrossRef] [PubMed]
- Caprioli, J. The importance of rates in glaucoma. Am. J. Ophthalmol. 2008, 145, 191–192. [Google Scholar] [CrossRef] [PubMed]
- Artes, P.H.; Iwase, A.; Ohno, Y.; Kitazawa, Y.; Chauhan, B.C. Properties of perimetric threshold estimates from Full Threshold, SITA Standard, and SITA Fast strategies. Investig. Ophthalmol. Vis. Sci. 2002, 43, 2654–2659. [Google Scholar]
- Russell, R.A.; Crabb, D.P.; Malik, R.; Garway-Heath, D.F. The relationship between variability and sensitivity in large-scale longitudinal visual field data. Investig. Ophthalmol. Vis. Sci. 2012, 53, 5985–5990. [Google Scholar] [CrossRef]
- Gardiner, S.K. Differences in the Relation Between Perimetric Sensitivity and Variability Between Locations Across the Visual Field. Investig. Ophthalmol. Vis. Sci. 2018, 59, 3667–3674. [Google Scholar] [CrossRef]
- Heijl, A.; Lindgren, A.; Lindgren, G. Test-retest variability in glaucomatous visual fields. Am. J. Ophthalmol. 1989, 108, 130–135. [Google Scholar] [CrossRef]
- Henson, D.B.; Chaudry, S.; Artes, P.H.; Faragher, E.B.; Ansons, A. Response variability in the visual field: Comparison of optic neuritis, glaucoma, ocular hypertension, and normal eyes. Investig. Ophthalmol. Vis. Sci. 2000, 41, 417–421. [Google Scholar]
- Spry, P.G.; Johnson, C.A. Identification of progressive glaucomatous visual field loss. Surv. Ophthalmol. 2002, 47, 158–173. [Google Scholar] [CrossRef]
- Demirel, S.; Vingrys, A.J. Eye Movements During Perimetry and the Effect that Fixational Instability Has on Perimetric Outcomes. J. Glaucoma. 1994, 3, 28–35. [Google Scholar] [CrossRef]
- Hirasawa, K.; Kobayashi, K.; Shibamoto, A.; Tobari, H.; Fukuda, Y.; Shoji, N. Variability in monocular and binocular fixation during standard automated perimetry. PLoS ONE. 2018, 13, e0207517. [Google Scholar] [CrossRef]
- Matsuura, M.; Hirasawa, K.; Murata, H.; Asaoka, R. The Relationship Between Visual Acuity and the Reproducibility of Visual Field Measurements in Glaucoma Patients. Investig. Ophthalmol. Vis. Sci. 2015, 56, 5630–5635. [Google Scholar] [CrossRef] [PubMed]
- Gracitelli, C.P.B.; Zangwill, L.M.; Diniz-Filho, A.; Abe, R.Y.; Girkin, C.A.; Weinreb, R.N.; Liebmann, J.M.; Medeiros, F.A. Detection of Glaucoma Progression in Individuals of African Descent Compared With Those of European Descent. JAMA Ophthalmol. 2018, 136, 329–335. [Google Scholar] [CrossRef] [PubMed]
- Diniz-Filho, A.; Delano-Wood, L.; Daga, F.B.; Cronemberger, S.; Medeiros, F.A. Association Between Neurocognitive Decline and Visual Field Variability in Glaucoma. JAMA Ophthalmol. 2017, 135, 734–739. [Google Scholar] [CrossRef] [PubMed]
- Jaffe, G.J.; Alvarado, J.A.; Juster, R.P. Age-related changes of the normal visual field. Arch. Ophthalmol. 1986, 104, 1021–1025. [Google Scholar] [CrossRef]
- Drance, S.M.; Berry, V.; Hughes, A. Studies on the effects of age on the central and peripheral isopters of the visual field in normal subjects. Am. J. Ophthalmol. 1967, 63, 1667–1672. [Google Scholar] [CrossRef]
- Newkirk, M.R.; Gardiner, S.K.; Demirel, S.; Johnson, C.A. Assessment of false positives with the Humphrey Field Analyzer II perimeter with the SITA Algorithm. Investig. Ophthalmol. Vis. Sci. 2006, 47, 4632–4637. [Google Scholar] [CrossRef]
- Junoy Montolio, F.G.; Wesselink, C.; Gordijn, M.; Jansonius, N.M. Factors that influence standard automated perimetry test results in glaucoma: Test reliability, technician experience, time of day, and season. Investig. Ophthalmol. Vis. Sci. 2012, 53, 7010–7017. [Google Scholar] [CrossRef]
- Bengtsson, B. Reliability of computerized perimetric threshold tests as assessed by reliability indices and threshold reproducibility in patients with suspect and manifest glaucoma. Acta Ophthalmol. Scand. 2000, 78, 519–522. [Google Scholar] [CrossRef]
- Bengtsson, B.; Heijl, A. False-negative responses in glaucoma perimetry: Indicators of patient performance or test reliability? Investig. Ophthalmol. Vis. Sci. 2000, 41, 2201–2204. [Google Scholar] [CrossRef]
- Shirakami, T.; Omura, T.; Fukuda, H.; Asaoka, R.; Tanito, M. Real-World Analysis of the Aging Effects on Visual Field Reliability Indices in Humans. J Clin Med. 2021, 10, 5775. [Google Scholar] [CrossRef]
- Asaoka, R.; Fujino, Y.; Aoki, S.; Matsuura, M.; Murata, H. Estimating the Reliability of Glaucomatous Visual Field for the Accurate Assessment of Progression Using the Gaze-Tracking and Reliability Indices. Ophthalmol. Glaucoma. 2019, 2, 111–119. [Google Scholar] [CrossRef] [PubMed]
- Heijl, A.; Patella, V.M.; Chong, L.X.; Iwase, A.; Leung, C.K.; Tuulonen, A.; Lee, G.C.; Callan, T.; Bengtsson, B. A New SITA Perimetric Threshold Testing Algorithm: Construction and a Multicenter Clinical Study. Am. J. Ophthalmol. 2019, 198, 154–165. [Google Scholar] [CrossRef] [PubMed]
- Heijl, A.; Lindgren, G.; Olsson, J. Normal variability of static perimetric threshold values across the central visual field. Arch. Ophthalmol. 1987, 105, 1544–1549. [Google Scholar] [CrossRef] [PubMed]
- Curcio, C.A.; Millican, C.L.; Allen, K.A.; Kalina, R.E. Aging of the human photoreceptor mosaic: Evidence for selective vulnerability of rods in central retina. Investig. Ophthalmol. Vis. Sci. 1993, 34, 3278–3296. [Google Scholar]
- Gao, H.; Hollyfield, J.G. Aging of the human retina. Differential loss of neurons and retinal pigment epithelial cells. Investig. Ophthalmol. Vis. Sci. 1992, 33, 1–17. [Google Scholar]
- Nag, T.C.; Gorla, S.; Kumari, C.; Roy, T.S. Aging of the human choriocapillaris: Evidence that early pericyte damage can trigger endothelial changes. Exp. Eye Res. 2021, 212, 108771. [Google Scholar] [CrossRef]
- Jackson, G.R.; Owsley, C.; Cordle, E.P.; Finley, C.D. Aging and scotopic sensitivity. Vis. Res. 1998, 38, 3655–3662. [Google Scholar] [CrossRef]
- Adams, C.W.; Bullimore, M.A.; Wall, M.; Fingeret, M.; Johnson, C.A. Normal aging effects for frequency doubling technology perimetry. Optom. Vis. Sci. 1999, 76, 582–587. [Google Scholar] [CrossRef]
- Beck, R.W.; Bergstrom, T.J.; Lichter, P.R. A clinical comparison of visual field testing with a new automated perimeter, the Humphrey Field Analyzer, and the Goldmann perimeter. Ophthalmology 1985, 92, 77–82. [Google Scholar] [CrossRef]
- Hudson, C.; Wild, J.M.; O’Neill, E.C. Fatigue effects during a single session of automated static threshold perimetry. Investig. Ophthalmol. Vis. Sci. 1994, 35, 268–280. [Google Scholar]
- Searle, A.E.; Wild, J.M.; Shaw, D.E.; O’Neill, E.C. Time-related variation in normal automated static perimetry. Ophthalmology 1991, 98, 701–707. [Google Scholar] [CrossRef]
- Kelly, S.R.; Bryan, S.R.; Crabb, D.P. Does eye examination order for standard automated perimetry matter? Acta Ophthalmol. 2019, 97, e833–e838. [Google Scholar] [CrossRef] [PubMed]


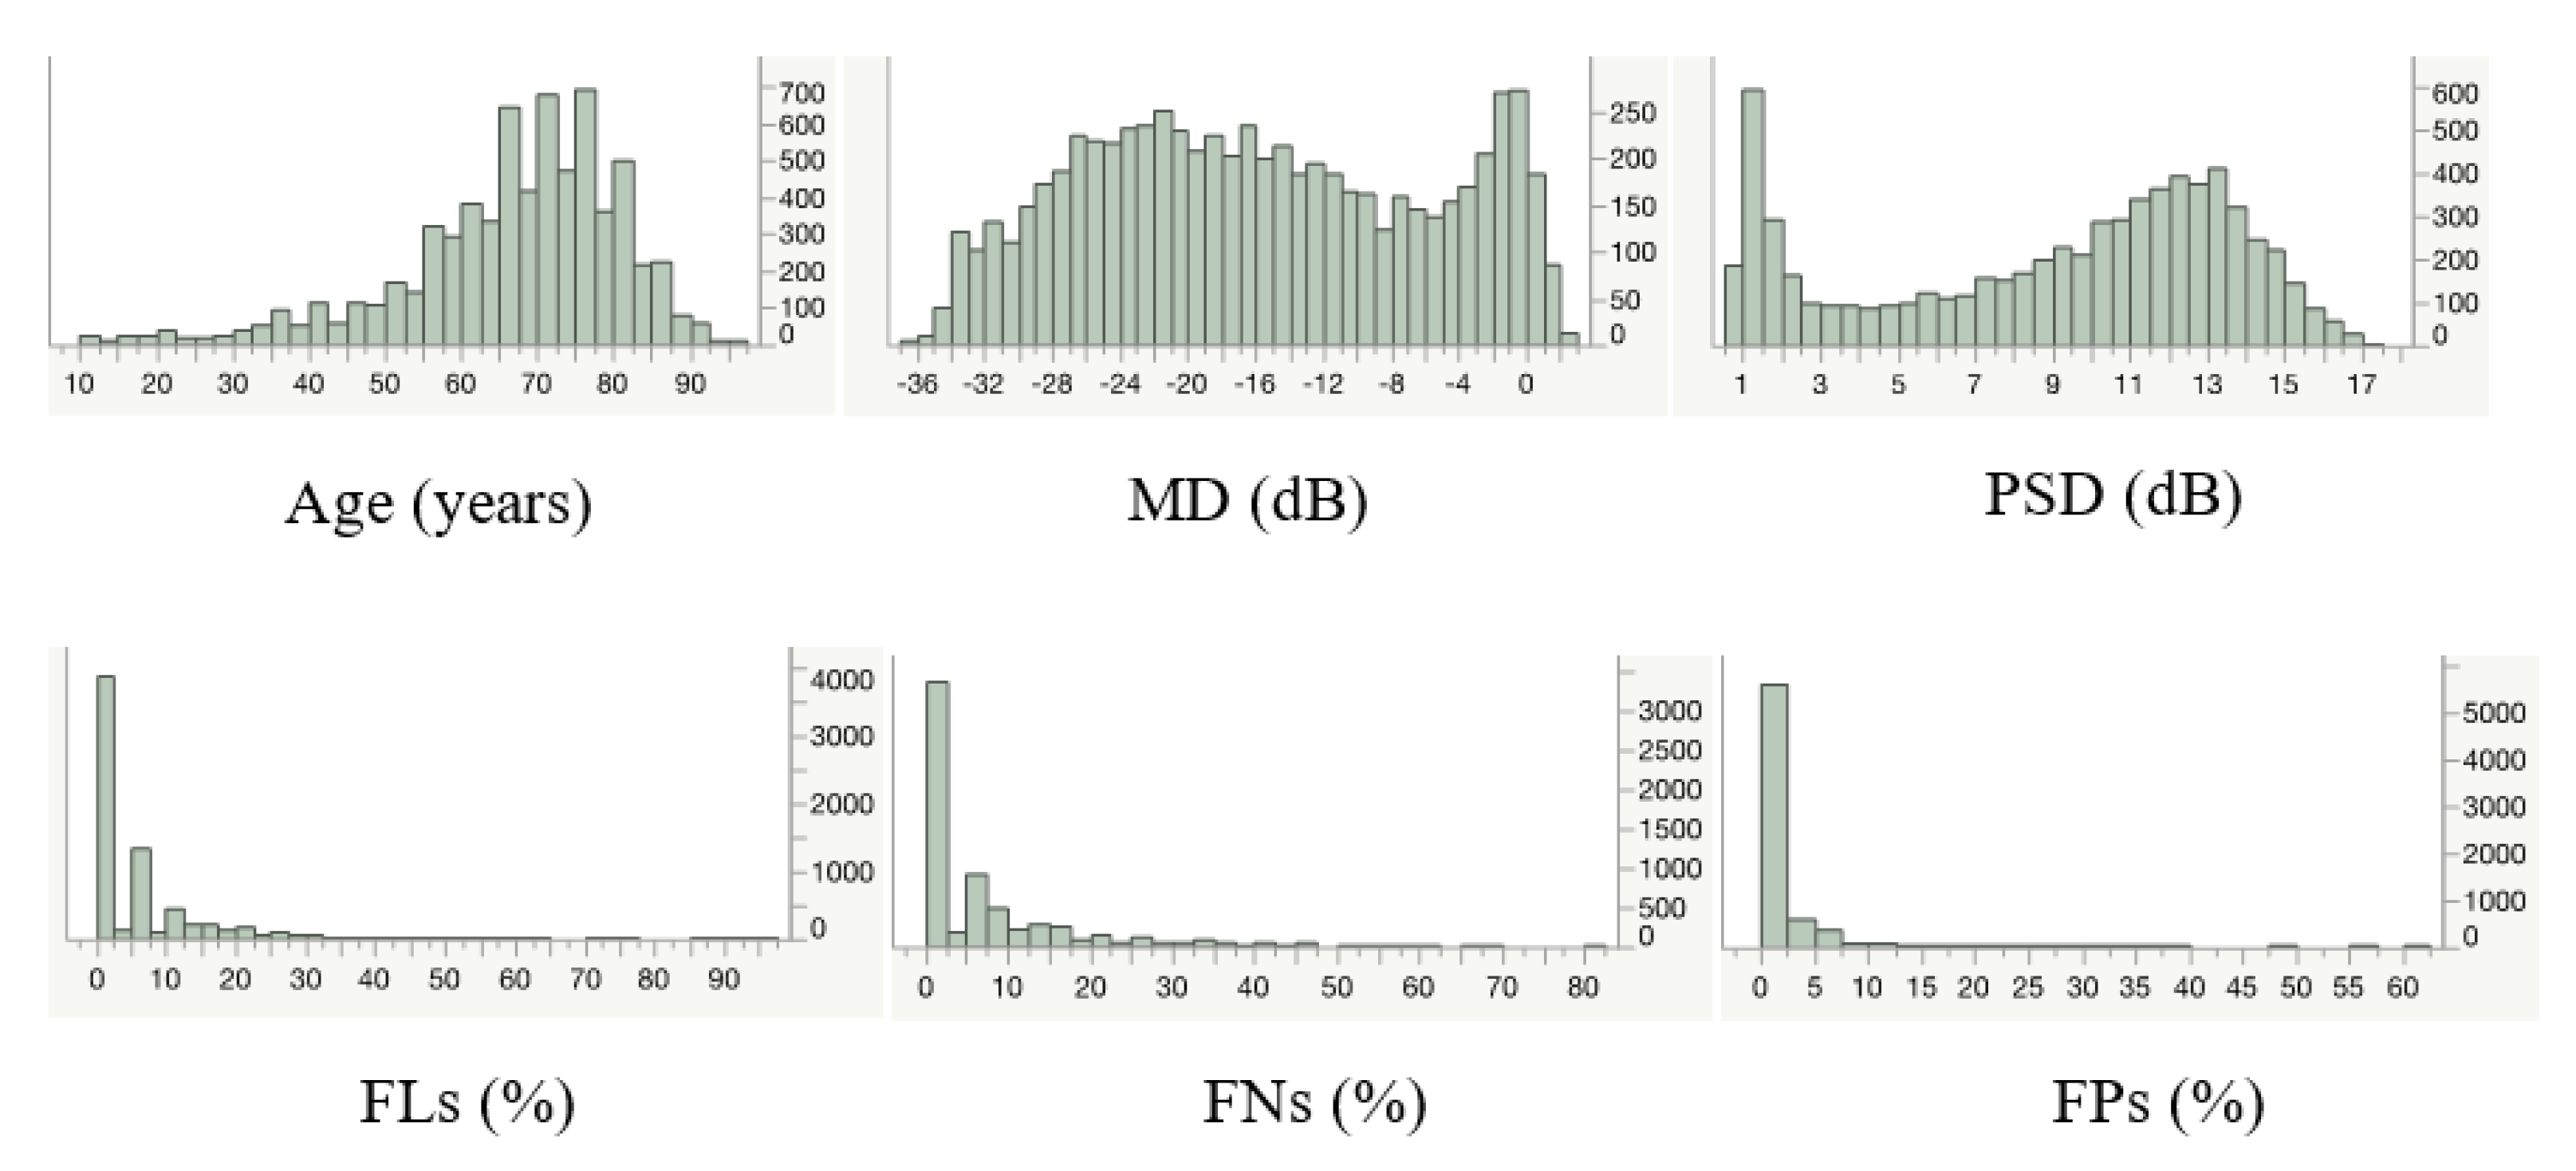
| Parameter | Mean ± SD | Range |
|---|---|---|
| Age (years) | 66.6 ± 14.2 | 10.0–95.0 |
| MD (dB) | −15.9 ± 10.0 | −36.3–2.8 |
| PSD (dB) | 9.0 ± 4.6 | 0.8–17.4 |
| FL (%) | 5.0 ± 8.8 | 0.0–95.2 |
| FN (%) | 5.9 ± 9.0 | 0.0–81.0 |
| FP (%) | 1.4 ± 3.1 | 0.0–62.0 |
| ρ * p * | Age (Years) | MD (dB) | PSD (dB) | FL (%) | FN (%) | FP (%) |
|---|---|---|---|---|---|---|
| Age (years) | −0.18 | 0.07 | −0.01 | 0.21 | −0.02 | |
| MD (dB) | <0.0001 * | −0.32 | 0.09 | −0.26 | 0.12 | |
| PSD (dB) | <0.0001 * | <0.0001 * | −0.08 | 0.09 | −0.02 | |
| FL (%) | 0.6158 | <0.0001 * | <0.0001 * | 0.10 | 0.30 | |
| FN (%) | <0.0001 * | <0.0001 * | <0.0001 * | <0.0001 * | 0.10 | |
| FP (%) | 0.1065 | <0.0001 * | 0.1803 | <0.0001 * | <0.0001 * |
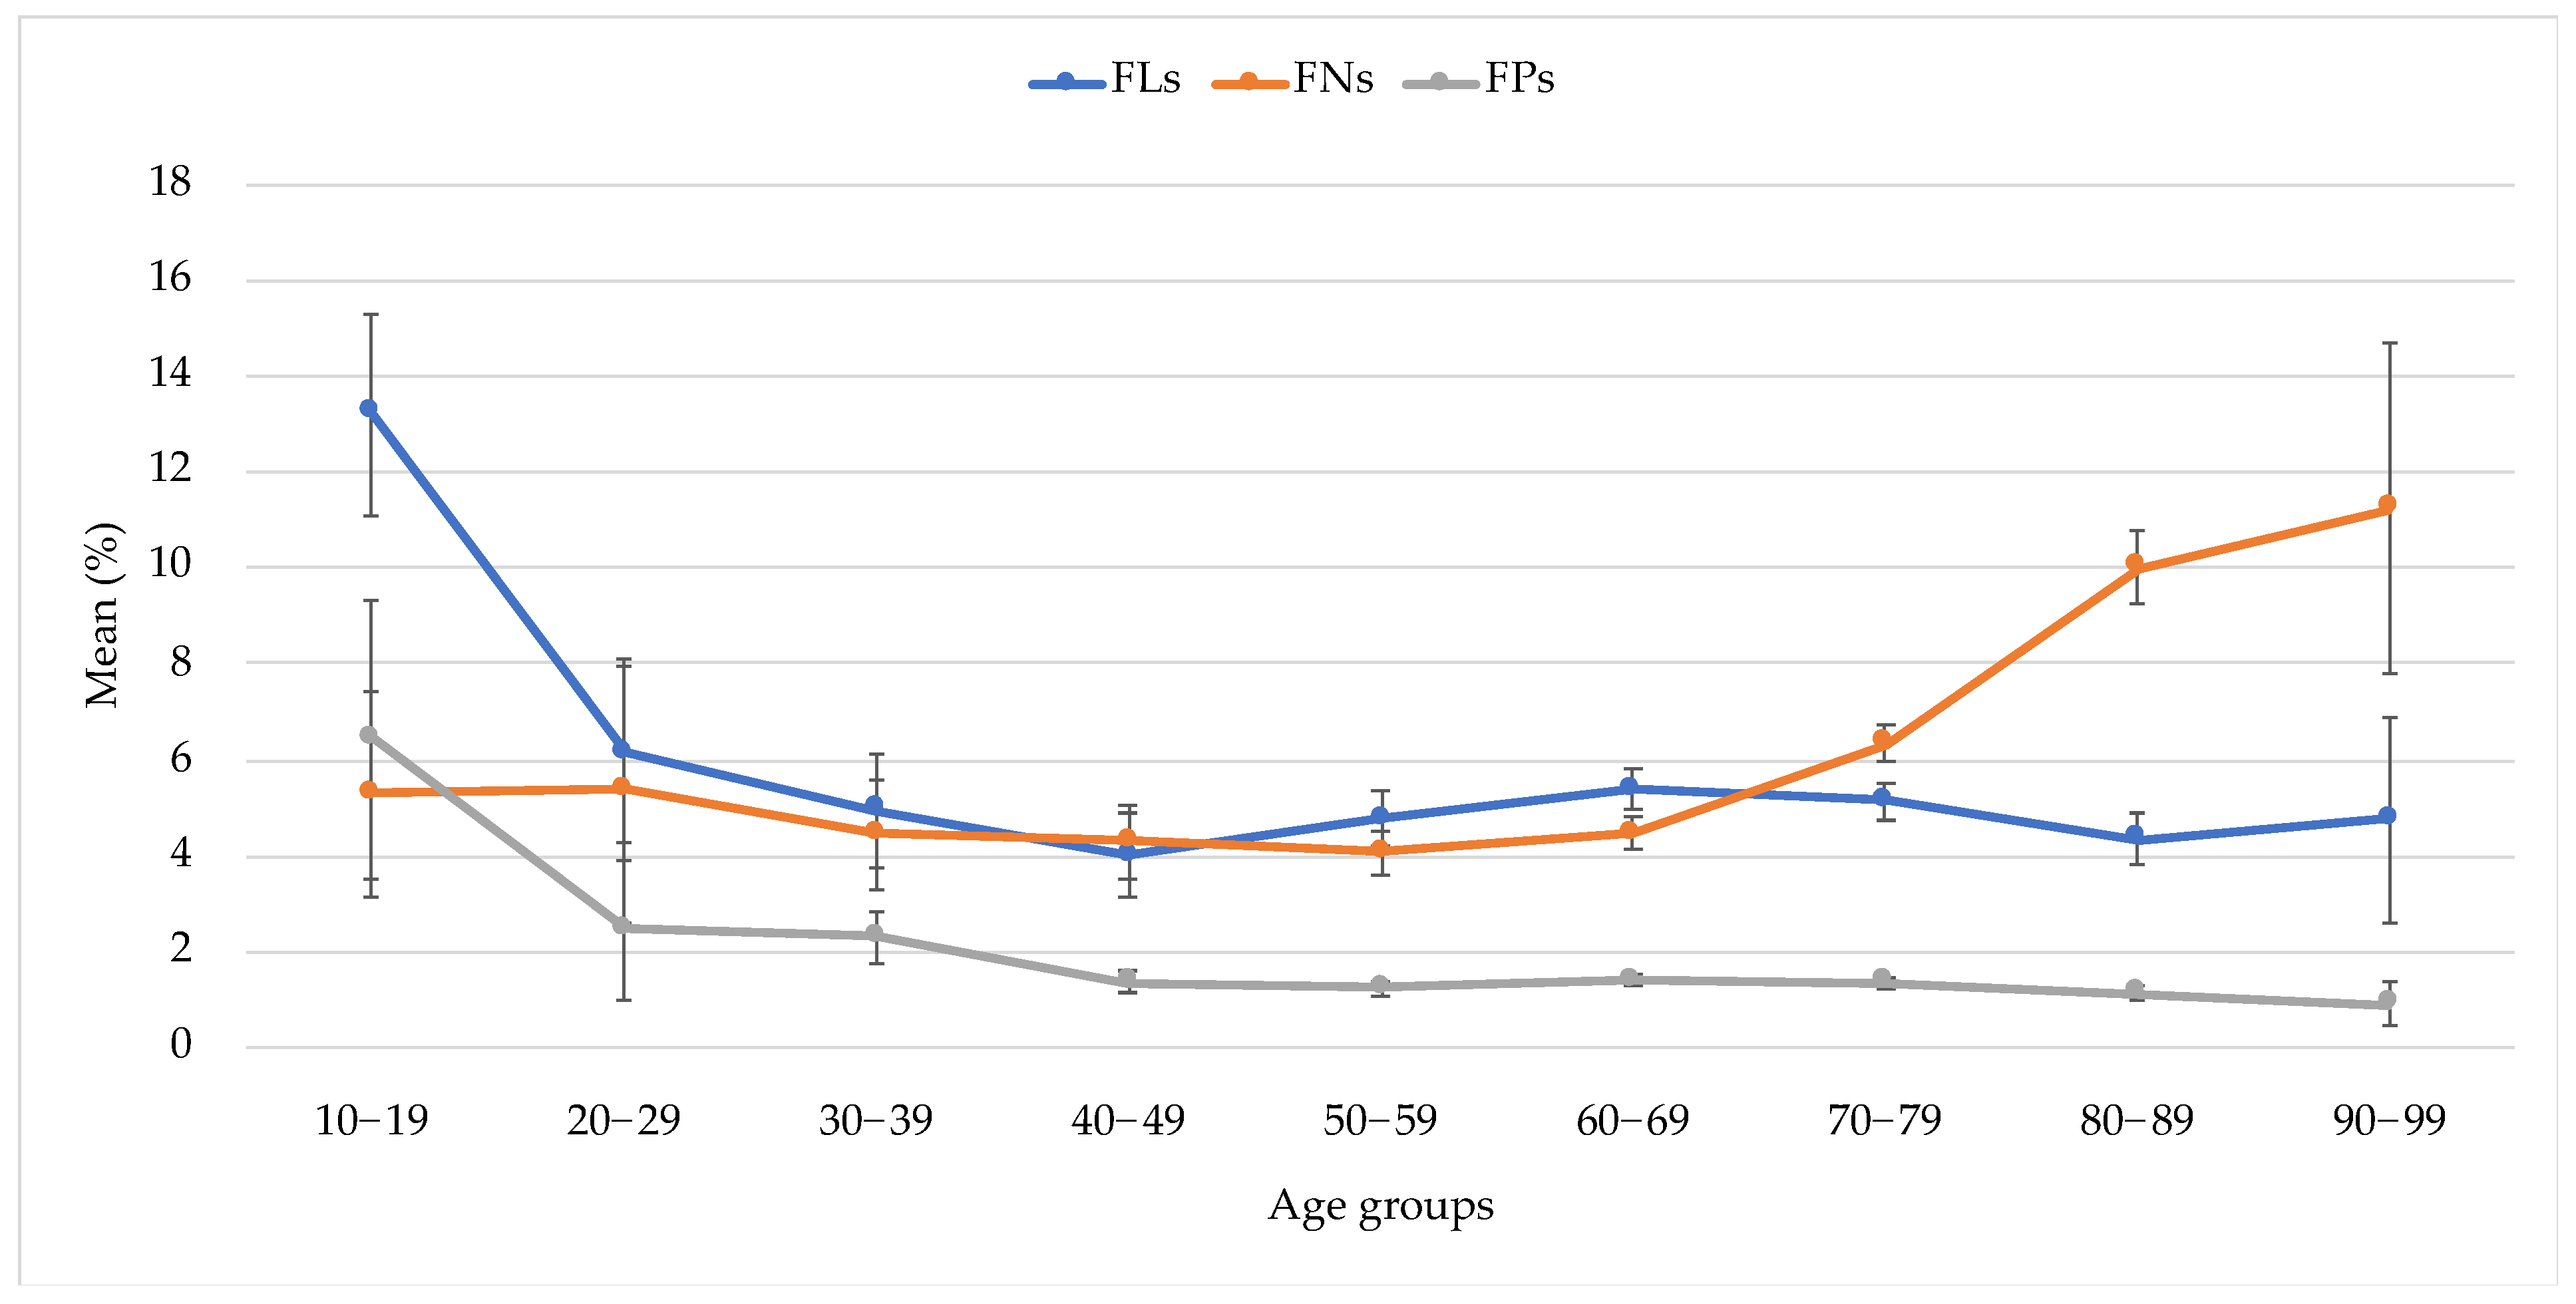
| Age Group (Years) | n | Mean (%) | SD | Lower 95%CI | Upper 95%CI | p-Value | |||||||
|---|---|---|---|---|---|---|---|---|---|---|---|---|---|
| vs. 20–29 | vs. 30–39 | vs. 40–49 | vs. 50–59 | vs. 60–69 | vs. 70–79 | vs. 80–89 | vs. 90–99 | ||||||
| 10–19 | 67 | 13.21 | 1.08 | 11.10 | 15.32 | <0.0001 * | <0.0001 * | <0.0001 * | <0.0001 * | <0.0001 * | <0.0001 * | <0.0001 * | <0.0001 * |
| 20–29 | 88 | 6.14 | 0.94 | 4.30 | 7.98 | - | 0.9782 | 0.4866 | 0.8989 | 0.9968 | 0.9813 | 0.6565 | 0.9886 |
| 30–39 | 217 | 4.95 | 0.60 | 3.78 | 6.12 | - | - | 0.9315 | 1.0000 | 0.9992 | 1.0000 | 0.9919 | 1.0000 |
| 40–49 | 383 | 3.98 | 0.45 | 3.09 | 4.86 | - | - | - | 0.8678 | 0.1131 | 0.2906 | 0.9989 | 0.9992 |
| 50–59 | 904 | 4.77 | 0.29 | 4.19 | 5.34 | - | - | - | - | 0.7632 | 0.9781 | 0.9807 | 1.0000 |
| 60–69 | 1766 | 5.37 | 0.21 | 4.96 | 5.78 | - | - | - | - | - | 0.9965 | 0.0782 | 0.9998 |
| 70–79 | 2185 | 5.14 | 0.19 | 4.77 | 5.51 | - | - | - | - | - | - | 0.2985 | 1.0000 |
| 80–89 | 998 | 4.34 | 0.28 | 3.80 | 4.89 | - | - | - | - | - | - | - | 1.0000 |
| 90–99 | 66 | 4.75 | 1.08 | 2.63 | 6.88 | - | - | - | - | - | - | - | - |
| Age Group (Years) | n | Mean (%) | SD | Lower 95%CI | Upper 95%CI | p-Value | |||||||
|---|---|---|---|---|---|---|---|---|---|---|---|---|---|
| vs. 20–29 | vs. 30–39 | vs. 40–49 | vs. 50–59 | vs. 60–69 | vs. 70–79 | vs. 80–89 | vs. 90–99 | ||||||
| 10–19 | 63 | 5.30 | 8.54 | 3.15 | 7.45 | 1.0000 | 0.9990 | 0.9954 | 0.9763 | 0.9980 | 0.9918 | 0.0014 * | 0.0066 * |
| 20–29 | 86 | 5.74 | 12.45 | 3.07 | 8.41 | - | 0.9974 | 0.9889 | 0.9488 | 0.9942 | 0.9895 | 0.0004 * | 0.0040 * |
| 30–39 | 213 | 4.30 | 7.99 | 3.22 | 5.38 | - | - | 1.0000 | 0.9998 | 1.0000 | 0.0770 | <0.0001 * | <0.0001 * |
| 40–49 | 385 | 4.97 | 9.49 | 4.02 | 5.92 | - | - | - | 1.0000 | 1.0000 | 0.0013 * | <0.0001 * | <0.0001 * |
| 50–59 | 820 | 4.12 | 7.15 | 3.63 | 4.61 | - | - | - | - | 0.9796 | <0.0001 * | <0.0001 * | <0.0001 * |
| 60–69 | 1695 | 4.53 | 7.85 | 4.16 | 4.90 | - | - | - | - | - | <0.0001 * | <0.0001 * | <0.0001 * |
| 70–79 | 2051 | 6.58 | 9.88 | 6.15 | 7.01 | - | - | - | - | - | - | <0.0001 * | 0.0010 * |
| 80–89 | 900 | 10.00 | 11.47 | 9.25 | 10.75 | - | - | - | - | - | - | - | 0.9815 |
| 90–99 | 58 | 11.24 | 13.23 | 7.76 | 14.72 | - | - | - | - | - | - | - | - |
| Age Group (Years) | n | Mean (%) | SD | Lower 95%CI | Upper 95%CI | p-Value | |||||||
|---|---|---|---|---|---|---|---|---|---|---|---|---|---|
| vs. 20–29 | vs. 30–39 | vs. 40–49 | vs. 50–59 | vs. 60–69 | vs. 70–79 | vs. 80–89 | vs. 90–99 | ||||||
| 10–19 | 67 | 6.45 | 11.97 | 3.53 | 9.37 | <0.0001 * | <0.0001 * | <0.0001 * | <0.0001 * | <0.0001 * | <0.0001 * | <0.0001 * | <0.0001 * |
| 20–29 | 98 | 2.57 | 7.08 | 1.15 | 3.99 | - | 1.0000 | 0.0548 | 0.0090 * | 0.0385 * | 0.0220 * | 0.0026 * | 0.0465 * |
| 30–39 | 225 | 2.24 | 3.97 | 1.71 | 2.76 | - | - | 0.0057 * | <0.0001 * | 0.0008 * | 0.0002 * | <0.0001 * | 0.0269 * |
| 40–49 | 399 | 1.59 | 4.11 | 1.19 | 1.99 | - | - | - | 0.9990 | 1.0000 | 1.0000 | 0.9449 | 0.9749 |
| 50–59 | 912 | 1.22 | 2.59 | 1.06 | 1.39 | - | - | - | - | 0.9072 | 0.9876 | 0.9983 | 0.9963 |
| 60–69 | 1805 | 1.40 | 3.03 | 1.26 | 1.54 | - | - | - | - | - | 0.9998 | 0.3584 | 0.9363 |
| 70–79 | 2217 | 1.33 | 2.62 | 1.22 | 1.44 | - | - | - | - | - | - | 0.6134 | 0.9666 |
| 80–89 | 1003 | 1.15 | 2.42 | 1.00 | 1.30 | - | - | - | - | - | - | - | 0.9998 |
| 90–99 | 66 | 0.91 | 1.97 | 0.43 | 1.39 | - | - | - | - | - | - | - | - |
| Parameters | FLs (%) | FNs (%) | FPs (%) | ||||||
|---|---|---|---|---|---|---|---|---|---|
| R | 95% CI | p-Value | R | 95% CI | p-Value | R | 95% CI | p-Value | |
| Age (/years) | 0.00 | −0.03–0.04 | 0.9014 | 0.13 | 0.09–0.16 | <0.0001 ** | 0.00 | −0.01–0.01 | 0.9267 |
| MD (/dB) | −0.03 | −0.06–0.00 | 0.0503 | −0.32 | −0.36–−0.28 | <0.0001 ** | 0.03 | 0.02–0.04 | <0.0001 ** |
| PSD (/dB) | −0.18 | −0.24–−0.12 | <0.0001 ** | −0.14 | −0.21–−0.06 | 0.0004 ** | 0.02 | 0.00–0.03 | 0.0401 * |
| Parameters | Mean ± SD (95% CI Range) | p-Value | |
|---|---|---|---|
| 10-2 (n = 6302) | 30-2 (n = 32503) | ||
| Age (years) | 68.8 ± 10.9 (68.5–69.1) | 68.4 ± 11.2 (68.3–68.6) | 0.0234 * |
| MD (dB) | −16.1 ± 9.8 (−16.4–−15.9) | −7.3 ± 8.3 (−7.3–−7.2) | <0.0001 ** |
| PSD (dB) | 9.1 ± 4.6 (9.0–9.2) | 6.6 ± 4.7 (6.6–6.7) | <0.0001 ** |
| FL (%) | 5.0 ± 8.6 (4.7–5.2) | 8.1 ± 10.8 (8.0–8.2) | <0.0001 ** |
| FN (%) | 6.0 ± 9.0 (5.7–6.2) | 4.9 ± 7.1 (4.8–5.0) | 0.9364 |
| FP (%) | 1.3 ± 2.7 (1.2–1.4) | 2.4 ± 4.0 (2.4–2.5) | <0.0001 ** |
Publisher’s Note: MDPI stays neutral with regard to jurisdictional claims in published maps and institutional affiliations. |
© 2022 by the authors. Licensee MDPI, Basel, Switzerland. This article is an open access article distributed under the terms and conditions of the Creative Commons Attribution (CC BY) license (https://creativecommons.org/licenses/by/4.0/).
Share and Cite
Shirakami, T.; Omura, T.; Fukuda, H.; Asaoka, R.; Tanito, M. Real-World Analysis of the Aging Effects on Visual Field Reliability Indices in Central 10-2 Tests. J. Pers. Med. 2022, 12, 1600. https://doi.org/10.3390/jpm12101600
Shirakami T, Omura T, Fukuda H, Asaoka R, Tanito M. Real-World Analysis of the Aging Effects on Visual Field Reliability Indices in Central 10-2 Tests. Journal of Personalized Medicine. 2022; 12(10):1600. https://doi.org/10.3390/jpm12101600
Chicago/Turabian StyleShirakami, Tomoki, Tetsuro Omura, Hiroki Fukuda, Ryo Asaoka, and Masaki Tanito. 2022. "Real-World Analysis of the Aging Effects on Visual Field Reliability Indices in Central 10-2 Tests" Journal of Personalized Medicine 12, no. 10: 1600. https://doi.org/10.3390/jpm12101600
APA StyleShirakami, T., Omura, T., Fukuda, H., Asaoka, R., & Tanito, M. (2022). Real-World Analysis of the Aging Effects on Visual Field Reliability Indices in Central 10-2 Tests. Journal of Personalized Medicine, 12(10), 1600. https://doi.org/10.3390/jpm12101600