
Predicting Venous Thrombosis in Osteoarthritis Using a Machine Learning Algorithm: A Population-Based Cohort Study

Abstract
:
1. Introduction
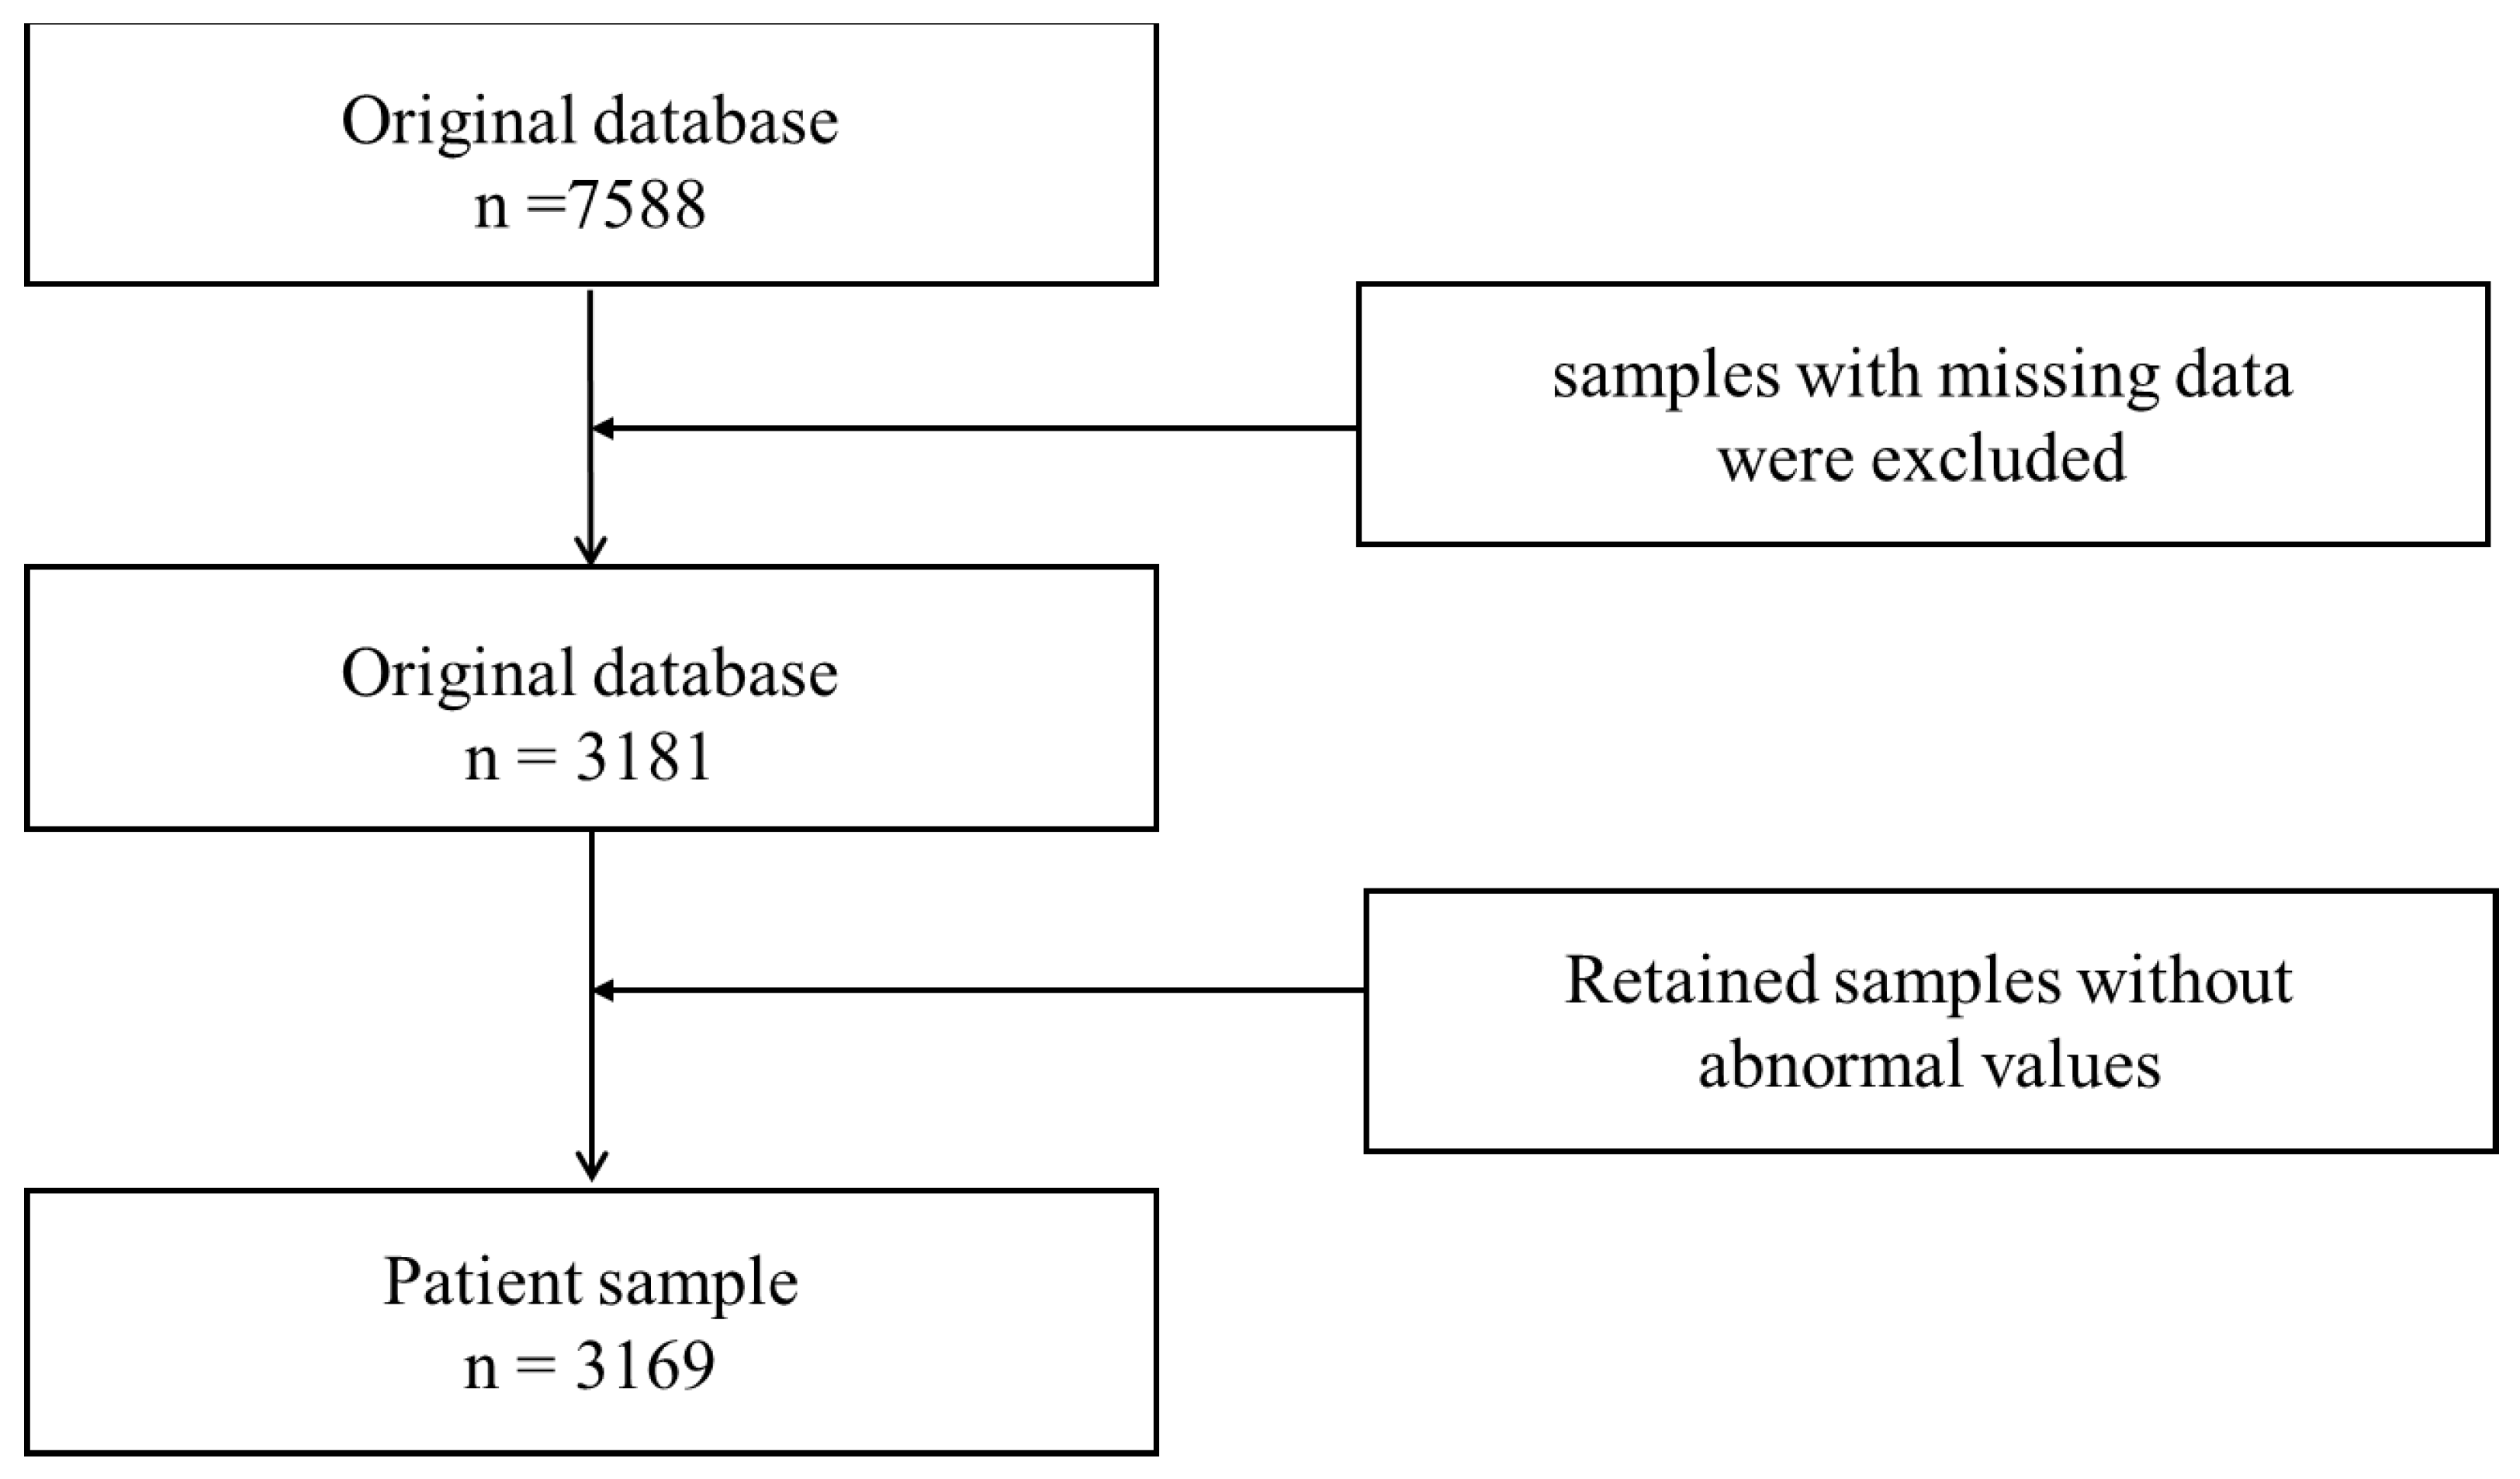
2. Materials and Methods
2.1. Machine Learning Algorithms
2.2. Statistical Analysis
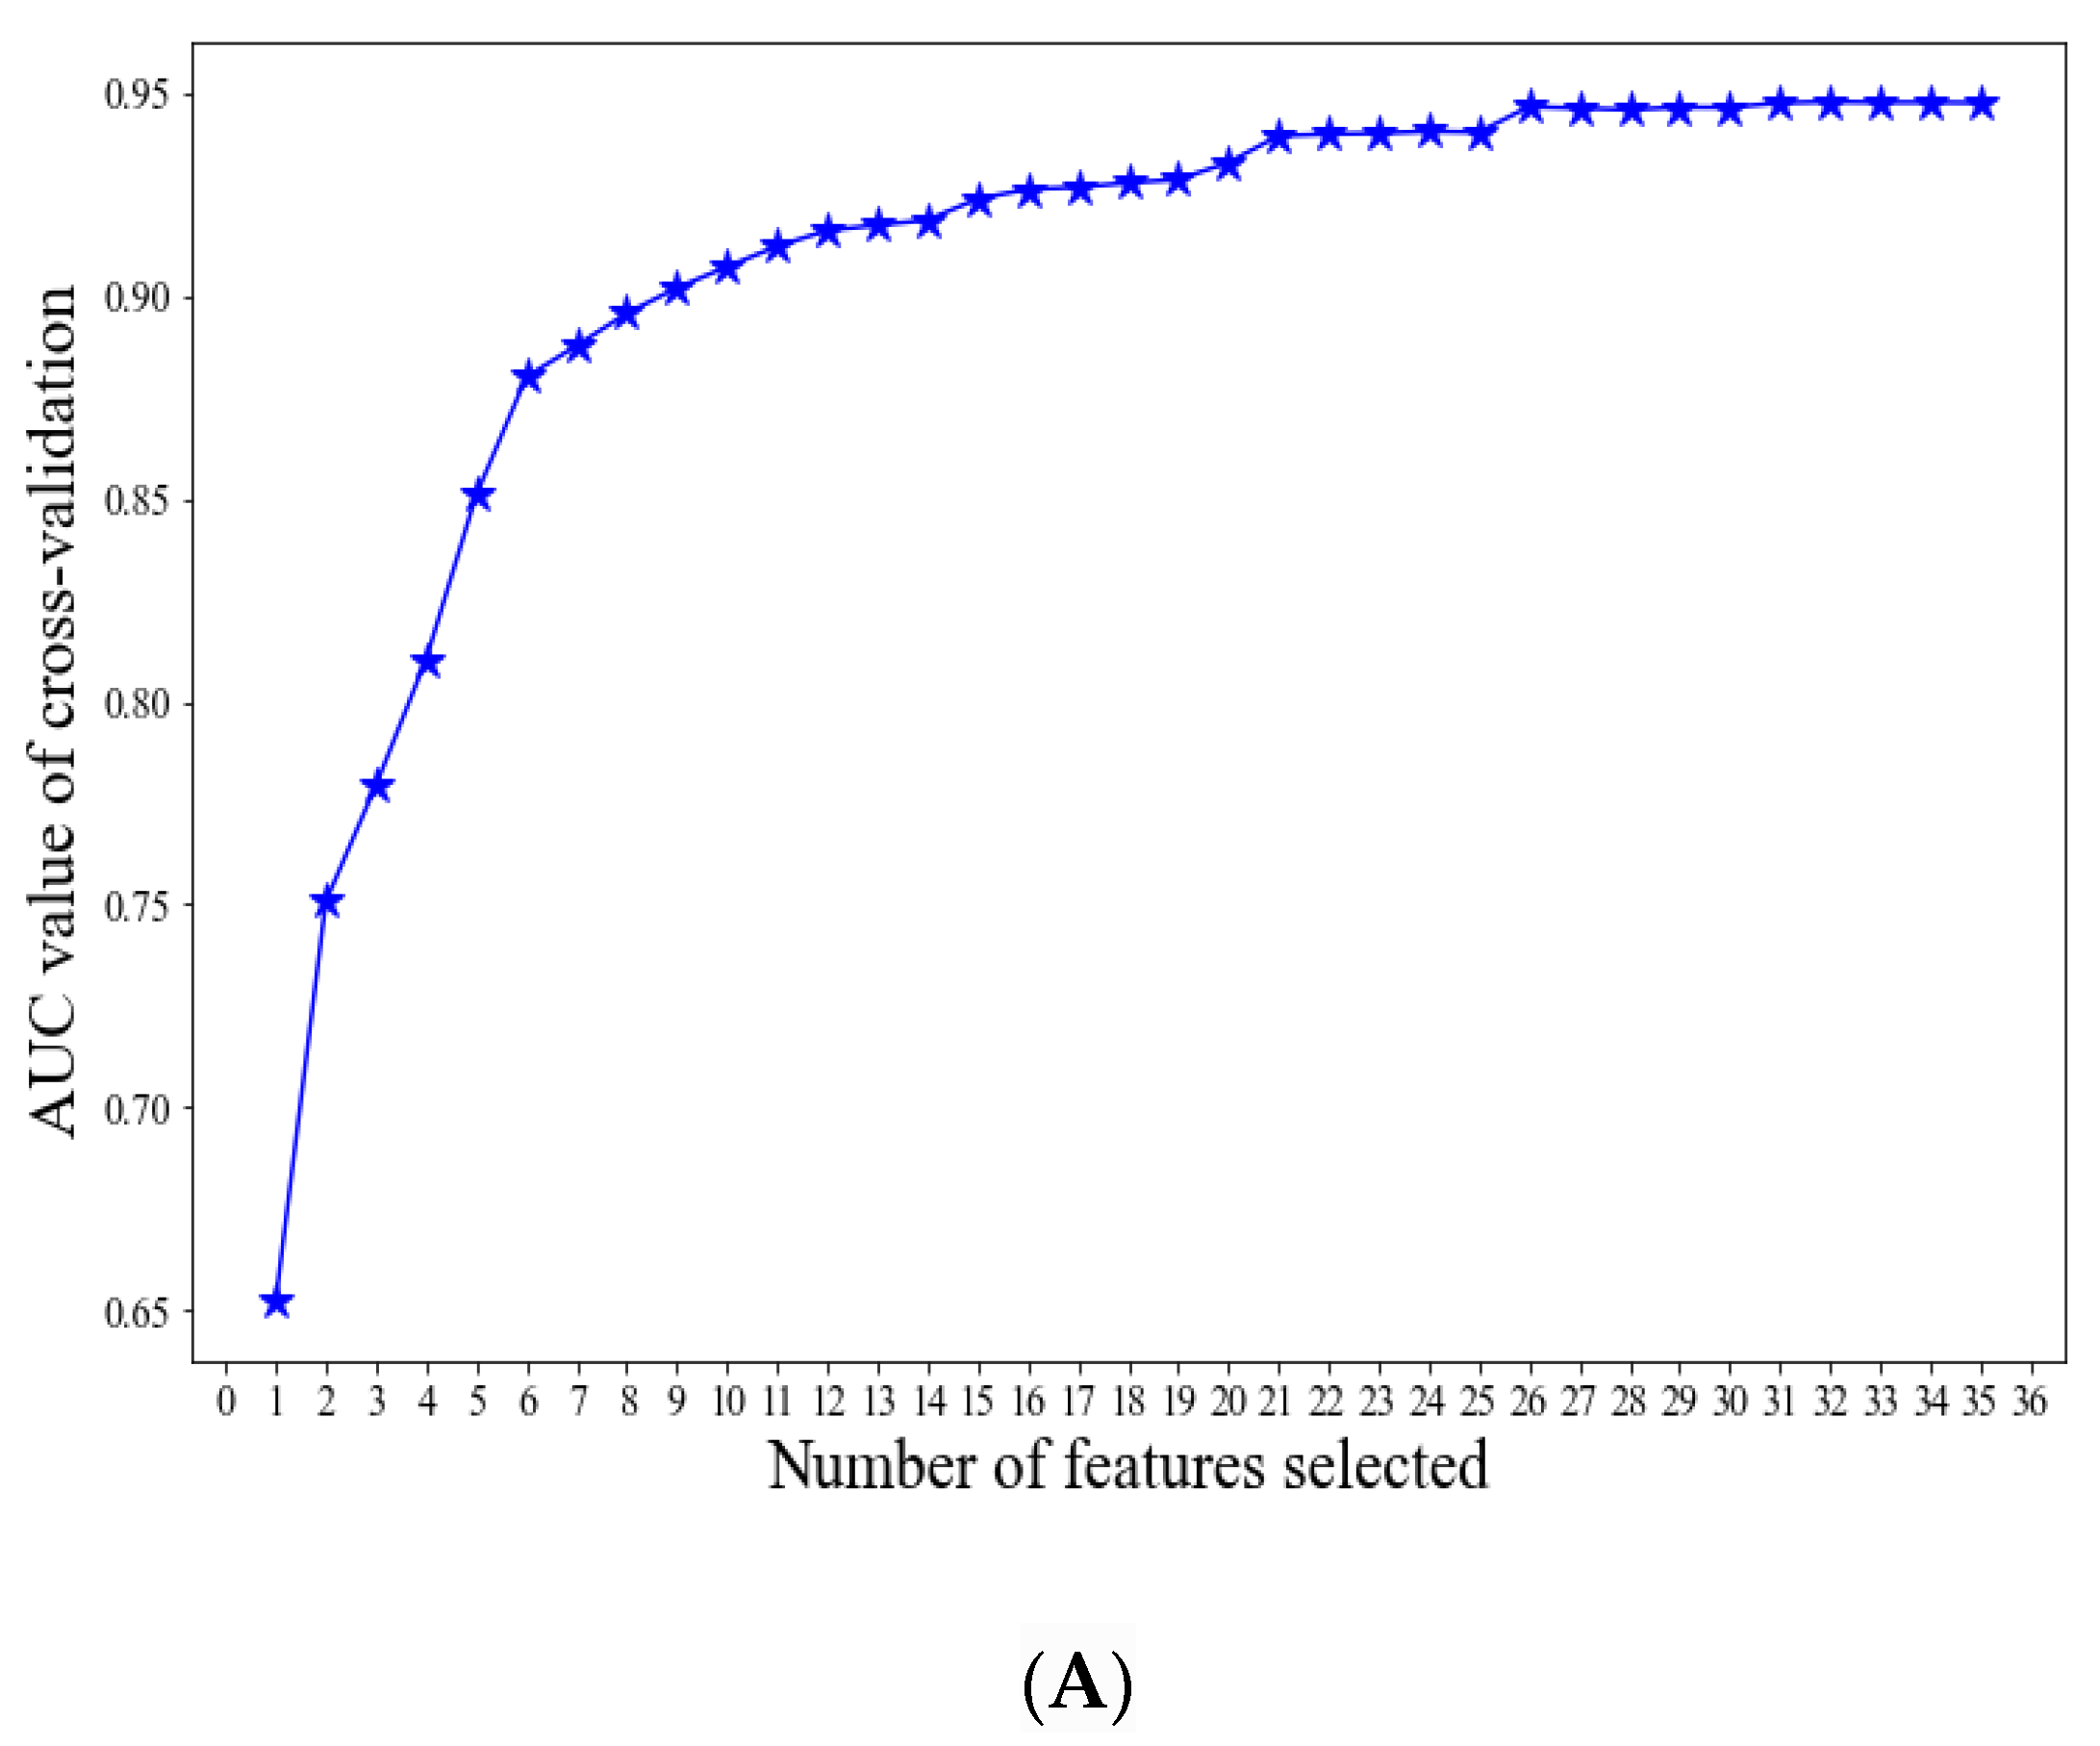
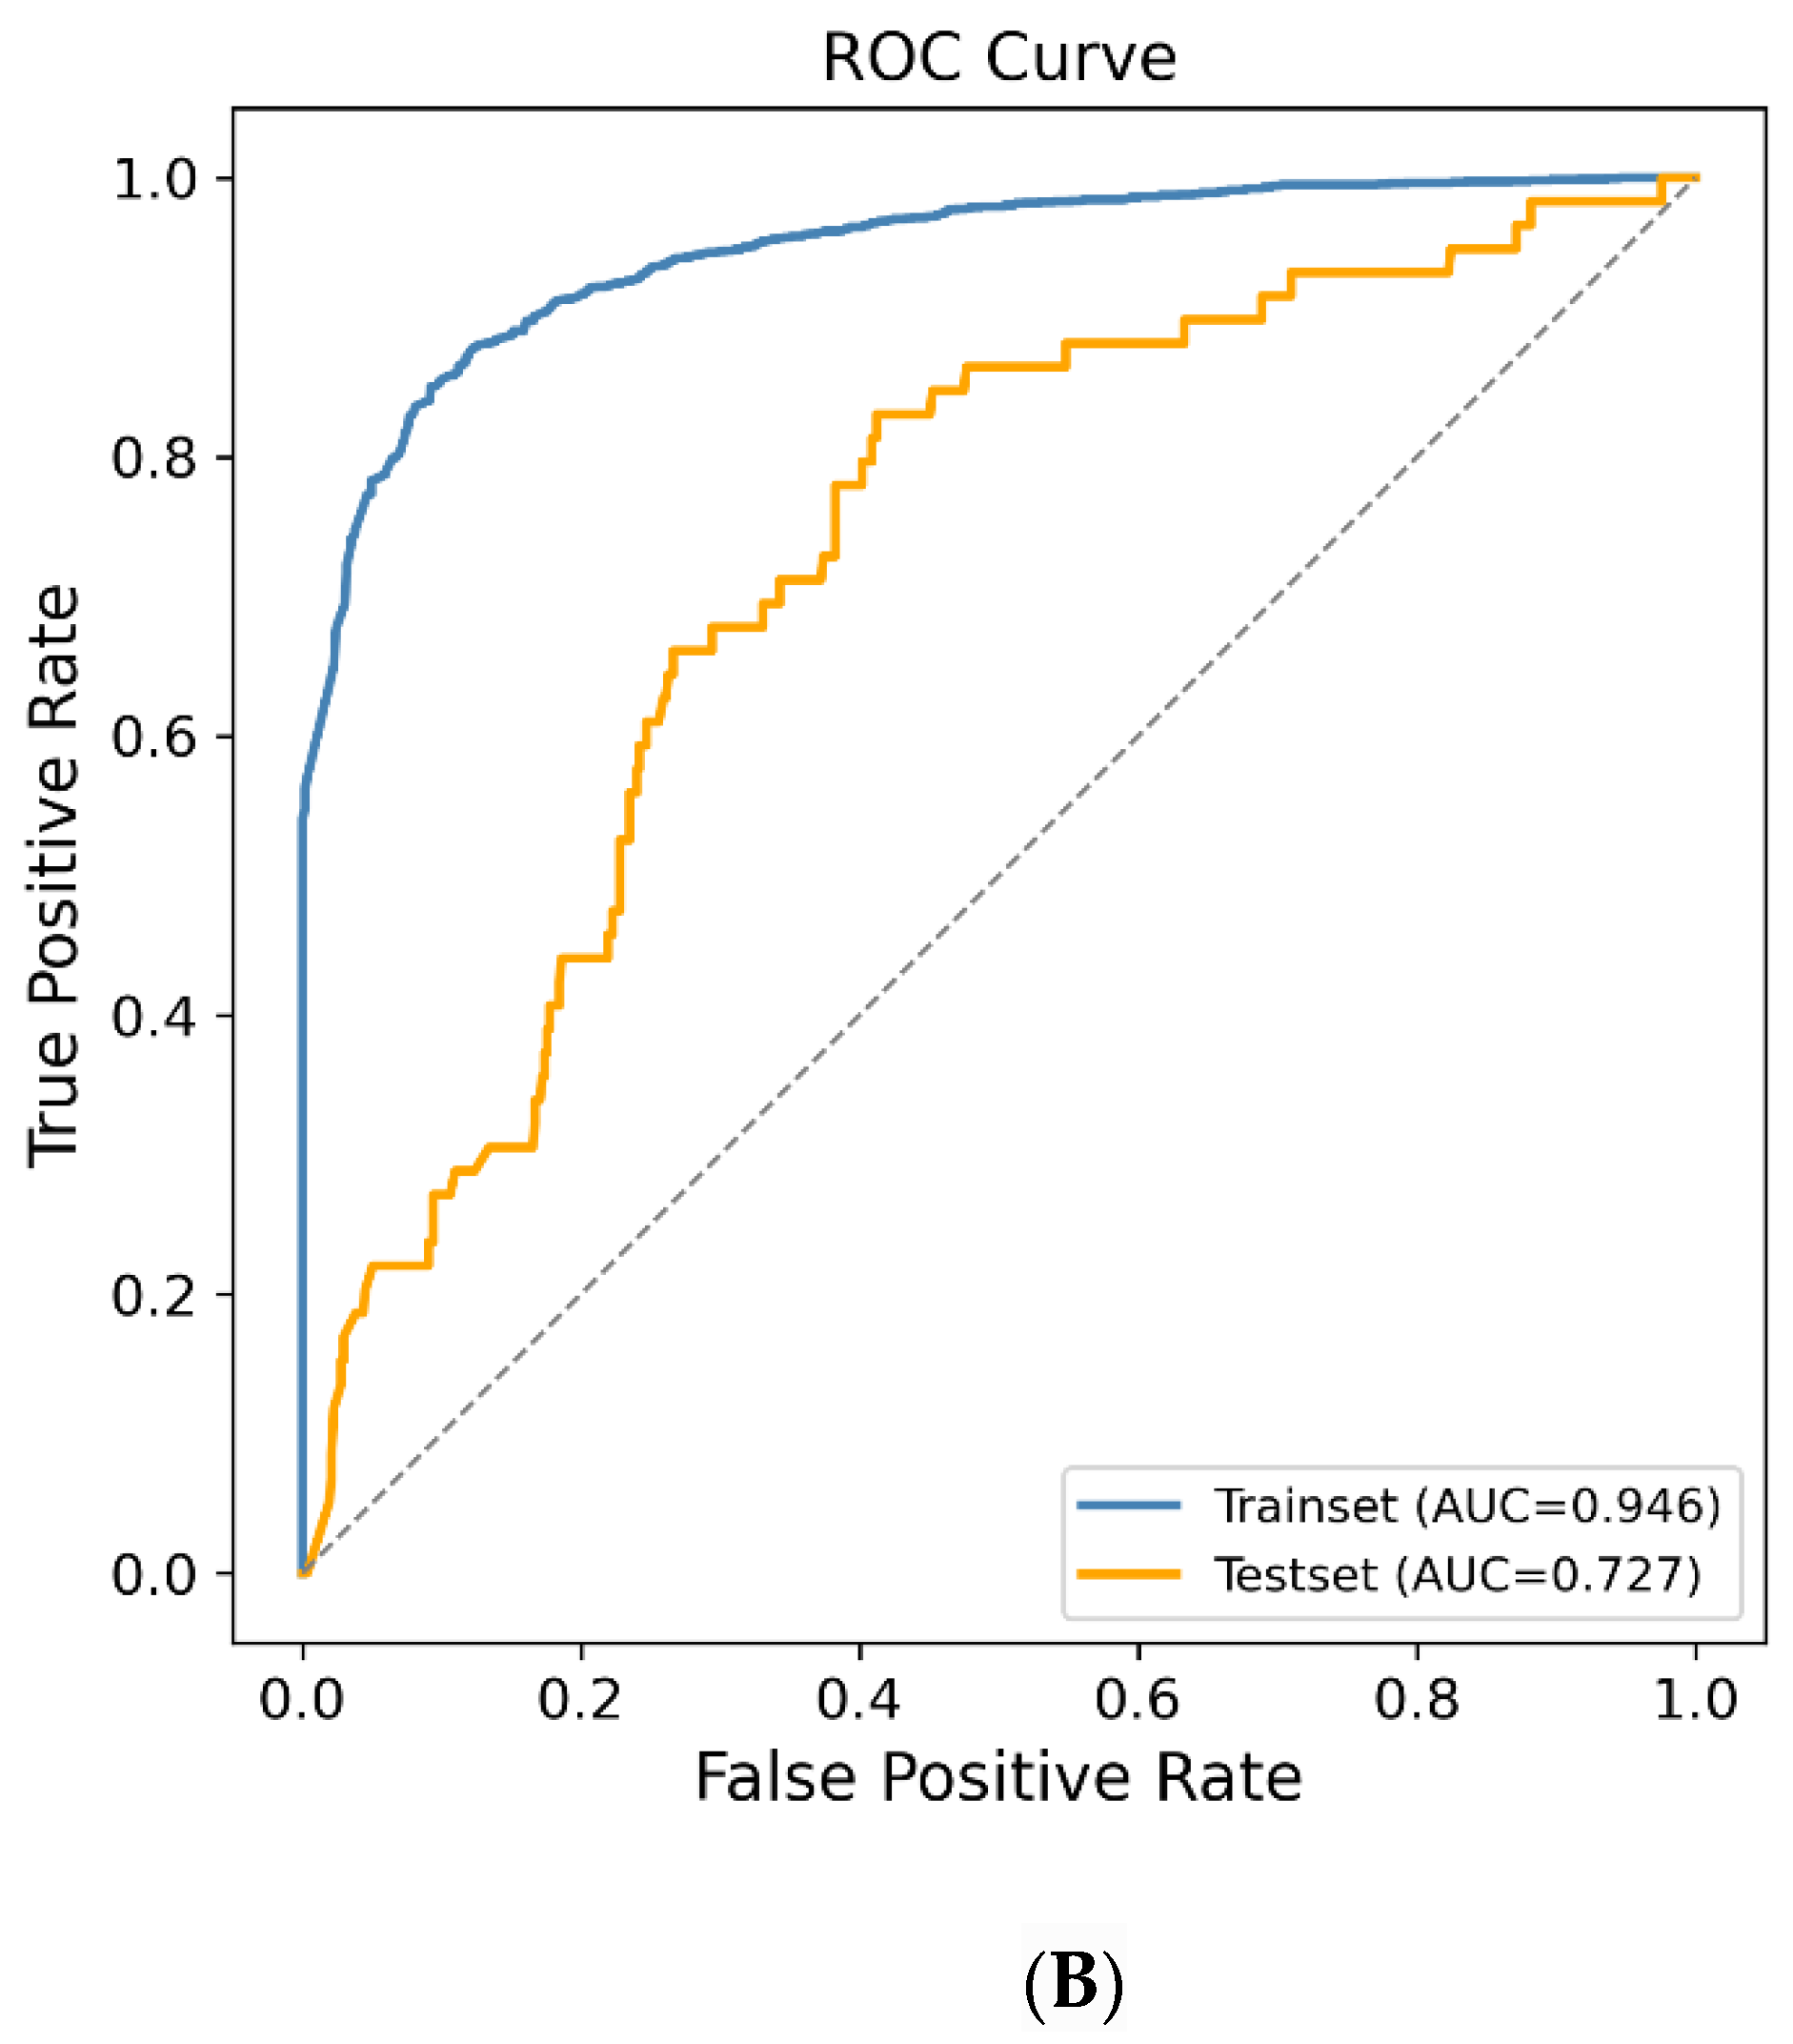
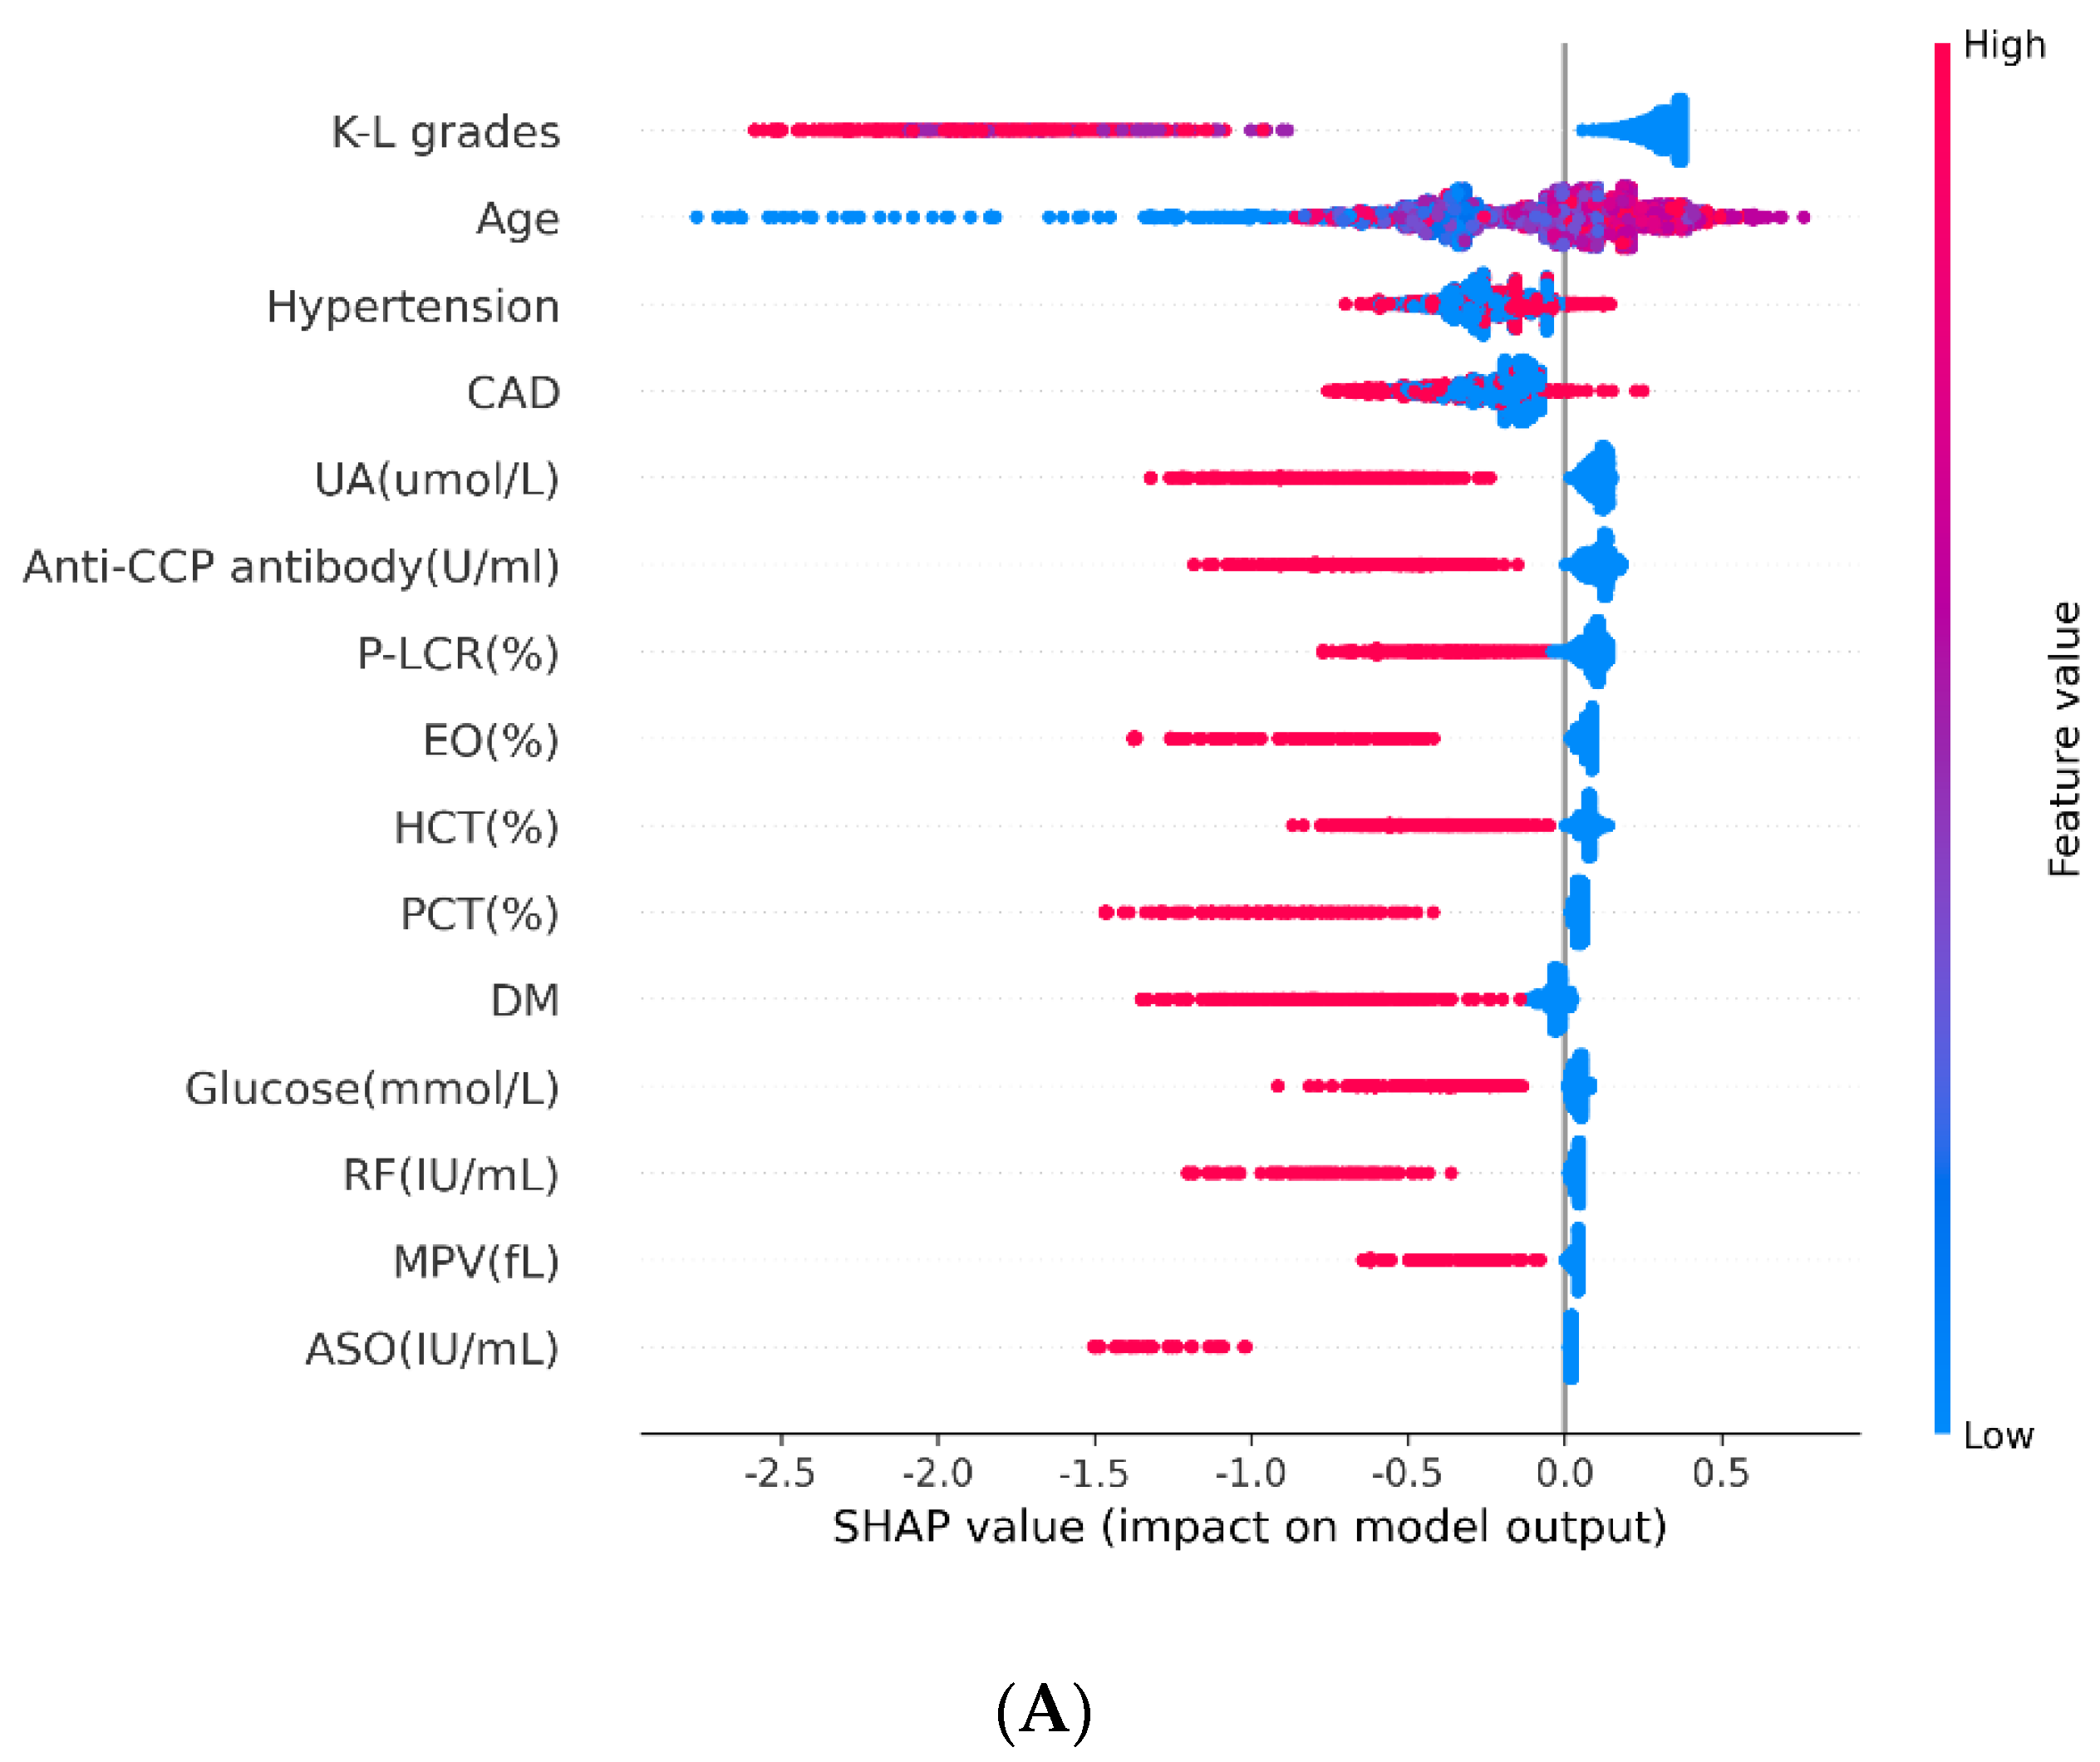
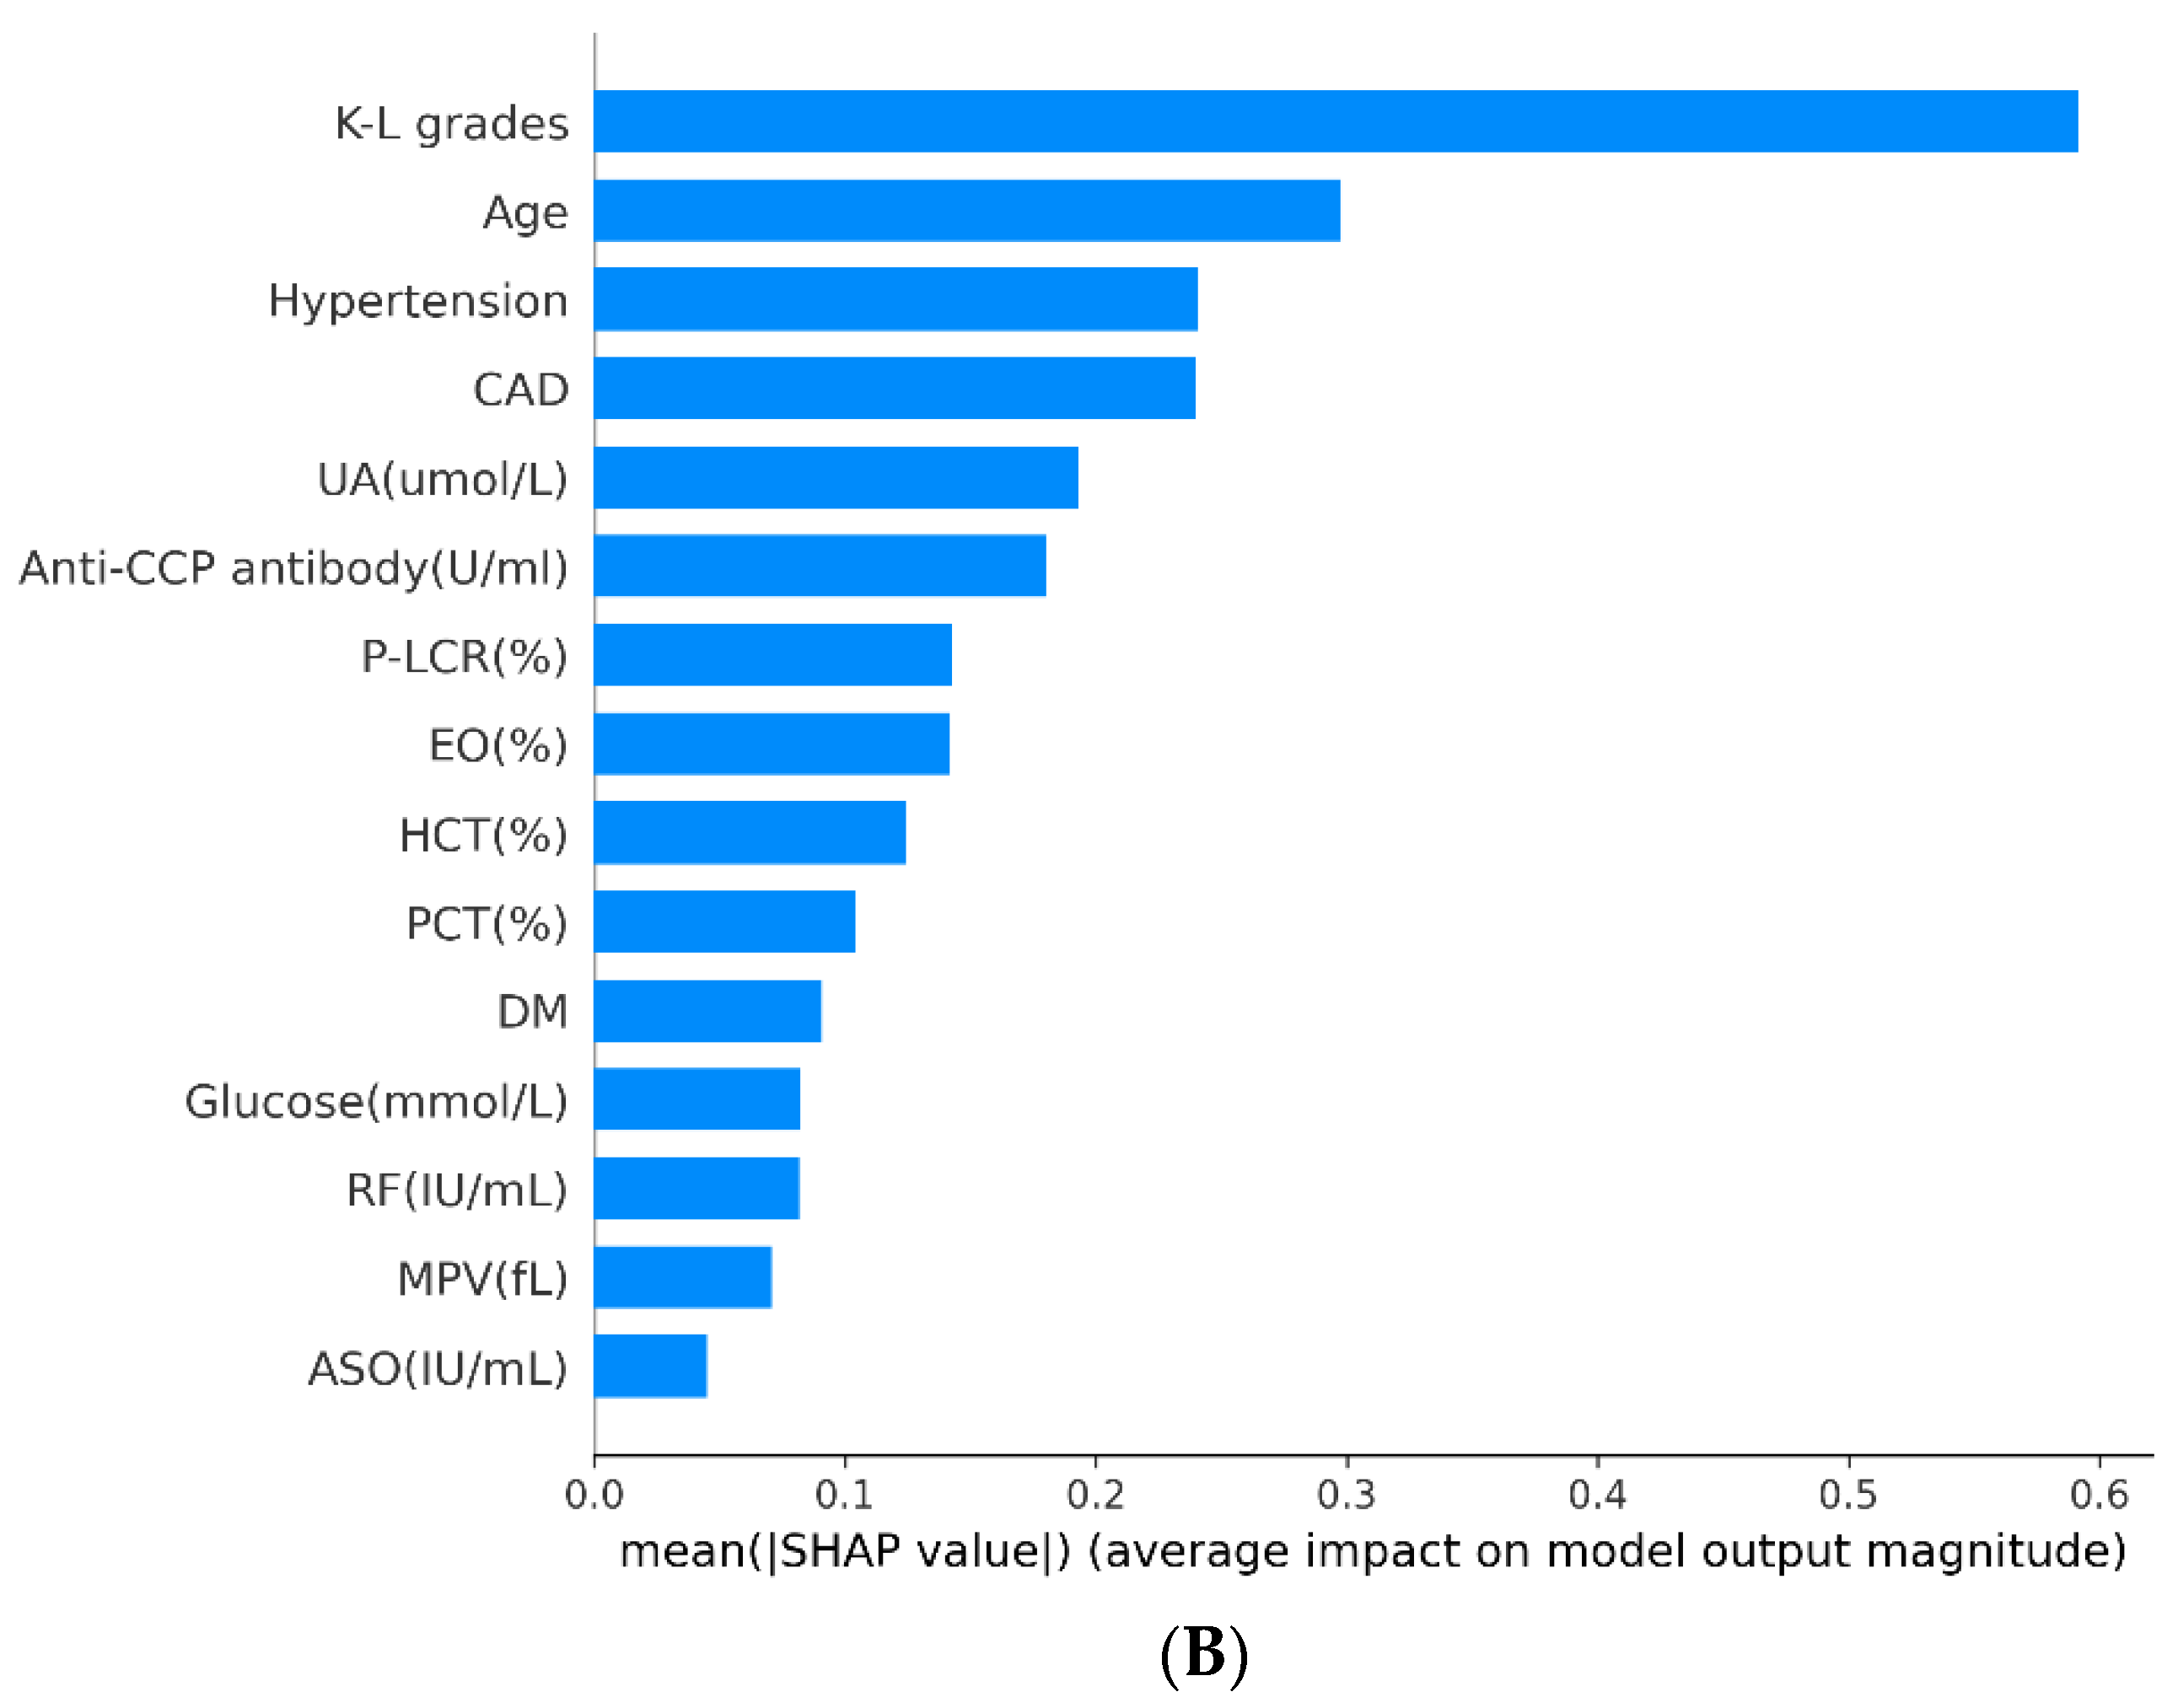
3. Results
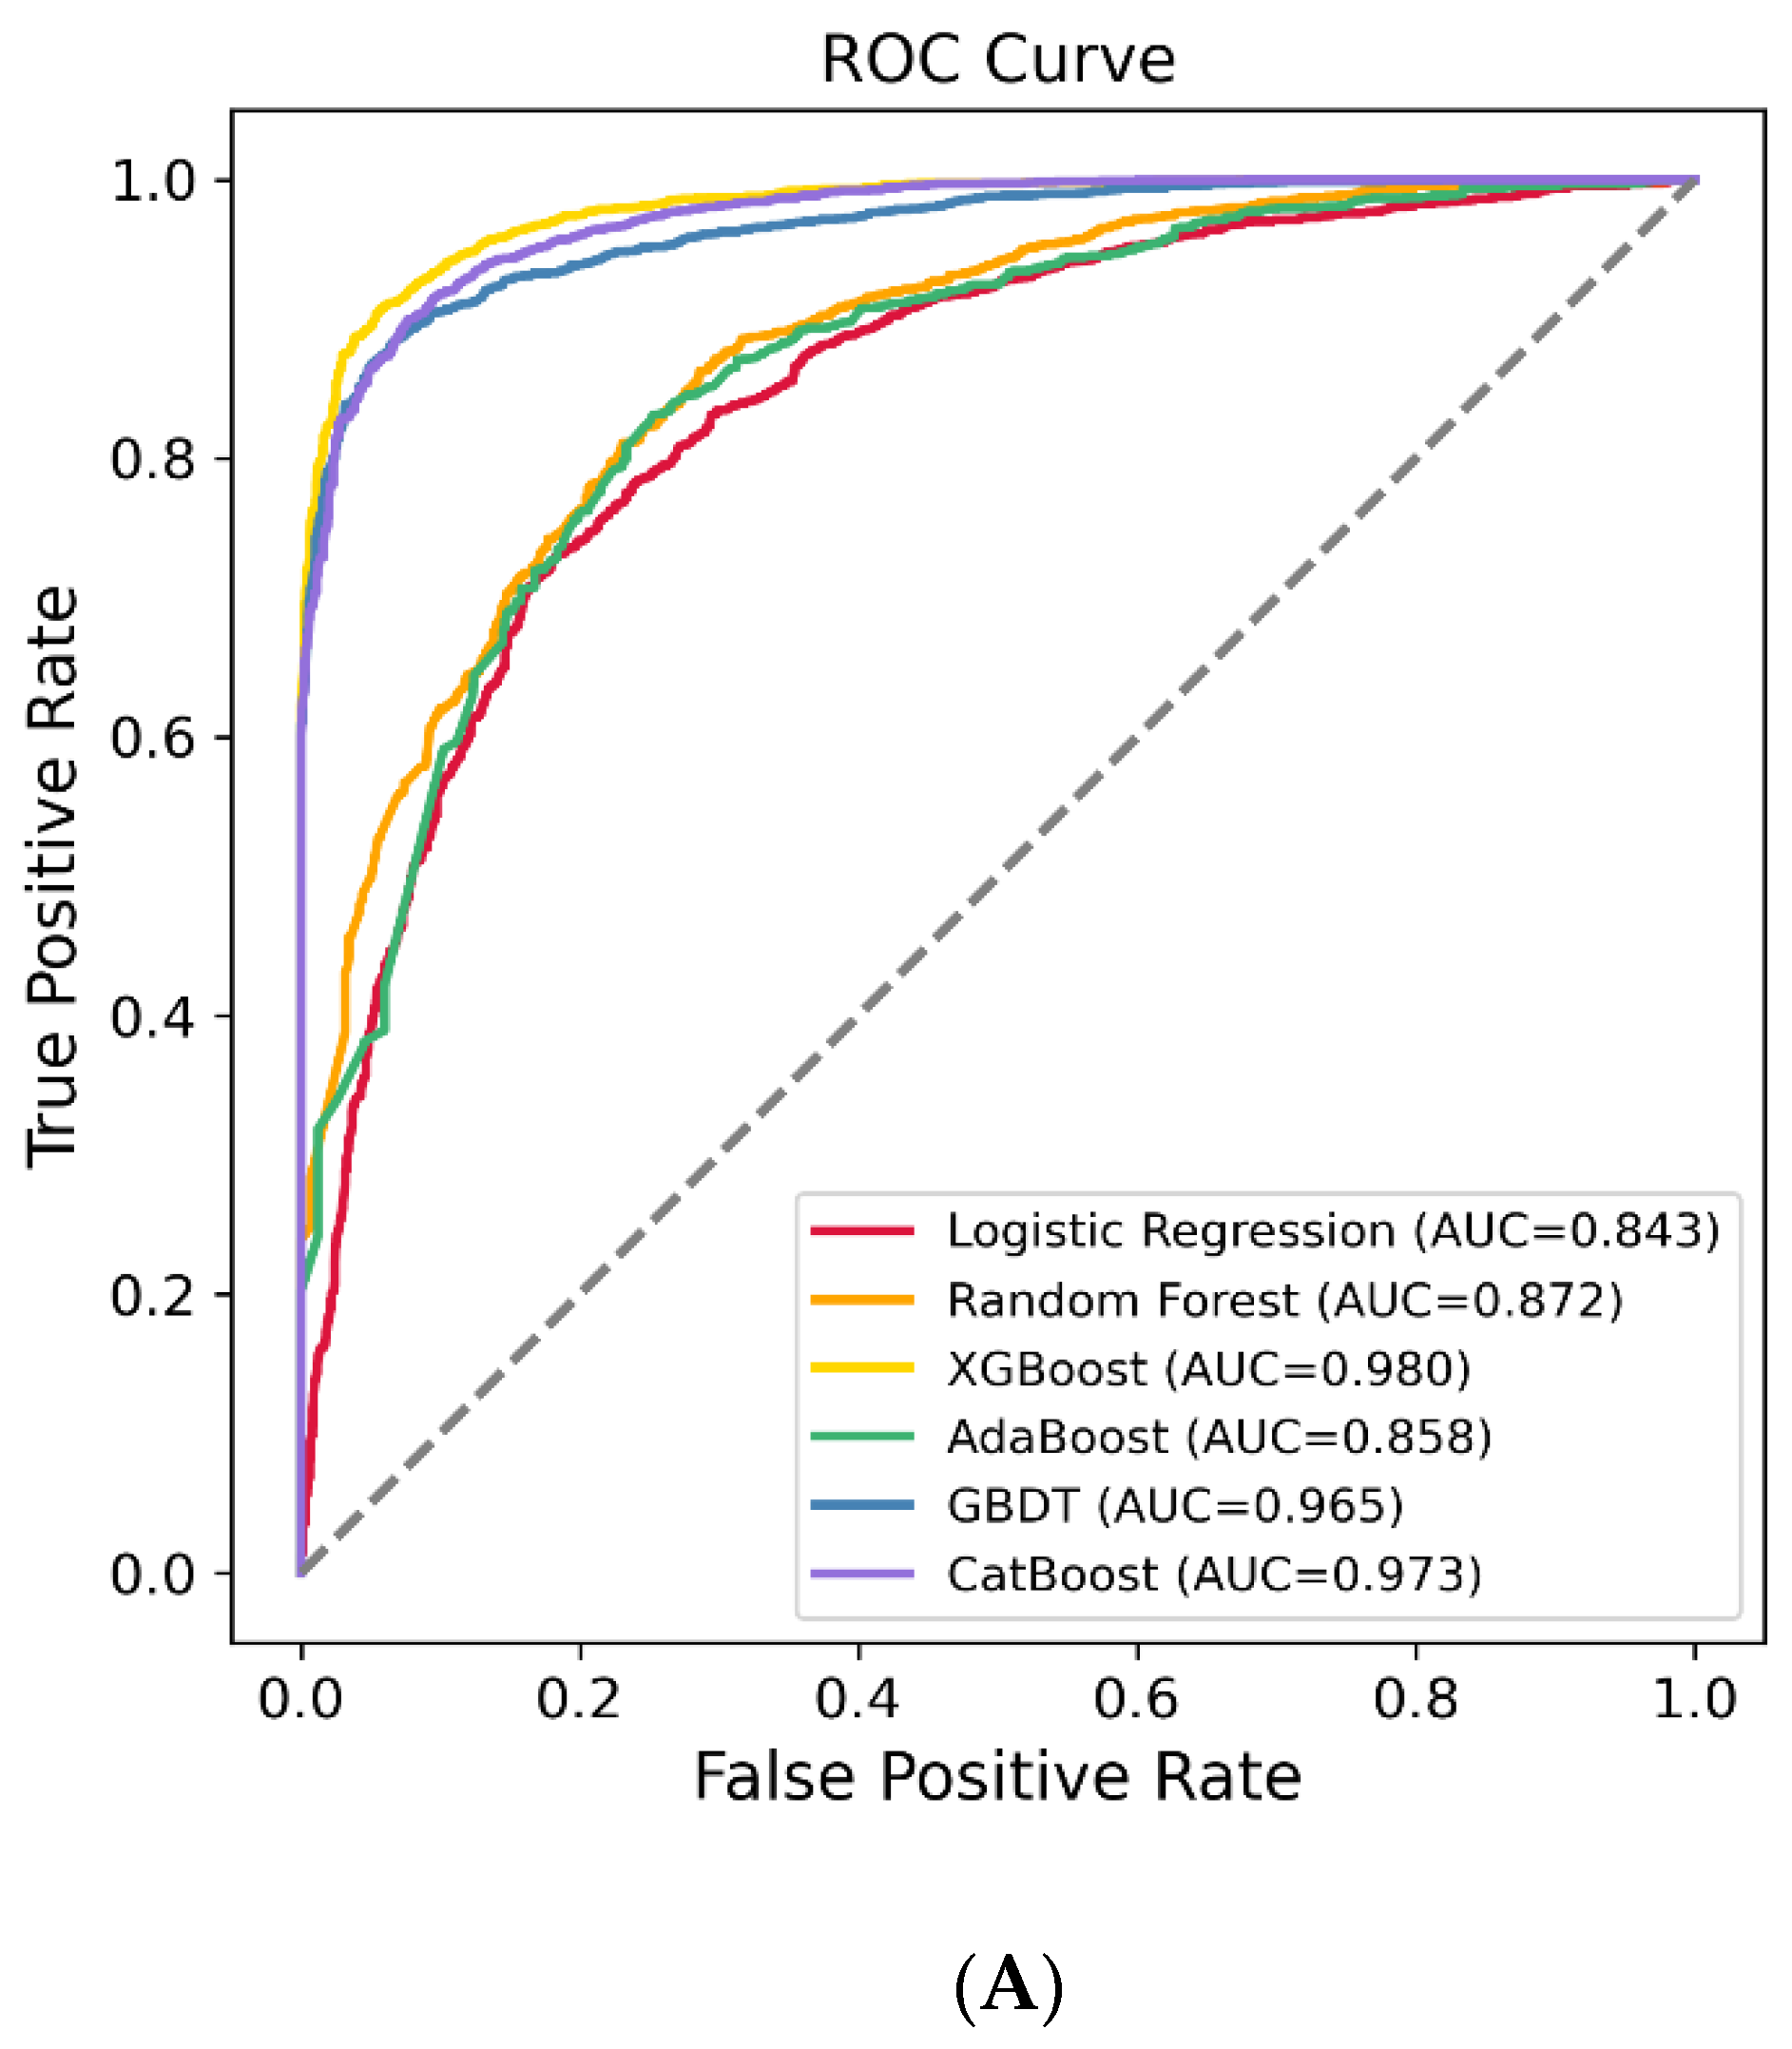
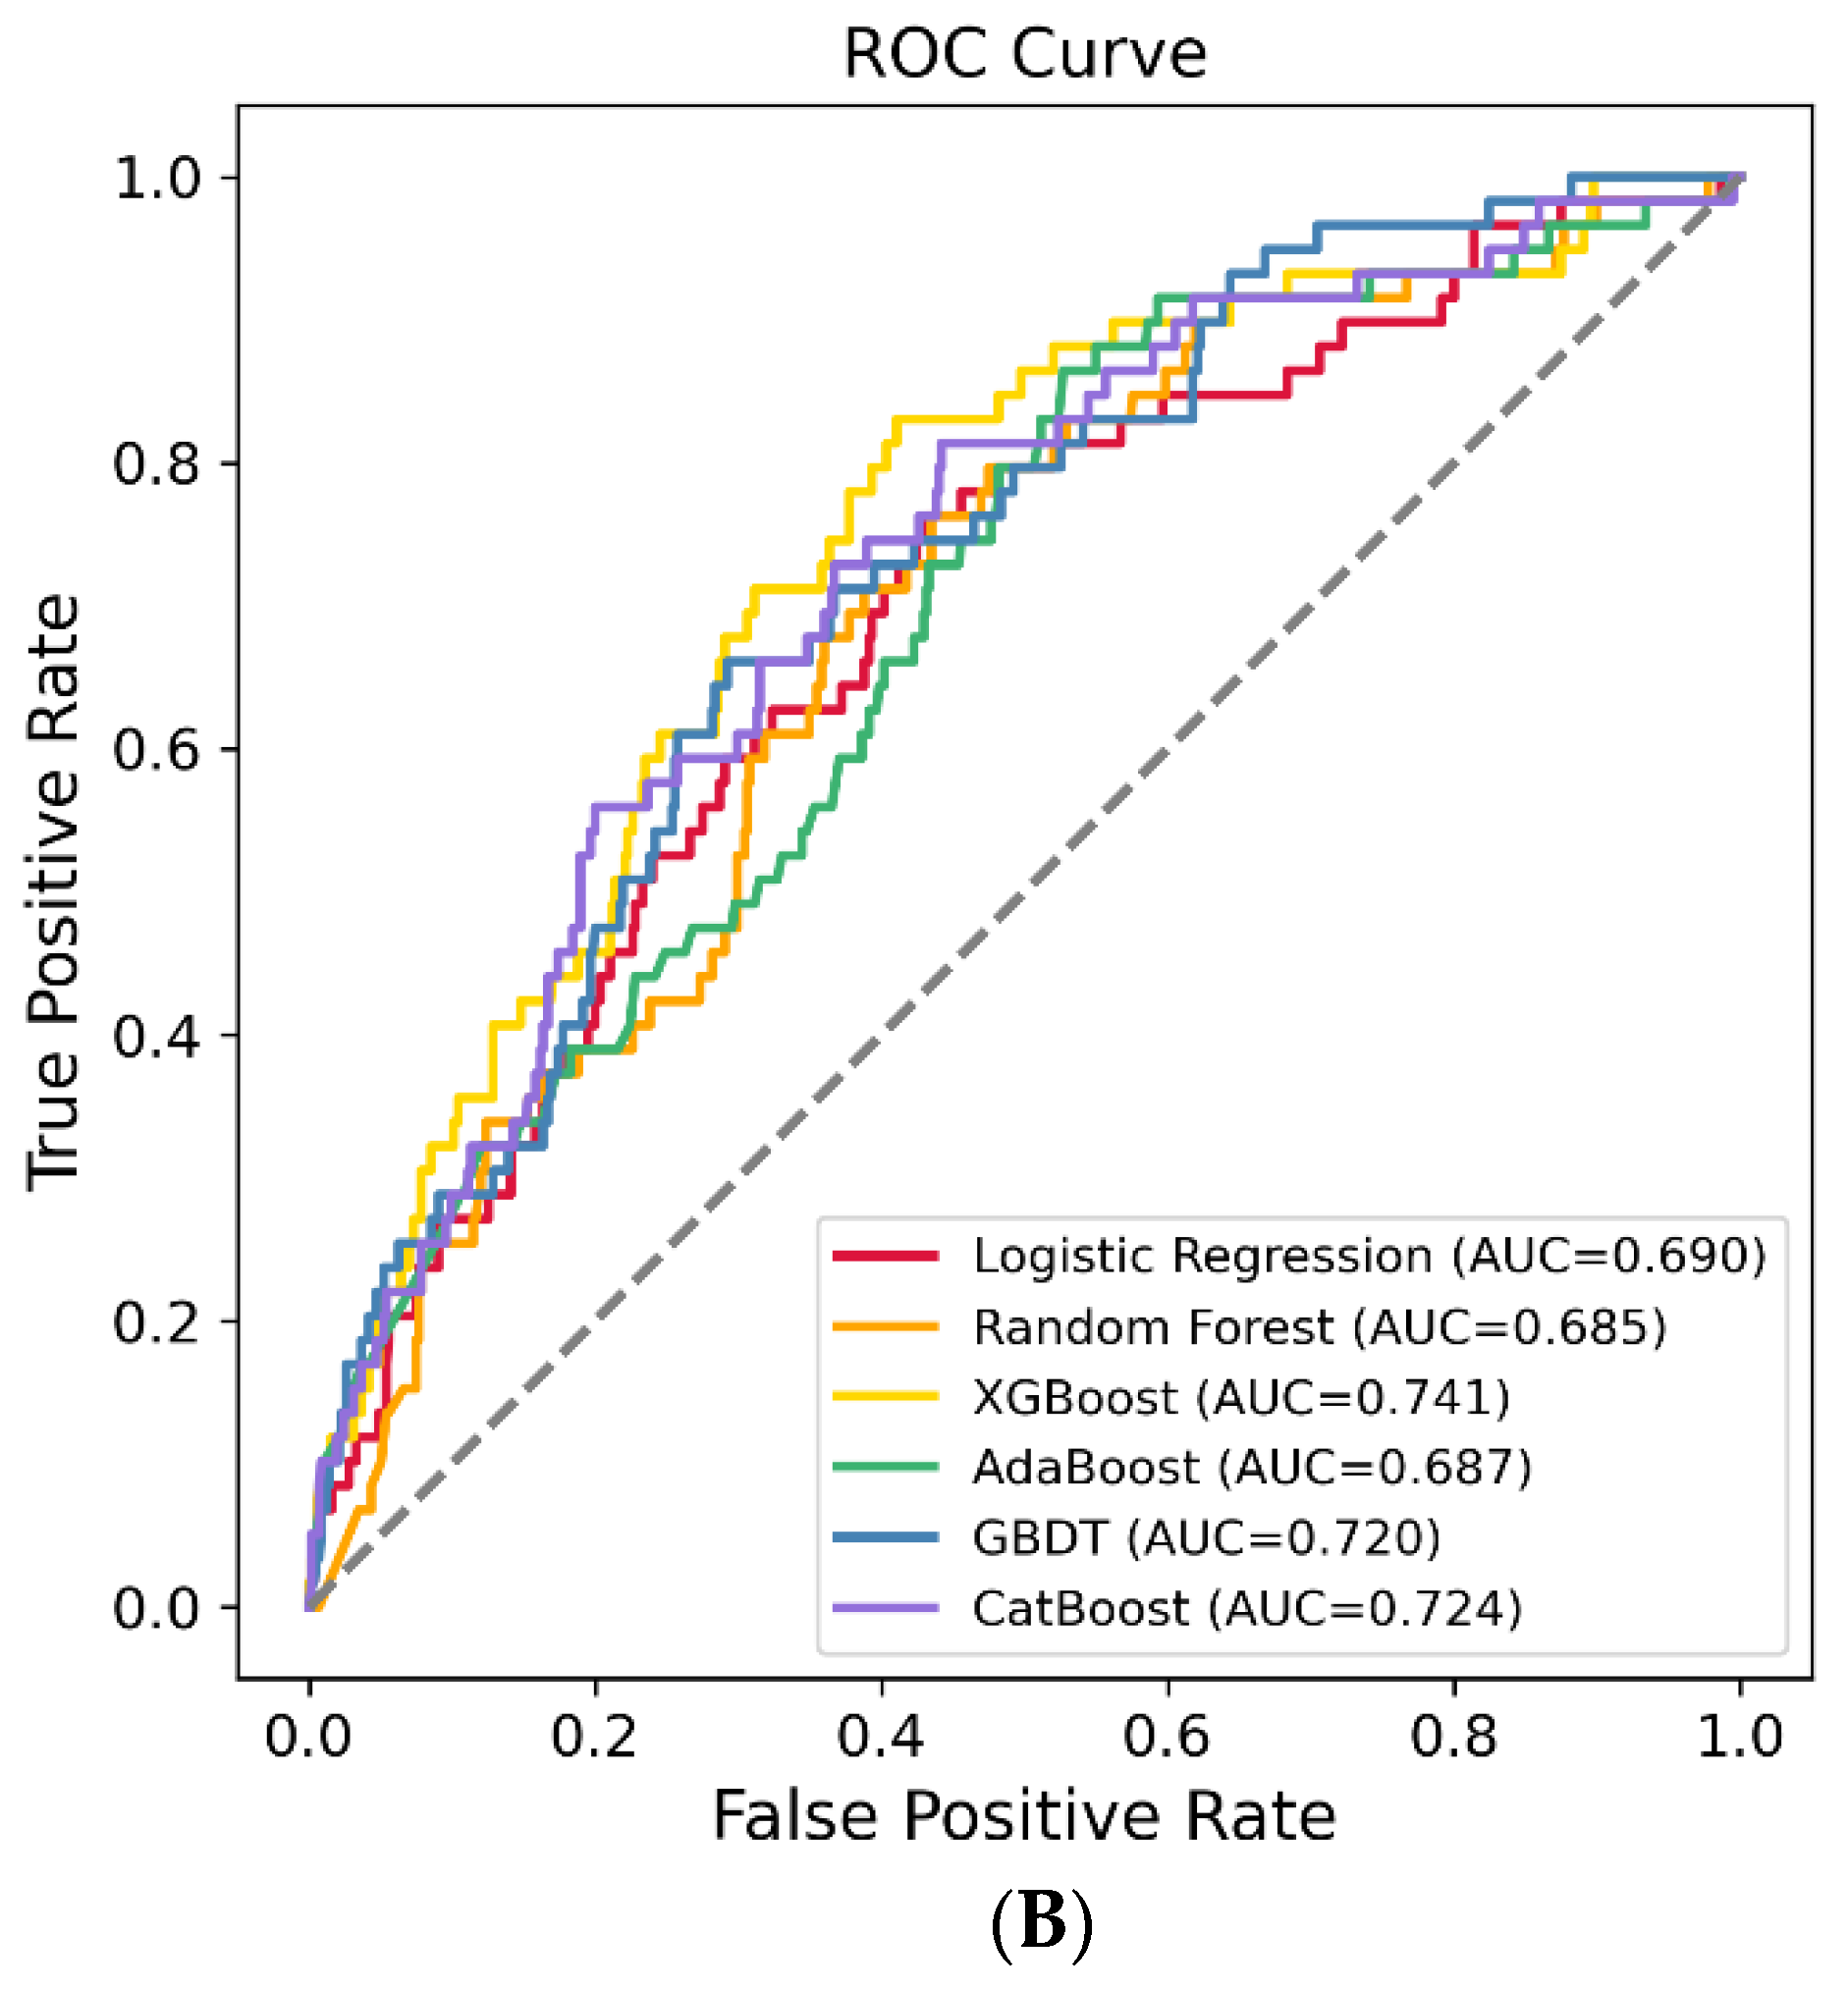
Interpretation and Evaluation of Machine Learning Model
4. Discussion
5. Conclusions
Author Contributions
Funding
Institutional Review Board Statement
Informed Consent Statement
Data Availability Statement
Conflicts of Interest
References
- Barnett, R. Osteoarthritis. Lancet 2018, 391, 1985. [Google Scholar] [CrossRef]
- Villafane, J.H.; Valdes, K.; Pedersini, P.; Berjano, P. Osteoarthritis: A call for research on central pain mechanism and personalized prevention strategies. Clin. Rheumatol. 2019, 38, 583–584. [Google Scholar] [CrossRef]
- Kolasinski, S.L.; Neogi, T.; Hochberg, M.C.; Oatis, C.; Guyatt, G.; Block, J.; Callahan, L.; Copenhaver, C.; Dodge, C.; Felson, D.; et al. 2019 American college of rheumatology/arthritis foundation guideline for the management of osteoarthritis of the hand, hip, and knee. Arthritis Rheumatol. 2020, 72, 220–233. [Google Scholar] [CrossRef]
- Palazzo, C.; Nguyen, C.; Lefevre-Colau, M.M.; Rannou, F.; Poiraudeau, S. Risk factors and burden of osteoarthritis. Ann. Phys. Rehabil. Med. 2016, 59, 134–138. [Google Scholar] [CrossRef]
- Abramoff, B.; Caldera, F.E. Osteoarthritis: Pathology, diagnosis, and treatment options. Med. Clin. N. Am. 2020, 104, 293–311. [Google Scholar] [CrossRef] [PubMed]
- Goldring, S.R.; Goldring, M.B. Changes in the osteochondral unit during osteoarthritis: Structure, function and cartilage-bone crosstalk. Nat. Rev. Rheumatol. 2016, 12, 632–644. [Google Scholar] [CrossRef] [PubMed]
- Sanchez-Romero, E.A.; Pecos-Martin, D.; Calvo-Lobo, C.; Garcia-Jimenez, D.; Ochoa-Saez, V.; Burgos-Caballero, V.; Fernandez-Carnero, J. Clinical features and myofascial pain syndrome in older adults with knee osteoarthritis by sex and age distribution: A cross-sectional study. Knee 2019, 26, 165–173. [Google Scholar] [CrossRef] [PubMed]
- Trouvin, A.P.; Perrot, S. Pain in osteoarthritis. Implications for optimal management. Joint Bone Spine 2018, 85, 429–434. [Google Scholar] [CrossRef] [PubMed]
- O’Neill, T.W.; Mccabe, P.S.; Mcbeth, J. Update on the epidemiology, risk factors and disease outcomes of osteoarthritis. Best Pract. Res. Clin. Rheumatol. 2018, 32, 312–326. [Google Scholar] [CrossRef]
- Prieto-Alhambra, D.; Judge, A.; Javaid, M.K.; Cooper, C.; Diez-Perez, A.; Arden, N.K. Incidence and risk factors for clinically diagnosed knee, hip and hand osteoarthritis: Influences of age, gender and osteoarthritis affecting other joints. Ann. Rheum. Dis. 2014, 73, 1659–1664. [Google Scholar] [CrossRef] [Green Version]
- Sanchez, R.E.; Melendez, O.E.; Alonso, P.J.; Martin, P.S.; Turroni, S.; Marchese, L.; Villafane, J.H. Relationship between the gut microbiome and osteoarthritis pain: Review of the literature. Nutrients 2021, 13, 716. [Google Scholar] [CrossRef]
- Vina, E.R.; Kwoh, C.K. Epidemiology of osteoarthritis: Literature update. Curr. Opin. Rheumatol. 2018, 30, 160–167. [Google Scholar] [CrossRef] [PubMed]
- Holmqvist, M.E.; Neovius, M.; Eriksson, J.; Mantel, A.; Wallberg-Jonsson, S.; Jacobsson, L.T.; Askling, J. Risk of venous thromboembolism in patients with rheumatoid arthritis and association with disease duration and hospitalization. JAMA 2012, 308, 1350–1356. [Google Scholar] [CrossRef] [PubMed] [Green Version]
- Bacani, A.K.; Gabriel, S.E.; Crowson, C.S.; Heit, J.A.; Matteson, E.L. Noncardiac vascular disease in rheumatoid arthritis: Increase in venous thromboembolic events? Arthritis Rheum. 2012, 64, 53–61. [Google Scholar] [CrossRef] [Green Version]
- Ketfi, C.; Boutigny, A.; Mohamedi, N.; Bouajil, S.; Magnan, B.; Amah, G.; Dillinger, J.G. Risk of venous thromboembolism in rheumatoid arthritis. Jt. Bone Spine 2021, 88, 105122. [Google Scholar] [CrossRef] [PubMed]
- Chung, W.S.; Peng, C.L.; Lin, C.L.; Chang, Y.J.; Chen, Y.F.; Chiang, J.Y.; Sung, F.C.; Kao, C.H. Rheumatoid arthritis increases the risk of deep vein thrombosis and pulmonary thromboembolism: A nationwide cohort study. Ann. Rheum. Dis. 2014, 73, 1774–1780. [Google Scholar] [CrossRef] [Green Version]
- Li, L.; Lu, N.; Avina-Galindo, A.M.; Zheng, Y.; Lacaille, D.; Esdaile, J.M.; Choi, H.K.; Avina-Zubieta, J.A. The risk and trend of pulmonary embolism and deep vein thrombosis in rheumatoid arthritis: A general population-based study. Rheumatology 2021, 60, 188–195. [Google Scholar] [CrossRef]
- Zeng, C.; Bennell, K.; Yang, Z.; Nguyen, U.; Lu, N.; Wei, J.; Lei, G.; Zhang, Y. Risk of venous thromboembolism in knee, hip and hand osteoarthritis: A general population-based cohort study. Ann. Rheum. Dis. 2020, 79, 1616–1624. [Google Scholar] [CrossRef]
- Deo, R.C. Machine learning in medicine. Circulation 2015, 132, 1920–1930. [Google Scholar] [CrossRef] [Green Version]
- Association, T.J.S.B.; Wang, K. Guidelines for the diagnosis and treatment of osteoarthritis (2018 edition). Chin. J. Orthop. 2018, 38, 705–715. [Google Scholar]
- Jiang, T.; Yao, Y.; Xu, X.; Song, K.; Pan, P.; Chen, D.; Xu, Z.; Dai, J.; Qin, J.; Shi, D.; et al. Prevalence and risk factors of preoperative deep vein thrombosis in patients with end-stage knee osteoarthritis. Ann. Vasc. Surg. 2020, 64, 175–180. [Google Scholar] [CrossRef] [PubMed]
- O’Brien, M.S.; Mcdougall, J.J. Age and frailty as risk factors for the development of osteoarthritis. Mech. Ageing Dev. 2019, 180, 21–28. [Google Scholar] [CrossRef]
- Chen, W.H.; Tsai, W.C.; Wang, H.T.; Wang, C.H.; Tseng, Y.T. Can early rehabilitation after osteoarthritis reduce knee and hip arthroplasty risk?: A national representative cohort study. Medicine 2019, 98, e15723. [Google Scholar] [CrossRef] [PubMed]
- Badillo, S.; Banfai, B.; Birzele, F.; Davydov, I.I.; Hutchinson, L.; Kam-Thong, T.; Siebourg-Polster, J.; Steiert, B.; Zhang, J.D. An introduction to machine learning. Clin. Pharmacol. Ther. 2020, 107, 871–885. [Google Scholar] [CrossRef] [Green Version]
- Helm, J.M.; Swiergosz, A.M.; Haeberle, H.S.; Karnuta, J.M.; Schaffer, J.L.; Krebs, V.E.; Spitzer, A.I.; Ramkumar, P.N. Machine learning and artificial intelligence: Definitions, applications, and future directions. Curr. Rev. Musculoskelet. Med. 2020, 13, 69–76. [Google Scholar] [CrossRef] [PubMed]
- Haeberle, H.S.; Helm, J.M.; Navarro, S.M.; Karnuta, J.M.; Schaffer, J.L.; Callaghan, J.J.; Mont, M.A.; Kamath, A.F.; Krebs, V.E.; Ramkumar, P.N. Artificial intelligence and machine learning in lower extremity arthroplasty: A review. J. Arthroplast. 2019, 34, 2201–2203. [Google Scholar] [CrossRef]
- Lu, Y.; Khazi, Z.M.; Agarwalla, A.; Forsythe, B.; Taunton, M.J. Development of a machine learning algorithm to predict nonroutine discharge following unicompartmental knee arthroplasty. J. Arthroplast. 2021, 36, 1568–1576. [Google Scholar] [CrossRef]
- Kunze, K.N.; Polce, E.M.; Sadauskas, A.J.; Levine, B.R. Development of machine learning algorithms to predict patient dissatisfaction after primary total knee arthroplasty. J. Arthroplast. 2020, 35, 3117–3122. [Google Scholar] [CrossRef]


| Class a | Total | None-Venous Thrombosis | Venous Thrombosis | p b | |
|---|---|---|---|---|---|
| N | 3169 | 2817 | 352 | ||
| Age (year) b | 66.52 ± 7.28 | 66.33 ± 7.31 | 68.05 ± 6.84 | <0.001 | |
| Gender | |||||
| Male | 2400 (75.73%) | 2119 (75.22%) | 281 (79.83%) | 0.066 | |
| Female | 769 (24.27%) | 698 (24.78%) | 71 (20.17%) | ||
| Hypertension | |||||
| No | 1730 (54.59%) | 1543 (54.77%) | 187 (53.12%) | 0.597 | |
| Yes | 1439 (45.41%) | 1274 (45.23%) | 165 (46.88%) | ||
| Diabetes | |||||
| No | 2751 (86.81%) | 2437 (86.51%) | 314 (89.20%) | 0.185 | |
| Yes | 418 (13.19%) | 380 (13.49%) | 38 (10.80%) | ||
| Coronary heart disease | |||||
| No | 2207 (69.64%) | 1974 (70.07%) | 233 (66.19%) | 0.152 | |
| Yes | 962 (30.36%) | 843 (29.93%) | 119 (33.81%) | ||
| Kellgren–Lawrence grade | |||||
| 0 | 2269 (71.60%) | 1943 (68.97%) | 326 (92.61%) | <0.001 | |
| III | 181 (5.71%) | 178 (6.32%) | 3 (0.85%) | ||
| IV | 719 (22.69%) | 696 (24.71%) | 23 (6.54%) | ||
| Eosinophil ratio | |||||
| Normal Range | 2746 (86.65%) | 2431 (86.30%) | 315 (89.49%) | 0.115 | |
| Abnormal | 423 (13.35%) | 386 (13.70%) | 37 (10.51%) | ||
| Hematocrit | |||||
| Normal Range | 2535 (79.99%) | 2254 (80.01%) | 281 (79.83%) | 0.991 | |
| Abnormal | 634 (20.01%) | 563 (19.99%) | 71 (20.17%) | ||
| Mean platelet volume | |||||
| Normal Range | 2782 (87.79%) | 2462 (87.40%) | 320 (90.91%) | 0.070 | |
| Abnormal | 387 (12.21%) | 355 (12.60%) | 32 (9.09%) | ||
| Thrombocytocrit | |||||
| Normal Range | 2858 (90.19%) | 2527 (89.71%) | 331 (94.03%) | 0.013 | |
| Abnormal | 311 (9.81%) | 290 (10.29%) | 21 (5.97%) | ||
| platelet-larger cell ratio | |||||
| Normal Range | 2390 (75.42%) | 2112 (74.97%) | 278 (78.98%) | 0.114 | |
| Abnormal | 779 (24.58%) | 705 (25.03%) | 74 (21.02%) | ||
| Uric acid | |||||
| Normal Range | 2554 (80.59%) | 2261 (80.26%) | 293 (83.24%) | 0.208 | |
| Abnormal | 615 (19.41%) | 556 (19.74%) | 59 (16.76%) | ||
| Glucose | |||||
| Normal Range | 2665 (84.10%) | 2369 (84.10%) | 296 (84.09%) | 0.941 | |
| Abnormal | 504 (15.90%) | 448 (15.90%) | 56 (15.91%) | ||
| Antistreptococcal hemolysin “O” | |||||
| Normal Range | 3074 (97.00%) | 2726 (96.77%) | 348 (98.86%) | 0.045 | |
| Abnormal | 95 (3.00%) | 91 (3.23%) | 4 (1.14%) | ||
| Anti-CCP antibody | |||||
| Normal Range | 2549 (80.44%) | 2255 (80.05%) | 294 (83.52%) | 0.140 | |
| Abnormal | 620 (19.56%) | 562 (19.95%) | 58 (16.48%) | ||
| Rheumatoid factors | |||||
| Normal Range | 2902 (91.57%) | 2577 (91.48%) | 325 (92.33%) | 0.661 | |
| Abnormal | 267 (8.43%) | 240 (8.52%) | 27 (7.67%) |
| Training Set (AUC, 95% CI) | Testing Set (AUC, 95% CI) | |
|---|---|---|
| LR | 0.843 (0.832, 0.855) | 0.690 (0.620, 0.760) |
| RF | 0.872 (0.862, 0.882) | 0.685 (0.618, 0.753) |
| XGBoost | 0.980 (0.977, 0.983) | 0.741 (0.676, 0.806) |
| AdaBoost | 0.858 (0.847, 0.868) | 0.687 (0.619, 0.755) |
| GBDT | 0.965 (0.960, 0.970) | 0.720 (0.656, 0.784) |
| CatBoost | 0.973 (0.969, 0.977) | 0.724 (0.657, 0.790) |
Publisher’s Note: MDPI stays neutral with regard to jurisdictional claims in published maps and institutional affiliations. |
© 2022 by the authors. Licensee MDPI, Basel, Switzerland. This article is an open access article distributed under the terms and conditions of the Creative Commons Attribution (CC BY) license (https://creativecommons.org/licenses/by/4.0/).
Share and Cite
Lu, C.; Song, J.; Li, H.; Yu, W.; Hao, Y.; Xu, K.; Xu, P. Predicting Venous Thrombosis in Osteoarthritis Using a Machine Learning Algorithm: A Population-Based Cohort Study. J. Pers. Med. 2022, 12, 114. https://doi.org/10.3390/jpm12010114
Lu C, Song J, Li H, Yu W, Hao Y, Xu K, Xu P. Predicting Venous Thrombosis in Osteoarthritis Using a Machine Learning Algorithm: A Population-Based Cohort Study. Journal of Personalized Medicine. 2022; 12(1):114. https://doi.org/10.3390/jpm12010114
Chicago/Turabian StyleLu, Chao, Jiayin Song, Hui Li, Wenxing Yu, Yangquan Hao, Ke Xu, and Peng Xu. 2022. "Predicting Venous Thrombosis in Osteoarthritis Using a Machine Learning Algorithm: A Population-Based Cohort Study" Journal of Personalized Medicine 12, no. 1: 114. https://doi.org/10.3390/jpm12010114
APA StyleLu, C., Song, J., Li, H., Yu, W., Hao, Y., Xu, K., & Xu, P. (2022). Predicting Venous Thrombosis in Osteoarthritis Using a Machine Learning Algorithm: A Population-Based Cohort Study. Journal of Personalized Medicine, 12(1), 114. https://doi.org/10.3390/jpm12010114