
The Role of Soluble LAG3 and Soluble Immune Checkpoints Profile in Advanced Head and Neck Cancer: A Pilot Study

 , , , , , , , , and
Abstract
:1. Introduction
2. Materials and Methods
2.1. Clinical Data
2.2. Immunomonitoring
2.3. Statistical Analysis
3. Results
4. Discussion
5. Conclusions
Author Contributions
Funding
Institutional Review Board Statement
Informed Consent Statement
Data Availability Statement
Conflicts of Interest
References
- Laura, Q.M.; Chow, M.D. Head and Neck Cancer. N. Engl. J. Med. 2020, 382, 60–72. [Google Scholar] [CrossRef]
- Marur, S.; Forastiere, A.A. Head and Neck Squamous Cell Carcinoma: Update on Epidemiology, Diagnosis, and Treatment. In Proceedings of the Mayo Clinic Proceedings; Elsevier BV: Amsterdam, The Netherlands, 2016; Volume 91, pp. 386–396. [Google Scholar]
- Vermorken, J.B.; Mesia, R.; Rivera, F.; Remenar, E.; Kawecki, A.; Rottey, S.; Erfan, J.; Zabolotnyy, D.; Kienzer, H.-R.; Cupissol, D.; et al. Platinum-Based Chemotherapy plus Cetuximab in Head and Neck Cancer. N. Engl. J. Med. 2008, 359, 1116–1127. [Google Scholar] [CrossRef] [Green Version]
- Guigay, J.; Tahara, M.; Licitra, L.; Keilholz, U.; Friesland, S.; Witzler, P.; Mesía, R. The Evolving Role of Taxanes in Combination with Cetuximab for the Treatment of Recurrent and/or Metastatic Squamous Cell Carcinoma of the Head and Neck: Evidence, Advantages, and Future Directions. Front. Oncol. 2019, 9, 668. [Google Scholar] [CrossRef] [PubMed]
- El Rassy, E.; Assi, T.; Bakouny, Z.; El Karak, F.; Pavlidis, N.; Ghosn, M. Comparison of second-line treatments of recurrent and/or metastatic squamous cell carcinoma of the head and neck. Future Oncol. 2019, 15, 909–923. [Google Scholar] [CrossRef] [PubMed]
- Ferris, R.L.; Blumenschein, G., Jr.; Fayette, J.; Guigay, J.; Colevas, A.D.; Licitra, L.; Harrington, K.; Kasper, S.; Vokes, E.E.; Even, C.; et al. Nivolumab for Recurrent Squamous-Cell Carcinoma of the Head and Neck. N. Engl. J. Med. 2016, 375, 1856–1867. [Google Scholar] [CrossRef] [PubMed]
- Burtness, B.; Harrington, K.; Greil, R.; Soulières, D.; Tahara, M.; de Castro, G.; Psyrri, A.; Basté, N.; Neupane, P.; Bratland, Å.; et al. Pembrolizumab alone or with chemotherapy versus cetuximab with chemotherapy for recurrent or metastatic squamous cell carcinoma of the head and neck (KEYNOTE-048): A randomised, open-label, phase 3 study. Lancet 2019, 394, 1915–1928. [Google Scholar] [CrossRef]
- Szturz, P.; Vermorken, J.B. Further clinical interpretation and implications of KEYNOTE-048 findings. Lancet 2020, 396, 378–379. [Google Scholar] [CrossRef]
- Ferris, R.L. Immunology and Immunotherapy of Head and Neck Cancer. J. Clin. Oncol. 2015, 33, 3293–3304. [Google Scholar] [CrossRef]
- Taube, J.M.; Klein, A.; Brahmer, J.R.; Xu, H.; Pan, X.; Kim, J.H.; Chen, L.; Pardoll, D.M.; Topalian, S.L.; Anders, R.A. Association of PD-1, PD-1 Ligands, and Other Features of the Tumor Immune Microenvironment with Response to Anti–PD-1 Therapy. Clin. Cancer Res. 2014, 20, 5064–5074. [Google Scholar] [CrossRef] [Green Version]
- Gibney, G.T.; Weiner, L.M.; Atkins, M.B. Predictive biomarkers for checkpoint inhibitor-based immunotherapy. Lancet Oncol. 2016, 17, e542–e551. [Google Scholar] [CrossRef] [Green Version]
- Robert, C.; Long, G.V.; Brady, B.; Dutriaux, C.; Maio, M.; Mortier, L.; Hassel, J.C.; Rutkowski, P.; McNeil, C.; Kalinka-Warzocha, E.; et al. Nivolumab in Previously Untreated Melanoma withoutBRAFMutation. N. Engl. J. Med. 2015, 372, 320–330. [Google Scholar] [CrossRef] [Green Version]
- Kammerer-Jacquet, S.-F.; Deleuze, A.; Saout, J.; Mathieu, R.; Laguerre, B.; Verhoest, G.; Dugay, F.; Belaud-Rotureau, M.-A.; Bensalah, K.; Rioux-Leclercq, N. Targeting the PD-1/PD-L1 Pathway in Renal Cell Carcinoma. Int. J. Mol. Sci. 2019, 20, 1692. [Google Scholar] [CrossRef] [PubMed] [Green Version]
- Jr, P.N.A.; De Mello, R.A.; Hall, P.; Tadokoro, H.; Lopes, G.D.L. PD-L1 expression as a predictive biomarker in advanced non-small-cell lung cancer: Updated survival data. Immunotherapy 2017, 9, 499–506. [Google Scholar] [CrossRef]
- Zhu, X.; Lang, J. Soluble PD-1 and PD-L1: Predictive and prognostic significance in cancer. Oncotarget 2017, 8, 97671–97682. [Google Scholar] [CrossRef] [PubMed] [Green Version]
- Gu, D.; Ao, X.; Yang, Y.; Chen, Z.; Xu, X. Soluble immune checkpoints in cancer: Production, function and biological significance. J. Immunother. Cancer 2018, 6, 132. [Google Scholar] [CrossRef] [PubMed] [Green Version]
- Amin, M.B.; Edge, S.B.; Greene, F.L. AJCC Cancer Staging Manual, 8th ed.; Springer: New York, NY, USA, 2017. [Google Scholar]
- Schwartz, L.H.; Litière, S.; de Vries, E.; Ford, R.; Gwyther, S.; Mandrekar, S.; Shankar, L.; Bogaerts, J.; Chen, A.; Dancey, J.; et al. RECIST 1.1—Update and clarification: From the RECIST committee. Eur. J. Cancer 2016, 62, 132–137. [Google Scholar] [CrossRef] [Green Version]
- Seymour, L.; Bogaerts, J.; Perrone, A.; Ford, R.; Schwartz, L.H.; Mandrekar, S.; Lin, N.U.; Litière, S.; Dancey, J.; Chen, A.; et al. iRECIST: Guidelines for response criteria for use in trials testing immunotherapeutics. Lancet Oncol. 2017, 18, e143–e152. [Google Scholar] [CrossRef] [Green Version]
- Lee, S.; Margolin, K. Cytokines in Cancer Immunotherapy. Cancers 2011, 3, 3856–3893. [Google Scholar] [CrossRef]
- Chen, Y.; Wang, Q.; Shi, B.; Xu, P.; Hu, Z.; Bai, L.; Zhang, X. Development of a sandwich ELISA for evaluating soluble PD-L1 (CD274) in human sera of different ages as well as supernatants of PD-L1+ cell lines. Cytokine 2011, 56, 231–238. [Google Scholar] [CrossRef]
- Leung, A.M.; Lee, A.F.; Eozao-Choy, J.; Ramos, R.I.; Ehamid, O.; O’Day, S.J.; Eshin-Sim, M.; Morton, D.L.; Faries, M.B.; Sieling, P.A.; et al. Clinical Benefit from Ipilimumab Therapy in Melanoma Patients may be Associated with Serum CTLA4 Levels. Front. Oncol. 2014, 4, 110. [Google Scholar] [CrossRef]
- Zizzari, I.; Napoletano, C.; Di Filippo, A.; Botticelli, A.; Gelibter, A.; Calabrò, F.; Rossi, E.; Schinzari, G.; Urbano, F.; Pomati, G.; et al. Exploratory Pilot Study of Circulating Biomarkers in Metastatic Renal Cell Carcinoma. Cancers 2020, 12, 2620. [Google Scholar] [CrossRef]
- Anderson, A.C.; Joller, N.; Kuchroo, V.K. Lag-3, Tim-3, and TIGIT: Co-inhibitory Receptors with Specialized Functions in Immune Regulation. Immunity 2016, 44, 989–1004. [Google Scholar] [CrossRef] [PubMed] [Green Version]
- Kisielow, M.; Kisielow, J.; Capoferri-Sollami, G.; Karjalainen, K. Expression of lymphocyte activation gene 3 (LAG-3) on B cells is induced by T cells. Eur. J. Immunol. 2005, 35, 2081–2088. [Google Scholar] [CrossRef] [PubMed]
- Baixeras, E.; Huard, B.; Miossec, C.; Jitsukawa, S.; Martin, M.; Hercend, T.; Auffray, C.; Triebel, F.; Piatier-Tonneau, D. Characterization of the lymphocyte activation gene 3-encoded protein. A new ligand for human leukocyte antigen class II antigens. J. Exp. Med. 1992, 176, 327–337. [Google Scholar] [CrossRef] [PubMed]
- Solinas, C.; Migliori, E.; De Silva, P.; Willard-Gallo, K. LAG3: The Biological Processes That Motivate Targeting This Immune Checkpoint Molecule in Human Cancer. Cancers 2019, 11, 1213. [Google Scholar] [CrossRef] [Green Version]
- Graydon, C.G.; Mohideen, S.; Fowke, K.R. LAG3′s Enigmatic Mechanism of Action. Front. Immunol. 2021, 11. [Google Scholar] [CrossRef]
- Woo, S.-R.; Turnis, M.E.; Goldberg, M.V.; Bankoti, J.; Selby, M.; Nirschl, C.; Bettini, M.L.; Gravano, D.M.; Vogel, P.; Liu, C.L.; et al. Immune Inhibitory Molecules LAG-3 and PD-1 Synergistically Regulate T-cell Function to Promote Tumoral Immune Escape. Cancer Res. 2012, 72, 917–927. [Google Scholar] [CrossRef] [Green Version]
- Deng, W.-W.; Mao, L.; Yu, G.-T.; Bu, L.-L.; Ma, S.-R.; Liu, B.; Gutkind, J.S.; Kulkarni, A.B.; Zhang, W.-F.; Sun, Z.-J. LAG-3 confers poor prognosis and its blockade reshapes antitumor response in head and neck squamous cell carcinoma. OncoImmunology 2016, 5, e1239005. [Google Scholar] [CrossRef] [Green Version]
- Mei, Z.; Huang, J.; Qiao, B.; Lam, A.K.-Y. Immune checkpoint pathways in immunotherapy for head and neck squamous cell carcinoma. Int. J. Oral Sci. 2020, 12, 16. [Google Scholar] [CrossRef]
- Lienhardt, C.; Azzurri, A.; Amedei, A.; Fielding, K.; Sillah, J.; Sow, O.Y.; Bah, B.; Benagiano, M.; Diallo, A.; Manetti, R.; et al. Active tuberculosis in Africa is associated with reduced Th1 and increased Th2 activity in vivo. Eur. J. Immunol. 2002, 32, 1605–1613. [Google Scholar] [CrossRef] [Green Version]
- Li, N.; Jilisihan, B.; Wang, W.; Tang, Y.; Keyoumu, S. Soluble LAG3 acts as a potential prognostic marker of gastric cancer and its positive correlation with CD8+T cell frequency and secretion of IL-12 and INF-γ in peripheral blood. Cancer Biomark. 2018, 23, 341–351. [Google Scholar] [CrossRef] [PubMed]
- Triebel, F.; Hacene, K.; Pichon, M.-F. A soluble lymphocyte activation gene-3 (sLAG-3) protein as a prognostic factor in human breast cancer expressing estrogen or progesterone receptors. Cancer Lett. 2006, 235, 147–153. [Google Scholar] [CrossRef] [PubMed]
- Dong, M.P.; Enomoto, M.; Thuy, L.T.T.; Hai, H.; Hieu, V.N.; Hoang, D.V.; Iida-Ueno, A.; Odagiri, N.; Amano-Teranishi, Y.; Hagihara, A.; et al. Clinical significance of circulating soluble immune checkpoint proteins in sorafenib-treated patients with advanced hepatocellular carcinoma. Sci. Rep. 2020, 10, 3392. [Google Scholar] [CrossRef] [Green Version]
- He, Y.; Wang, Y.; Zhao, S.; Zhao, C.; Zhou, C.; Hirsch, F.R. sLAG-3 in non-small-cell lung cancer patients’ serum. Onco Targets Ther. 2018, 11, 4781–4784. [Google Scholar] [CrossRef] [PubMed] [Green Version]
- Melero, I.; Berman, D.M.; Aznar, M.A.; Korman, A.J.; Perez-Gracia, J.L.; Haanen, J.B.A.G. Evolving synergistic combinations of targeted immunotherapies to combat cancer. Nat. Rev. Cancer 2015, 15, 457–472. [Google Scholar] [CrossRef]


| Patients N (%) | |
|---|---|
| Age (years) | |
| Median Age (range) | 62 (40–71) |
| Sex | |
| Male | 16 (70.0) |
| Female | 7 (30.0) |
| Performance Status | |
| 0 | 9 (39.0) |
| 1 | 14 (61.0) |
| Stage | |
| Locally advanced | 10 (43.5) |
| Metastatic | 13 (56.5) |
| Tumor Location | |
| Oral cavity | 10 (43.5) |
| Oropharynx | 7 (30.4) |
| Larynx | 6 (26.1) |
| Histology | |
| Squamous Cell Carcinoma | 23 (100) |
| Treatment | |
| First Line chemotherapy | 10 (43.5) |
| Nivolumab | 13 (56.5) |
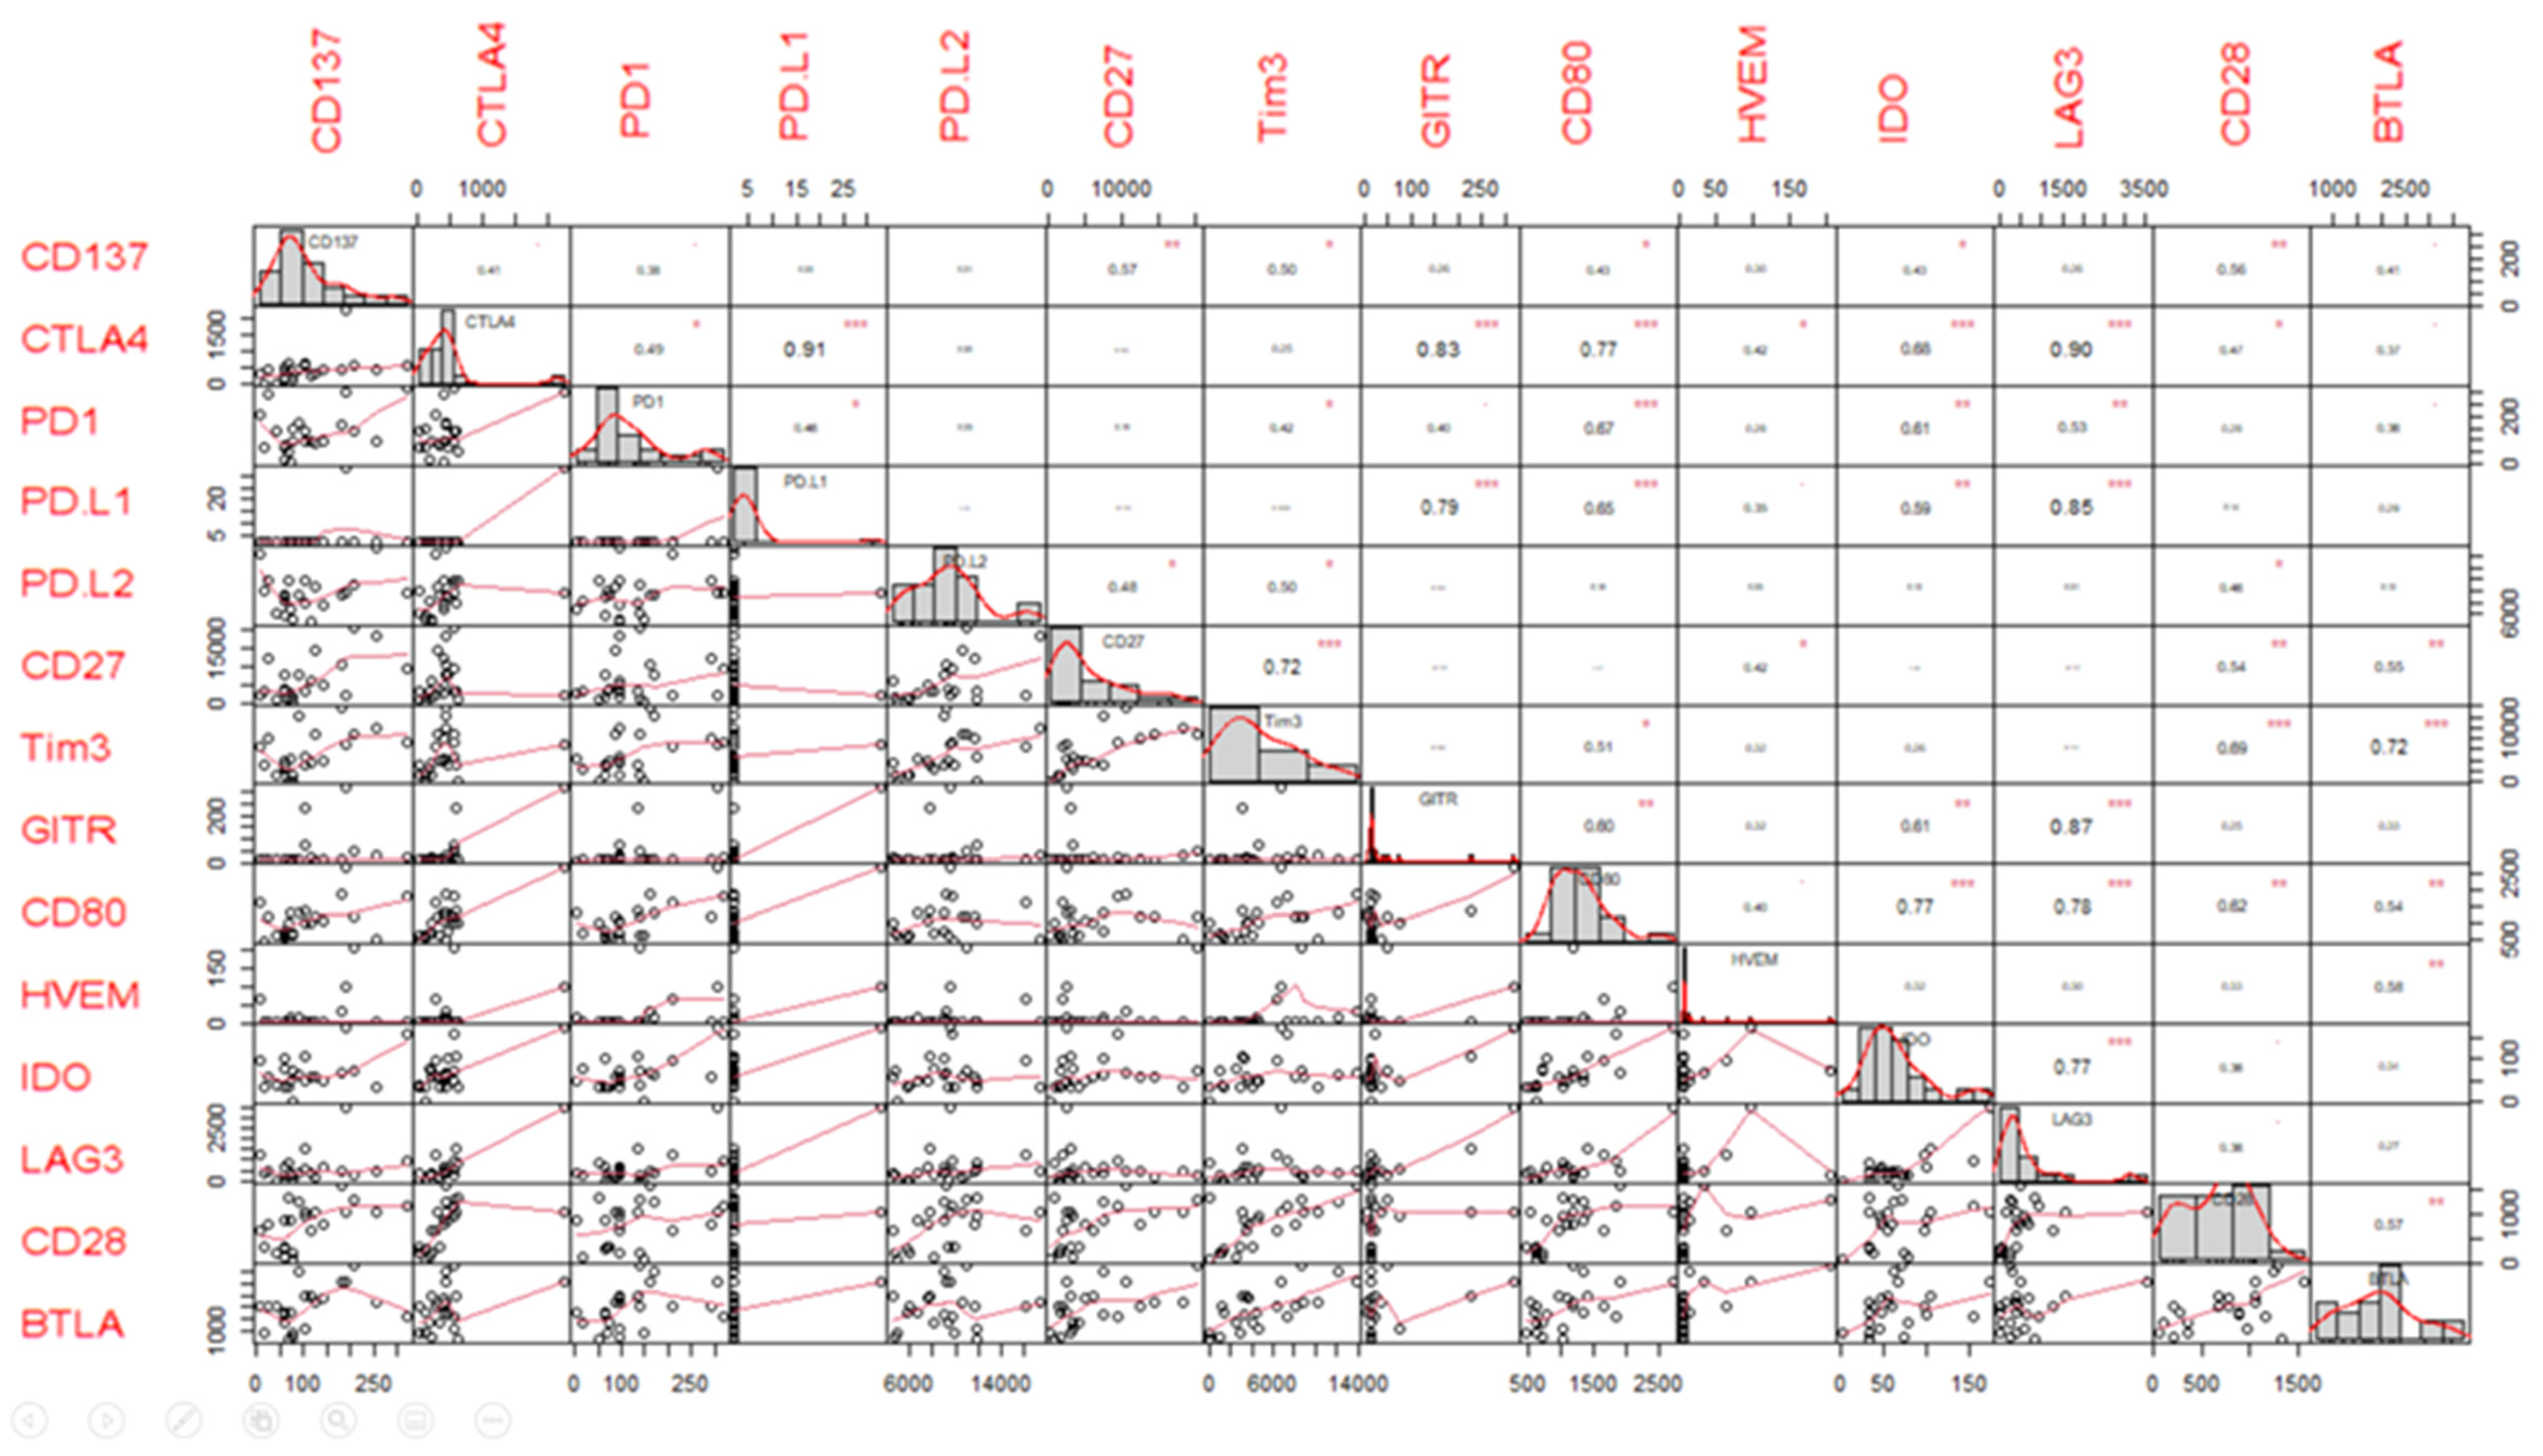
| Variable | Median (pg/mL) | Range (pg/mL) |
|---|---|---|
| BTLA | 2035 | 648–3716 |
| CD137 | 76 | 9–320 |
| CD27 | 3211 | 316–20,449 |
| CD28 | 885 | 60–1580 |
| CD80 | 1019 | 461–2692 |
| CTLA4 | 402 | 4–2269 |
| GITR | 13 | 7–318 |
| HVEM | 6 | 6–206 |
| IDO | 56 | 2–174 |
| LAG3 | 377 | 6–3546 |
| PD-L1 | 2 | 2–33 |
| PD-L2 | 9257 | 4551–17,313 |
| PD-1 | 98 | 4–318 |
| Tim3 | 4028 | 36–13,776 |
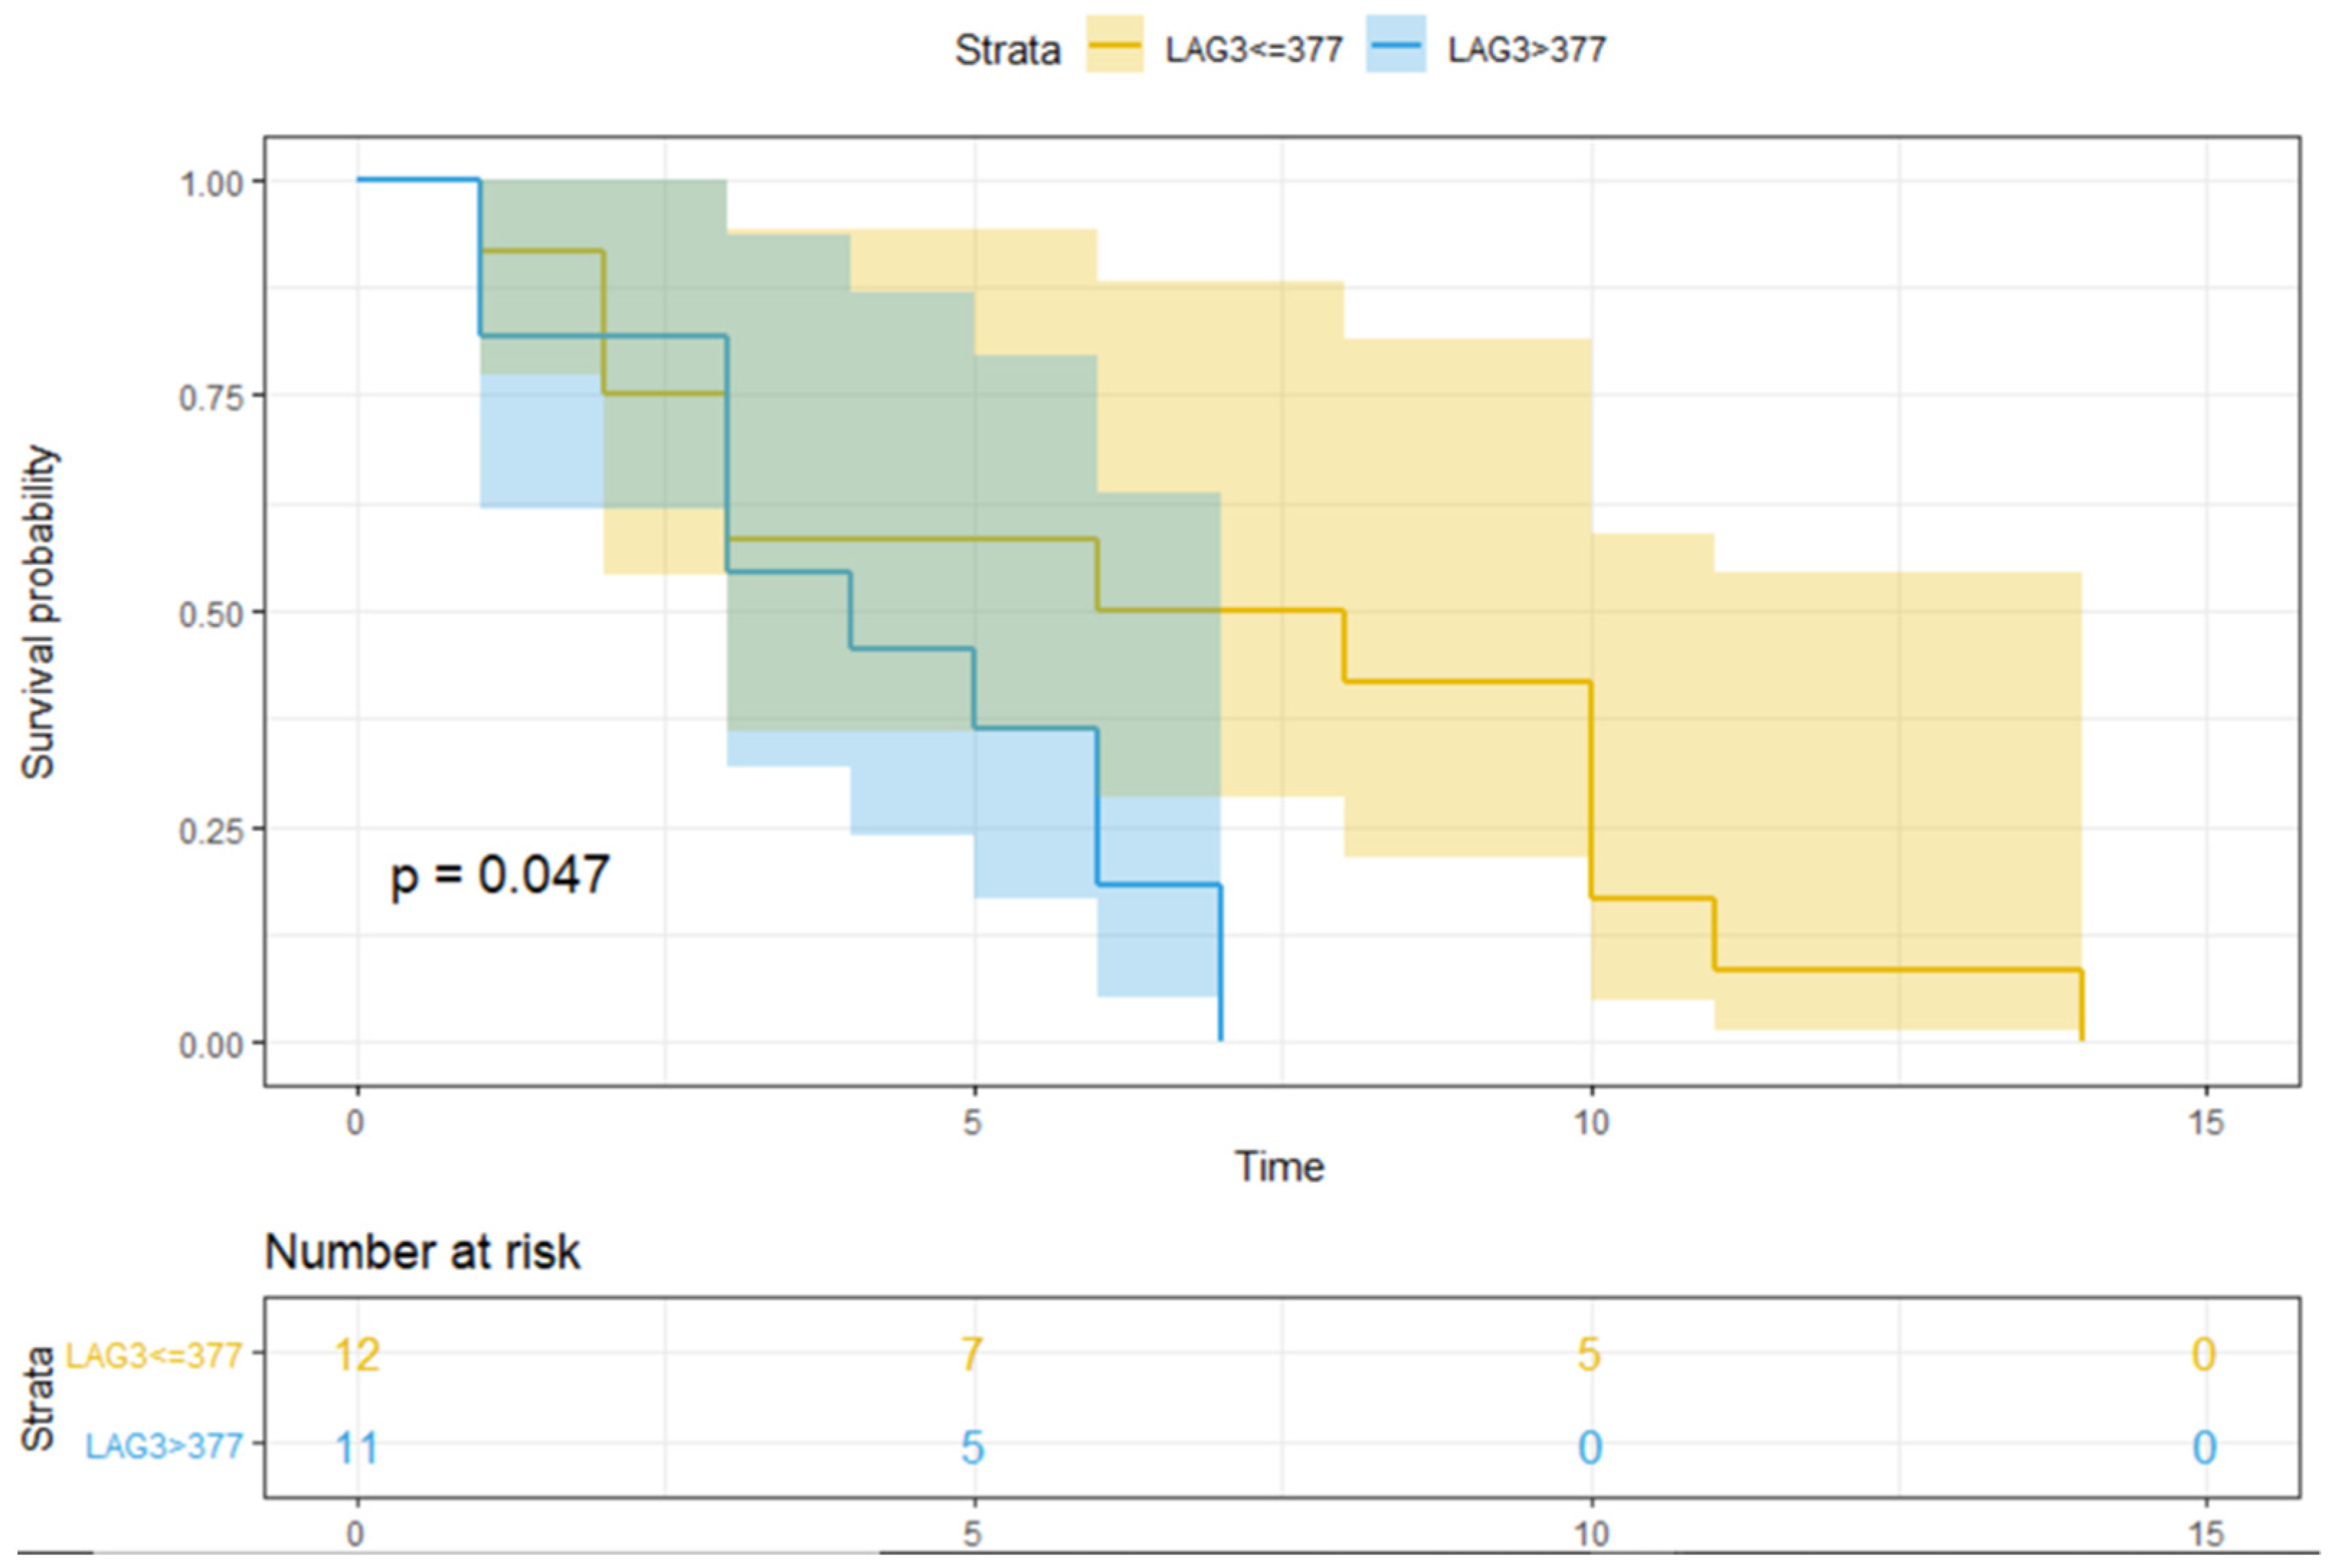
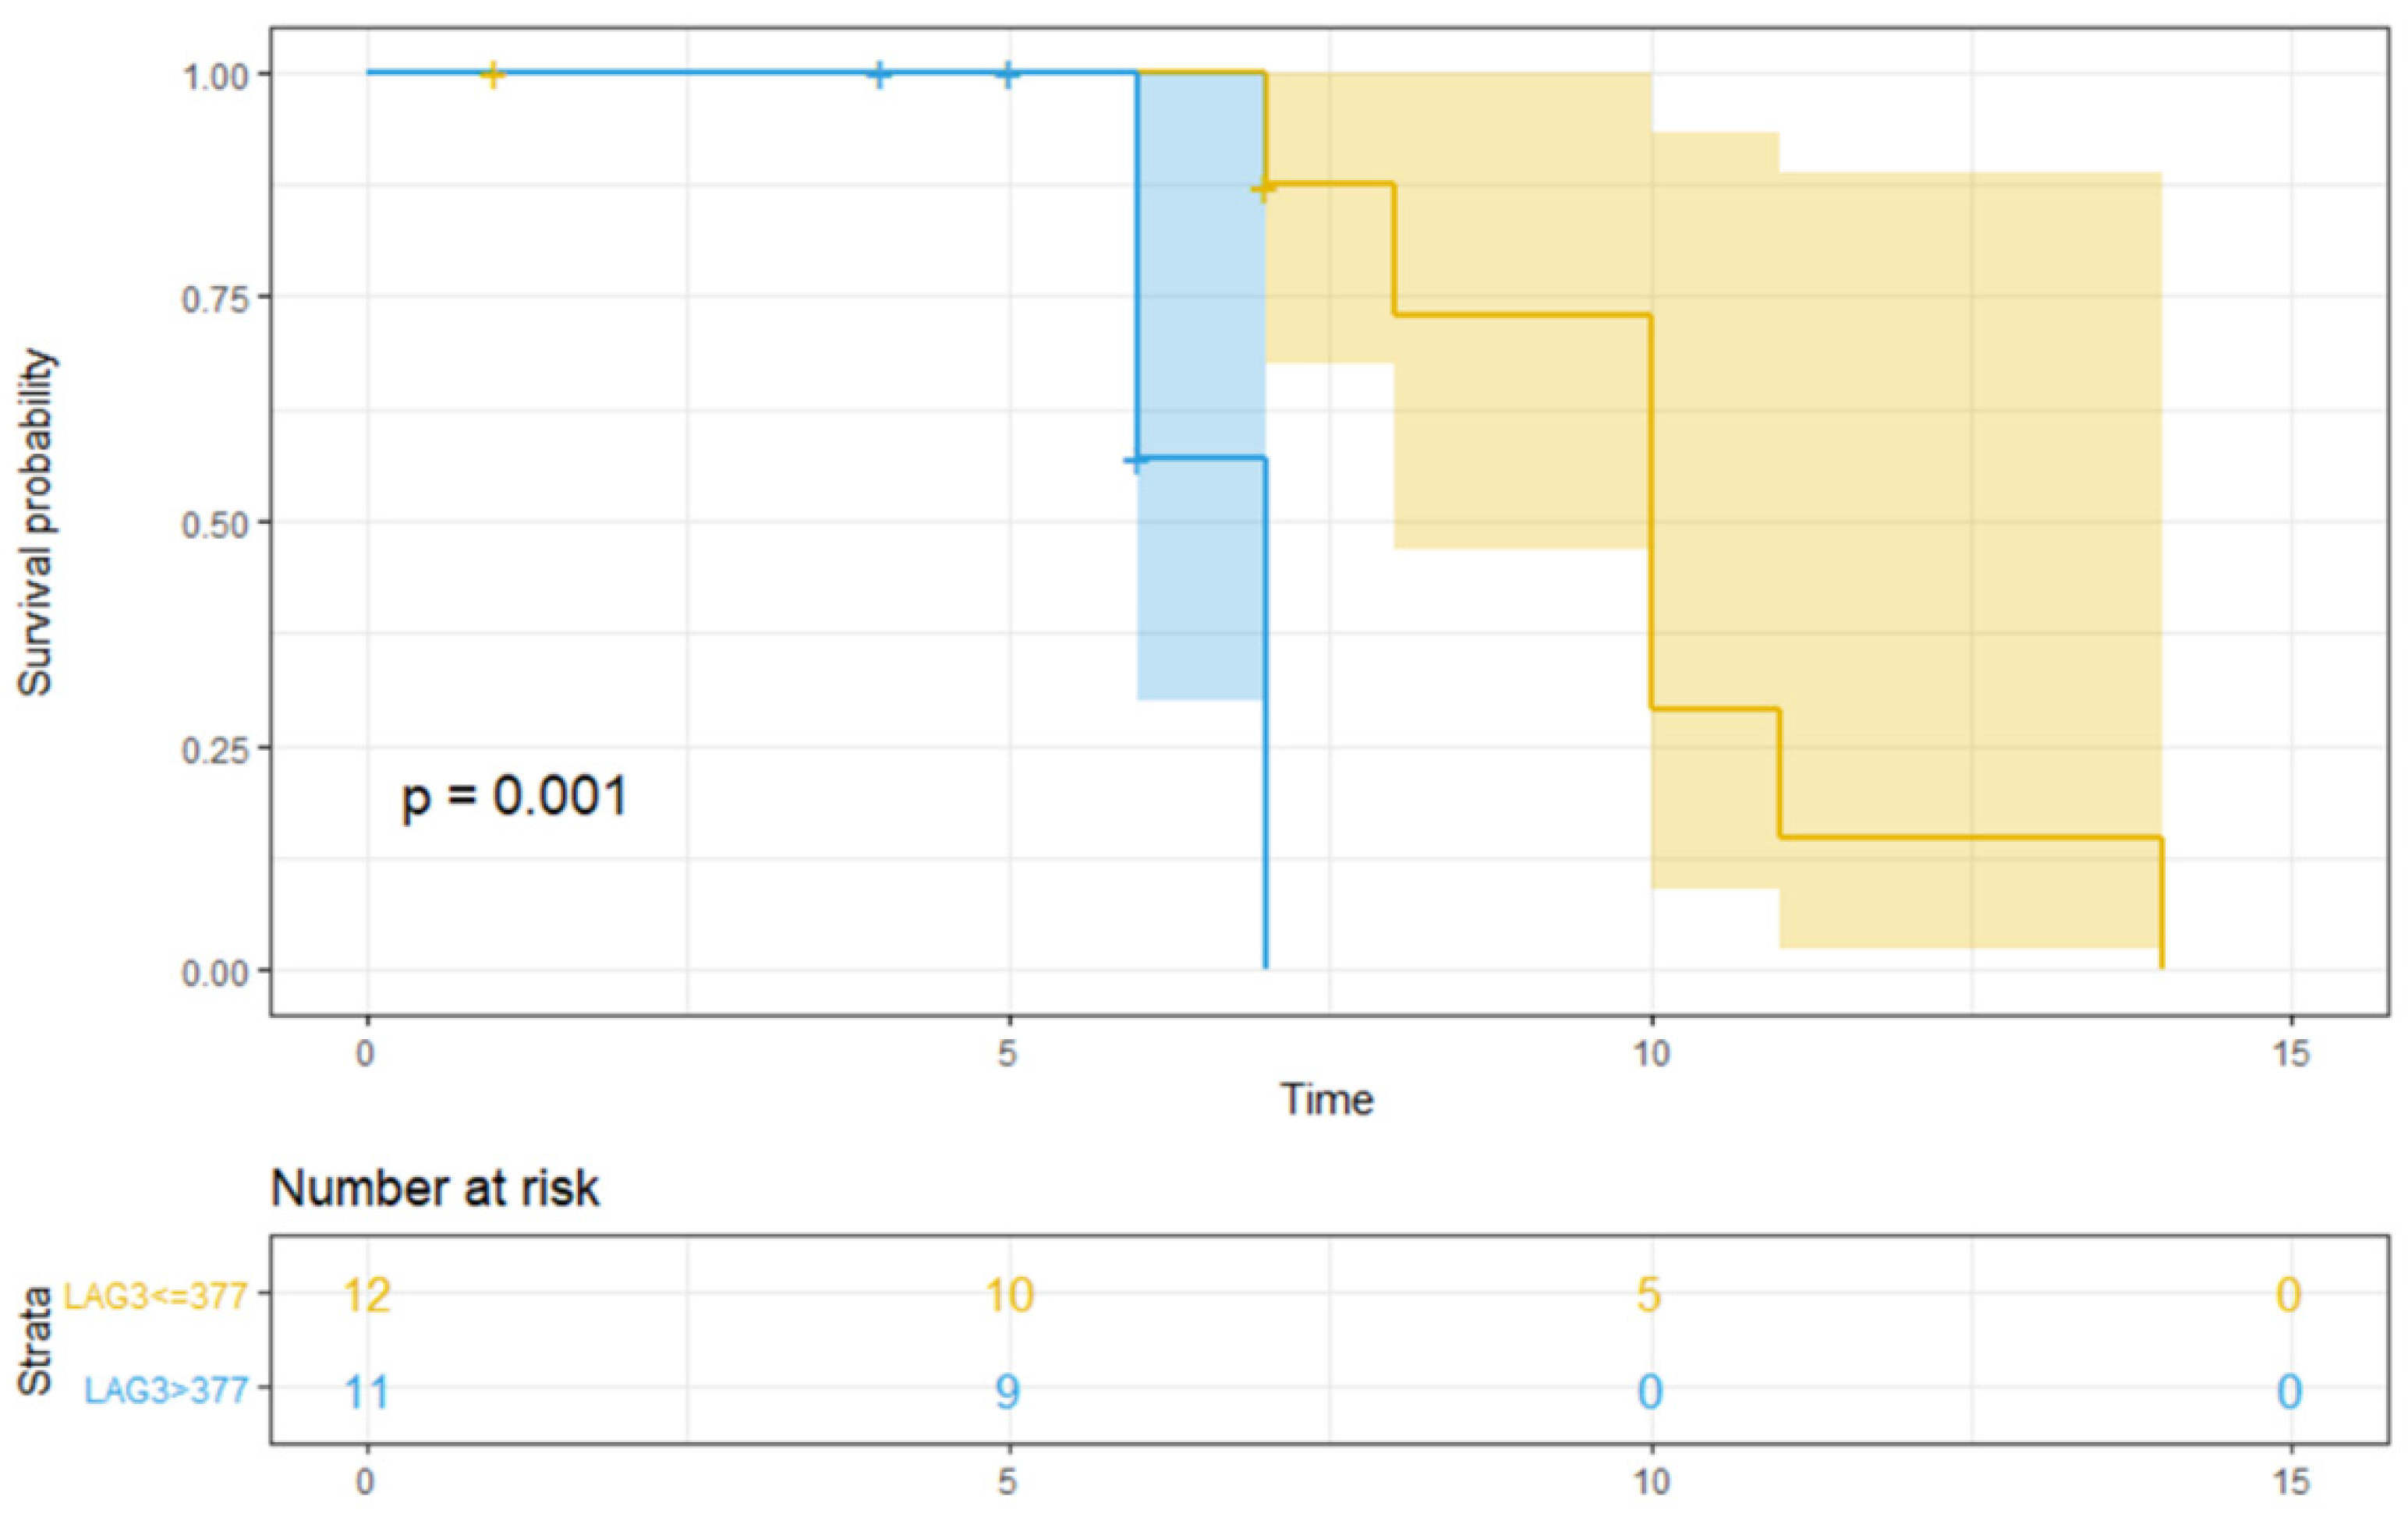
| sICI Median Value (pg/mL) | PFS | OS |
|---|---|---|
| BTLA > 2035 | 0.700 | 1.000 |
| CD137 > 76 | 0.700 | 0.600 |
| CD27 > 3211 | 0.800 | 0.900 |
| CD28 > 885 | 0.700 | 0.400 |
| CD80 > 1019 | 0.700 | 0.700 |
| CTLA4 > 402 | 0.900 | 0.400 |
| GITR > 13 | 0.700 | 0.900 |
| HVEM > 6 | 0.300 | 0.300 |
| IDO > 56 | 1.000 | 0.700 |
| LAG3 > 377 | 0.047 | 0.001 |
| PD-L1 > 2 | 0.800 | 0.500 |
| PD-L2 > 9257 | 0.600 | 0.300 |
| PD-1 > 98 | 0.700 | 0.900 |
| Tim3 > 4028 | 0.700 | 0.600 |
| Endpoint | Variable | β | Exp (β) | 95% CI | p-Value of Model |
|---|---|---|---|---|---|
| PFS | LAG3 > 377 pg/mL | 0.9163 | 2.5 | 0.9152 to 6.8291 | 0.067 |
| OS | LAG3 > 377 pg/mL | 2.4707 | 11.8313 | 1.4118 to 99.1472 | 0.005 |
Publisher’s Note: MDPI stays neutral with regard to jurisdictional claims in published maps and institutional affiliations. |
© 2021 by the authors. Licensee MDPI, Basel, Switzerland. This article is an open access article distributed under the terms and conditions of the Creative Commons Attribution (CC BY) license (https://creativecommons.org/licenses/by/4.0/).
Share and Cite
Botticelli, A.; Zizzari, I.G.; Scagnoli, S.; Pomati, G.; Strigari, L.; Cirillo, A.; Cerbelli, B.; Di Filippo, A.; Napoletano, C.; Scirocchi, F.; et al. The Role of Soluble LAG3 and Soluble Immune Checkpoints Profile in Advanced Head and Neck Cancer: A Pilot Study. J. Pers. Med. 2021, 11, 651. https://doi.org/10.3390/jpm11070651
Botticelli A, Zizzari IG, Scagnoli S, Pomati G, Strigari L, Cirillo A, Cerbelli B, Di Filippo A, Napoletano C, Scirocchi F, et al. The Role of Soluble LAG3 and Soluble Immune Checkpoints Profile in Advanced Head and Neck Cancer: A Pilot Study. Journal of Personalized Medicine. 2021; 11(7):651. https://doi.org/10.3390/jpm11070651
Chicago/Turabian StyleBotticelli, Andrea, Ilaria Grazia Zizzari, Simone Scagnoli, Giulia Pomati, Lidia Strigari, Alessio Cirillo, Bruna Cerbelli, Alessandra Di Filippo, Chiara Napoletano, Fabio Scirocchi, and et al. 2021. "The Role of Soluble LAG3 and Soluble Immune Checkpoints Profile in Advanced Head and Neck Cancer: A Pilot Study" Journal of Personalized Medicine 11, no. 7: 651. https://doi.org/10.3390/jpm11070651
APA StyleBotticelli, A., Zizzari, I. G., Scagnoli, S., Pomati, G., Strigari, L., Cirillo, A., Cerbelli, B., Di Filippo, A., Napoletano, C., Scirocchi, F., Rughetti, A., Nuti, M., Mezi, S., & Marchetti, P. (2021). The Role of Soluble LAG3 and Soluble Immune Checkpoints Profile in Advanced Head and Neck Cancer: A Pilot Study. Journal of Personalized Medicine, 11(7), 651. https://doi.org/10.3390/jpm11070651