
Salivary Biomarkers in COVID-19 Patients: Towards a Wide-Scale Test for Monitoring Disease Activity

 ,
,  ,
, 


Abstract
:1. Introduction
2. Materials and Methods
2.1. Patients and Controls
2.2. Laboratory Testing
2.3. Ethical Consideration
2.4. Statistical Analysis
3. Results
4. Discussion
Supplementary Materials
Author Contributions
Funding
Institutional Review Board Statement
Informed Consent Statement
Data Availability Statement
Acknowledgments
Conflicts of Interest
Abbreviations
| AIC | Akaike’s Information Crite-rion; |
| COVID-19 | coronavirus disease 2019; |
| FP | false positive; |
| FPG | Fondazione Policlinico Universitario Agostino Gemelli IRCCS; |
| IgA | immunoglobulin A; |
| FLC | free light chains; |
| IQR | interquartile ranges; |
| SARS-CoV-2 | severe acute respiratory syndrome coronavirus 2; |
| TP | true positive. |
References
- Hu, B.; Guo, H.; Zhou, P.; Shi, Z.-L. Characteristics of SARS-CoV-2 and COVID-19. Nat. Rev. Microbiol. 2021, 19, 141–154. [Google Scholar] [CrossRef]
- Pisanic, N.; Randad, P.R.; Kruczynski, K.; Manabe, Y.C.; Thomas, D.L.; Pekosz, A.; Klein, S.L.; Betenbaugh, M.J.; Clarke, W.A.; Laeyendecker, O. COVID-19 serology at population scale: SARS-CoV-2-specific antibody responses in saliva. J. Clin. Microbiol. 2020, 59. [Google Scholar] [CrossRef]
- Nurkka, A.; Obiero, J.; Käyhty, H.; Scott, J.A.G. Effects of sample collection and storage methods on antipneumococcal immunoglobulin A in saliva. Clin. Diagn. Lab. Immunol. 2003, 10, 357–361. [Google Scholar] [CrossRef]
- Heaney, J.L.J.; Gleeson, M.; Phillips, A.C.; Taylor, I.M.; Drayson, M.T.; Goodall, M.; He, C.-S.; Svendsen, I.S.; Killer, S.C.; Campbell, J.P. Salivary immunoglobulin free light chains: Reference ranges and responses to exercise in young and older adults. Exerc. Immunol. Rev. 2016, 22, 28–40. [Google Scholar] [PubMed]
- Rapson, A.; Collman, E.; Faustini, S.; Yonel, Z.; Chapple, I.L.; Drayson, M.T.; Richter, A.; Campbell, J.P.; Heaney, J.L.J. Free light chains as an emerging biomarker in saliva: Biological variability and comparisons with salivary IgA and steroid hormones. Brain. Behav. Immun. 2020, 83, 78–86. [Google Scholar] [CrossRef]
- Hansen, I.S.; Baeten, D.L.P.; den Dunnen, J. The inflammatory function of human IgA. Cell. Mol. Life Sci. 2019, 76, 1041–1055. [Google Scholar] [CrossRef] [PubMed]
- Schauer, U.; Stemberg, F.; Rieger, C.H.L.; Borte, M.; Schubert, S.; Riedel, F.; Herz, U.; Renz, H.; Wick, M.; Herzog, W. Establishment of age-dependent reference values for IgA subclasses. Clin. Chim. Acta 2003, 328, 129–133. [Google Scholar] [CrossRef]
- Steffen, U.; Koeleman, C.A.; Sokolova, M.V.; Bang, H.; Kleyer, A.; Rech, J.; Unterweger, H.; Schicht, M.; Garreis, F.; Hahn, J.; et al. IgA subclasses have different effector functions associated with distinct glycosylation profiles. Nat. Commun. 2020, 11, 1–12. [Google Scholar] [CrossRef] [PubMed]
- Campbell, J.P.; Turner, J.E. Debunking the myth of exercise-induced immune suppression: Redefining the impact of exercise on immunological health across the lifespan. Front. Immunol. 2018, 9, 648. [Google Scholar] [CrossRef]
- Gleeson, M.; Pyne, D.B.; Elkington, L.J.; Hall, S.T.; Attia, J.R.; Oldmeadow, C.; Wood, L.G.; Callister, R. Developing a multi-component immune model for evaluating the risk of respiratory illness in athletes. Exerc. Immunol. Rev. 2017, 23, 52–64. [Google Scholar] [PubMed]
- Gulli, F.; Napodano, C.; Marino, M.; Ciasca, G.; Pocino, K.; Basile, V.; Visentini, M.; Stefanile, A.; Todi, L.; De Spirito, M.; et al. Serum immunoglobulin free light chain levels in systemic autoimmune rheumatic diseases. Clin. Exp. Immunol. 2020, 199, 163–171. [Google Scholar] [CrossRef]
- Napodano, C.; Pocino, K.; Rigante, D.; Stefanile, A.; Gulli, F.; Marino, M.; Basile, V.; Rapaccini, G.L.; Basile, U. Free light chains and autoimmunity. Autoimmun. Rev. 2019, 18, 484–492. [Google Scholar] [CrossRef]
- Basile, U.; Marino, M.; Gragnani, L.; Napodano, C.; Gulli, F.; Pocino, K.; Lorini, S.; Santini, S.A.; Basile, V.; Miele, L.; et al. Sentinel biomarkers in HCV positive patients with mixed cryoglobulinemia. J. Immunol. Methods 2020, 476, 112687. [Google Scholar] [CrossRef]
- Basile, U.; Bruno, C.; Napodano, C.; Vergani, E.; Pocino, K.; Brunetti, A.; Gulli, F.; Santini, S.A.; Mancini, A. Plasmatic free light chains as inflammatory marker in insulin resistance: Comparison of metabolic syndrome with adult growth hormone deficiency. BioFactors 2018, 44, 480–484. [Google Scholar] [CrossRef]
- R Core Team. R: A Language and Environment for Statistical Computing. 2013. Available online: https://cran.microsoft.com/snapshot/2014-09-08/web/packages/dplR/vignettes/xdate-dplR.pdf (accessed on 15 October 2020).
- Minelli, E.; Ciasca, G.; Sassun, T.E.; Antonelli, M.; Palmieri, V.; Papi, M.; Maulucci, G.; Santoro, A.; Giangaspero, F.; Delfini, R.; et al. A fully-automated neural network analysis of AFM force-distance curves for cancer tissue diagnosis. Appl. Phys. Lett. 2017, 111, 143701. [Google Scholar] [CrossRef]
- Ciasca, G.; Sassun, T.E.; Minelli, E.; Antonelli, M.; Papi, M.; Santoro, A.; Giangaspero, F.; Delfini, R.; De Spirito, M. Nano-mechanical signature of brain tumours. Nanoscale 2016, 8, 19629–19643. [Google Scholar] [CrossRef]
- Basile, U.; Miele, L.; Napodano, C.; Ciasca, G.; Gulli, F.; Pocino, K.; De Matthaeis, N.; Liguori, A.; De Magistris, A.; Marrone, G.; et al. The diagnostic performance of PIVKA-II in metabolic and viral hepatocellular carcinoma: A pilot study. Eur. Rev. Med. Pharmacol. Sci. 2020, 24, 12675–12685. [Google Scholar] [PubMed]
- Pocino, K.; Napodano, C.; Gragnani, L.; Ciasca, G.; Colantuono, S.; Marri, S.; Vantaggio, L.; Gulli, F.; Lorini, S.; Barini, A.; et al. Solving the mystery of HBV related mixed cryoglobulinemia: Potential biomarkers of disease progression. Rheumatology 2021. [Google Scholar] [CrossRef]
- Taylor, R. Interpretation of the correlation coefficient: A basic review. J. Diagn. Med. Sonogr. 1990, 6, 35–39. [Google Scholar] [CrossRef]
- Wei, T.; Simko, V.; Levy, M.; Xie, Y.; Jin, Y.; Zemla, J. Package ‘corrplot’. Statistician 2017, 56, e24. [Google Scholar]
- Gasparini, G.; Saponaro, G.; Todaro, M.; Ciasca, G.; Cigni, L.; Doneddu, P.; Azzuni, C.; Enrico, F.; De Angelis, P.; Barbera, G.; et al. Functional Upper Airway Space Endoscopy: A Prognostic Indicator in Obstructive Sleep Apnea Treatment with Mandibular Advancement Devices. Int. J. Environ. Res. Public Health 2021, 18, 2393. [Google Scholar] [CrossRef] [PubMed]
- Matsumori, A.; Shimada, T.; Shimada, M.; Drayson, M.T. Immunoglobulin free light chains: An inflammatory biomarker of diabetes. Inflamm. Res. 2020, 69, 715–718. [Google Scholar] [CrossRef] [PubMed]
- Brandtzaeg, P. Secretory IgA: Designed for anti-microbial defense. Front. Immunol. 2013, 4, 222. [Google Scholar] [CrossRef] [PubMed]
- Ljungberg, K.R.; Börjesson, E.; Martinsson, K.; Wetterö, J.; Kastbom, A.; Svärd, A. Presence of salivary IgA anti-citrullinated protein antibodies associate with higher disease activity in patients with rheumatoid arthritis. Arthritis Res. Ther. 2020, 22, 1–10. [Google Scholar]
- Aita, A.; Basso, D.; Cattelan, A.M.; Fioretto, P.; Navaglia, F.; Barbaro, F.; Stoppa, A.; Coccorullo, E.; Farella, A.; Socal, A. SARS-CoV-2 identification and IgA antibodies in saliva: One sample two tests approach for diagnosis. Clin. Chim. Acta 2020, 510, 717–722. [Google Scholar] [CrossRef]
- Varadhachary, A.; Chatterjee, D.; Garza, J.; Garr, R.P.; Foley, C.; Letkeman, A.F.; Dean, J.; Haug, D.; Breeze, J.; Traylor, R. Salivary anti-SARS-CoV-2 IgA as an accessible biomarker of mucosal immunity against COVID-19. MedRxiv 2020. [Google Scholar] [CrossRef]
- Nakano, T.; Matsui, M.; Inoue, I.; Awata, T.; Katayama, S.; Murakoshi, T. Free immunoglobulin light chain: Its biology and implications in diseases. Clin. Chim. Acta 2011, 412, 843–849. [Google Scholar] [CrossRef]
- Redegeld, F.A.; van der Heijden, M.W.; Kool, M.; Heijdra, B.M.; Garssen, J.; Kraneveld, A.D.; Van Loveren, H.; Roholl, P.; Saito, T.; Verbeek, J.S.; et al. Immunoglobulin-free light chains elicit immediate hypersensitivity-like responses. Nat. Med. 2002, 8, 694–701. [Google Scholar] [CrossRef]
- Bryce, P.J.; Miller, M.L.; Miyajima, I.; Tsai, M.; Galli, S.J.; Oettgen, H.C. Immune sensitization in the skin is enhanced by antigen-independent effects of IgE. Immunity 2004, 20, 381–392. [Google Scholar] [CrossRef]
- Basile, U.; Gulli, F.; Gragnani, L.; Napodano, C.; Pocino, K.; Rapaccini, G.L.; Mussap, M.; Zignego, A.L. Free light chains: Eclectic multipurpose biomarker. J. Immunol. Methods 2017, 451, 11–19. [Google Scholar] [CrossRef] [PubMed]
- Artifoni, M.; Danic, G.; Gautier, G.; Gicquel, P.; Boutoille, D.; Raffi, F.; Néel, A.; Lecomte, R. Systematic assessment of venous thromboembolism in COVID-19 patients receiving thromboprophylaxis: Incidence and role of D-dimer as predictive factors. J. Thromb. Thrombolysis 2020, 50, 211–216. [Google Scholar] [CrossRef] [PubMed]
- Long, H.; Nie, L.; Xiang, X.; Li, H.; Zhang, X.; Fu, X.; Ren, H.; Liu, W.; Wang, Q.; Wu, Q. D-dimer and prothrombin time are the significant indicators of severe COVID-19 and poor prognosis. BioMed Res. Int. 2020, 2020. [Google Scholar] [CrossRef] [PubMed]
- Paliogiannis, P.; Mangoni, A.A.; Dettori, P.; Nasrallah, G.K.; Pintus, G.; Zinellu, A. D-dimer concentrations and COVID-19 severity: A systematic review and meta-analysis. Front. Public Health 2020, 8, 432. [Google Scholar] [CrossRef] [PubMed]
- Liu, T.; Zhang, J.; Yang, Y.; Zhang, L.; Ma, H.; Li, Z.; Zhang, J.; Cheng, J.; Zhang, X.; Wu, G.; et al. The potential role of IL-6 in monitoring coronavirus disease 2019. SSRN Electron. J. 2020. [Google Scholar] [CrossRef]
- Huang, I.; Pranata, R.; Lim, M.A.; Oehadian, A.; Alisjahbana, B. C-reactive protein, procalcitonin, D-dimer, and ferritin in severe coronavirus disease-2019: A meta-analysis. Ther. Adv. Respir. Dis. 2020, 14, 1753466620937175. [Google Scholar] [CrossRef] [PubMed]
- Yao, Y.; Cao, J.; Wang, Q.; Shi, Q.; Liu, K.; Luo, Z.; Chen, X.; Chen, S.; Yu, K.; Huang, Z. D-dimer as a biomarker for disease severity and mortality in COVID-19 patients: A case control study. J. Intensive Care 2020, 8, 1–11. [Google Scholar] [CrossRef]

| Patients (n = 29) | Male (n = 17) | Female (n = 12) | |
|---|---|---|---|
| Age (Mean ± SD) | 49.7 ± 10.6 | 49.2 ± 13.6 | 50.3 ± 4.8 |
| Smoke (%) | 20.7 | 18.8 | 25.0 |
| Diabetes (%) | 10.7 | 12.5 | 8.3 |
| Hypertension (%) | 21.4 | 31.3 | 8.3 |
| Obesity (%) | 14.3 | 18.8 | 8.3 |
| Cardiopathy (%) | 14.3 | 18.8 | 8.3 |
| Oncology History (%) | 7.1 | 6.3 | 8.3 |
| Fever (%) | 78.6 | 81.3 | 75.0 |
| Cough (%) | 25.0 | 25.0 | 25.0 |
| Dyspnea (%) | 25.0 | 18.8 | 33.3 |
| Asthenia (%) | 26.0 | 37.5 | 33.3 |
| Pneumonia (%) | 75.0 | 81.3 | 66.7 |
| Oxygen Therapy (%) | 39.3 | 31.3 | 50.0 |
| CTRL | Patients | |||||||
|---|---|---|---|---|---|---|---|---|
| Analyte | Sample/ Reference Value | n | Median | IQR | n | Median | IQR | p-Value |
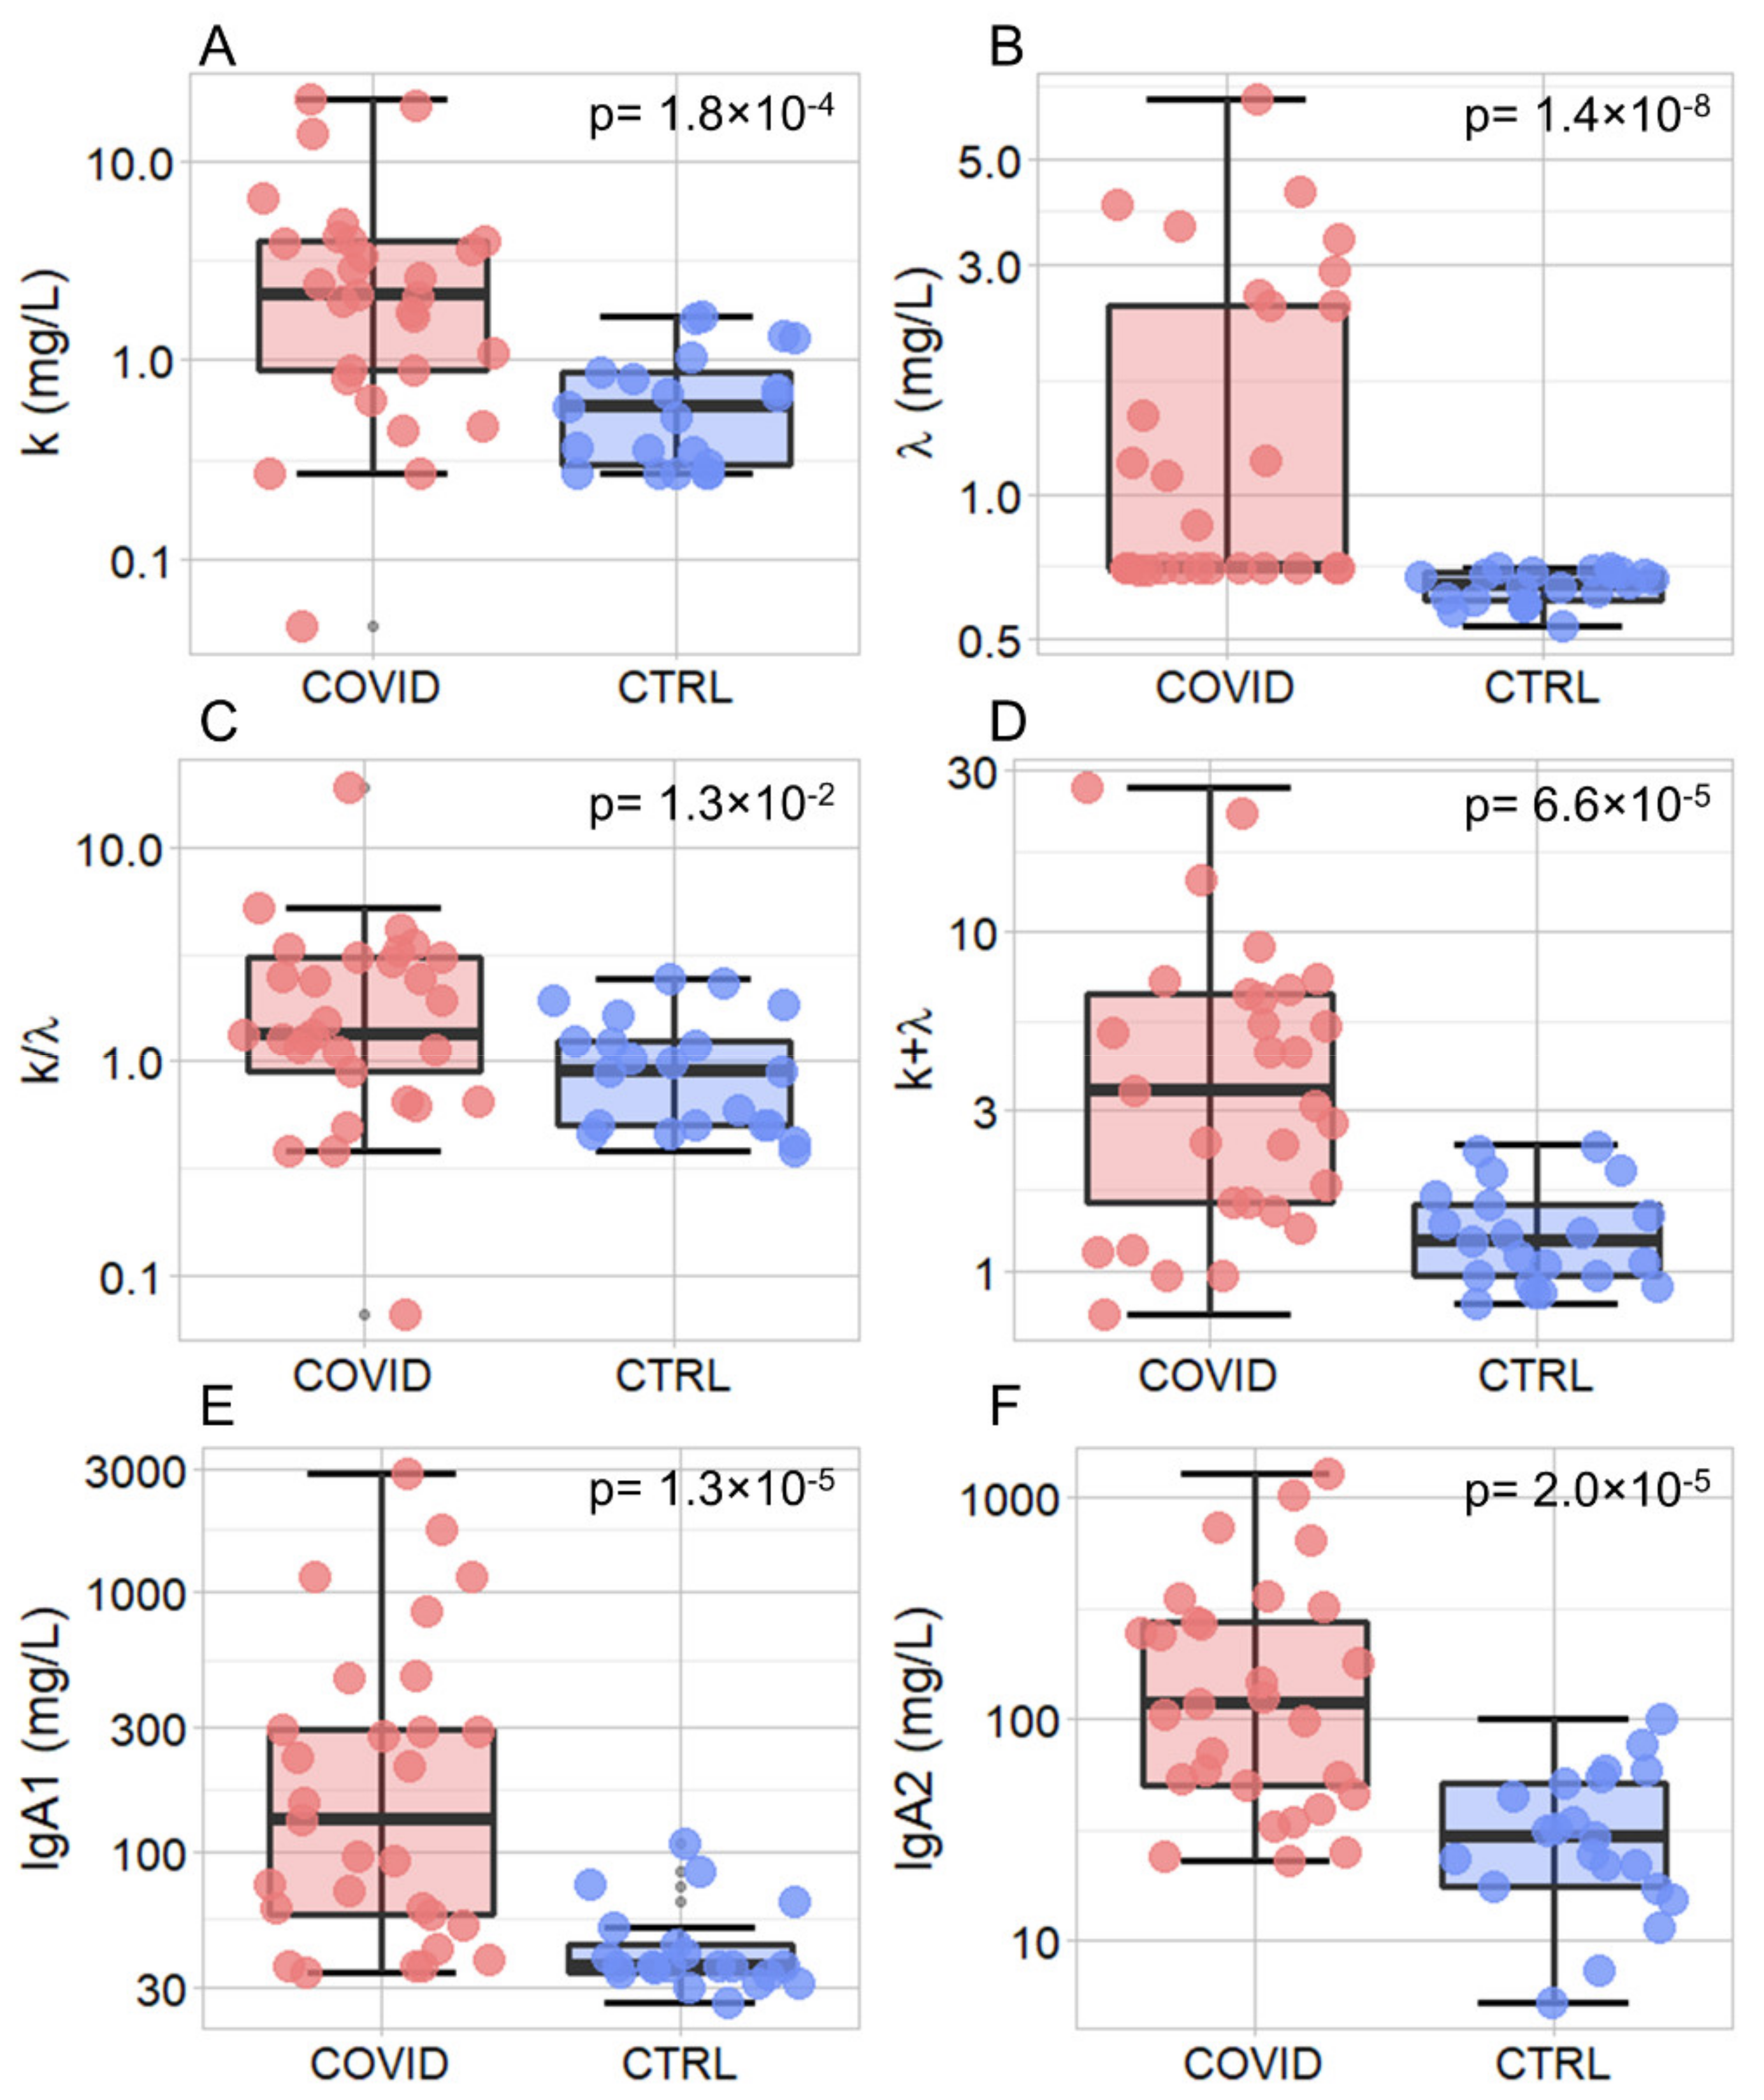
| k (mg/L) | Saliva | 21 | 0.58 | 0.56 | 29 | 2.12 | 3.03 | 1.80 × 10−04 |
| λ (mg/L) | Saliva | 21 | 0.65 | 0.09 | 29 | 0.70 | 1.77 | 1.40 × 10−08 |
| k/λ | Saliva | 21 | 0.91 | 0.75 | 29 | 1.35 | 2.15 | 1.30 × 10−02 |
| K + λ (mg/L) | Saliva | 21 | 1.22 | 0.59 | 29 | 3.43 | 5.00 | 6.60 × 10−05 |
| IgA1 (mg/L) | Saliva | 21 | 36.30 | 9.70 | 29 | 133.10 | 237.10 | 1.30 × 10−05 |
| IgA2 (mg/L) | Saliva | 21 | 29.70 | 33.60 | 29 | 118.80 | 227.20 | 2.00 × 10−05 |
| Ferritin (ng/mL) | Serum/ 30–300 ng/mL | − | − | − | 27 | 432.00 | 286.00 | − |
| IL-6 (ng/L) | Serum/ <7 ng/L | − | − | − | 22 | 11.45 | 10.22 | − |
| CRP (mg/L) | Serum/ 3–10 mg/L | − | − | − | 25 | 28.60 | 42.50 | − |
| D-Dimer (ng/mL) | Serum/ <250 ng/mL | − | − | − | 28 | 437.50 | 393.75 | − |
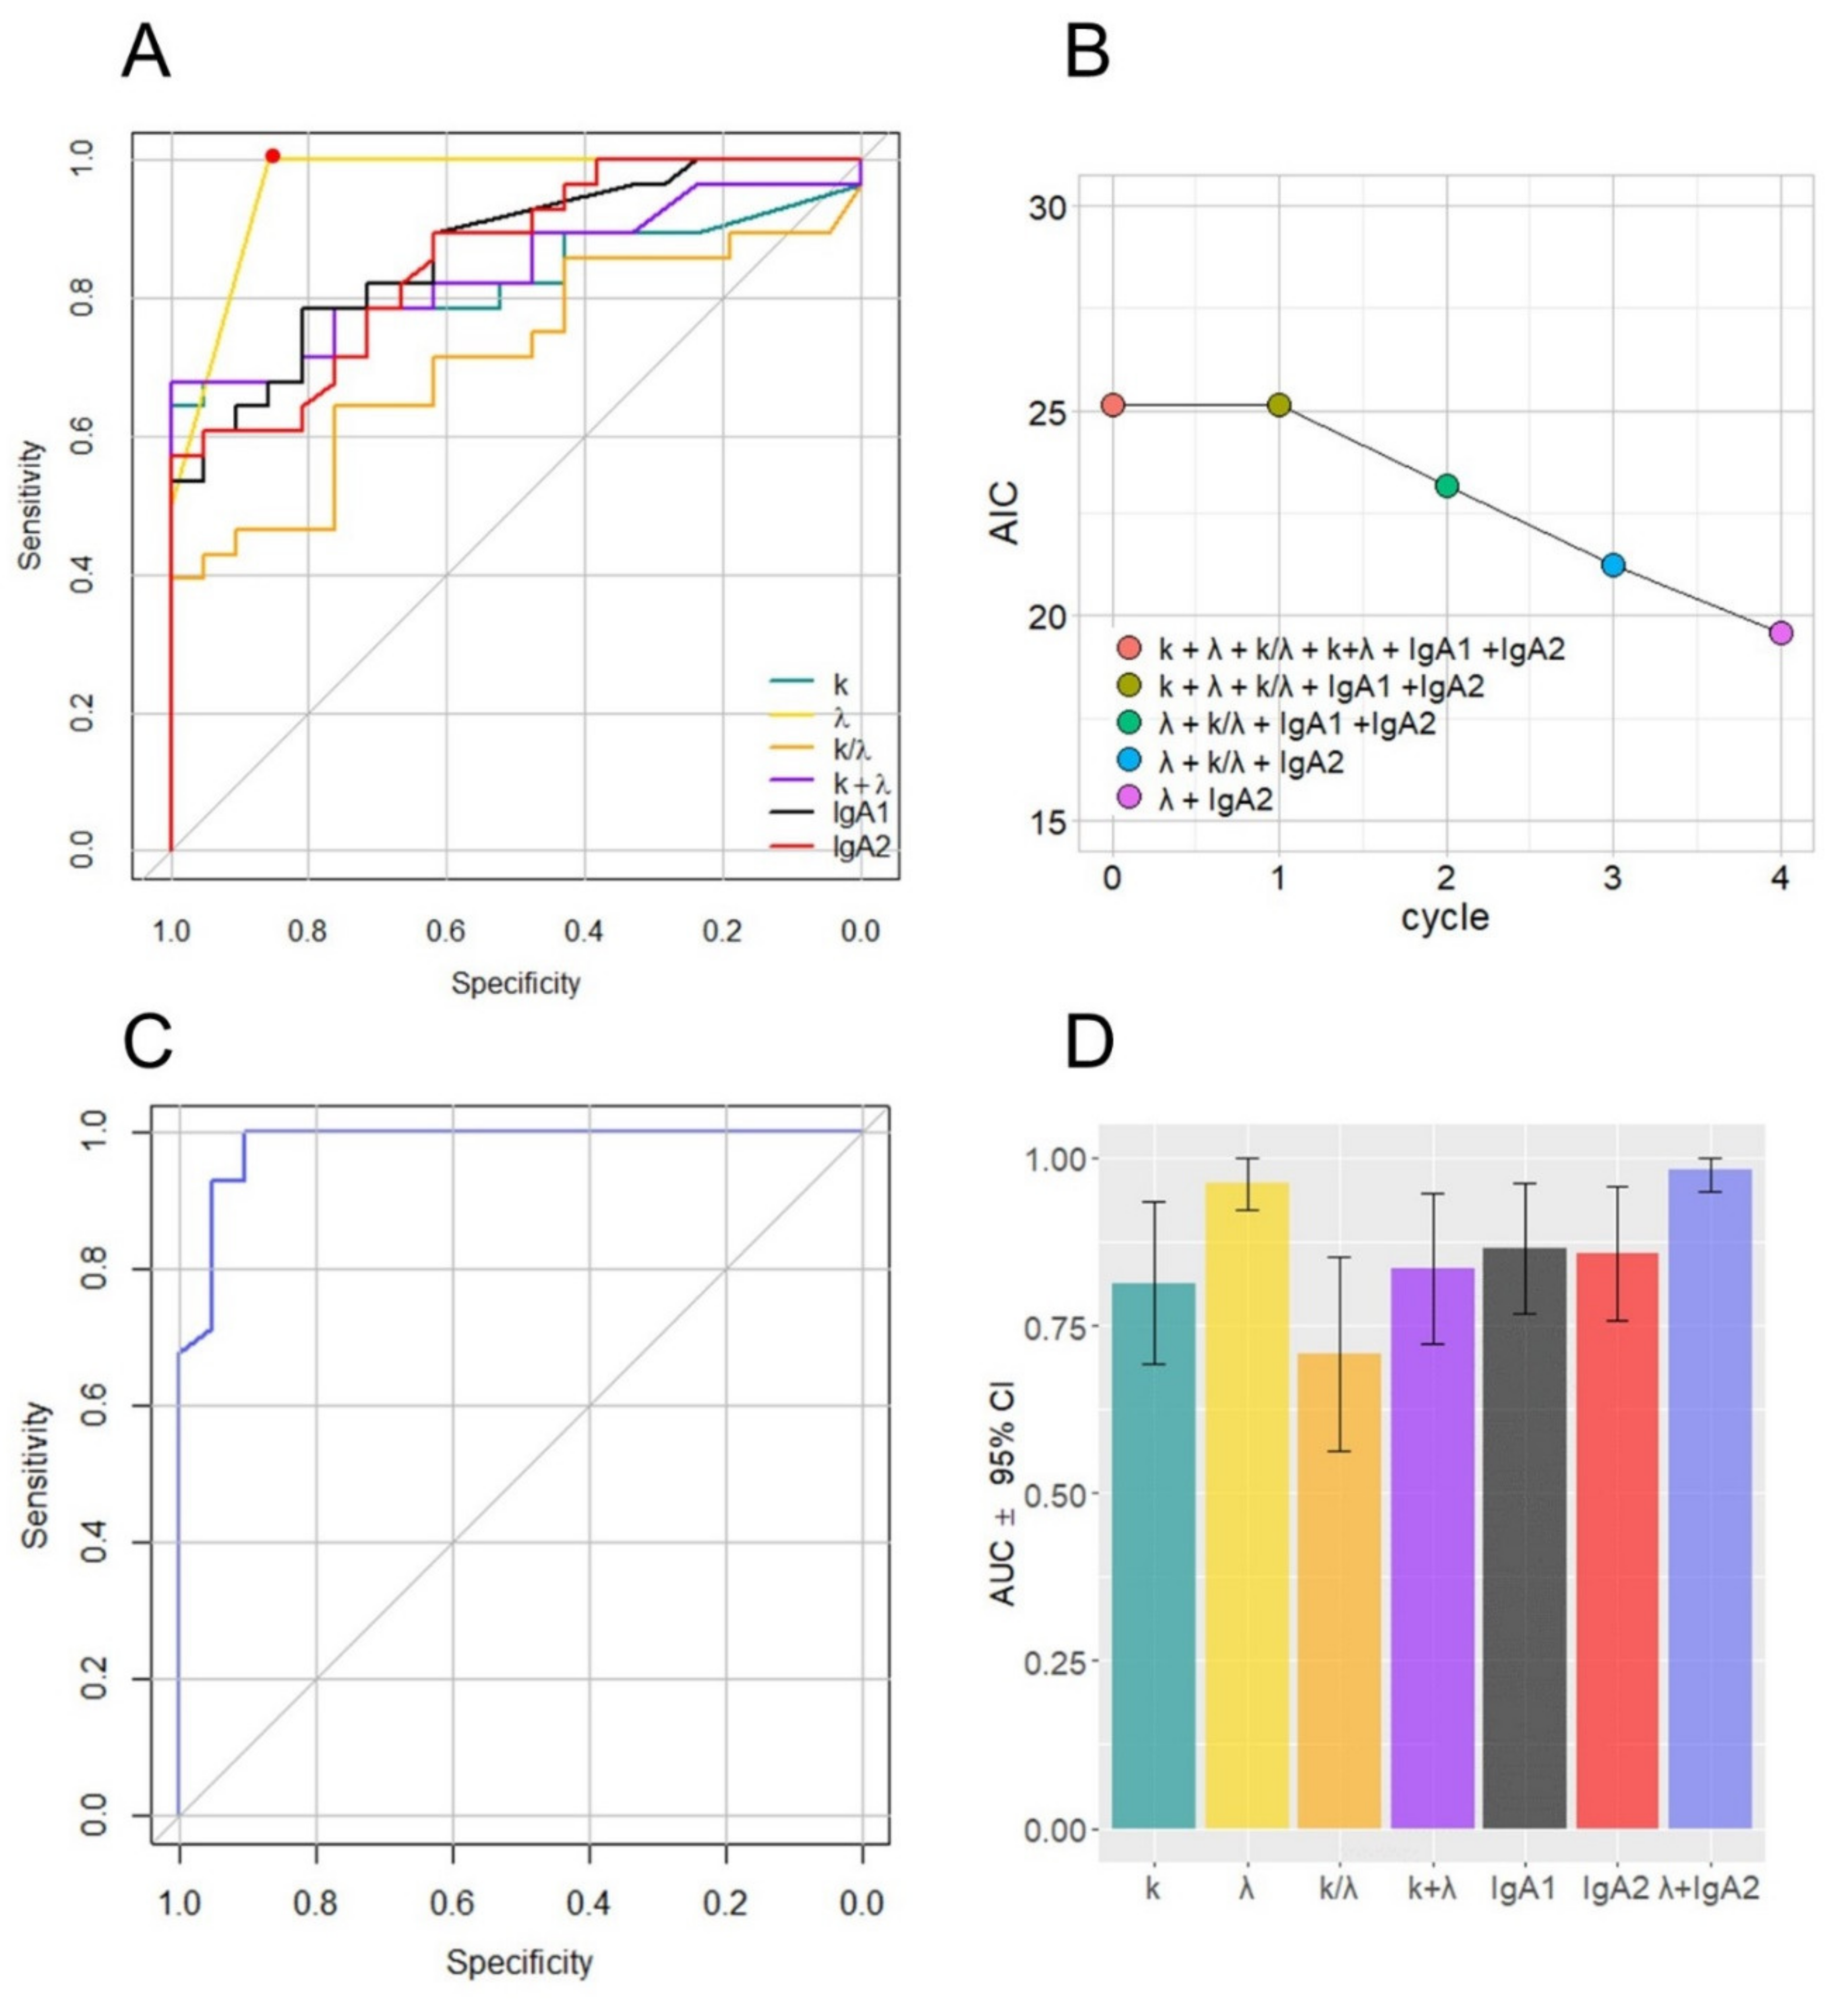
| Parameter | AUC (95% CI) |
|---|---|
| k | 0.81 (0.69–0.93) |
| λ | 0.96 (0.92–1.00) |
| k/λ | 0.70 (0.56–0.85) |
| k + λ | 0.83 (0.72–0.94) |
| IgA1 | 0.86 (0.76–0.96) |
| IgA2 | 0.85 (0.75–0.95) |
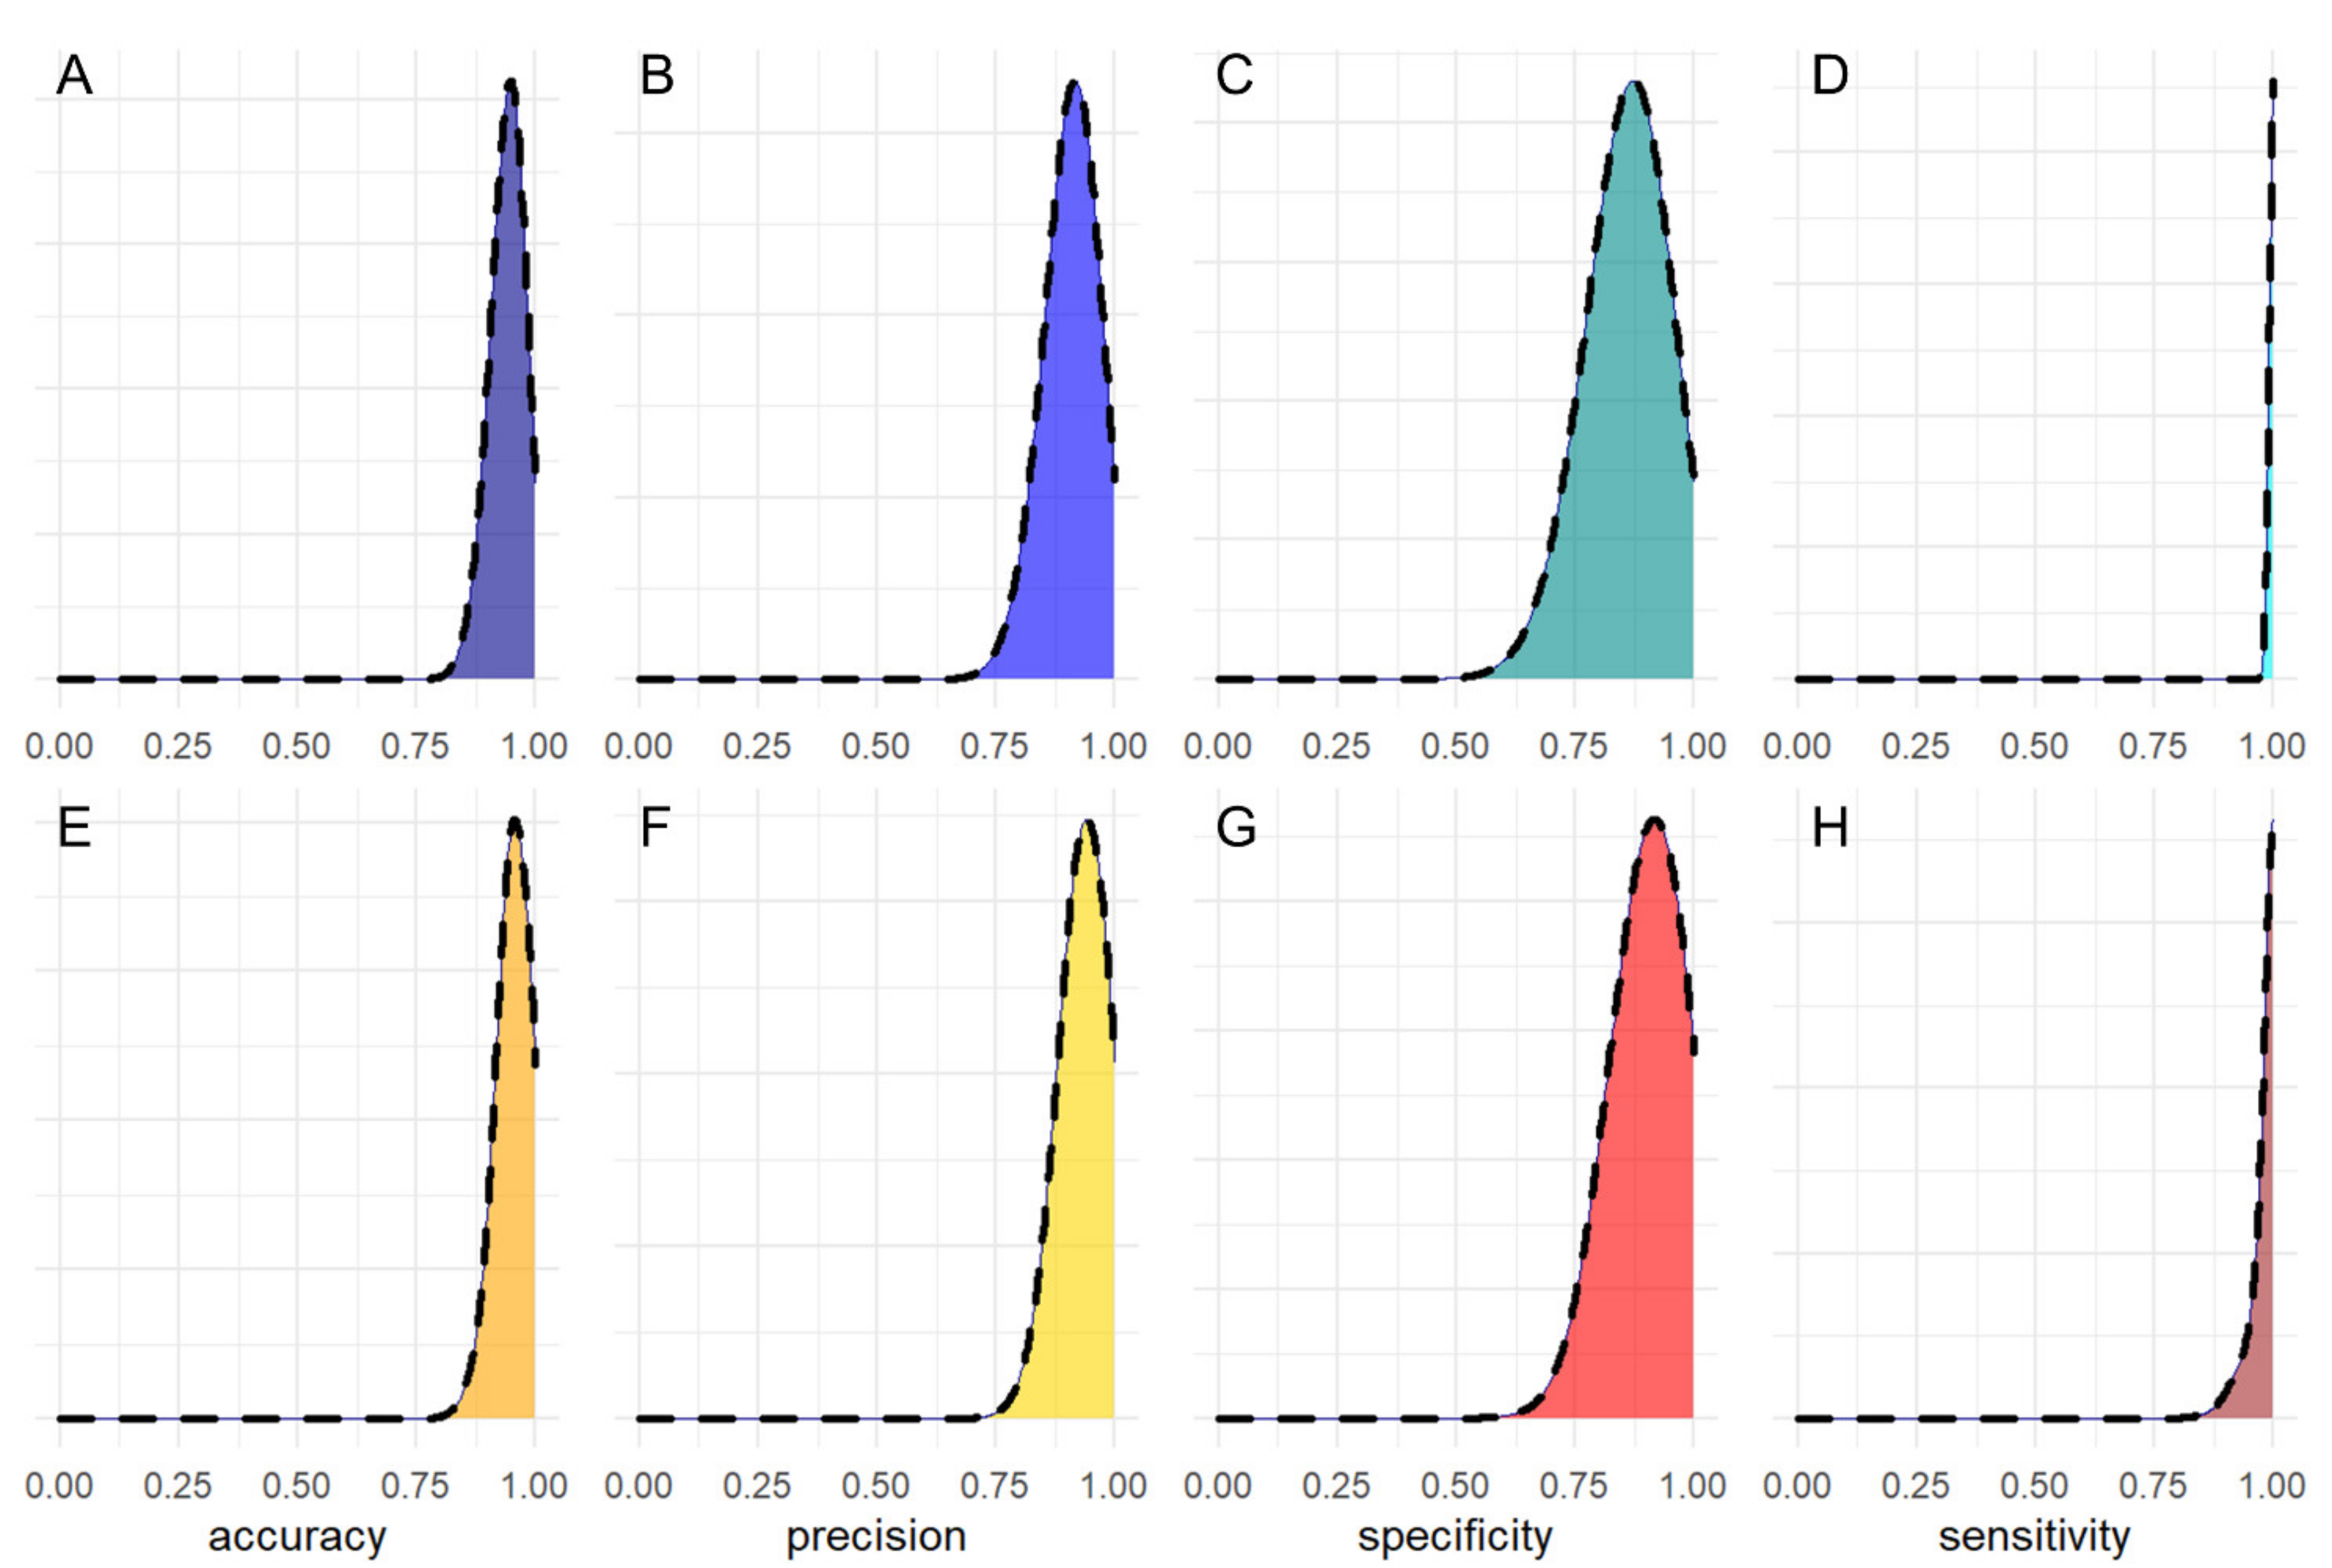
| λ + IgA2 | 0.98 (0.95–1.00) |
| Groups | Coefficient | p |
|---|---|---|
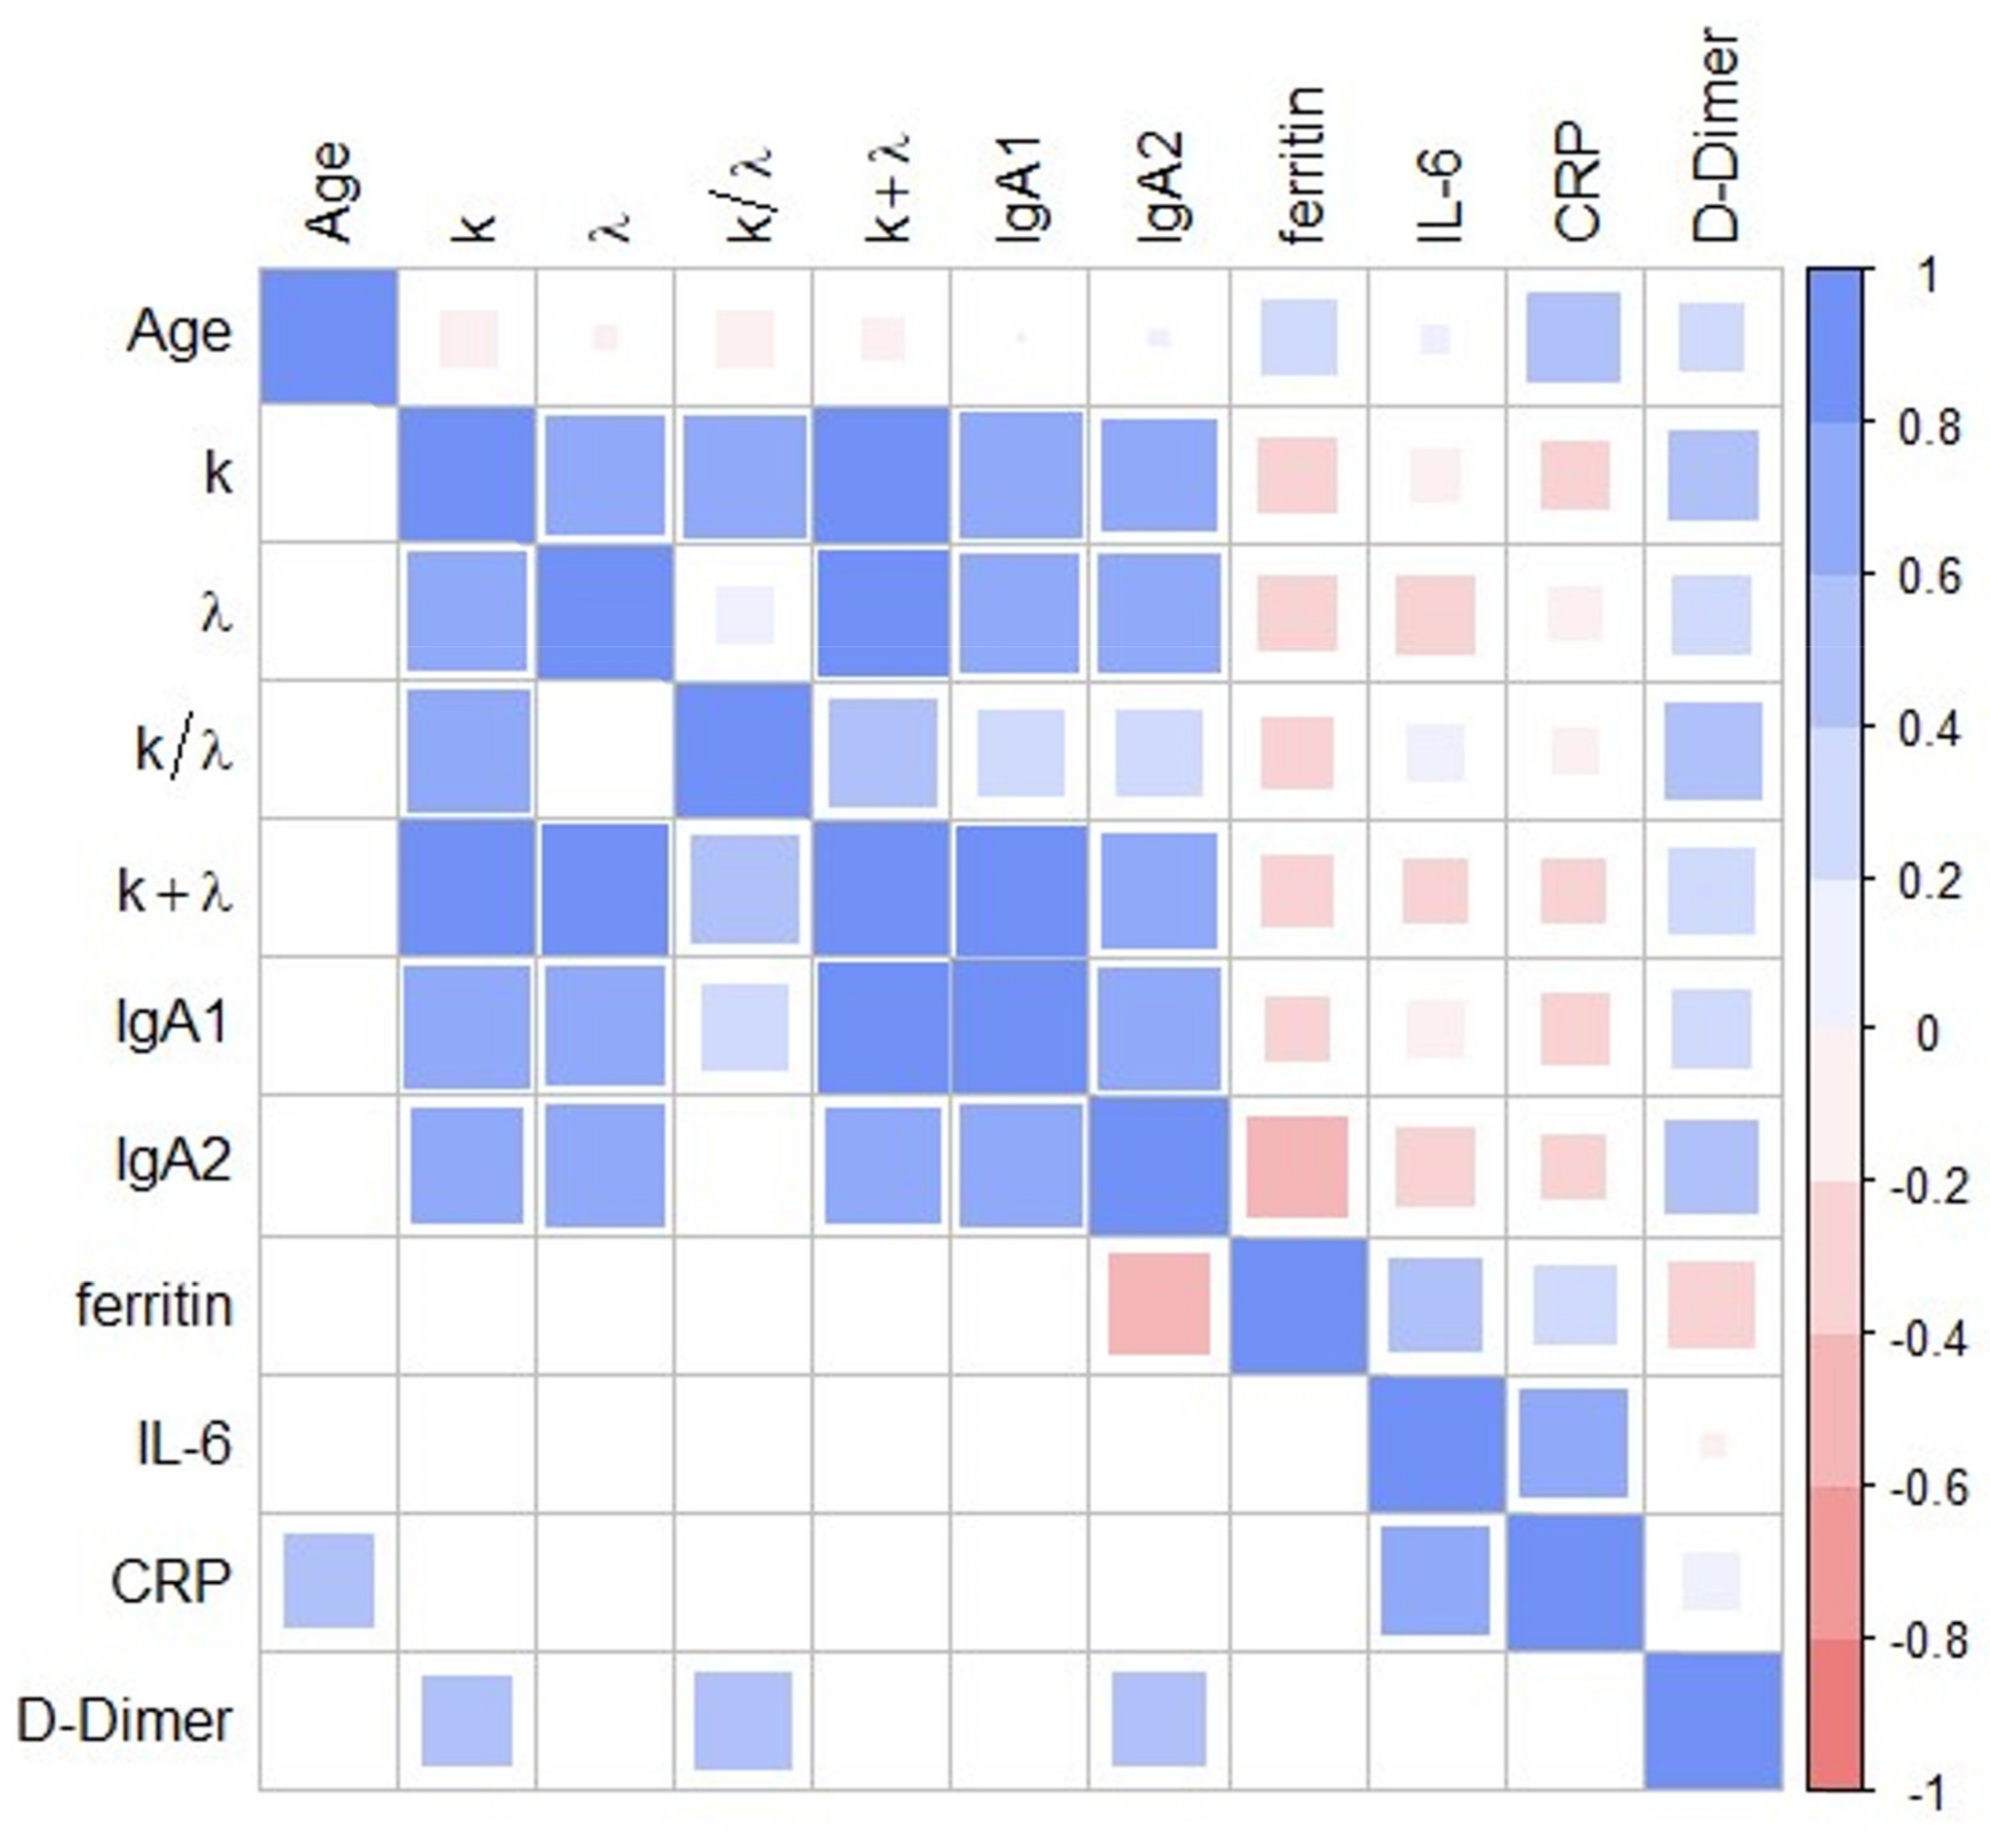
| k vs. λ | 7.16 × 10−01 | 1.25 × 10−05 |
| k vs. IgA1 | 7.79 × 10−01 | 6.31 × 10−07 |
| k vs. IgA2 | 6.33 × 10−01 | 2.22 × 10−04 |
| k vs. D-Dimer | 4.03 × 10−01 | 3.34 × 10−02 |
| λ vs. IgA1 | 7.07 × 10−01 | 1.75 × 10−05 |
| λ vs. IgA2 | 7.17 × 10−01 | 1.17 × 10−05 |
| IgA2 vs. Ferritin | −4.76 × 10−01 | 1.20 × 10−02 |
| IgA2 vs. D-Dimer | 4.20 × 10−01 | 2.60 × 10−02 |
| IL6 vs. CRP | 6.01 × 10−01 | 5.02 × 10−03 |
Publisher’s Note: MDPI stays neutral with regard to jurisdictional claims in published maps and institutional affiliations. |
© 2021 by the authors. Licensee MDPI, Basel, Switzerland. This article is an open access article distributed under the terms and conditions of the Creative Commons Attribution (CC BY) license (https://creativecommons.org/licenses/by/4.0/).
Share and Cite
Napodano, C.; Callà, C.; Fiorita, A.; Marino, M.; Taddei, E.; Di Cesare, T.; Passali, G.C.; Di Santo, R.; Stefanile, A.; Fantoni, M.; et al. Salivary Biomarkers in COVID-19 Patients: Towards a Wide-Scale Test for Monitoring Disease Activity. J. Pers. Med. 2021, 11, 385. https://doi.org/10.3390/jpm11050385
Napodano C, Callà C, Fiorita A, Marino M, Taddei E, Di Cesare T, Passali GC, Di Santo R, Stefanile A, Fantoni M, et al. Salivary Biomarkers in COVID-19 Patients: Towards a Wide-Scale Test for Monitoring Disease Activity. Journal of Personalized Medicine. 2021; 11(5):385. https://doi.org/10.3390/jpm11050385
Chicago/Turabian StyleNapodano, Cecilia, Cinzia Callà, Antonella Fiorita, Mariapaola Marino, Eleonora Taddei, Tiziana Di Cesare, Giulio Cesare Passali, Riccardo Di Santo, Annunziata Stefanile, Massimo Fantoni, and et al. 2021. "Salivary Biomarkers in COVID-19 Patients: Towards a Wide-Scale Test for Monitoring Disease Activity" Journal of Personalized Medicine 11, no. 5: 385. https://doi.org/10.3390/jpm11050385
APA StyleNapodano, C., Callà, C., Fiorita, A., Marino, M., Taddei, E., Di Cesare, T., Passali, G. C., Di Santo, R., Stefanile, A., Fantoni, M., Urbani, A., Paludetti, G., Rapaccini, G. L., Ciasca, G., & Basile, U. (2021). Salivary Biomarkers in COVID-19 Patients: Towards a Wide-Scale Test for Monitoring Disease Activity. Journal of Personalized Medicine, 11(5), 385. https://doi.org/10.3390/jpm11050385