Women’s Views on Multifactorial Breast Cancer Risk Assessment and Risk-Stratified Screening: A Population-Based Survey from Four Provinces in Canada

 , , , , , , , , ,
  ,
,  , , and
Abstract
:
1. Introduction
2. Materials and Methods
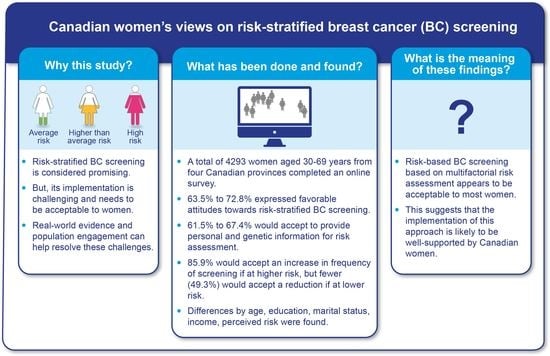
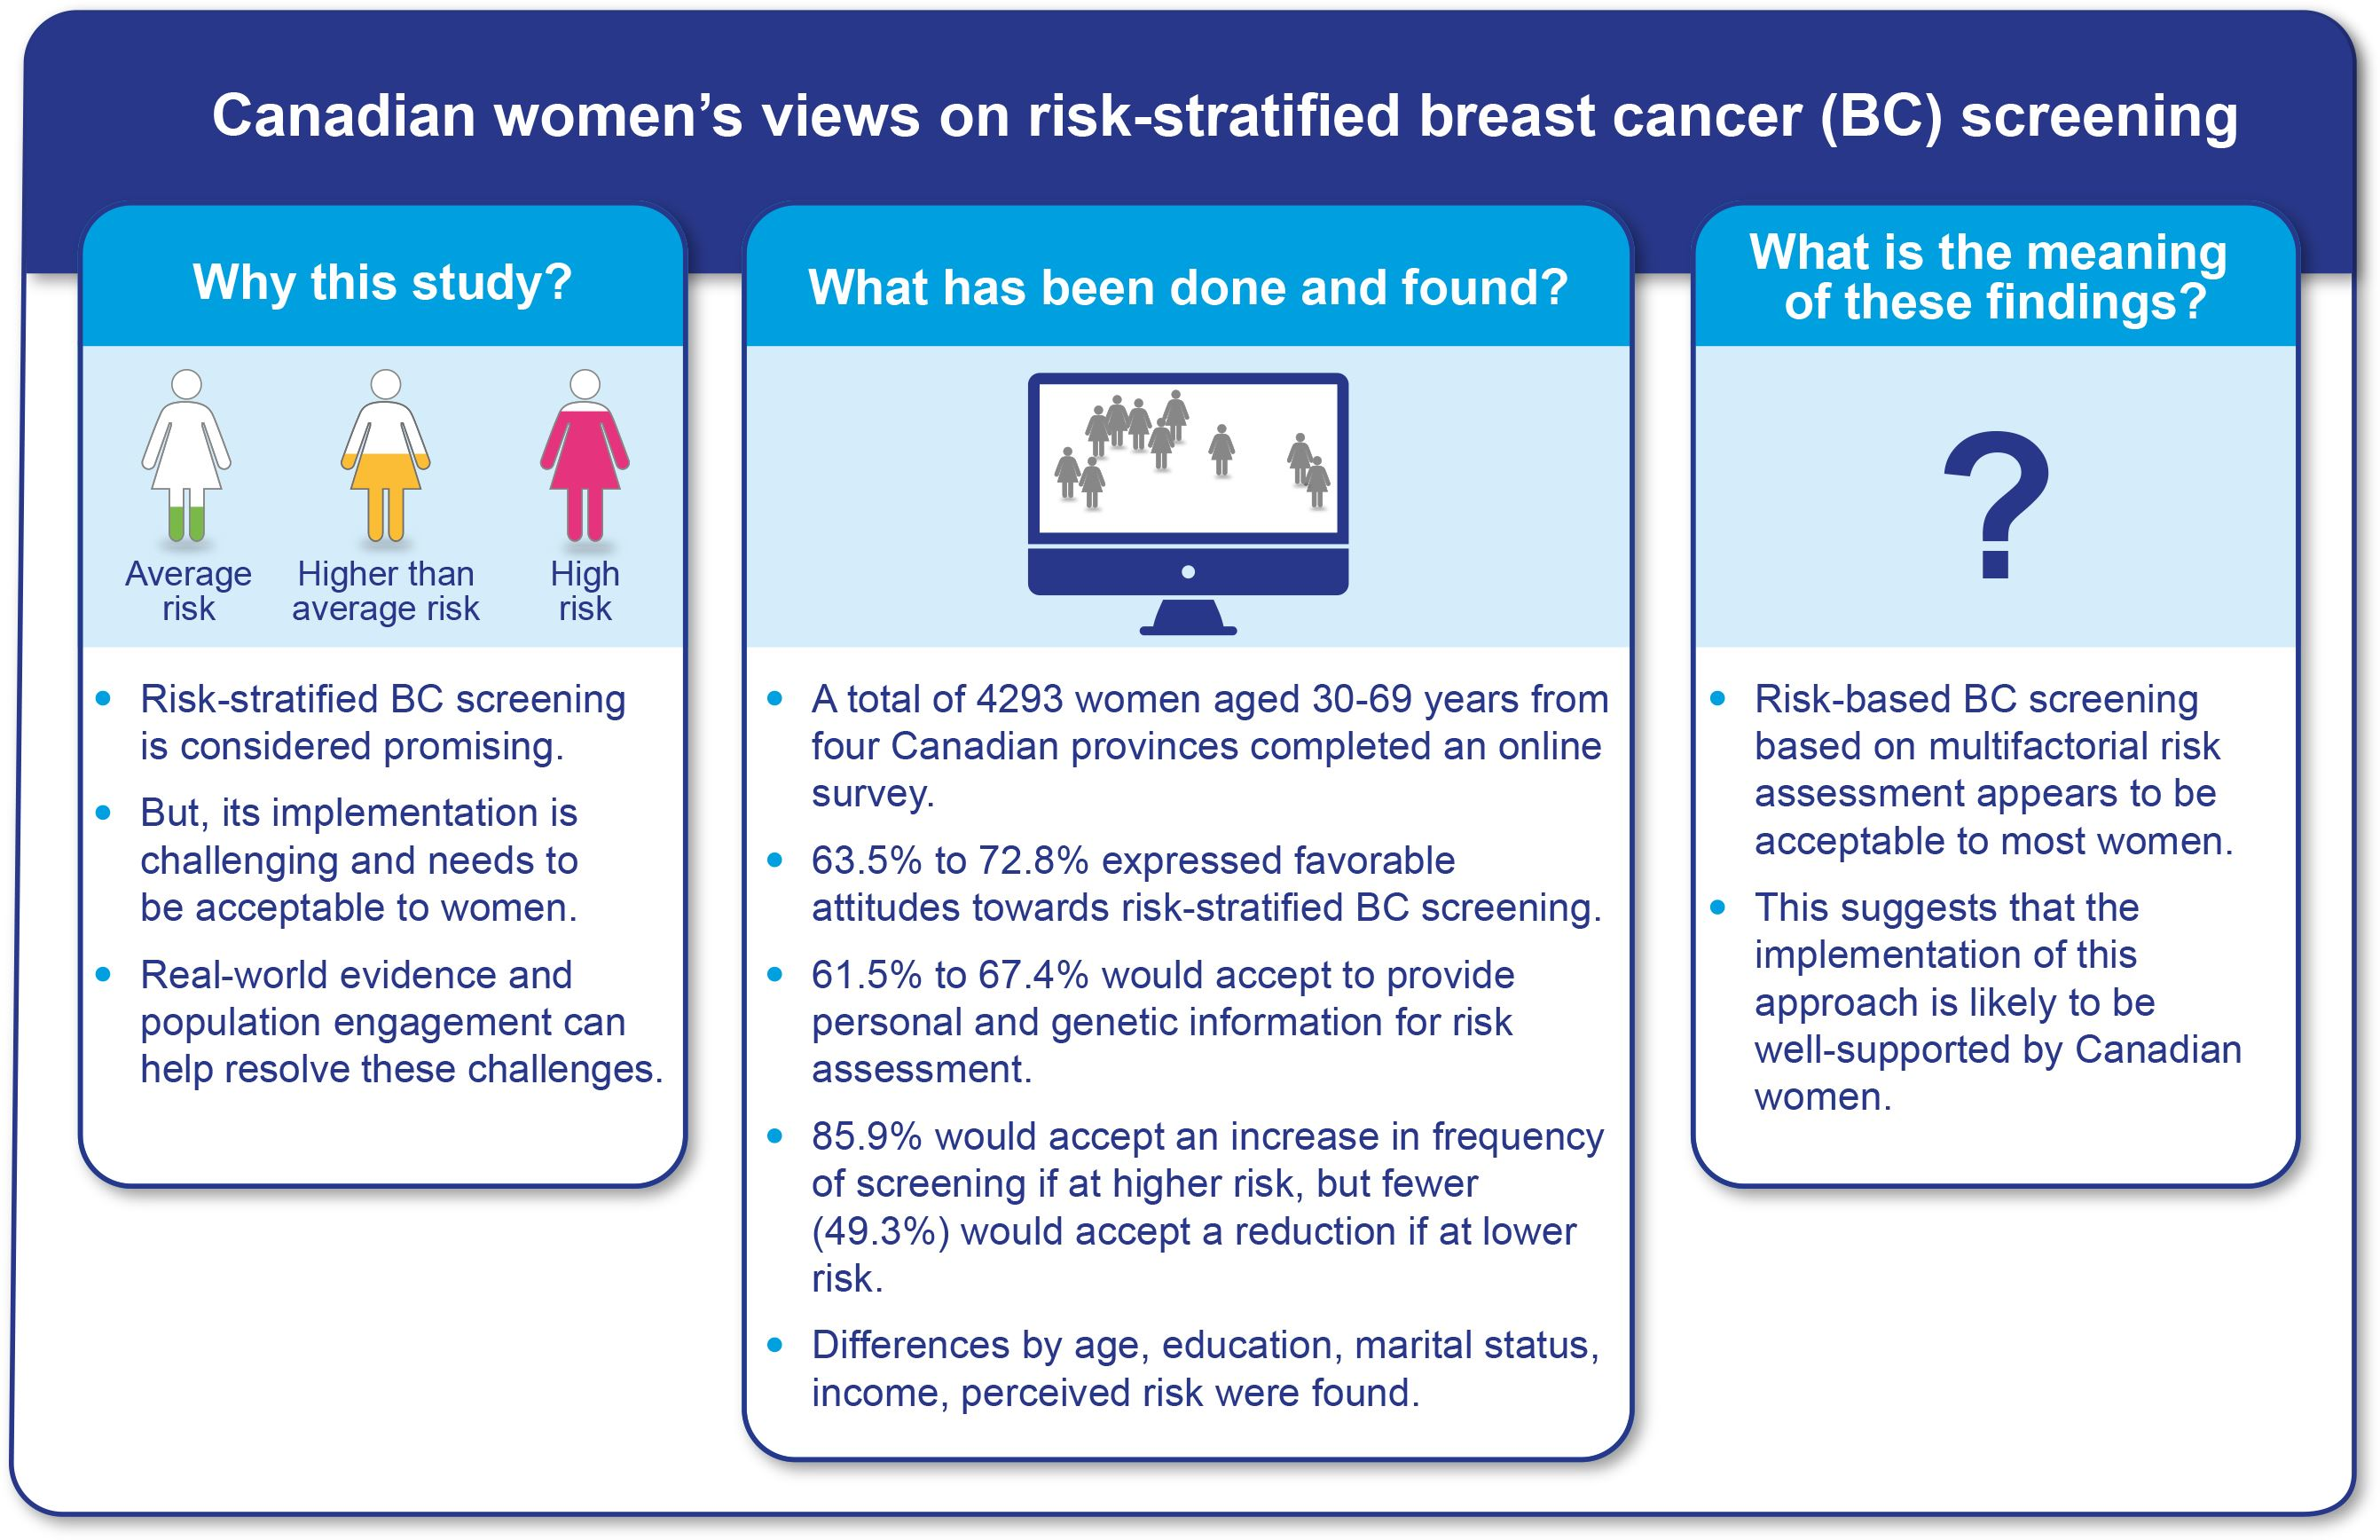
2.1. Study Design and Participants
2.2. Questionnaire Development
2.3. Measures
2.3.1. Outcomes Variables
2.3.2. Covariates
2.4. Statistical Analysis
3. Results
3.1. Sample Characteristics
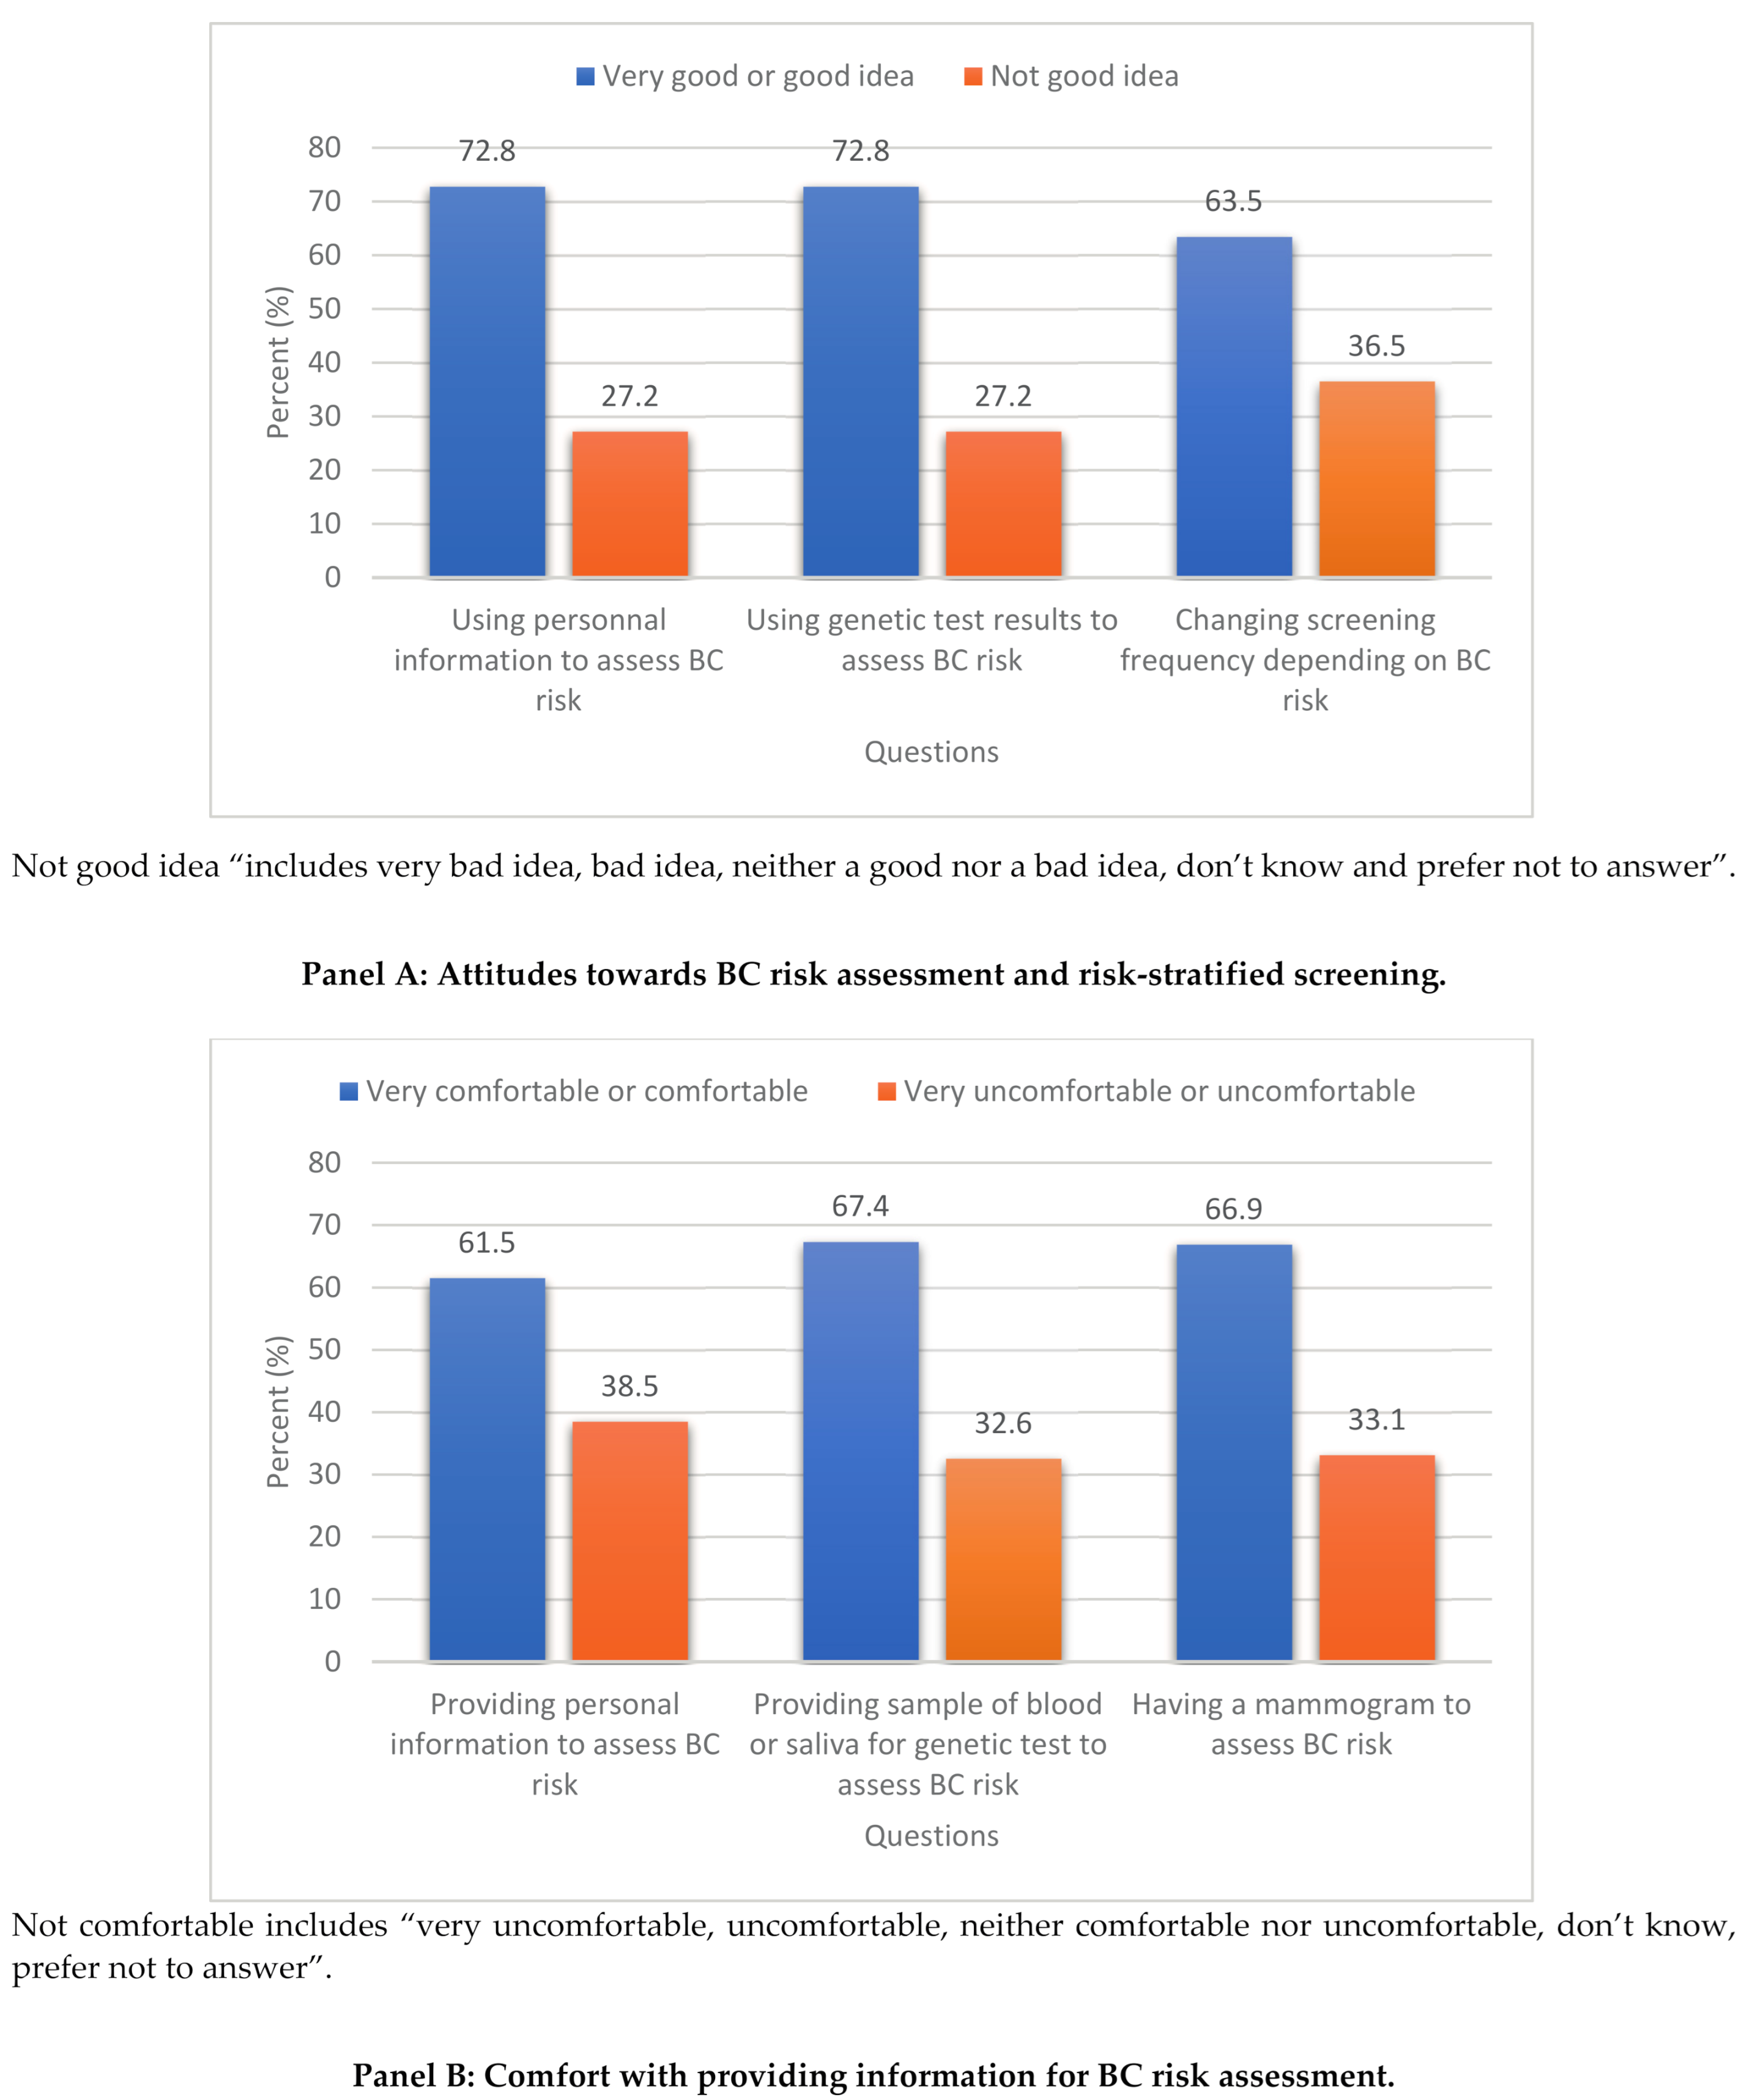
3.2. Attitudes Towards BC Risk Assessment and Risk-Stratified Screening
3.3. Being Comfortable in Providing Information for BC Risk Assessment
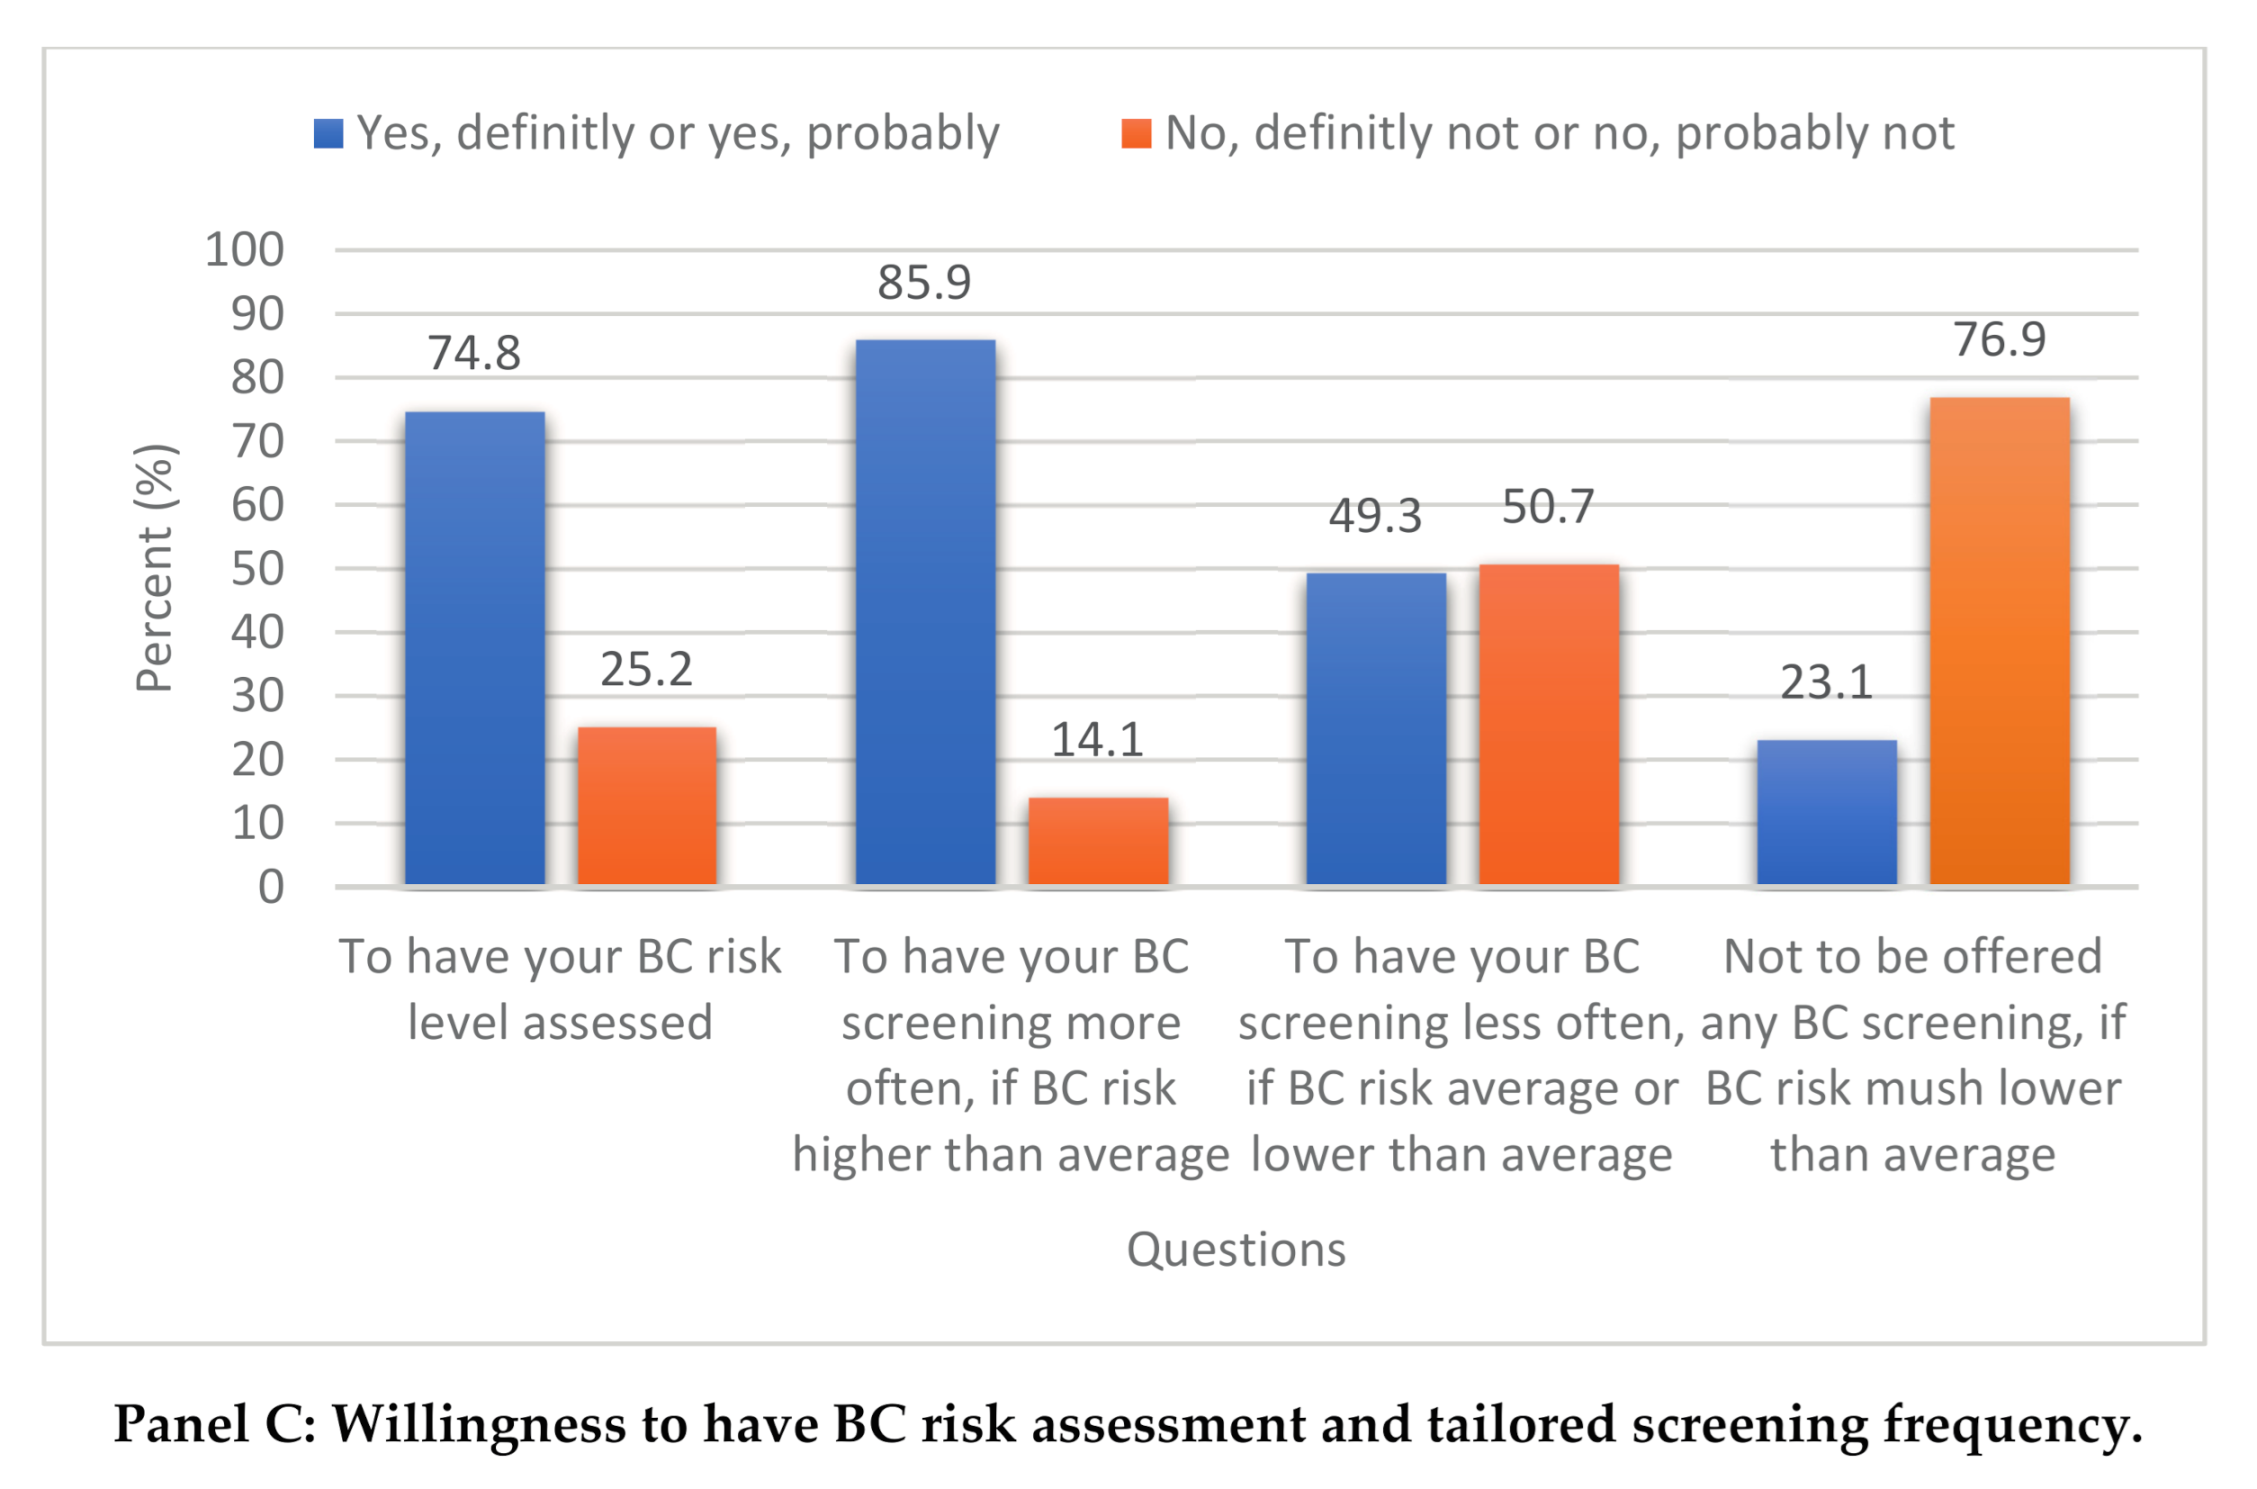
3.4. Willingness to Have BC Risk Assessment and Tailored Screening Frequency
4. Discussion
5. Conclusions
Supplementary Materials
Author Contributions
Funding
Institutional Review Board Statement
Informed Consent Statement
Data Availability Statement
Conflicts of Interest
References
- Klarenbach, S.; Sims-Jones, N.; Lewin, G.; Singh, H.; Thériault, G.; Tonelli, M.; Doull, M.; Courage, S.; Garcia, A.J.; Thombs, B.D. Recommendations on screening for breast cancer in women aged 40–74 years who are not at increased risk for breast cancer. Can. Med Assoc. J. 2018, 190, E1441–E1451. [Google Scholar] [CrossRef] [PubMed] [Green Version]
- Marmot, M.; Screening, T.I.U.P.O.B.C.; Altman, D.G.; Cameron, D.A.; Dewar, J.A.; Thompson, S.G.; Wilcox, M. The benefits and harms of breast cancer screening: An independent review. Br. J. Cancer 2013, 108, 2205–2240. [Google Scholar] [CrossRef] [PubMed] [Green Version]
- Esserman, L.J.; Study, W.; Athena, I. The WISDOM Study: Breaking the deadlock in the breast cancer screening debate. NPJ Breast Cancer 2017, 3, 34. [Google Scholar] [CrossRef] [PubMed] [Green Version]
- Nelson, H.D.; Pappas, M.; Cantor, A.; Griffin, J.; Daeges, M.; Humphrey, L. Harms of Breast Cancer Screening: Systematic Review to Update the 2009 U.S. Preventive Services Task Force Recommendation. Ann. Intern. Med. 2016, 164, 256–267. [Google Scholar] [CrossRef] [Green Version]
- Pashayan, N.; Duffy, S.W.; Chowdhury, S.; Dent, T.; Burton, H.; Neal, D.E.; Easton, D.F.; Eeles, R.A.; Pharoah, P. Polygenic susceptibility to prostate and breast cancer: Implications for personalised screening. Br. J. Cancer 2011, 104, 1656–1663. [Google Scholar] [CrossRef]
- Gagnon, J.; Lévesque, E.; The Clinical Advisory Committee on Breast Cancer Screening and Prevention. Recommendations on breast cancer screening and prevention in the context of implementing risk stratification: Impending changes to current policies. Curr. Oncol. 2016, 23, e615. [Google Scholar] [CrossRef] [Green Version]
- Shieh, Y.; Eklund, M.; Madlensky, L.; Sawyer, S.D.; Thompson, C.K.; Fiscalini, A.S.; Ziv, E.; Veer, L.J.V.; Esserman, L.J.; Tice, J.A. Breast Cancer Screening in the Precision Medicine Era: Risk-Based Screening in a Population-Based Trial. J. Natl. Cancer Inst. 2017, 109, djw290. [Google Scholar] [CrossRef] [Green Version]
- Pashayan, N.; Morris, S.; Gilbert, F.J.; Pharoah, P.D. Cost-effectiveness and benefit-to-harm ratio of risk-stratified screening for breast cancer: A life-table model. JAMA Oncol. 2018, 4, 1504–1510. [Google Scholar] [CrossRef] [Green Version]
- Marcus, P.M.; Pashayan, N.; Church, T.R.; Doria-Rose, V.P.; Gould, M.K.; Hubbard, R.A.; Marrone, M.; Miglioretti, D.L.; Pharoah, P.D.; Pinsky, P.F.; et al. Population-Based Precision Cancer Screening: A Symposium on Evidence, Epidemiology, and Next Steps. Cancer Epidemiol. Biomark. Prev. 2016, 25, 1449–1455. [Google Scholar] [CrossRef] [Green Version]
- Dent, T.; Jbilou, J.; Rafi, I.; Segnan, N.; Törnberg, S.; Chowdhury, S.; Hall, A.; Lyratzopoulos, G.; Eeles, R.A.; Eccles, D.M.; et al. Stratified Cancer Screening: The Practicalities of Implementation. Public Health Genom. 2013, 16, 94–99. [Google Scholar] [CrossRef]
- Haas, J.S. The Complexity of Achieving the Promise of Precision Breast Cancer Screening. J. Natl. Cancer Inst. 2017, 109, djw301. [Google Scholar] [CrossRef] [PubMed]
- Koitsalu, M.; Sprangers, M.A.G.; Eklund, M.; Czene, K.; Hall, P.; Grönberg, H.; Brandberg, Y. Public interest in and acceptability of the prospect of risk-stratified screening for breast and prostate cancer. Acta Oncol. 2015, 55, 45–51. [Google Scholar] [CrossRef] [PubMed] [Green Version]
- Meisel, S.F.; Pashayan, N.; Rahman, B.; Side, L.; Fraser, L.; Gessler, S.; Lanceley, A.; Wardle, J. Adjusting the frequency of mammography screening on the basis of genetic risk: Attitudes among women in the UK. Breast 2015, 24, 237–241. [Google Scholar] [CrossRef] [PubMed] [Green Version]
- Fisher, B.A.; Wilkinson, L.; Valencia, A. Women’s interest in a personal breast cancer risk assessment and lifestyle advice at NHS mammography screening. J. Public Health 2017, 39, 113–121. [Google Scholar] [CrossRef] [PubMed] [Green Version]
- Ghanouni, A.; Sanderson, S.C.; Pashayan, N.; Renzi, C.; Von Wagner, C.; Waller, J. Attitudes towards risk-stratified breast cancer screening among women in England: A cross-sectional survey. J. Med. Screen. 2019, 27, 138–145. [Google Scholar] [CrossRef] [Green Version]
- Lippey, J.; Keogh, L.A.; Mann, G.B.; Campbell, I.G.; Forrest, L.E. “A Natural Progression”: Australian Women’s Attitudes About an Individualized Breast Screening Model. Cancer Prev. Res. 2019, 12, 383–390. [Google Scholar] [CrossRef] [Green Version]
- Rainey, L.; Jervaeus, A.; Donnelly, L.S.; Evans, D.G.; Hammarstrom, M.; Hall, P.; Wengström, Y.; Broeders, J.M.M.; van der Waal, D. Women’s perceptions of personalized risk-based breast cancer screening and prevention: An international focus group study. Psychooncology 2019, 28, 1056–1062. [Google Scholar] [CrossRef] [Green Version]
- Rainey, L.; Van Der Waal, D.; Broeders, M.J.M. Dutch women’s intended participation in a risk-based breast cancer screening and prevention programme: A survey study identifying preferences, facilitators and barriers. BMC Cancer 2020, 20, 1–14. [Google Scholar] [CrossRef]
- Antoniou, A.; Anton-Culver, H.; Borowsky, A.; Broeders, M.; Brooks, J.; Chiarelli, A.; Chiquette, J.; Cuzick, J.; Delaloge, S.; Devilee, P.; et al. A response to “Personalised medicine and population health: Breast and ovarian cancer”. Qual. Life Res. 2019, 138, 287–289. [Google Scholar] [CrossRef] [Green Version]
- Pashayan, N.; Antoniou, A.C.; Ivanus, U.; Esserman, L.J.; Easton, D.F.; French, D.; Sroczynski, G.; Hall, P.; Cuzick, J.; Evans, D.G.; et al. Personalized early detection and prevention of breast cancer: ENVISION consensus statement. Nat. Rev. Clin. Oncol. 2020, 17, 687–705. [Google Scholar] [CrossRef]
- Lipkus, I.M.; Klein, W.M.P.; Skinner, C.S.; Rimer, B.K. Breast cancer risk perceptions and breast cancer worry: What predicts what? J. Risk Res. 2005, 8, 439–452. [Google Scholar] [CrossRef]
- Amornsiripanitch, N.; Mangano, M.; Niell, B.L. Screening Mammography: Patient Perceptions and Preferences Regarding Communication of Estimated Breast Cancer Risk. Am. J. Roentgenol. 2017, 208, 1–8. [Google Scholar] [CrossRef] [PubMed]
- Rubin, M. Do p Values Lose Their Meaning in Exploratory Analyses? It Depends How You Define the Familywise Error Rate. Rev. Gen. Psychol. 2017, 21, 269–275. [Google Scholar] [CrossRef] [Green Version]
- Henneman, L.; Timmermans, D.; Bouwman, C.; Cornel, M.; Meijers-Heijboer, H. ‘A Low Risk Is Still a Risk’: Exploring Women’s Attitudes towards Genetic Testing for Breast Cancer Susceptibility in Order to Target Disease Prevention. Public Health Genom. 2011, 14, 238–247. [Google Scholar] [CrossRef] [PubMed]
- Wauters, A.; Van Hoyweghen, I. Global trends on fears and concerns of genetic discrimination: A systematic literature review. J. Hum. Genet. 2016, 61, 275–282. [Google Scholar] [CrossRef]
- Kim, J.; Jang, S.-N. Socioeconomic disparities in breast cancer screening among US women: Trends from 2000 to 2005. J. Prev. Med. Public Health 2008, 41, 186–194. [Google Scholar] [CrossRef]
- Kelly, D.M.; Estaquio, C.; Léon, C.; Arwidson, P.; Nabi, H. Temporal trend in socioeconomic inequalities in the uptake of cancer screening programmes in France between 2005 and 2010: Results from the Cancer Barometer surveys. BMJ Open 2017, 7, e016941. [Google Scholar] [CrossRef] [Green Version]
- Rogers, R.W. Cognitive and psychological processes in fear appeals and attitude change: A revised theory of protection motivation. In Social Psychophysiology: A Sourcebook; The Guilford Press: New York, NY, USA, 1983; pp. 153–176. [Google Scholar]
- Guertin, J.R.; Feeny, D.; Tarride, J.-E. Age-and sex-specific Canadian utility norms, based on the 2013–2014 Canadian Community Health Survey. CMAJ 2018, 190, E155–E161. [Google Scholar] [CrossRef] [Green Version]
- Clayborne, Z.M.; Colman, I. Associations between Depression and Health Behaviour Change: Findings from 8 Cycles of the Canadian Community Health Survey. Can. J. Psychiatry 2019, 64, 30–38. [Google Scholar] [CrossRef]

| Characteristics | Total (n = 4219) | % (95% CI) |
|---|---|---|
| Age groups | ||
| 30–39 years 40–49 years 50–59 years 60–69 years | 1045 1046 1069 1059 | 24.8 (23.5–26.1) 24.8 (23.5–26.1) 25.3 (24.0–26.7) 25.1 (23.8–26.4) |
| Province | ||
| Alberta British Colombia Ontario Quebec | 1057 1061 1058 1043 | 25.0 (23.8–26.5) 25.2 (23.8–26.4) 25.1 (23.8–26.4) 24.7 (23.4–26.1) |
| Country of birth | ||
| Canada Other | 3565 654 | 84.5 (83.4–85.6) 15.5 (14.4–16.6) |
| Ethnicity | ||
| Caucasian Others a Unknown b | 3410 681 128 | 80.8 (79.6–82.0) 16.1 (15.0–17.3) 3.1 (2.5–3.6) |
| Education level | ||
| High school diploma or less | 1170 | 27.7 (26.4–29.1) |
| Non-university certificate or post-secondary diploma | 1832 | 43.4 (41.9–44.9) |
| University diploma | 1217 | 28.9 (27.5–30.2) |
| Marital status | ||
| Married or common law Formerly married (widowed/divorced/separated) Single, never married Prefer not to answer | 2627 754 793 45 | 62.2 (60.8–63.7) 17.9 (16.7–19.1) 18.8 (17.6–20.0) 1.1 (0.8–1.4) |
| Employment status | ||
| Working (full time or part time) Not working Retired Prefer not to answer | 2502 841 827 49 | 59.3 (57.8–60.8) 19.9 (18.7–21.2) 19.6 (18.4–20.8) 1.2 (0.9–1.5) |
| Total family income | ||
| Less than $20,000 $20,000–$39,999 $40,000–$59,999 $60,000–$79,999 $80,000 or more Don’t know/Prefer not to answer | 325 621 731 588 1394 560 | 7.7 (6.9–8.6) 14.7 (13.7–15.8) 17.3 (16.2–18.5) 13.9 (12.9–15.0) 33.1 (31.6–34.5) 13.3 (12.3–14.3) |
| Perceived health status | ||
| Good c Fair d | 3427 792 | 81.2 (80.0–82.4) 18.8 (17.6–20.0) |
| Ever had breast cancer | ||
| Yes No | 172 4047 | 4.1 (3.5–4.7) 95.9 (95.3–96.5) |
| Perceived lifetime risk of breast cancer | ||
| Much lower or lower than others The same as others Much higher or higher than others Don’t know | 1172 2076 682 289 | 27.8 (26.4–29.2) 49.2 (47.7–50.7) 16.2 (15.1–17.3) 6.8 (6.1–7.7) |
| Ever had a mammogram | ||
| Yes No Don’t know/Prefer not to answer | 2620 1561 38 | 62.1 (60.6–63.6) 37.0 (35.5–38.5) 0.9 (0.6–1.2) |
| Ever had a genetic test for breast cancer | ||
| Yes No Don’t know/Prefer not to answer | 260 3710 249 | 6.2 (5.5–6.9) 87.9 (86.9–88.9) 5.9 (5.2–6.7) |
| Family history of genetic test for breast cancer | ||
| Yes No Don’t know/Prefer not to answer | 483 2395 1341 | 11.4 (10.5–12.5) 56.8 (55.3–58.3) 31.8 (30.4–33.2) |
| Questions: What Do You Think of the Idea of: | Using Personal Information * to Assess BC Risk? | Using Genetic Test Results to Assess BC Risk? | Changing Screening Frequency Depending of BC Risk? | |||
|---|---|---|---|---|---|---|
| Very Good; Good Idea vs. (Very Bad; Bad Idea; Neither a Good Nor Bad Idea; Don’t Know; Prefer Not to Answer) | ||||||
| Characteristics | Adjusted OR, (95% CI) | p-Value | Adjusted OR, (95% CI) | p-Value | Adjusted OR, (95% CI) | p-Value |
| Age groups | ||||||
| 30–39 years 40–49 years 50–59 years 60–69 years | 1.00 0.98 (0.80–1.21) 1.04 (0.81–1.32) 1.08 (0.81–1.45) | 0.8638 0.7691 0.6102 | 1.00 0.90 (0.73–1.12) 0.82 (0.64–1.04) 0.78 (0.58–1.04) | 0.3483 0.1022 0.0913 | 1.00 1.04 (0.86–1.26) 0.90 (0.72–1.13) 0.86 (0.66–1.12) | 0.7014 0.3544 0.2507 |
| Province | ||||||
| Ontario Alberta British Colombia Quebec | 1.00 1.08 (0.88–1.33) 1.00 (0.81–1.22) 0.82 (0.67–1.00) | 0.4622 0.9752 0.0585 | 1.00 0.97 (0.79–1.19) 0.92 (0.75–1.12) 1.01 (0.82–1.24) | 0.7589 0.3895 0.9421 | 1.00 1.08 (0.90–1.29) 0.99 (0.83–1.19) 0.94 (0.78–1.14) | 0.4284 0.9490 0.5448 |
| Country of birth | ||||||
| Canada Other | 1.00 0.91 (0.73–1.13) | 0.3803 | 1.00 0.95 (0.77–1.09) | 0.6733 | 1.00 1.03 (0.84–1.26) | 0.7735 |
| Ethnicity | ||||||
| Caucasian Others Don’t know/Prefer not to answer | 1.00 0.80 (0.64–0.99) 0.51 (0.35–0.76) | 0.0415 0.0008 | 1.00 0.88 (0.71–1.09) 0.59 (0.40–0.88) | 0.2267 0.0084 | 1.00 1.02 (0.84–1.24) 0.58 (0.40–0.83) | 0.8783 0.0035 |
| Education level | ||||||
| University diploma Non-university certificate or post-secondary diploma High school diploma or less | 1.00 0.72 (0.60–0.87) 0.52 (0.42–0.64) | 0.0006 <0.0001 | 1.00 0.89 (0.74–1.07) 0.75 (0.61–0.92) | 0.2176 0.0065 | 1.00 0.98 (0.83–1.15) 0.90 (0.75–1.16) | 0.8127 0.2538 |
| Marital status | ||||||
| Married or common law Formerly married Single, never married Prefer not to answer | 1.00 1.05 (0.85–1.30) 0.98 (0.80–1.20) 1.16 (0.57–2.36) | 0.6393 0.8193 0.6836 | 1.00 1.03 (0.84–1.27) 0.91 (0.74–1.10) 1.24 (0.61–2.50) | 0.7493 0.3240 0.5519 | 1.00 0.96 (0.79–1.16) 0.76 (0.63–0.91) 0.93 (0.48–1.79) | 0.6545 0.0027 0.8196 |
| Employment status | ||||||
| Working Not working Retired Prefer not to answer | 1.00 0.98 (0.80–1.19) 1.22 (0.95–1.57) 0.36 (0.19–0.69) | 0.8226 0.1154 0.0020 | 1.00 1.01 (0.83–1.23) 1.16 (0.91–1.47) 0.45 (0.24–0.84) | 0.9187 0.2244 0.0120 | 1.00 1.07 (0.89–1.29) 0.93 (0.75–1.15) 0.81 (0.44–1.50) | 0.4462 0.4883 0.5037 |
| Total family income | ||||||
| Less than $20,000 $20,000–$39,999 $40,000–$59,999 $60,000–$79,999 $80,000 or more Don’t know/Prefer not to answer | 1.00 1.05 (0.77–1.43) 1.22 (0.89–1.66) 1.31 (0.94–1.85) 1.40 (1.01–1.93) 1.06 (0.76–1.48) | 0.7497 0.2217 0.1156 0.0444 0.7514 | 1.00 1.21 (0.89–1.63) 1.51 (1.11–2.05) 1.81 (1.29–2.53) 1.68 (1.22–2.30) 1.24 (0.89–1.72) | 0.2192 0.0089 0.0006 0.0014 0.1993 | 1.00 1.07 (0.80–1.42) 1.14 (0.85–1.52) 1.40 (1.02–1.92) 1.25 (0.92–1.68) 1.11 (0.81–1.51) | 0.6587 0.3886 0.0352 0.1500 0.5284 |
| Perceived health status | ||||||
| Poor Good | 1.00 1.21 (1.00–1.45) | 0.0479 | 1.00 1.18 (0.98–1.41) | 0.0836 | 1.00 1.00 (0.84–1.18) | 0.9698 |
| Ever had breast cancer | ||||||
| No Yes | 1.00 0.61 (0.42–0.87) | 0.0075 | 1.00 0.62 (0.43–0.90) | 0.0127 | 1.00 0.93 (0.66–1.32) | 0.6908 |
| Perceived lifetime risk of breast cancer | ||||||
| Much lower or lower than others The same as others Much higher or higher than others Don’t know | 1.00 1.09 (0.93–1.30) 2.10 (1.62–2.71) 0.40 (0.30–0.53) | 0.2945 <0.0001 <0.0001 | 1.00 1.11 (0.94–1.31) 1.82 (1.42–2.34) 0.44 (0.34–0.58) | 0.2106 <0.0001 <0.0001 | 1.00 0.91 (0.78–1.06) 1.42 (1.14–1.77) 0.49 (0.38–0.65) | 0.2013 0.0017 <0.0001 |
| Ever had a mammogram | ||||||
| No Yes Don’t know/Prefer not to answer | 1.00 1.32 (1.09–1.60) 0.43 (0.21–0.90) | 0.0043 0.0242 | 1.00 1.31 (1.08–1.58) 0.36 (0.18–0.76) | 0.0057 0.0069 | 1.00 1.12 (0.94–1.34) 0.39 (0.19–0.80) | 0.2026 0.0099 |
| Ever had a genetic test for breast cancer | ||||||
| No Yes Don’t know/Prefer not to answer | 1.00 0.78 (0.56–1.08) 0.56 (0.42–0.77) | 0.1388 0.0002 | 1.00 1.31 (0.92–1.87) 0.64 (0.48–0.86) | 0.1388 0.0033 | 1.00 1.02 (0.75–1.39) 1.03 (0.77–1.37) | 0.9014 0.8576 |
| Family history of genetic test for breast cancer | ||||||
| No Yes Don’t know/Prefer not to answer | 1.00 1.27 (0.98–1.64) 1.16 (0.98–1.38) | 0.0701 0.0788 | 1.00 1.45 (1.11–1.89) 1.21 (1.02–1.42) | 0.0064 0.0270 | 1.00 1.45 (1.14–1.83) 1.12 (0.96–1.30) | 0.0021 0.1504 |
| Questions: How Comfortable Would You Feel | Providing Personal Information * to Assess Breast Cancer Risk? | Providing Sample of Blood or Saliva for Genetic Test to Assess Breast Cancer Risk? | Having a Mammogram to Assess Breast Cancer Risk? | |||
|---|---|---|---|---|---|---|
| Very Comfortable; Comfortable vs. (Very Uncomfortable; Uncomfortable; Neither Comfortable nor Uncomfortable; Don’t Know; Prefer Not to Answer) | ||||||
| Characteristics | Adjusted OR, (95% CI) | p-Value | Adjusted OR, (95% CI) | p-Value | Adjusted OR, (95% CI) | p-Value |
| Age groups | ||||||
| 30–39 years 40–49 years 50–59 years 60–69 years | 1.00 0.77 (0.63–0.93) 0.76 (0.61–0.95) 0.63 (0.48–0.82) | 0.0080 0.0177 0.0007 | 1.00 0.79 (0.65–0.96) 0.79 (0.63–0.99) 0.77 (0.58–1.00) | 0.2190 0.0115 0.8861 | 1.00 0.88 (0.72–1.08) 0.73 (0.58–0.93) 1.02 (0.76–1.37) | 0.2190 0.0115 0.8861 |
| Province | ||||||
| Ontario Alberta British Colombia Quebec | 1.00 0.96 (0.80–1.15) 1.03 (0.85–1.23) 1.19 (0.98–1.44) | 0.6611 0.7808 0.0755 | 1.00 0.90 (0.75–1.09) 1.00 (0.83–1.20) 1.49 (1.23–1.81) | 0.2740 0.9919 <0.0001 | 1.00 1.03 (0.84–1.26) 1.25 (1.03–1.52) 0.97 (0.79–1.19) | 0.7734 0.0315 0.7592 |
| Country of birth | ||||||
| Canada Other | 1.00 0.94 (0.77–1.16) | 0.5683 | 1.00 0.85 (0.69–1.04) | 0.1086 | 1.00 0.85 (0.68–1.06) | 0.1384 |
| Ethnicity | ||||||
| Caucasian Others Don’t know/Prefer not to answer | 1.00 0.78 (0.64–0.96) 0.34 (0.23–0.51) | 0.0194 <0.0001 | 1.00 1.09 (0.89–1.33) 0.51 (0.35–0.75) | 0.4322 0.0007 | 1.00 0.92 (0.74–1.13) 0.56 (0.38–0.84) | 0.4181 0.0052 |
| Education level | ||||||
| University diploma Non-university certificate or post-secondary diploma High school diploma or less | 1.00 0.90 (0.76–1.06) 0.72 (0.60–0.87) | 0.2071 0.0008 | 1.00 0.96 (0.82–1.14) 0.77 (0.64–0.93) | 0.6579 0.0752 | 1.00 0.98 (0.82–1.17) 0.81 (0.66–0.99) | 0.8233 0.0424 |
| Marital status | ||||||
| Married or common law Formerly married Single, never married Prefer not to answer | 1.00 1.15 (0.95–1.39) 0.78 (0.65–0.94) 0.46 (0.22–0.98) | 0.1611 0.0084 0.0438 | 1.00 1.10 (0.91–1.34) 0.77 (0.64–0.93) 0.48 (0.24–0.97) | 0.3308 0.0063 0.0418 | 1.00 0.95 (0.77–1.17) 1.01 (0.83–1.23) 0.59 (0.29–1.17) | 0.6258 0.8940 0.1316 |
| Employment status | ||||||
| Working Not working Retired Prefer not to answer | 1.00 1.15 (0.95–1.38) 1.25 (0.87–1.56) 0.71 (0.37–1.37) | 0.1434 0.0442 0.3025 | 1.00 1.02 (0.85–1.23) 0.99 (0.80–1.24) 0.68 (0.36–1.30) | 0.8312 0.9482 0.2451 | 1.00 1.07 (0.88–1.30) 1.07 (0.83–1.37) 0.80 (0.42–1.55) | 0.5076 0.6057 0.5112 |
| Total family income | ||||||
| Less than $20,000 $20,000–$39,999 $40,000–$59,999 $60,000–$79,999 $80,000 or more Don’t know/Prefer not to answer | 1.00 1.21 (0.90–1.62) 1.16 (0.87–1.56) 1.27 (0.93–1.74) 1.59 (1.17–2.15) 0.72 (0.53–0.99) | 0.2053 0.3129 0.1405 0.0029 0.0411 | 1.00 1.23 (0.92–1.66) 1.16 (0.86–1.56) 1.30 (0.95–1.80) 1.44 (1.06–1.96) 0.76 (0.55–1.04) | 0.1685 0.3200 0.1034 0.0190 0.0823 | 1.00 1.21 (0.90–1.65) 1.62 (1.19–2.21) 1.67 (1.20–2.33) 2.27 (1.64–3.13) 1.36 (0.97–1.89) | 0.2094 0.0022 0.0026 <0.0001 0.0733 |
| Perceived health status | ||||||
| Fair Good | 1.00 1.15 (0.97–1.37) | 0.1030 | 1.00 0.98 (0.82–1.17) | 0.8499 | 1.00 1.40 (1.17–1.68) | 0.0003 |
| Ever had breast cancer | ||||||
| No Yes | 1.00 0.66 (0.47–0.94) | 0.0195 | 1.00 0.65 (0.46–0.93) | 0.0178 | 1.00 0.77 (0.52–1.14) | 0.1863 |
| Perceived lifetime risk of breast cancer | ||||||
| Much lower or lower than others The same as others Much higher or higher than others Don’t know | 1.00 0.85 (0.73–1.00) 1.51 (1.21–1.88) 0.41 (0.31–0.54) | 0.0463 0.0003 <0.0001 | 1.00 0.99 (0.85–1.16) 1.58 (1.26–1.98) 0.44 (0.33–0.58) | 0.9195 <0.0001 <0.0001 | 1.00 1.27 (1.08–1.50) 2.09 (1.64–2.66) 0.73 (0.52–0.98) | 0.0047 <0.0001 0.0277 |
| Ever had a mammogram | ||||||
| No Yes Don’t know/Prefer not to answer | 1.00 1.38 (1.16–1.65) 0.22 (0.09–0.54) | 0.0003 0.0011 | 1.00 1.31 (1.10–1.57) 0.32 (0.14–0.71) | 0.0030 0.0051 | 1.00 4.36 (3.60–5.27) 0.38 (0.16–0.90) | <0.0001 0.0277 |
| Ever had a genetic test for breast cancer | ||||||
| No Yes Don’t know/Prefer not to answer | 1.00 0.96 (0.71–1.31) 0.77 (0.58–1.03) | 0.8013 0.0801 | 1.00 1.08 (0.78–1.48) 0.69 (0.52–0.93) | 0.6446 0.0136 | 1.00 0.62 (0.45–0.86) 0.64 (0.47–0.87) | 0.0037 0.0045 |
| Family history of genetic test for breast cancer | ||||||
| No Yes Don’t know/Prefer not to answer | 1.00 1.38 (1.09–1.75) 1.03 (0.89–1.20) | 0.0073 0.6979 | 1.00 1.60 (1.25–2.04) 1.17 (1.00–1.36) | 0.0002 0.0457 | 1.00 1.50 (1.16–1.93) 0.91 (0.78–1.08) | 0.0020 0.2767 |
| Questions: Would You be Willing | To Have Your BC Risk Level Assessed? | To Have Your BC Screening More Often if BC Risk Higher Than Average? | To Have Your BC Screening Less Often if BC Average or Lower Than Average? | Not to Be Offered any BC Screening if BC Risk Much Lower Than Average? | ||||
|---|---|---|---|---|---|---|---|---|
| Yes, Definitely; Yes, Probably vs. (No, Probably Not; No, Definitely Not; Don’t Know; Prefer Not to Answer) | ||||||||
| Characteristics | Adjusted OR, (95% CI) | p-Value | Adjusted OR, (95% CI) | p-Value | Adjusted OR, (95% CI) | p-Value | Adjusted OR, (95% CI) | p-Value |
| Age groups | ||||||||
| 30–39 years | 1.00 | 1.00 | 1.00 | 1.00 | ||||
| 40–49 years | 0.81 (0.65–1.00) | 0.0522 | 0.91 (0.70–1.18) | 0.4685 | 1.02 (0.85–1.29) | 0.8568 | 1.02 (0.82–1.27) | 0.8684 |
| 50–59 years | 0.66 (0.51–0.85) | 0.0013 | 0.59 (0.44–0.81) | 0.0009 | 1.04 (0.78–1.30) | 0.7235 | 1.45 (1.13–1.86) | 0.0034 |
| 60–69 years | 0.63 (0.46–0.85) | 0.0024 | 0.59 (0.40–0.86) | 0.0066 | 1.01 (0.92–1.31) | 0.9552 | 1.40 (1.04–1.89) | 0.0257 |
| Province | ||||||||
| Ontario | 1.00 | 1.00 | 1.00 | 1.00 | ||||
| Alberta | 1.00 (0.82–1.24) | 0.9338 | 1.17 (0.90–1.53) | 0.2362 | 1.10 (0.92–1.31) | 0.3010 | 1.12 (0.91–1.37) | 0.3034 |
| British Colombia | 1.05 (0.86–1.30) | 0.6265 | 1.18 (0.91–1.53) | 0.2186 | 0.88 (0.74–1.05) | 0.1630 | 0.98 (0.79–1.20) | 0.8083 |
| Quebec | 1.08 (0.87–1.33) | 0.4976 | 1.20 (0.92–1.57) | 0.1715 | 0.82 (0.69–0.98) | 0.0301 | 1.00 (0.81–1.24) | 0.9738 |
| Country of birth | ||||||||
| Canada | 1.00 | 1.00 | 1.00 | 1.00 | ||||
| Other | 0.89 (0.71–1.12) | 0.3186 | 0.95 (0.72–1.26) | 0.7150 | 1.07 (0.88–1.30) | 0.5108 | 1.30 (1.04–1.62) | 0.0221 |
| Ethnicity | ||||||||
| Caucasian | 1.00 | 1.00 | 1.00 | 1.00 | ||||
| Others | 1.08 (0.86–1.36) | 0.4988 | 0.83 (0.63–1.08) | 0.1650 | 1.18 (0.97–1.43) | 0.0906 | 1.29 (1.04–1.60) | 0.0231 |
| Don’t know/Prefer not to answer | 0.41 (0.28–0.60) | <0.0001 | 0.42 (0.27–0.65) | 0.0001 | 0.71 (0.50–1.04) | 0.0823 | 0.73 (0.44–1.20) | 0.2168 |
| Education level | ||||||||
| University diploma | 1.00 | 1.00 | 1.00 | 1.00 | ||||
| Non-university certificate or post-secondary diploma | 0.96 (0.79–1.15) | 0.6426 | 0.92 (0.73–1.18) | 0.5210 | 0.99 (0.85–1.16) | 0.9151 | 1.07 (0.89–1.28) | 0.4952 |
| High school diploma or less | 0.80 (0.65–0.99) | 0.0423 | 0.71 (0.54–0.93) | 0.0117 | 0.99 (0.84–1.19) | 0.9476 | 1.00 (0.80–1.24) | 0.9737 |
| Marital status | ||||||||
| Married or common law | 1.00 | 1.00 | 1.00 | 1.00 | ||||
| Formerly married | 1.15 (0.93–1.43) | 0.2071 | 1.03 (0.78–1.35) | 0.8565 | 0.98 (0.82–1.17) | 0.7968 | 1.00 (0.81–1.24) | 0.9889 |
| Single, never married | 0.91 (0.74–1.12) | 0.3731 | 0.82 (0.64–1.15) | 0.1083 | 0.83 (0.70–1.00) | 0.0447 | 0.96 (0.78–1.19) | 0.7058 |
| Prefer not to answer | 0.97 (0.49–1.94) | 0.9297 | 2.34 (0.89–6.17) | 0.0866 | 0.71 (0.37–1.38) | 0.3090 | 0.68 (0.28–1.69) | 0.4112 |
| Employment status | ||||||||
| Working | 1.00 | 1.00 | 1.00 | 1.00 | ||||
| Not working | 1.15 (0.93–1.43) | 0.1760 | 1.08 (0.84–1.39) | 0.5330 | 1.01 (0.85–1.21) | 0.8741 | 0.84 (0.68–1.03) | 0.0927 |
| Retired | 1.10 (0.86–1.40) | 0.4664 | 1.34 (0.96–1.86) | 0.0852 | 0.87 (0.70–1.06) | 0.1697 | 0.84 (0.66–1.08) | 0.1740 |
| Prefer not to answer | 0.89 (0.47–1.42) | 0.7295 | 0.65 (0.31–1.34) | 0.2394 | 1.21 (0.65–2.26) | 0.5427 | 0.82 (0.38–1.79) | 0.6220 |
| Total family income | ||||||||
| Less than $20,000 | 1.00 | 1.00 | 1.00 | 1.00 | ||||
| $20,000–$39,999 | 1.15 (0.83–1.59) | 0.4030 | 1.40 (0.97–2.01) | 0.0719 | 1.34 (1.01–1.78) | 0.0442 | 0.92 (0.67–1.27) | 0.6213 |
| $40,000–$59,999 | 1.09 (0.79–1.51) | 0.5889 | 1.85 (1.26–2.70) | 0.0015 | 1.47 (1.11–1.95) | 0.0079 | 0.81 (0.58–1.12) | 0.2021 |
| $60,000–$79,999 | 1.31 (0.56–1.13) | 0.1280 | 1.92 (1.27–2.91) | 0.0020 | 1.06 (0.78–1.44) | 0.7083 | 0.76 (0.53–1.08) | 0.1205 |
| $80,000 or more | 1.44 (1.03–2.02) | 0.0343 | 2.34 (1.57–3.48) | <0.0001 | 1.09 (0.81–1.46) | 0.5648 | 0.75 (0.53–1.05) | 0.0906 |
| Don’t know/Prefer not to answer | 0.82 (0.58–1.16) | 0.2665 | 1.45 (0.97–2.16) | 0.0674 | 0.99 (0.73–1.35) | 0.9561 | 0.57 (0.40–0.82) | 0.0026 |
| Perceived health status | ||||||||
| Fair | 1.00 | 1.00 | 1.00 | 1.00 | ||||
| Good | 1.12 (0.93–1.37) | 0.2365 | 1.08 (0.85–1.37) | 0.5313 | 1.11 (0.94–1.30) | 0.2378 | 0.96 (0.79–1.17) | 0.6814 |
| Ever had breast cancer | ||||||||
| No | 1.00 | 1.00 | 1.00 | 1.00 | ||||
| Yes | 0.75 (0.50–1.11) | 0.1527 | 1.00 (0.59–1.71) | 0.9934 | 0.90 (0.65–1.25) | 0.5362 | 1.17 (0.81–1.71) | 0.4077 |
| Perceived lifetime risk of breast cancer | ||||||||
| Much lower or lower than others | 1.00 | 1.00 | 1.00 | 1.00 | ||||
| The same as others | 1.12 (0.94–1.33) | 0.2004 | 1.37 (1.10–1.70) | 0.0046 | 0.74 (0.64–0.85) | <0.0001 | 0.58 (0.49–0.69) | <0.0001 |
| Much higher or higher than others | 2.04 (1.56–2.66) | <0.0001 | 2.31 (1.62–3.28) | <0.0001 | 0.65 (0.53–0.80) | <0.0001 | 0.47 (0.37–0.60) | <0.0001 |
| Don’t know | 0.37 (0.28–0.49) | <0.0001 | 0.49 (0.36–0.68) | <0.0001 | 0.44 (0.34–0.59) | <0.0001 | 0.55 (0.40–0.77) | 0.0004 |
| Ever had a mammogram | ||||||||
| No | 1.00 | 1.00 | 1.00 | 1.00 | ||||
| Yes | 1.91 (1.57–2.33) | <0.0001 | 2.82 (2.20–3.61) | <0.0001 | 0.91 (0.77–1.08) | 0.2818 | 0.65 (0.53–0.79) | <0.0001 |
| Don’t know/Prefer not to answer | 0.29 (0.13–0.63) | 0.0016 | 0.24 (0.12–0.52) | 0.0002 | 0.36 (0.17–0.79) | 0.0111 | 0.59 (0.24–1.46) | 0.2519 |
| Ever had a genetic test for breast cancer | ||||||||
| No | 1.00 | 1.00 | 1.00 | 1.00 | ||||
| Yes | 0.92 (0.64–1.32) | 0.6396 | 0.62 (0.41–0.94) | 0.0240 | 1.13 (0.85–1.51) | 0.3926 | 1.58 (1.16–2.16) | 0.0040 |
| Don’t know/Prefer not to answer | 0.71 (0.52–0.97) | 0.0315 | 0.40 (0.28–0.57) | <0.0001 | 0.92 (0.70–1.22) | 0.5619 | 1.11 (0.79–1.55) | 0.5551 |
| Family history of genetic test for breast cancer | ||||||||
| No | 1.00 | 1.00 | 1.00 | 1.00 | ||||
| Yes | 1.72 (1.29–2.29) | 0.0003 | 1.34 (0.95–1.88) | 0.0913 | 1.34 (1.08–1.66) | 0.0086 | 1.26 (0.99–1.62) | 0.0630 |
| Don’t know/Prefer not to answer | 1.13 (0.95–1.34) | 0.1551 | 1.50 (1.19–1.87) | 0.0004 | 1.14 (0.99–1.32) | 0.0753 | 0.94 (0.79–1.12) | 0.4697 |
Publisher’s Note: MDPI stays neutral with regard to jurisdictional claims in published maps and institutional affiliations. |
© 2021 by the authors. Licensee MDPI, Basel, Switzerland. This article is an open access article distributed under the terms and conditions of the Creative Commons Attribution (CC BY) license (http://creativecommons.org/licenses/by/4.0/).
Share and Cite
Mbuya Bienge, C.; Pashayan, N.; Brooks, J.D.; Dorval, M.; Chiquette, J.; Eloy, L.; Turgeon, A.; Lambert-Côté, L.; Paquette, J.-S.; Lévesque, E.; et al. Women’s Views on Multifactorial Breast Cancer Risk Assessment and Risk-Stratified Screening: A Population-Based Survey from Four Provinces in Canada. J. Pers. Med. 2021, 11, 95. https://doi.org/10.3390/jpm11020095
Mbuya Bienge C, Pashayan N, Brooks JD, Dorval M, Chiquette J, Eloy L, Turgeon A, Lambert-Côté L, Paquette J-S, Lévesque E, et al. Women’s Views on Multifactorial Breast Cancer Risk Assessment and Risk-Stratified Screening: A Population-Based Survey from Four Provinces in Canada. Journal of Personalized Medicine. 2021; 11(2):95. https://doi.org/10.3390/jpm11020095
Chicago/Turabian StyleMbuya Bienge, Cynthia, Nora Pashayan, Jennifer D. Brooks, Michel Dorval, Jocelyne Chiquette, Laurence Eloy, Annie Turgeon, Laurence Lambert-Côté, Jean-Sébastien Paquette, Emmanuelle Lévesque, and et al. 2021. "Women’s Views on Multifactorial Breast Cancer Risk Assessment and Risk-Stratified Screening: A Population-Based Survey from Four Provinces in Canada" Journal of Personalized Medicine 11, no. 2: 95. https://doi.org/10.3390/jpm11020095
APA StyleMbuya Bienge, C., Pashayan, N., Brooks, J. D., Dorval, M., Chiquette, J., Eloy, L., Turgeon, A., Lambert-Côté, L., Paquette, J.-S., Lévesque, E., Hagan, J., Walker, M. J., Lapointe, J., Dalpé, G., Granados Moreno, P. G., Blackmore, K., Wolfson, M., Joly, Y., Broeders, M., ... Nabi, H. (2021). Women’s Views on Multifactorial Breast Cancer Risk Assessment and Risk-Stratified Screening: A Population-Based Survey from Four Provinces in Canada. Journal of Personalized Medicine, 11(2), 95. https://doi.org/10.3390/jpm11020095