
Functional Assessment of 12 Rare Allelic CYP2C9 Variants Identified in a Population of 4773 Japanese Individuals

 , , ,
, , , 
Abstract

1. Introduction
2. Materials and Methods
2.1. Chemicals
2.2. Sanger Sequencing Analysis for the Detection of CYP2C9 Sequence Alterations
2.3. cDNA-Based Construction of Expression Vectors
2.4. Expression of CYP2C9 Variants in 293FT Cells
2.5. Western Blotting
2.6. Determination of Cytochrome (CYP), Cytochrome P450 Oxidoreductase (CPR), and Cytochrome b5 Content
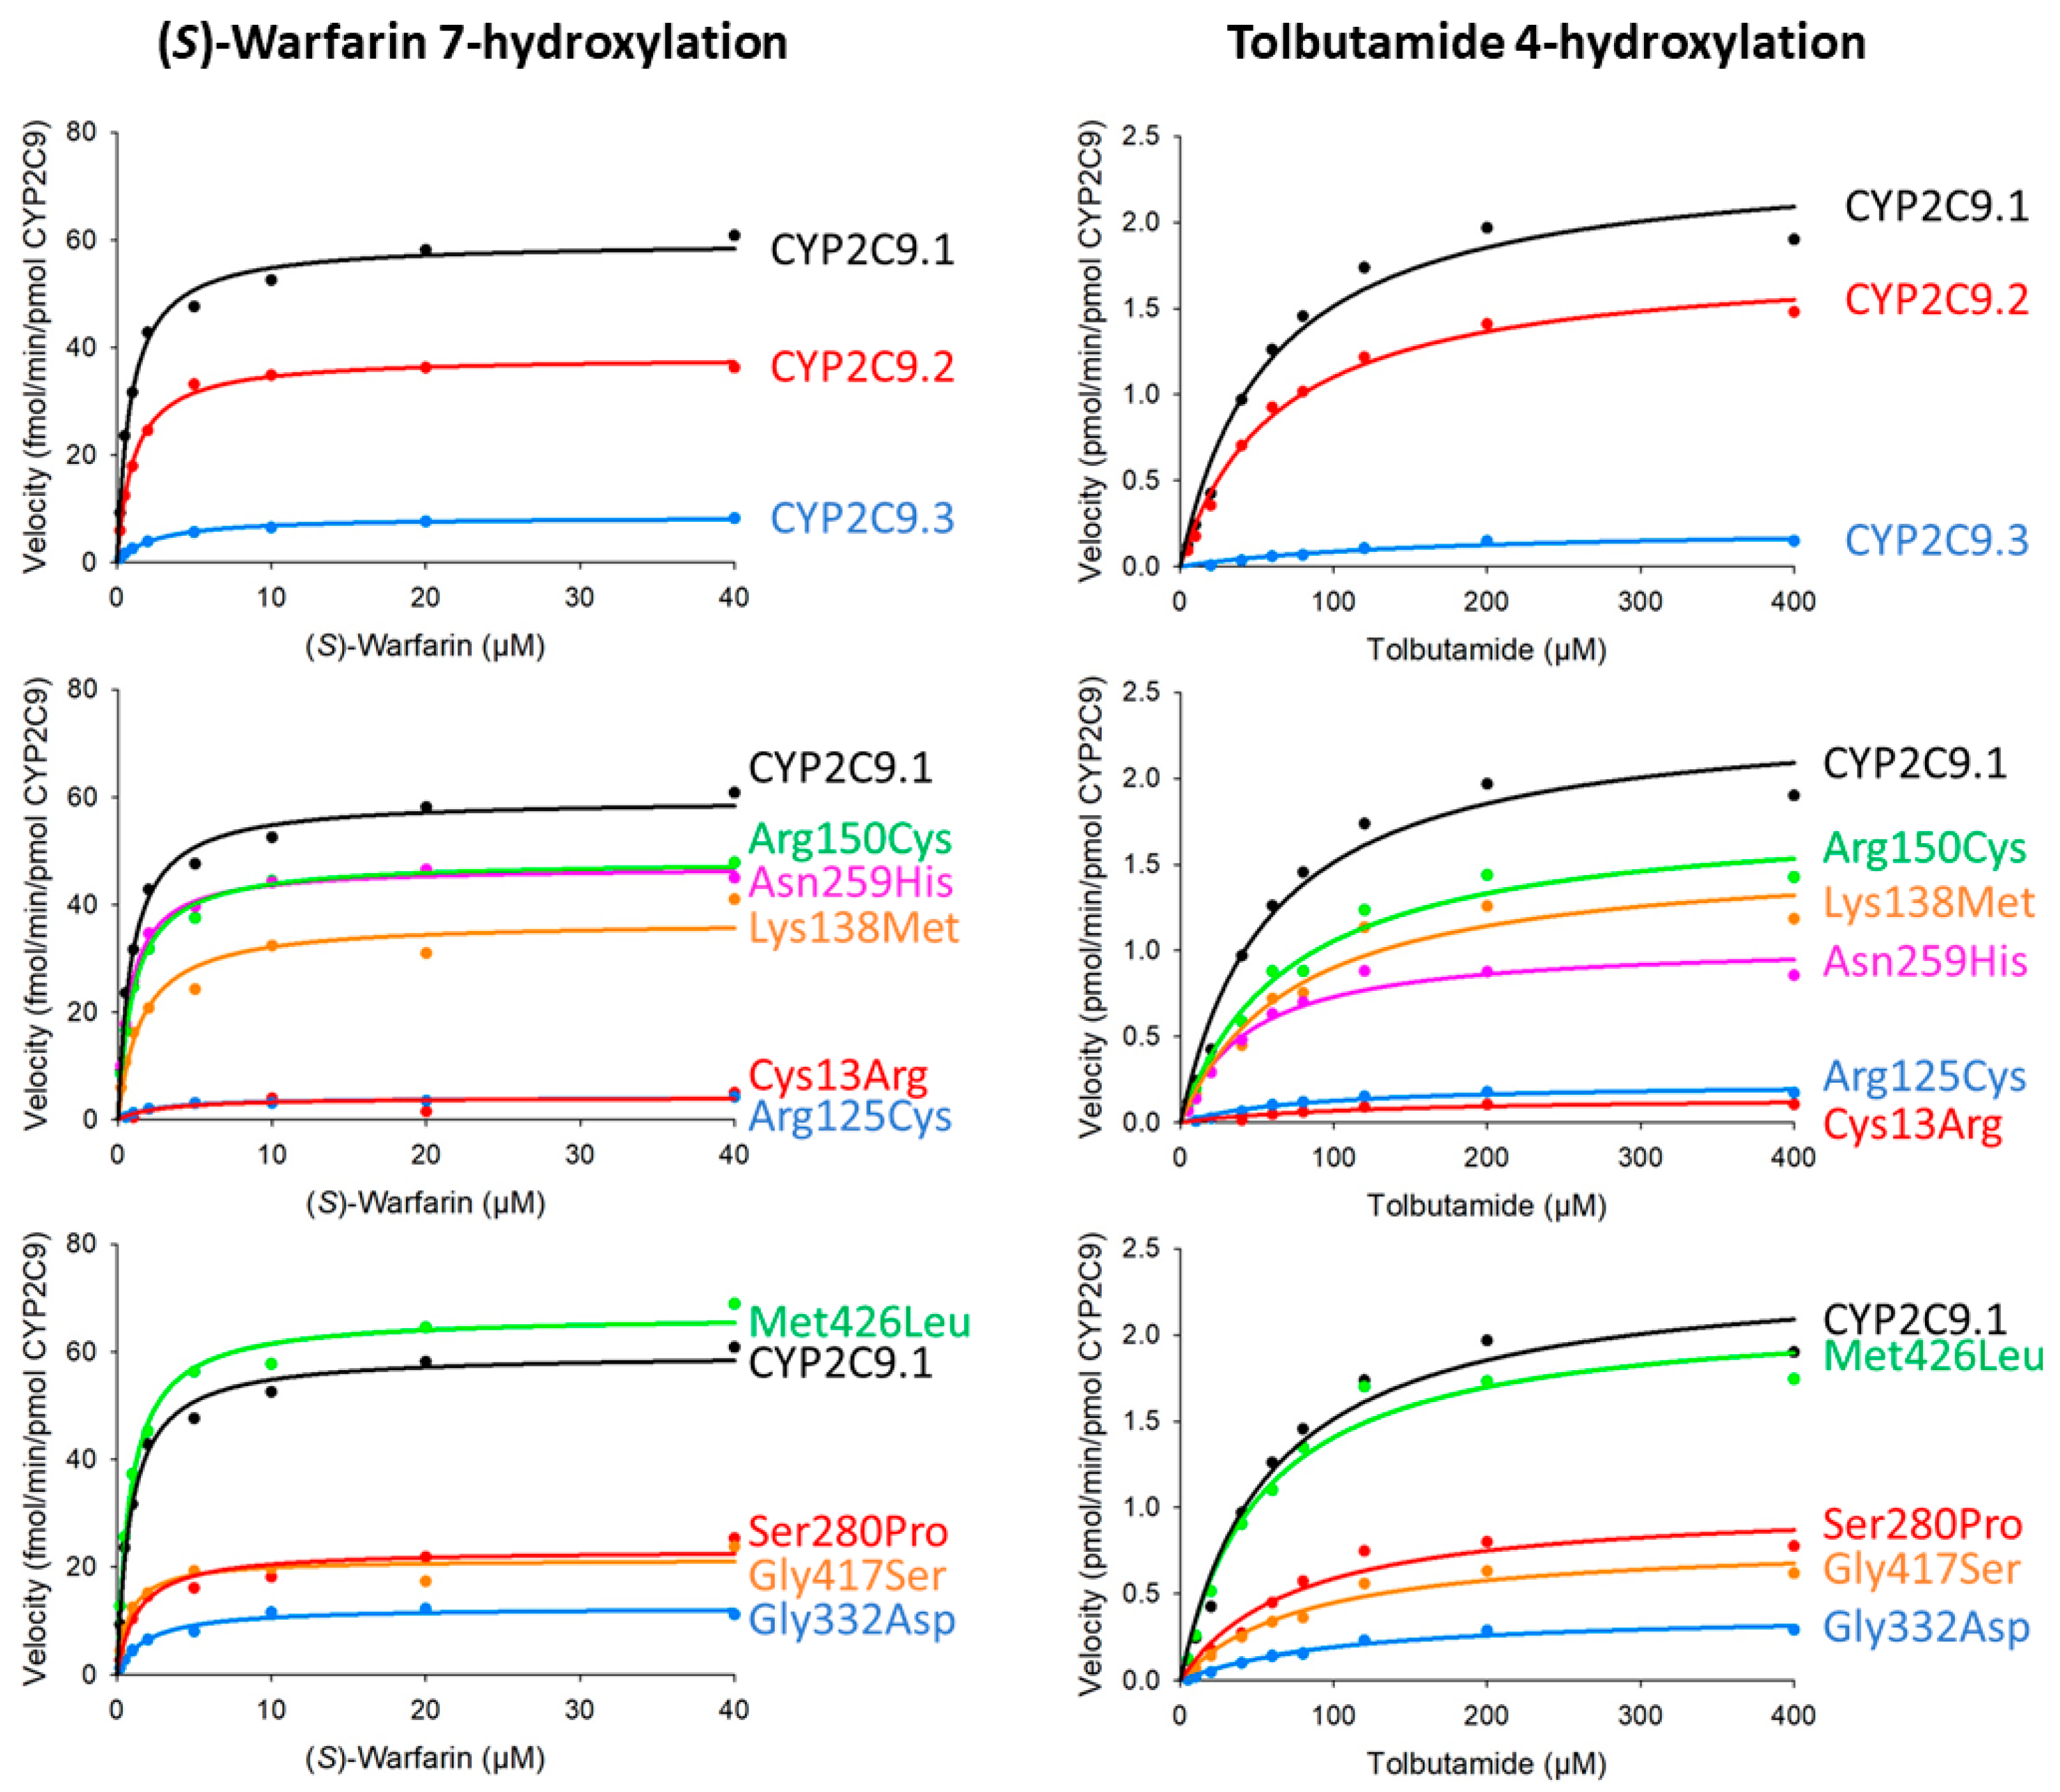
2.7. (S)-Warfarin 7-Hydroxylation
2.8. Tolbutamide 4-Hydroxylation
2.9. Three-Dimensional Structural Modeling of CYP2C9
2.10. Data Analysis
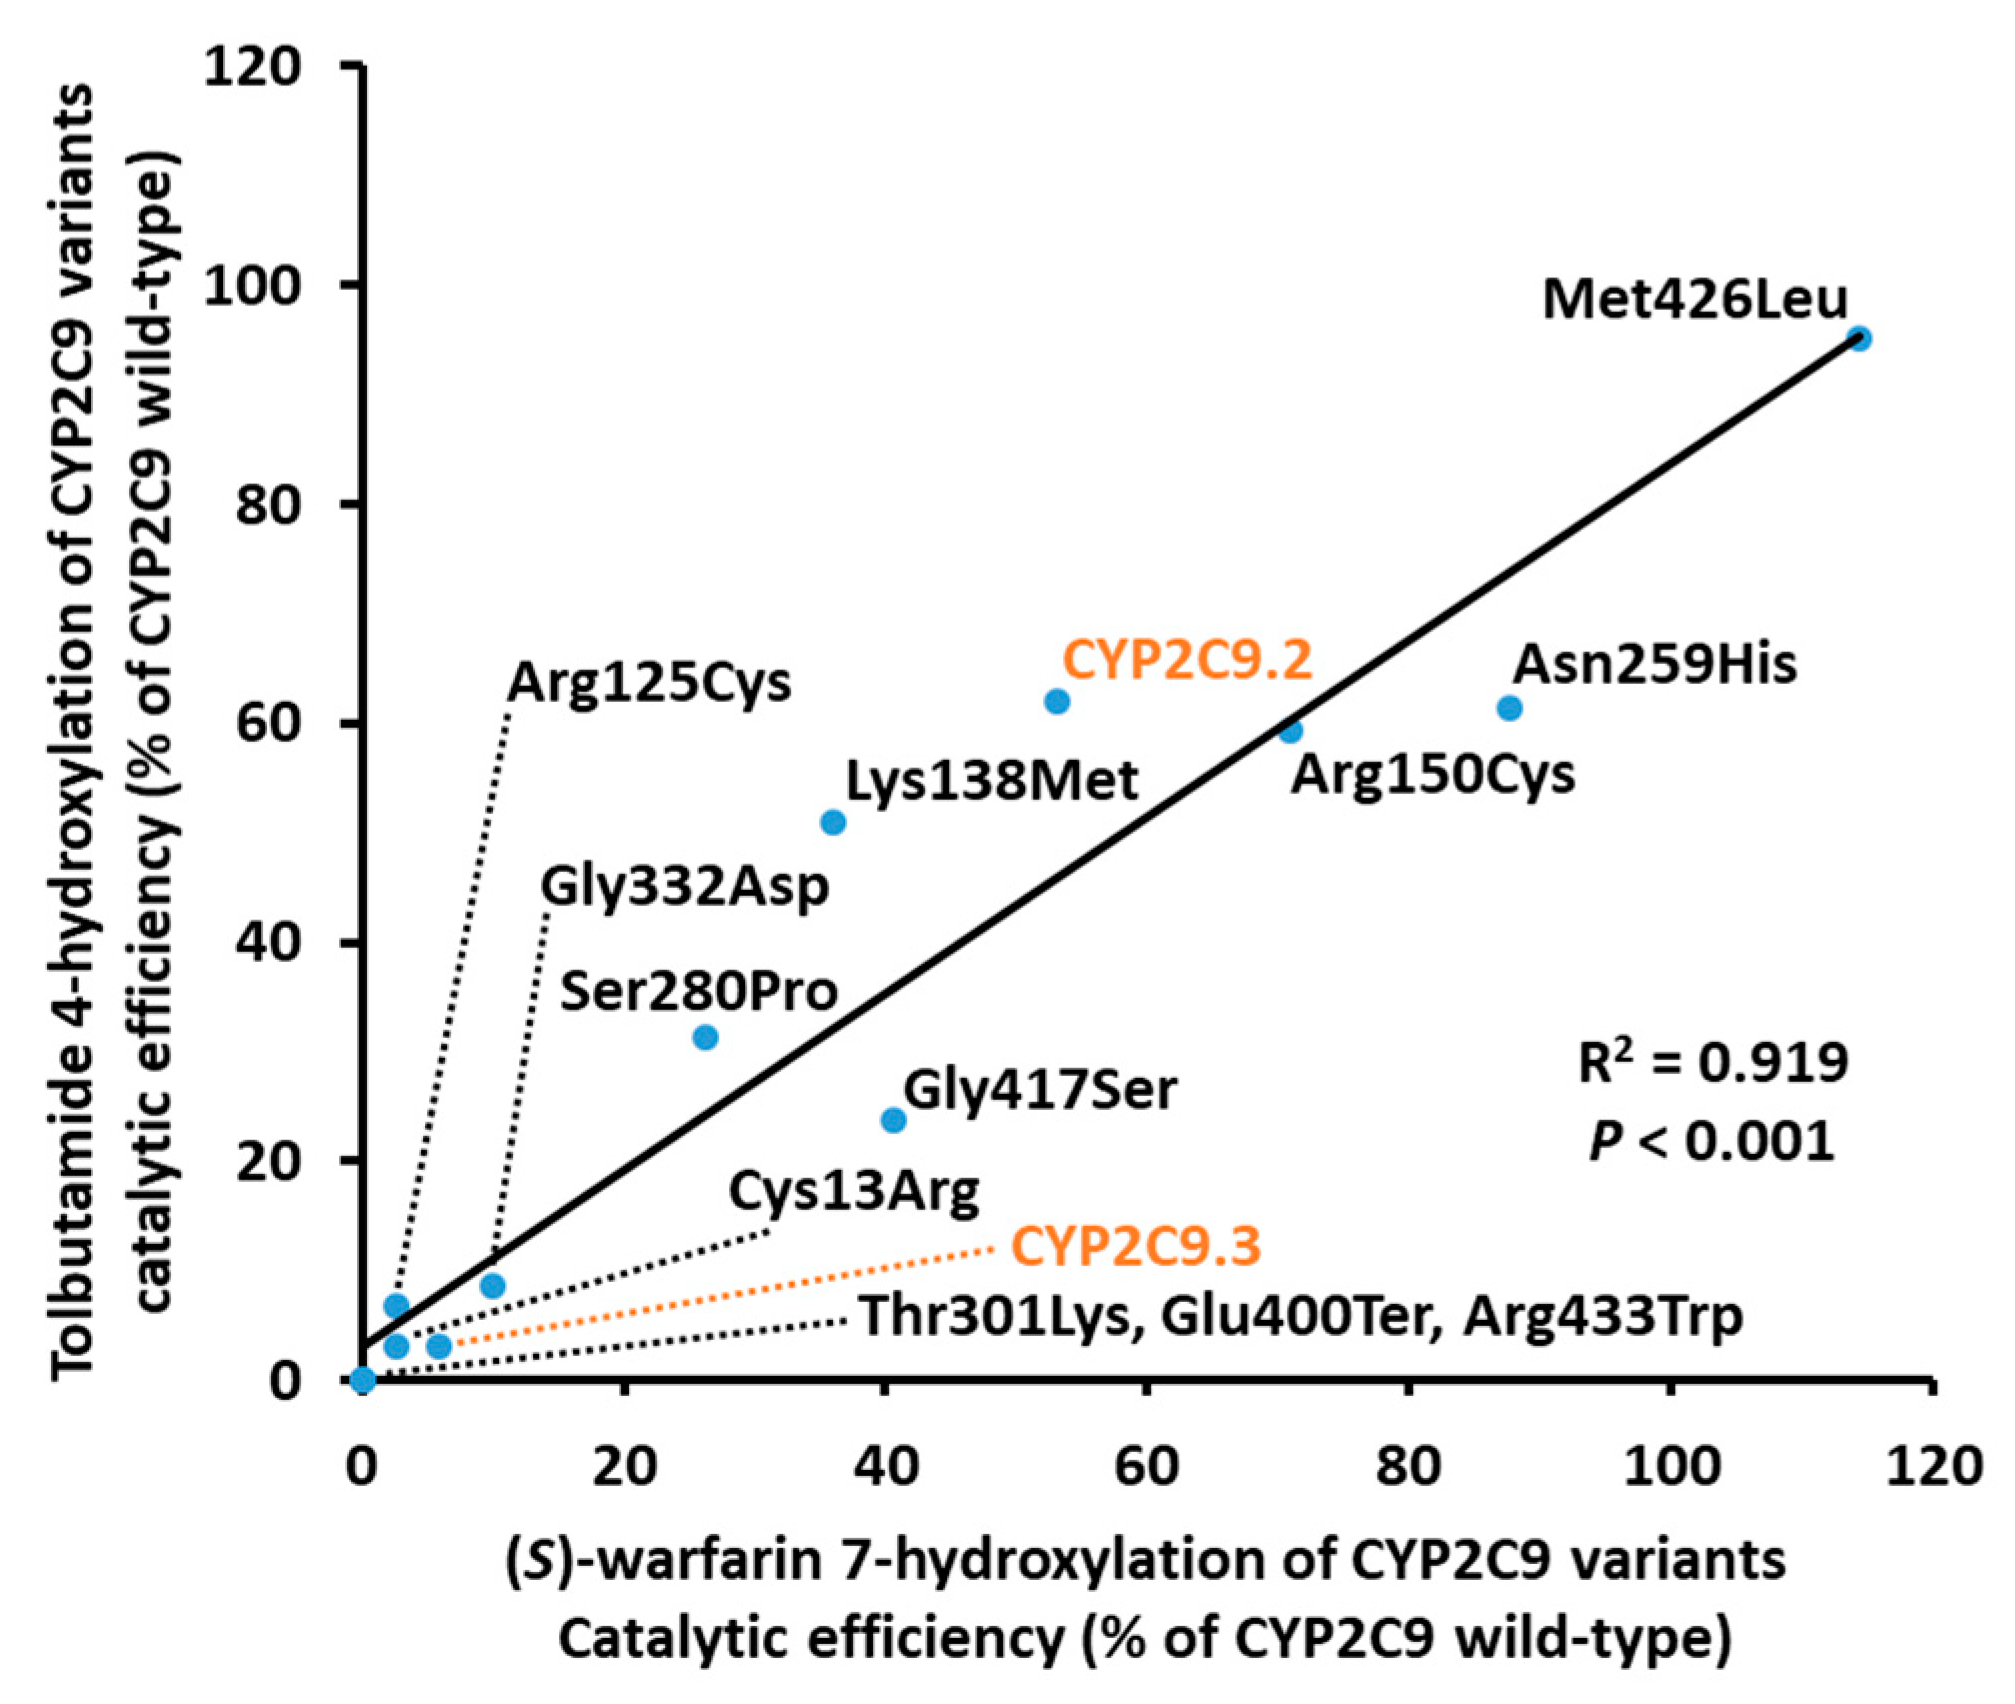
3. Results
4. Discussion
5. Conclusions
Supplementary Materials
Author Contributions
Funding
Institutional Review Board Statement
Informed Consent Statement
Data Availability Statement
Acknowledgments
Conflicts of Interest
References
- Evans, W.E.; Relling, M.V. Pharmacogenomics: Translating functional genomics into rational therapeutics. Science 1999, 286, 487–491. [Google Scholar] [CrossRef] [PubMed]
- Van der Weide, J.; Hinrichs, J.W. The influence of cytochrome P450 pharmacogenetics on disposition of common antidepressant and antipsychotic medications. Clin. Biochem. Rev. 2006, 27, 17–25. [Google Scholar] [PubMed]
- Lauschke, V.M.; Ingelman-Sundberg, M. The Importance of Patient-Specific Factors for Hepatic Drug Response and Toxicity. Int. J. Mol. Sci. 2016, 17, 1714. [Google Scholar] [CrossRef] [PubMed]
- Caudle, K.E.; Klein, T.E.; Hoffman, J.M.; Muller, D.J.; Whirl-Carrillo, M.; Gong, L.; McDonagh, E.M.; Sangkuhl, K.; Thorn, C.F.; Schwab, M.; et al. Incorporation of pharmacogenomics into routine clinical practice: The Clinical Pharmacogenetics Implementation Consortium (CPIC) guideline development process. Curr. Drug. Metab. 2014, 15, 209–217. [Google Scholar] [CrossRef]
- Hicks, J.K.; Bishop, J.R.; Sangkuhl, K.; Muller, D.J.; Ji, Y.; Leckband, S.G.; Leeder, J.S.; Graham, R.L.; Chiulli, D.L.; LLerena, A.; et al. Clinical Pharmacogenetics Implementation Consortium (CPIC) Guideline for CYP2D6 and CYP2C19 Genotypes and Dosing of Selective Serotonin Reuptake Inhibitors. Clin. Pharmacol. Ther. 2015, 98, 127–134. [Google Scholar] [CrossRef]
- Johnson, J.A.; Caudle, K.E.; Gong, L.; Whirl-Carrillo, M.; Stein, C.M.; Scott, S.A.; Lee, M.T.; Gage, B.F.; Kimmel, S.E.; Perera, M.A.; et al. Clinical Pharmacogenetics Implementation Consortium (CPIC) Guideline for Pharmacogenetics-Guided Warfarin Dosing: 2017 Update. Clin. Pharmacol. Ther. 2017, 102, 397–404. [Google Scholar] [CrossRef]
- Fujikura, K.; Ingelman-Sundberg, M.; Lauschke, V.M. Genetic variation in the human cytochrome P450 supergene family. Pharmacogenet. Genom. 2015, 25, 584–594. [Google Scholar] [CrossRef]
- Limdi, N.A.; Veenstra, D.L. Warfarin pharmacogenetics. Pharmacotherapy 2008, 28, 1084–1097. [Google Scholar] [CrossRef]
- Zanger, U.M.; Schwab, M. Cytochrome P450 enzymes in drug metabolism: Regulation of gene expression, enzyme activities, and impact of genetic variation. Pharmacol. Ther. 2013, 138, 103–141. [Google Scholar] [CrossRef]
- Gage, B.F.; Eby, C.; Johnson, J.A.; Deych, E.; Rieder, M.J.; Ridker, P.M.; Milligan, P.E.; Grice, G.; Lenzini, P.; Rettie, A.E.; et al. Use of pharmacogenetic and clinical factors to predict the therapeutic dose of warfarin. Clin. Pharmacol. Ther. 2008, 84, 326–331. [Google Scholar] [CrossRef]
- Gage, B.F.; Bass, A.R.; Lin, H.; Woller, S.C.; Stevens, S.M.; Al-Hammadi, N.; Li, J.; Rodriguez, T., Jr.; Miller, J.P.; McMillin, G.A.; et al. Effect of Genotype-Guided Warfarin Dosing on Clinical Events and Anticoagulation Control Among Patients Undergoing Hip or Knee Arthroplasty: The GIFT Randomized Clinical Trial. JAMA 2017, 318, 1115–1124. [Google Scholar] [CrossRef] [PubMed]
- Kaminsky, L.S.; Zhang, Z.Y. Human P450 metabolism of warfarin. Pharmacol. Ther. 1997, 73, 67–74. [Google Scholar] [CrossRef]
- Ferrari, M.; Pengo, V.; Barolo, M.; Bezzo, F.; Padrini, R. Assessing the relative potency of (S)- and (R)-warfarin with a new PK-PD model, in relation to VKORC1 genotypes. Eur. J. Clin. Pharmacol. 2017, 73, 699–707. [Google Scholar] [CrossRef] [PubMed]
- Zhang, J.; Tian, L.; Huang, J.; Huang, S.; Chai, T.; Shen, J. Cytochrome P450 2C9 gene polymorphism and warfarin maintenance dosage in pediatric patients: A systematic review and meta-analysis. Cardiovasc. Ther. 2017, 35, 26–32. [Google Scholar] [CrossRef]
- Lindh, J.D.; Holm, L.; Andersson, M.L.; Rane, A. Influence of CYP2C9 genotype on warfarin dose requirements—A systematic review and meta-analysis. Eur. J. Clin. Pharmacol. 2009, 65, 365–375. [Google Scholar] [CrossRef]
- Cha, P.C.; Mushiroda, T.; Takahashi, A.; Kubo, M.; Minami, S.; Kamatani, N.; Nakamura, Y. Genome-wide association study identifies genetic determinants of warfarin responsiveness for Japanese. Hum. Mol. Genet. 2010, 19, 4735–4744. [Google Scholar] [CrossRef]
- Duconge, J.; Ramos, A.S.; Claudio-Campos, K.; Rivera-Miranda, G.; Bermudez-Bosch, L.; Renta, J.Y.; Cadilla, C.L.; Cruz, I.; Feliu, J.F.; Vergara, C.; et al. A Novel Admixture-Based Pharmacogenetic Approach to Refine Warfarin Dosing in Caribbean Hispanics. PLoS ONE 2016, 11, e0145480. [Google Scholar] [CrossRef]
- Perera, M.A.; Cavallari, L.H.; Limdi, N.A.; Gamazon, E.R.; Konkashbaev, A.; Daneshjou, R.; Pluzhnikov, A.; Crawford, D.C.; Wang, J.; Liu, N.; et al. Genetic variants associated with warfarin dose in African-American individuals: A genome-wide association study. Lancet 2013, 382, 790–796. [Google Scholar] [CrossRef]
- Claudio-Campos, K.; Labastida, A.; Ramos, A.; Gaedigk, A.; Renta-Torres, J.; Padilla, D.; Rivera-Miranda, G.; Scott, S.A.; Ruano, G.; Cadilla, C.L.; et al. Warfarin Anticoagulation Therapy in Caribbean Hispanics of Puerto Rico: A Candidate Gene Association Study. Front. Pharmacol. 2017, 8, 347. [Google Scholar] [CrossRef]
- Ingelman-Sundberg, M.; Mkrtchian, S.; Zhou, Y.; Lauschke, V.M. Integrating rare genetic variants into pharmacogenetic drug response predictions. Hum. Genom. 2018, 12, 26. [Google Scholar] [CrossRef]
- Hiratsuka, M. In Vitro assessment of the allelic variants of cytochrome P450. Drug Metab. Pharmacokinet. 2012, 27, 68–84. [Google Scholar] [CrossRef] [PubMed]
- Dai, D.P.; Wang, Y.H.; Wang, S.H.; Geng, P.W.; Hu, L.M.; Hu, G.X.; Cai, J.P. In Vitro functional characterization of 37 CYP2C9 allelic isoforms found in Chinese Han population. Acta Pharmacol. Sin. 2013, 34, 1449–1456. [Google Scholar] [CrossRef] [PubMed]
- Niinuma, Y.; Saito, T.; Takahashi, M.; Tsukada, C.; Ito, M.; Hirasawa, N.; Hiratsuka, M. Functional characterization of 32 CYP2C9 allelic variants. Pharmacogenom. J. 2014, 14, 107–114. [Google Scholar] [CrossRef] [PubMed]
- Wang, Y.H.; Pan, P.P.; Dai, D.P.; Wang, S.H.; Geng, P.W.; Cai, J.P.; Hu, G.X. Effect of 36 CYP2C9 variants found in the Chinese population on losartan metabolism In Vitro. Xenobiotica 2014, 44, 270–275. [Google Scholar] [CrossRef]
- Dai, D.P.; Wang, S.H.; Geng, P.W.; Hu, G.X.; Cai, J.P. In vitro assessment of 36 CYP2C9 allelic isoforms found in the Chinese population on the metabolism of glimepiride. Basic Clin. Pharmacol. Toxicol. 2014, 114, 305–310. [Google Scholar] [CrossRef]
- Ji, Y.; Chen, S.; Zhao, L.; Pan, P.; Wang, L.; Cai, J.; Dai, D.; Hu, G.; Cai, J.P.; Huang, H. In Vitro assessment of 39 CYP2C9 variants found in the Chinese population on the metabolism of the model substrate fluoxetine and a summary of their effects on other substrates. J. Clin. Pharm. Ther. 2015, 40, 320–327. [Google Scholar] [CrossRef]
- Hiratsuka, M. Genetic Polymorphisms and In Vitro Functional Characterization of CYP2C8, CYP2C9, and CYP2C19 Allelic Variants. Biol. Pharm. Bull. 2016, 39, 1748–1759. [Google Scholar] [CrossRef]
- Cho, M.A.; Yoon, J.G.; Kim, V.; Kim, H.; Lee, R.; Lee, M.G.; Kim, D. Functional Characterization of Pharmcogenetic Variants of Human Cytochrome P450 2C9 in Korean Populations. Biomol. Ther. 2019, 27, 577–583. [Google Scholar] [CrossRef]
- Chen, H.; Dai, D.P.; Zhou, S.; Liu, J.; Wang, S.H.; Wu, H.L.; Zhou, Q.; Geng, P.W.; Chong, J.; Lu, Y.; et al. An identification and functional evaluation of a novel CYP2C9 variant CYP2C9*62. Chem. Biol. Interact. 2020, 327, 109168. [Google Scholar] [CrossRef]
- Hu, G.X.; Pan, P.P.; Wang, Z.S.; Yang, L.P.; Dai, D.P.; Wang, S.H.; Zhu, G.H.; Qiu, X.J.; Xu, T.; Luo, J.; et al. In Vitro and In Vivo characterization of 13 CYP2C9 allelic variants found in Chinese Han population. Drug Metab. Dispos. 2015, 43, 561–569. [Google Scholar] [CrossRef]
- Nagasaki, M.; Yasuda, J.; Katsuoka, F.; Nariai, N.; Kojima, K.; Kawai, Y.; Yamaguchi-Kabata, Y.; Yokozawa, J.; Danjoh, I.; Saito, S.; et al. Rare variant discovery by deep whole-genome sequencing of 1070 Japanese individuals. Nat. Commun. 2015, 6, 8018. [Google Scholar] [CrossRef] [PubMed]
- Kumondai, M.; Hishinuma, E.; Gutierrez Rico, E.M.; Ito, A.; Nakanishi, Y.; Saigusa, D.; Hirasawa, N.; Hiratsuka, M. Heterologous expression of high-activity cytochrome P450 in mammalian cells. Sci. Rep. 2020, 10, 14193. [Google Scholar] [CrossRef] [PubMed]
- Kumondai, M.; Gutierrez Rico, E.M.; Hishinuma, E.; Ueda, A.; Saito, S.; Saigusa, D.; Tadaka, S.; Kinoshita, K.; Nakayoshi, T.; Oda, A.; et al. Functional characterization of 40 CYP3A4 variants by assessing midazolam 1’-hydroxylation and testosterone 6beta-hydroxylation. Drug Metab Dispos 2020, in press. [Google Scholar] [CrossRef] [PubMed]
- Guengerich, F.P.; Martin, M.V.; Sohl, C.D.; Cheng, Q. Measurement of cytochrome P450 and NADPH-cytochrome P450 reductase. Nat. Protoc. 2009, 4, 1245–1251. [Google Scholar] [CrossRef] [PubMed]
- Nguyen, V.; Espiritu, M.; Elbarbry, F. Development and validation of a sensitive and specific LC-MS/MS cocktail assay for CYP450 enzymes: Application to study the effect of catechin on rat hepatic CYP activity. Biomed. Chromatogr. 2020, 34, e4789. [Google Scholar] [CrossRef] [PubMed]
- Maekawa, K.; Adachi, M.; Matsuzawa, Y.; Zhang, Q.; Kuroki, R.; Saito, Y.; Shah, M.B. Structural Basis of Single-Nucleotide Polymorphisms in Cytochrome P450 2C9. Biochemistry 2017, 56, 5476–5480. [Google Scholar] [CrossRef] [PubMed]
- Oda, A.; Yamaotsu, N.; Hirono, S. New AMBER force field parameters of heme iron for cytochrome P450s determined by quantum chemical calculations of simplified models. J. Comput. Chem. 2005, 26, 818–826. [Google Scholar] [CrossRef]
- Miyauchi, E.; Tachikawa, M.; Decleves, X.; Uchida, Y.; Bouillot, J.L.; Poitou, C.; Oppert, J.M.; Mouly, S.; Bergmann, J.F.; Terasaki, T.; et al. Quantitative Atlas of Cytochrome P450, UDP-Glucuronosyltransferase, and Transporter Proteins in Jejunum of Morbidly Obese Subjects. Mol. Pharm. 2016, 13, 2631–2640. [Google Scholar] [CrossRef]
- Nakamura, K.; Hirayama-Kurogi, M.; Ito, S.; Kuno, T.; Yoneyama, T.; Obuchi, W.; Terasaki, T.; Ohtsuki, S. Large-scale multiplex absolute protein quantification of drug-metabolizing enzymes and transporters in human intestine, liver, and kidney microsomes by SWATH-MS: Comparison with MRM/SRM and HR-MRM/PRM. Proteomics 2016, 16, 2106–2117. [Google Scholar] [CrossRef]
- Lewis, D.F. The CYP2 family: Models, mutants and interactions. Xenobiotica 1998, 28, 617–661. [Google Scholar] [CrossRef]
- Tretiakov, V.E.; Degtyarenko, K.N.; Uvarov, V.; Archakov, A.I. Secondary structure and membrane topology of cytochrome P450s. Arch. Biochem. Biophys. 1989, 275, 429–439. [Google Scholar] [CrossRef]
- Sakaguchi, M.; Tomiyoshi, R.; Kuroiwa, T.; Mihara, K.; Omura, T. Functions of signal and signal-anchor sequences are determined by the balance between the hydrophobic segment and the N-terminal charge. Proc. Natl. Acad. Sci. USA 1992, 89, 16–19. [Google Scholar] [CrossRef] [PubMed]
- Kuroiwa, T.; Sakaguchi, M.; Mihara, K.; Omura, T. Systematic analysis of stop-transfer sequence for microsomal membrane. J. Biol. Chem. 1991, 266, 9251–9255. [Google Scholar] [CrossRef]
- Omura, T.; Sato, R. The Carbon Monoxide-Binding Pigment of Liver Microsomes. Ii. Solubilization, Purification, and Properties. J. Biol. Chem. 1964, 239, 2379–2385. [Google Scholar] [CrossRef]
- Kumondai, M.; Hosono, H.; Maekawa, M.; Yamaguchi, H.; Mano, N.; Oda, A.; Hirasawa, N.; Hiratsuka, M. Functional characterization of 9 CYP2A13 allelic variants by assessment of nicotine C-oxidation and coumarin 7-hydroxylation. Drug Metab. Pharmacokinet. 2018, 33, 82–89. [Google Scholar] [CrossRef]
- Watanabe, T.; Saito, T.; Rico, E.M.G.; Hishinuma, E.; Kumondai, M.; Maekawa, M.; Oda, A.; Saigusa, D.; Saito, S.; Yasuda, J.; et al. Functional characterization of 40 CYP2B6 allelic variants by assessing efavirenz 8-hydroxylation. Biochem. Pharmacol. 2018, 156, 420–430. [Google Scholar] [CrossRef]
- Saito, T.; Gutierrez Rico, E.M.; Kikuchi, A.; Kaneko, A.; Kumondai, M.; Akai, F.; Saigusa, D.; Oda, A.; Hirasawa, N.; Hiratsuka, M. Functional characterization of 50 CYP2D6 allelic variants by assessing primaquine 5-hydroxylation. Drug Metab. Pharmacokinet. 2018, 33, 250–257. [Google Scholar] [CrossRef]
- Gutierrez Rico, E.M.; Kikuchi, A.; Saito, T.; Kumondai, M.; Hishinuma, E.; Kaneko, A.; Chan, C.W.; Gitaka, J.; Nakayoshi, T.; Oda, A.; et al. CYP2D6 genotyping analysis and functional characterization of novel allelic variants in a Ni-Vanuatu and Kenyan population by assessing dextromethorphan O-demethylation activity. Drug Metab. Pharmacokinet. 2020, 35, 89–101. [Google Scholar] [CrossRef]
- Veronese, M.E.; Doecke, C.J.; Mackenzie, P.I.; McManus, M.E.; Miners, J.O.; Rees, D.L.; Gasser, R.; Meyer, U.A.; Birkett, D.J. Site-directed mutation studies of human liver cytochrome P-450 isoenzymes in the CYP2C subfamily. Biochem. J. 1993, 289 Pt 2, 533–538. [Google Scholar] [CrossRef]
- Kobayashi, K.; Takahashi, O.; Hiratsuka, M.; Yamaotsu, N.; Hirono, S.; Watanabe, Y.; Oda, A. Evaluation of influence of single nucleotide polymorphisms in cytochrome P450 2B6 on substrate recognition using computational docking and molecular dynamics simulation. PLoS ONE 2014, 9, e96789. [Google Scholar] [CrossRef]
- Pandey, A.V.; Fluck, C.E. NADPH P450 oxidoreductase: Structure, function, and pathology of diseases. Pharmacol. Ther. 2013, 138, 229–254. [Google Scholar] [CrossRef] [PubMed]
- Parween, S.; Rojas Velazquez, M.N.; Udhane, S.S.; Kagawa, N.; Pandey, A.V. Variability in Loss of Multiple Enzyme Activities Due to the Human Genetic Variation P284T Located in the Flexible Hinge Region of NADPH Cytochrome P450 Oxidoreductase. Front. Pharmacol. 2019, 10, 1187. [Google Scholar] [CrossRef] [PubMed]
- Hlavica, P. Mechanistic basis of electron transfer to cytochromes p450 by natural redox partners and artificial donor constructs. Adv. Exp. Med. Biol. 2015, 851, 247–297. [Google Scholar] [CrossRef] [PubMed]
- Imai, Y.; Nakamura, M. Point mutations at threonine-301 modify substrate specificity of rabbit liver microsomal cytochromes P-450 (laurate (omega-1)-hydroxylase and testosterone 16 alpha-hydroxylase). Biochem. Biophys. Res. Commun. 1989, 158, 717–722. [Google Scholar] [CrossRef]
- Vaz, A.D.; Pernecky, S.J.; Raner, G.M.; Coon, M.J. Peroxo-iron and oxenoid-iron species as alternative oxygenating agents in cytochrome P450-catalyzed reactions: Switching by threonine-302 to alanine mutagenesis of cytochrome P450 2B4. Proc. Natl. Acad. Sci. USA 1996, 93, 4644–4648. [Google Scholar] [CrossRef]


| Nucleotide Mutations | rs Number | Amino Acid Substitutions | Frequency a (%) |
|---|---|---|---|
| 37T > C | Cys13Arg | 0.01 | |
| 373C > T | rs375805362 | Arg125Cys | 0.01 |
| 413A > T | Lys138Met | 0.03 | |
| 448C > T | rs17847037 | Arg150Cys | 0.03 |
| 775A > C | Asn259His | 0.02 | |
| 838T > C | rs1312254054 | Ser280Pro | 0.02 |
| 902C > A | Thr301Lys | 0.03 | |
| 995G > A | Gly332Asp | 0.02 | |
| 1198G > T | Glu400Ter | 0.01 | |
| 1249G > A | Gly417Ser | 0.01 | |
| 1276A > C | Met426Leu | 0.05 | |
| 1297C > T | rs776908257 | Arg433Trp | 0.01 |
| Variants | CYP Content (pmol/mg Protein) | CYP Holoenzyme Content (pmol/mg Protein) | CPR Content (pmol/mg Protein) | Cytochrome b5 Content (pmol/mg Protein) | CYP: CPR Ratio | CYP: Cytochrome b5 Ratio |
|---|---|---|---|---|---|---|
| CYP2C9.1 (wild-type) | 207.25 ± 9.33 | 148.84 ± 6.41 | 214.14 ± 22.31 | 45.96 ± 3.59 | 0.97 | 4.51 |
| CYP2C9.2 (Arg144Cys) | 171.00 ± 6.08 | 149.45 ± 8.98 | 167.54 ± 17.23 | 39.66 ± 1.62 | 1.02 | 4.31 |
| CYP2C9.3 (Ile359Leu) | 252.74 ± 20.82 | 86.14 ± 6.97 ** | 205.88 ± 16.04 | 43.69 ± 5.27 | 1.23 | 5.78 |
| Cys13Arg | 51.56 ± 10.21 | 21.36 ± 1.61 *** | 161.12 ± 11.40 | 17.91 ± 2.61 | 0.32 | 2.88 |
| Arg125Cys | 155.69 ± 5.00 | 71.49 ± 4.81 *** | 242.71 ± 42.42 | 21.37 ± 2.91 | 0.64 | 7.28 |
| Lys138Met | 205.52 ± 11.64 | 160.29 ± 4.22 | 329.41 ± 33.03 | 31.43 ± 1.61 | 0.52 | 6.54 |
| Arg150Cys | 208.77 ± 9.39 | 24.87 ± 1.88 *** | 410.39 ± 31.02 | 38.44 ± 4.24 | 0.51 | 5.43 |
| Asn259His | 176.58 ± 5.26 | 79.83 ± 8.53 * | 276.70 ± 16.37 | 24.30 ± 3.01 | 0.64 | 7.27 |
| Ser280Pro | 149.27 ± 4.59 | 33.59 ± 0.76 ** | 227.28 ± 22.88 | 42.81 ± 3.29 | 0.66 | 3.49 |
| Thr301Lys | 191.66 ± 4.10 | 204.64 ± 7.20 * | 370.58 ± 12.57 | 60.14 ± 4.25 | 0.52 | 3.19 |
| Gly332Asp | 151.22 ± 2.15 | 14.31 ± 0.60 ** | 277.25 ± 10.25 | 41.07 ± 1.77 | 0.55 | 3.68 |
| Glu400Ter | 159.68 ± 7.07 | N.D. | 328.46 ± 15.42 | 50.52 ± 4.58 | 0.49 | 3.16 |
| Gly417Ser | 189.31 ± 11.25 | 14.23 ± 2.07 *** | 371.82 ± 36.04 | 51.20 ± 2.21 | 0.51 | 3.70 |
| Met426Leu | 181.17 ± 3.32 | 86.46 ± 3.90 ** | 354.21 ± 12.93 | 35.95 ± 2.86 | 0.51 | 5.04 |
| Arg433Trp | 188.41 ± 19.06 | N.D. | 453.54 ± 18.79 | 52.23 ± 2.70 | 0.42 | 3.61 |
| Variants | Km (μM) | kcat (fmol/Min/pmol CYP2C9) | Vmax (pmol/Min/mg Protein) | Catalytic Efficiency (kcat/Km) (% of Wild-Type) | CLint (µL/Min/Mg Protein) (% of Wild-Type) |
|---|---|---|---|---|---|
| CYP2C9.1 (wild-type) | 0.88 ± 0.06 | 59.64 ± 0.86 | 12.36 ± 0.18 | 67.87 ± 4.30 (100.00) | 14.07 ± 0.89 (100.00) |
| CYP2C9.2 (Arg144Cys) | 1.06 ± 0.05 | 38.26 ± 2.49 * | 6.54 ± 0.43 *** | 36.00 ± 1.01 * (53.05) | 6.16 ± 0.17 * (43.77) |
| CYP2C9.3 (Ile359Leu) | 2.87 ± 2.11 | 8.74 ± 1.05 *** | 2.21 ± 0.26 *** | 3.98 ± 1.90 *** (5.87) | 1.01 ± 0.48 *** (7.16) |
| Cys13Arg | 2.36 ± 0.30 | 4.04 ± 0.35 *** | 0.21 ± 0.02 *** | 1.73 ± 0.19 * (2.54) | 0.09 ± 0.01 ** (0.63) |
| Arg125Cys | 2.45 ± 0.53 | 4.18 ± 0.19 *** | 0.65 ± 0.03 *** | 1.77 ± 0.47 ** (2.61) | 0.28 ± 0.07 ** (1.96) |
| Lys138Met | 1.52 ± 0.13 | 37.01 ± 0.98 *** | 7.61 ± 0.20 *** | 24.48 ± 2.16 ** (36.07) | 5.03 ± 0.44 ** (35.76) |
| Arg150Cys | 1.01 ± 0.10 | 48.23 ± 2.02 * | 10.07 ± 0.42 * | 48.16 ± 3.28 (70.97) | 10.06 ± 0.69 (71.49) |
| Asn259His | 0.79 ± 0.04 | 47.1 ± 2.02 * | 8.32 ± 0.36 ** | 59.5 ± 2.41 (87.62) | 10.5 ± 0.43 (74.66) |
| Ser280Pro | 1.33 ± 0.24 | 23.15 ± 1.46 *** | 3.46 ± 0.22 *** | 17.79 ± 3.52 *** (26.21) | 2.66 ± 0.53 *** (18.88) |
| Thr301Lys | N.D. | N.D. | N.D. | N.D. | N.D. |
| Gly332Asp | 1.87 ± 0.27 | 12.50 ± 0.36 *** | 1.89 ± 0.05 *** | 6.75 ± 0.77 ** (9.94) | 1.02 ± 0.12 * (7.25) |
| Glu400Ter | N.D. | N.D. | N.D. | N.D. | N.D. |
| Gly417Ser | 0.78 ± 0.04 | 21.36 ± 1.01 *** | 4.04 ± 0.19 *** | 27.53 ± 1.39 * (40.56) | 5.21 ± 0.26 * (37.05) |
| Met426Leu | 0.86 ± 0.02 | 66.80 ± 1.55 | 12.10 ± 0.28 | 77.65 ± 3.15 (114.40) | 14.1 ± 0.57 (100.01) |
| Arg433Trp | N.D. | N.D. | N.D. | N.D. | N.D. |
| Variants | Km (μM) | kcat (pmol/Min/pmol CYP2C9) | Vmax (nmol/Min/Mg protein) | Catalytic Efficiency (kcat/Km) (% of Wild-Type) | CLint (µL/Min/Mg Protein) (% of Wild-Type) |
|---|---|---|---|---|---|
| CYP2C9.1 (wild-type) | 53.20 ± 1.86 | 2.29 ± 0.11 | 474.30 ± 28.95 | 43.04 ± 2.16 (100.00) | 8.92 ± 0.55 (100.00) |
| CYP2C9.2 (Arg144Cys) | 72.71 ± 6.84 | 1.93 ± 0.12 | 330.31 ± 24.89 * | 26.65 ± 0.94 * (61.91) | 4.56 ± 0.20 * (51.08) |
| CYP2C9.3 (Ile359Leu) | 176.31 ± 7.07 ** | 0.24 ± 0.00 * | 60.94 ± 0.97 * | 1.37 ± 0.04 ** (3.18) | 0.35 ± 0.01 ** (3.88) |
| Cys13Arg | 104.64 ± 15.72 | 0.14 ± 0.01 ** | 7.14 ± 0.79 ** | 1.34 ± 0.08 ** (3.10) | 0.07 ± 0.00 ** (0.77) |
| Arg125Cys | 76.80 ± 4.17 | 0.22 ± 0.00 * | 34.44 ± 0.82 * | 2.89 ± 0.13 * (6.71) | 0.45 ± 0.02 ** (5.03) |
| Lys138Met | 68.98 ± 3.24 | 1.51 ± 0.05 * | 310.31 ± 13.17 * | 21.94 ± 1.27 * (50.97) | 4.51 ± 0.32 * (50.53) |
| Arg150Cys | 70.41 ± 2.38 * | 1.80 ± 0.03 | 374.84 ± 8.34 | 25.55 ± 1.35 * (59.35) | 5.33 ± 0.34 * (59.79) |
| Asn259His | 36.90 ± 2.55 * | 0.97 ± 0.03 * | 171.40 ± 6.05 * | 26.40 ± 1.47 * (61.33) | 4.66 ± 0.32 * (52.26) |
| Ser280Pro | 79.63 ± 10.54 | 1.06 ± 0.02 * | 157.71 ± 4.22 * | 13.47 ± 1.59 *** (31.30) | 2.01 ± 0.29 *** (22.55) |
| Thr301Lys | N.D. | N.D. | N.D. | N.D. | N.D. |
| Gly332Asp | 112.62 ± 32.21 | 0.40 ± 0.07 *** | 61.17 ± 13.68 *** | 3.71 ± 0.41 ** (8.61) | 0.56 ± 0.08 ** (6.29) |
| Glu400Ter | N.D. | N.D. | N.D. | N.D. | N.D. |
| Gly417Ser | 77.82 ± 3.07 * | 0.79 ± 0.03 * | 149.79 ± 6.81 * | 10.20 ± 0.78 ** (23.69) | 1.93 ± 0.18 ** (21.64) |
| Met426Leu | 52.25 ± 2.99 | 2.14 ± 0.10 | 387.42 ± 22.18 | 41.00 ± 0.84 (95.16) | 7.42 ± 0.19 (83.19) |
| Arg433Trp | N.D. | N.D. | N.D. | N.D. | N.D. |
Publisher’s Note: MDPI stays neutral with regard to jurisdictional claims in published maps and institutional affiliations. |
© 2021 by the authors. Licensee MDPI, Basel, Switzerland. This article is an open access article distributed under the terms and conditions of the Creative Commons Attribution (CC BY) license (http://creativecommons.org/licenses/by/4.0/).
Share and Cite
Kumondai, M.; Ito, A.; Gutiérrez Rico, E.M.; Hishinuma, E.; Ueda, A.; Saito, S.; Nakayoshi, T.; Oda, A.; Tadaka, S.; Kinoshita, K.; et al. Functional Assessment of 12 Rare Allelic CYP2C9 Variants Identified in a Population of 4773 Japanese Individuals. J. Pers. Med. 2021, 11, 94. https://doi.org/10.3390/jpm11020094
Kumondai M, Ito A, Gutiérrez Rico EM, Hishinuma E, Ueda A, Saito S, Nakayoshi T, Oda A, Tadaka S, Kinoshita K, et al. Functional Assessment of 12 Rare Allelic CYP2C9 Variants Identified in a Population of 4773 Japanese Individuals. Journal of Personalized Medicine. 2021; 11(2):94. https://doi.org/10.3390/jpm11020094
Chicago/Turabian StyleKumondai, Masaki, Akio Ito, Evelyn Marie Gutiérrez Rico, Eiji Hishinuma, Akiko Ueda, Sakae Saito, Tomoki Nakayoshi, Akifumi Oda, Shu Tadaka, Kengo Kinoshita, and et al. 2021. "Functional Assessment of 12 Rare Allelic CYP2C9 Variants Identified in a Population of 4773 Japanese Individuals" Journal of Personalized Medicine 11, no. 2: 94. https://doi.org/10.3390/jpm11020094
APA StyleKumondai, M., Ito, A., Gutiérrez Rico, E. M., Hishinuma, E., Ueda, A., Saito, S., Nakayoshi, T., Oda, A., Tadaka, S., Kinoshita, K., Maekawa, M., Mano, N., Hirasawa, N., & Hiratsuka, M. (2021). Functional Assessment of 12 Rare Allelic CYP2C9 Variants Identified in a Population of 4773 Japanese Individuals. Journal of Personalized Medicine, 11(2), 94. https://doi.org/10.3390/jpm11020094