
A Prospective Study: Highlights of Hippocampal Spectroscopy in Cognitive Impairment in Patients with Type 1 and Type 2 Diabetes

 ,
,
Abstract
1. Introduction
2. Materials and Methods
2.1. Sample Characteristics
2.2. Risk Factors
2.3. Cognitive Function
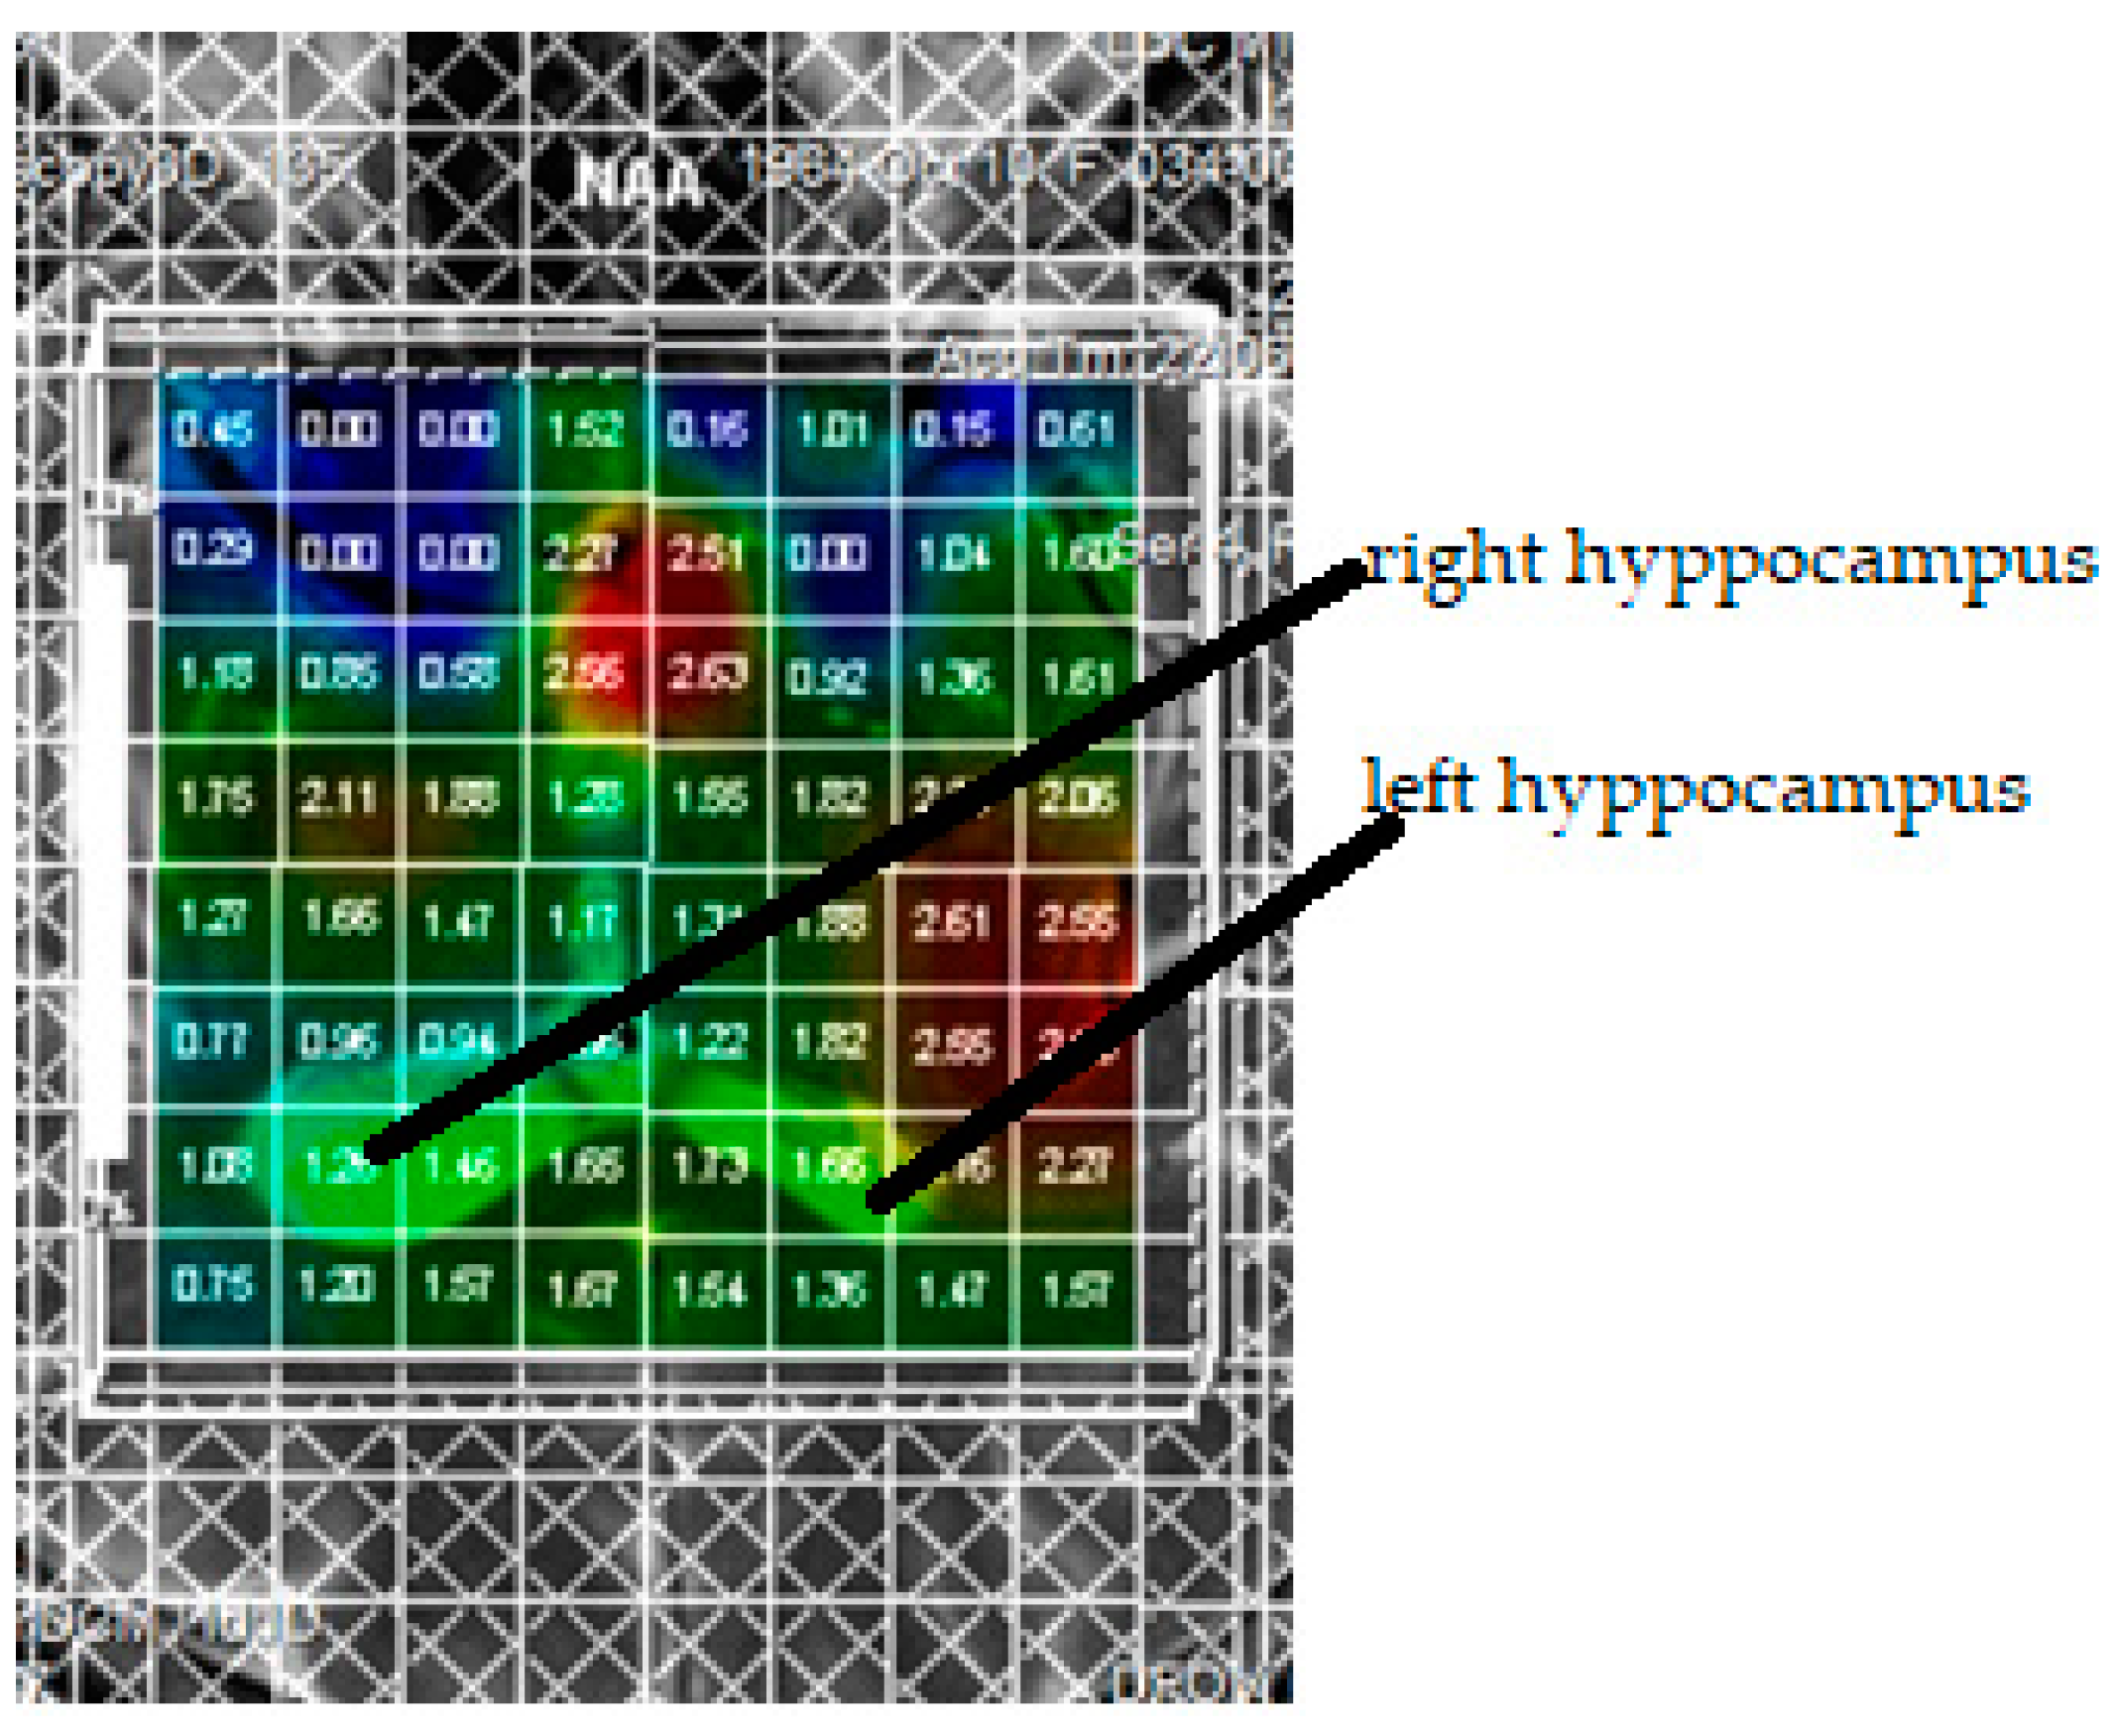
2.4. Proton Spectroscopy of the Brain
3. Results
4. Discussion and Conclusions
Author Contributions
Funding
Institutional Review Board Statement
Informed Consent Statement
Data Availability Statement
Conflicts of Interest
References
- Biessels, G.J.; Reagan, L.P. Hippocampal insulin resistance and cognitive dysfunction. Nat. Rev. Neurosci. 2015, 16, 660–671. [Google Scholar] [CrossRef] [PubMed]
- Santhakumari, R.; Reddy, I.Y.; Archana, R. Effect of Type 2 Diabetes Mellitus on Brain Metabolites by Using Proton Magnetic Resonance Spectroscopy—A Systematic Review. Int. J. Pharma Bio Sci. 2014, 5, 1118–1123. [Google Scholar] [PubMed]
- Duarte, J.M.; De Lausanne, E.P.F. Metabolism in the Diabetic Brain: Neurochemical Profiling by 1H Magnetic Resonance Spectroscopy. DMD 2016, 3, 1–6. [Google Scholar] [CrossRef]
- Sherry, E.B.; Lee, P.; Choi, I.-Y. In Vivo NMR Studies of the Brain with Hereditary or Acquired Metabolic Disorders. Neurochem. Res. 2015, 40, 2647–2685. [Google Scholar] [CrossRef] [PubMed]
- Duarte, J.M.; Do, K.Q.; Gruetter, R. Longitudinal neurochemical modifications in the aging mouse brain measured in vivo by 1H magnetic resonance spectroscopy. Neurobiol. Aging 2014, 35, 1660–1668. [Google Scholar] [CrossRef]
- Kantarci, K.; Jack, C.R.; Xu, Y.C. Regional metabolic patterns in mild cognitive impairment and Alzheimer’s disease. A 1H MRS study. Neurology 2000, 55, 210–217. [Google Scholar] [CrossRef]
- Lin, A.-L.; Rothman, D.L. What have novel imaging techniques revealed about metabolism in the aging brain? Future Neurol. 2014, 9, 341–354. [Google Scholar] [CrossRef]
- Samoilova, I.G.; Rotkank, M.A.; Kudlay, D.A.; Zhukova, N.G.; Matveeva, M.V.; Tolmachev, I.V. A prognostic model of cognitive impairment in patients with type 1 diabetes mellitus. Zhurnal Nevrol. Psikhiatr. 2020, 120, 19–22. [Google Scholar] [CrossRef]
- Nasreddine, Z.S. MoCA Test Mandatory Training and Certification: What Is the Purpose? J. Am. Geriatr. Soc. 2020, 68, 444–445. [Google Scholar] [CrossRef]
- Kreis, R.; Ross, B.D. Cerebral metabolic disturbances in patients with subacute and chronic diabetes mellitus: Detection with proton MR spectroscopy. Radiology 1992, 184, 123–130. [Google Scholar] [CrossRef] [PubMed]
- Gerget, O.M. Bionic models for identification of biological systems. J. Phys. Conf. Ser. 2017, 803, 12046. [Google Scholar] [CrossRef]
- Nathan, D.M.; DCCT/Edic Research Group. The diabetes control and complications trial/epidemiology of diabetes interventions and complications study at 30 years: Overview. Diabetes Care 2014, 37, 9–16. [Google Scholar] [CrossRef]
- Tong, J.; Geng, H.; Zhang, Z.; Zhu, X.; Meng, Q.; Sun, X.; Zhang, M.; Qian, R.; Sun, L.; Liang, Q. Brain metabolite alterations demonstrated by proton magnetic resonance spectroscopy in diabetic patients with retinopathy. Magn. Reson. Imaging 2014, 32, 1037–1042. [Google Scholar] [CrossRef]
- Zhang, J.; Liu, Z.; Li, Z.; Wang, Y.; Chen, Y.; Li, X.; Chen, K.; Shu, N.; Zhang, Z. Disrupted White Matter Network and Cognitive Decline in Type 2 Diabetes Patients. J. Alzheimer’s Dis. 2016, 53, 185–195. [Google Scholar] [CrossRef]
- Matveeva, M.V.; Samoilova, Y.G.; Zhukova, N.G.; Tolmachov, I.V.; Brazovskiy, K.S.; Leiman, O.P.; Fimushkina, N.Y.; Rotkank, M.A. Neuroimaging methods for assessing the brain in diabetes mellitus (literature review). Bull. Sib. Med. 2020, 19, 189–194. [Google Scholar] [CrossRef]
- Lu, X.; Gong, W.; Wen, Z.; Hu, L.; Peng, Z.; Zha, Y. Correlation Between Diabetic Cognitive Impairment and Diabetic Retinopathy in Patients with T2DM by 1H-MRS. Front. Neurol. 2019, 10, 1068. [Google Scholar] [CrossRef] [PubMed]
- Ma, X.C.; Wang, G.Z.; Wang, Y.C.; Fang, Q.; Wang, K.L. Clinical analysis of hydrogen proton spectroscopy in hippocampus of type 2 diabetic patients. Modern J. Integr. Tradit. Chin. Western Med. 2010, 32, 45–48. [Google Scholar]
- van der Graaf, M.; Janssen, S.W.; van Asten, J.J. Metabolic profile of the hippocampus of Zucker Diabetic Fatty rats assessed by in vivo 1H magnetic resonancespectroscopy. NMR Biomed. 2004, 17, 405–410. [Google Scholar] [CrossRef]
- Zhang, H.; Huang, M.; Gao, L.; Lei, H. Region-Specific Cerebral Metabolic Alterations in Streptozotocin-Induced Type 1 Diabetic Rats: An in vivo Proton Magnetic Resonance Spectroscopy Study. Br. J. Pharmacol. 2015, 35, 1738–1745. [Google Scholar] [CrossRef]
- Wiegers, E.C.; Rooijackers, H.M.; Tack, C.J.; Heerschap, A.; De Galan, B.E.; Van Der Graaf, M. Brain Lactate Concentration Falls in Response to Hypoglycemia in Patients with Type 1 Diabetes and Impaired Awareness of Hypoglycemia. Diabetes 2016, 65, 1601–1605. [Google Scholar] [CrossRef]
- Bejide, M.; Contreras, P.; Homm, P.; Duran, B.; García-Merino, J.A.; Rosenkranz, A.; DeNardin, J.C.; Del Río, R.; Hevia, S.A. Nickel Nanopillar Arrays Electrodeposited on Silicon Substrates Using Porous Alumina Templates. Molecules 2020, 25, 5377. [Google Scholar] [CrossRef] [PubMed]
- Biessels, G.J.; Deary, I.J.; Ryan, C.M. Cognition and diabetes: A lifespan perspective. Lancet Neurol. 2008, 7, 184–190. [Google Scholar] [CrossRef]
- Hansen, T.M.; Brock, B.; Juhl, A.; Drewes, A.M.; Vorum, H.; Andersen, C.U.; Jakobsen, P.E.; Karmisholt, J.; Frøkjær, J.B.; Brock, C. Brain spectroscopy reveals that N-acetylaspartate is associated to peripheral sensorimotor neuropathy in type 1 diabetes. J. Diabetes Its Complicat. 2019, 33, 323–328. [Google Scholar] [CrossRef]
- Zhao, X.; Han, Q.; Gang, X.; Wang, G. Altered brain metabolites in patients with diabetes mellitus and related complications—Evidence from 1H MRS study. Biosci. Rep. 2018, 38. [Google Scholar] [CrossRef] [PubMed]
- Seaquist, E.R. The Impact of Diabetes on Cerebral Structure and Function. Psychosom. Med. 2015, 77, 616–621. [Google Scholar] [CrossRef] [PubMed]


| Parameters | Type 1 Diabetes and Cognitive Dysfunction | Type 1 Diabetes and Normal Cognitive Functions | Type 2 Diabetes and Cognitive Dysfunction | Type 2 Diabetes and Normal Cognitive Function |
|---|---|---|---|---|
| Age, years | 44 (42–48) | 45 (43–48) | 53 (37–69) | 53 (31–71) |
| Disease duration, years | 13 (10–21) | 13 (6–23) | 10 (4–14) | 9 (2–13) |
| HbA1с, % | 8.4 (6.6–9.3) | 7.4 (5.4–10.1) | 8.2 (6.3–9.9) | 7.9 (6.2–9.1) |
| Glycemia, mmol/l | 8 (5.6–18.3) | 8 (7–9) | 7.5 (5.6–9.0) | 7.2 (7.0–7.5) |
| Hippocampal Metabolites | Type 1 Diabetes and Cognitive Dysfunction | Type 1 Diabetes and Normal Cognitive Functions | Type 2 Diabetes and Cognitive Dysfunction | Type 2 Diabetes and Normal Cognitive Function |
|---|---|---|---|---|
| NAA left | 1.796 ± 0.418 * | 1.5705 ± 0.317 | 1.723 ± 0.427 * | 0.768 ± 0.472 |
| NAA right | 1.851 ± 0.320 | 1.848 ± 0.204 | 1.966 ± 0.580 * | 0.574 ± 0.158 |
| Cho left | 0.854 ± 0.255 | 0.946 ± 0.088 | 2.028 ± 1.333 * | 0.949 ± 0.223 |
| Cho right | 0.919 ± 0.239 * | 1.312 ± 0.496 | 1.119 ± 0.699 | 1.101 ± 0.257 |
| Cr left | 0.901 ± 0.212 | 0.905 ± 0.190 | 0.924 ± 0.137 * | 0.741 ± 0.233 |
| Cr right | 0.900 ± 0.116 | 0.939 ± 0.136 | 1.567 ± 0.429 * | 0.582 ± 0.246 |
| PCr left | 1.419 ± 0.297 * | 1.219 ± 0.271 | 1.162 ± 0.483 * | 0.667 ± 0.175 |
| PCr right | 2.025 ± 0.723 | 1.466 ± 0.450 | 2.147 ± 0.740 * | 0.523 ± 0.167 |
| NAA/Cr left | 0.544 ± 0.293 | 0.596 ± 0.161 | 1.787 ± 0.406 * | 0.616 ± 0.226 |
| NAA/Cr right | 0.498 ± 0.102 | 0.513 ± 0.087 | 1.980 ± 0.913 * | 0.536 ± 0.140 |
| NAA/Cho left | 0.568 ± 0.217 | 0.624 ± 0.117 | 0.970 ± 0.138 | 0.913 ± 0.388 |
| NAA/Cho right | 0.592 ± 0.123 * | 0.723 ± 0.304 | 1.332 ± 0.684 * | 1.106 ± 0.342 |
| Cho/Cr left | 1.118 ± 0.358 * | 1.087 ± 0.249 | 1.820 ± 1.246 | 1.700 ± 0.456 |
| Cho/Cr right | 1.204 ± 0.216 * | 1.437 ± 0.615 | 1.017 ± 0.184 * | 1.998 ± 0.785 |
| Parameters | Spearman’s Criterion | p |
|---|---|---|
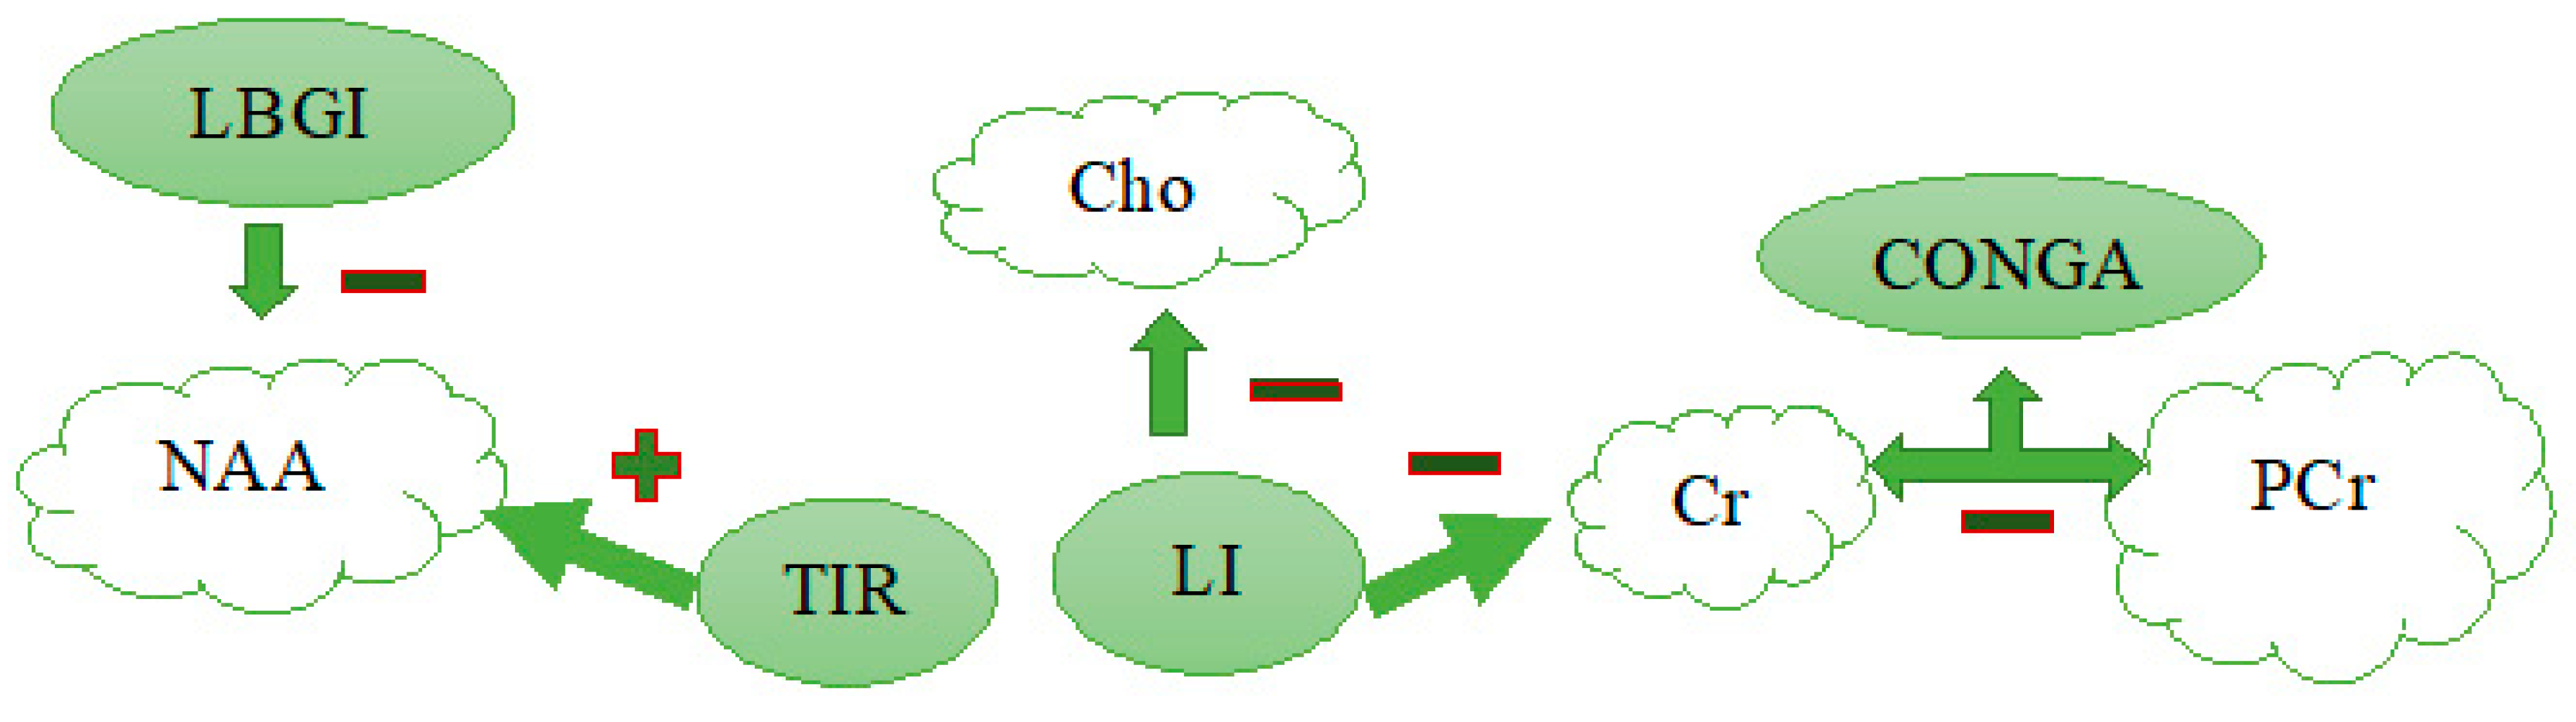
| Cr and HbA1с | −0.8 | 0.007 |
| Cr and LI | −0.7 | 0.03 |
| Cr and mean | −0.8 | 0.007 |
| NAA-Cr & mean | −0.6 | 0.048 |
| Cho-Cr and CONGA | −0.6 | 0.04 |
| Cho-Cr & LI | −0.6 | 0.03 |
Publisher’s Note: MDPI stays neutral with regard to jurisdictional claims in published maps and institutional affiliations. |
© 2021 by the authors. Licensee MDPI, Basel, Switzerland. This article is an open access article distributed under the terms and conditions of the Creative Commons Attribution (CC BY) license (http://creativecommons.org/licenses/by/4.0/).
Share and Cite
Samoilova, J.; Matveeva, M.; Tonkih, O.; Kudlau, D.; Oleynik, O.; Kanev, A. A Prospective Study: Highlights of Hippocampal Spectroscopy in Cognitive Impairment in Patients with Type 1 and Type 2 Diabetes. J. Pers. Med. 2021, 11, 148. https://doi.org/10.3390/jpm11020148
Samoilova J, Matveeva M, Tonkih O, Kudlau D, Oleynik O, Kanev A. A Prospective Study: Highlights of Hippocampal Spectroscopy in Cognitive Impairment in Patients with Type 1 and Type 2 Diabetes. Journal of Personalized Medicine. 2021; 11(2):148. https://doi.org/10.3390/jpm11020148
Chicago/Turabian StyleSamoilova, Julia, Mariia Matveeva, Olga Tonkih, Dmitry Kudlau, Oxana Oleynik, and Aleksandr Kanev. 2021. "A Prospective Study: Highlights of Hippocampal Spectroscopy in Cognitive Impairment in Patients with Type 1 and Type 2 Diabetes" Journal of Personalized Medicine 11, no. 2: 148. https://doi.org/10.3390/jpm11020148
APA StyleSamoilova, J., Matveeva, M., Tonkih, O., Kudlau, D., Oleynik, O., & Kanev, A. (2021). A Prospective Study: Highlights of Hippocampal Spectroscopy in Cognitive Impairment in Patients with Type 1 and Type 2 Diabetes. Journal of Personalized Medicine, 11(2), 148. https://doi.org/10.3390/jpm11020148