
Personalized Consideration of Admission-Glucose Gap between Estimated Average and Initial Glucose Levels on Short-Term Stroke Outcome

 , , ,
, , ,
Abstract
:1. Introduction
2. Materials and Methods
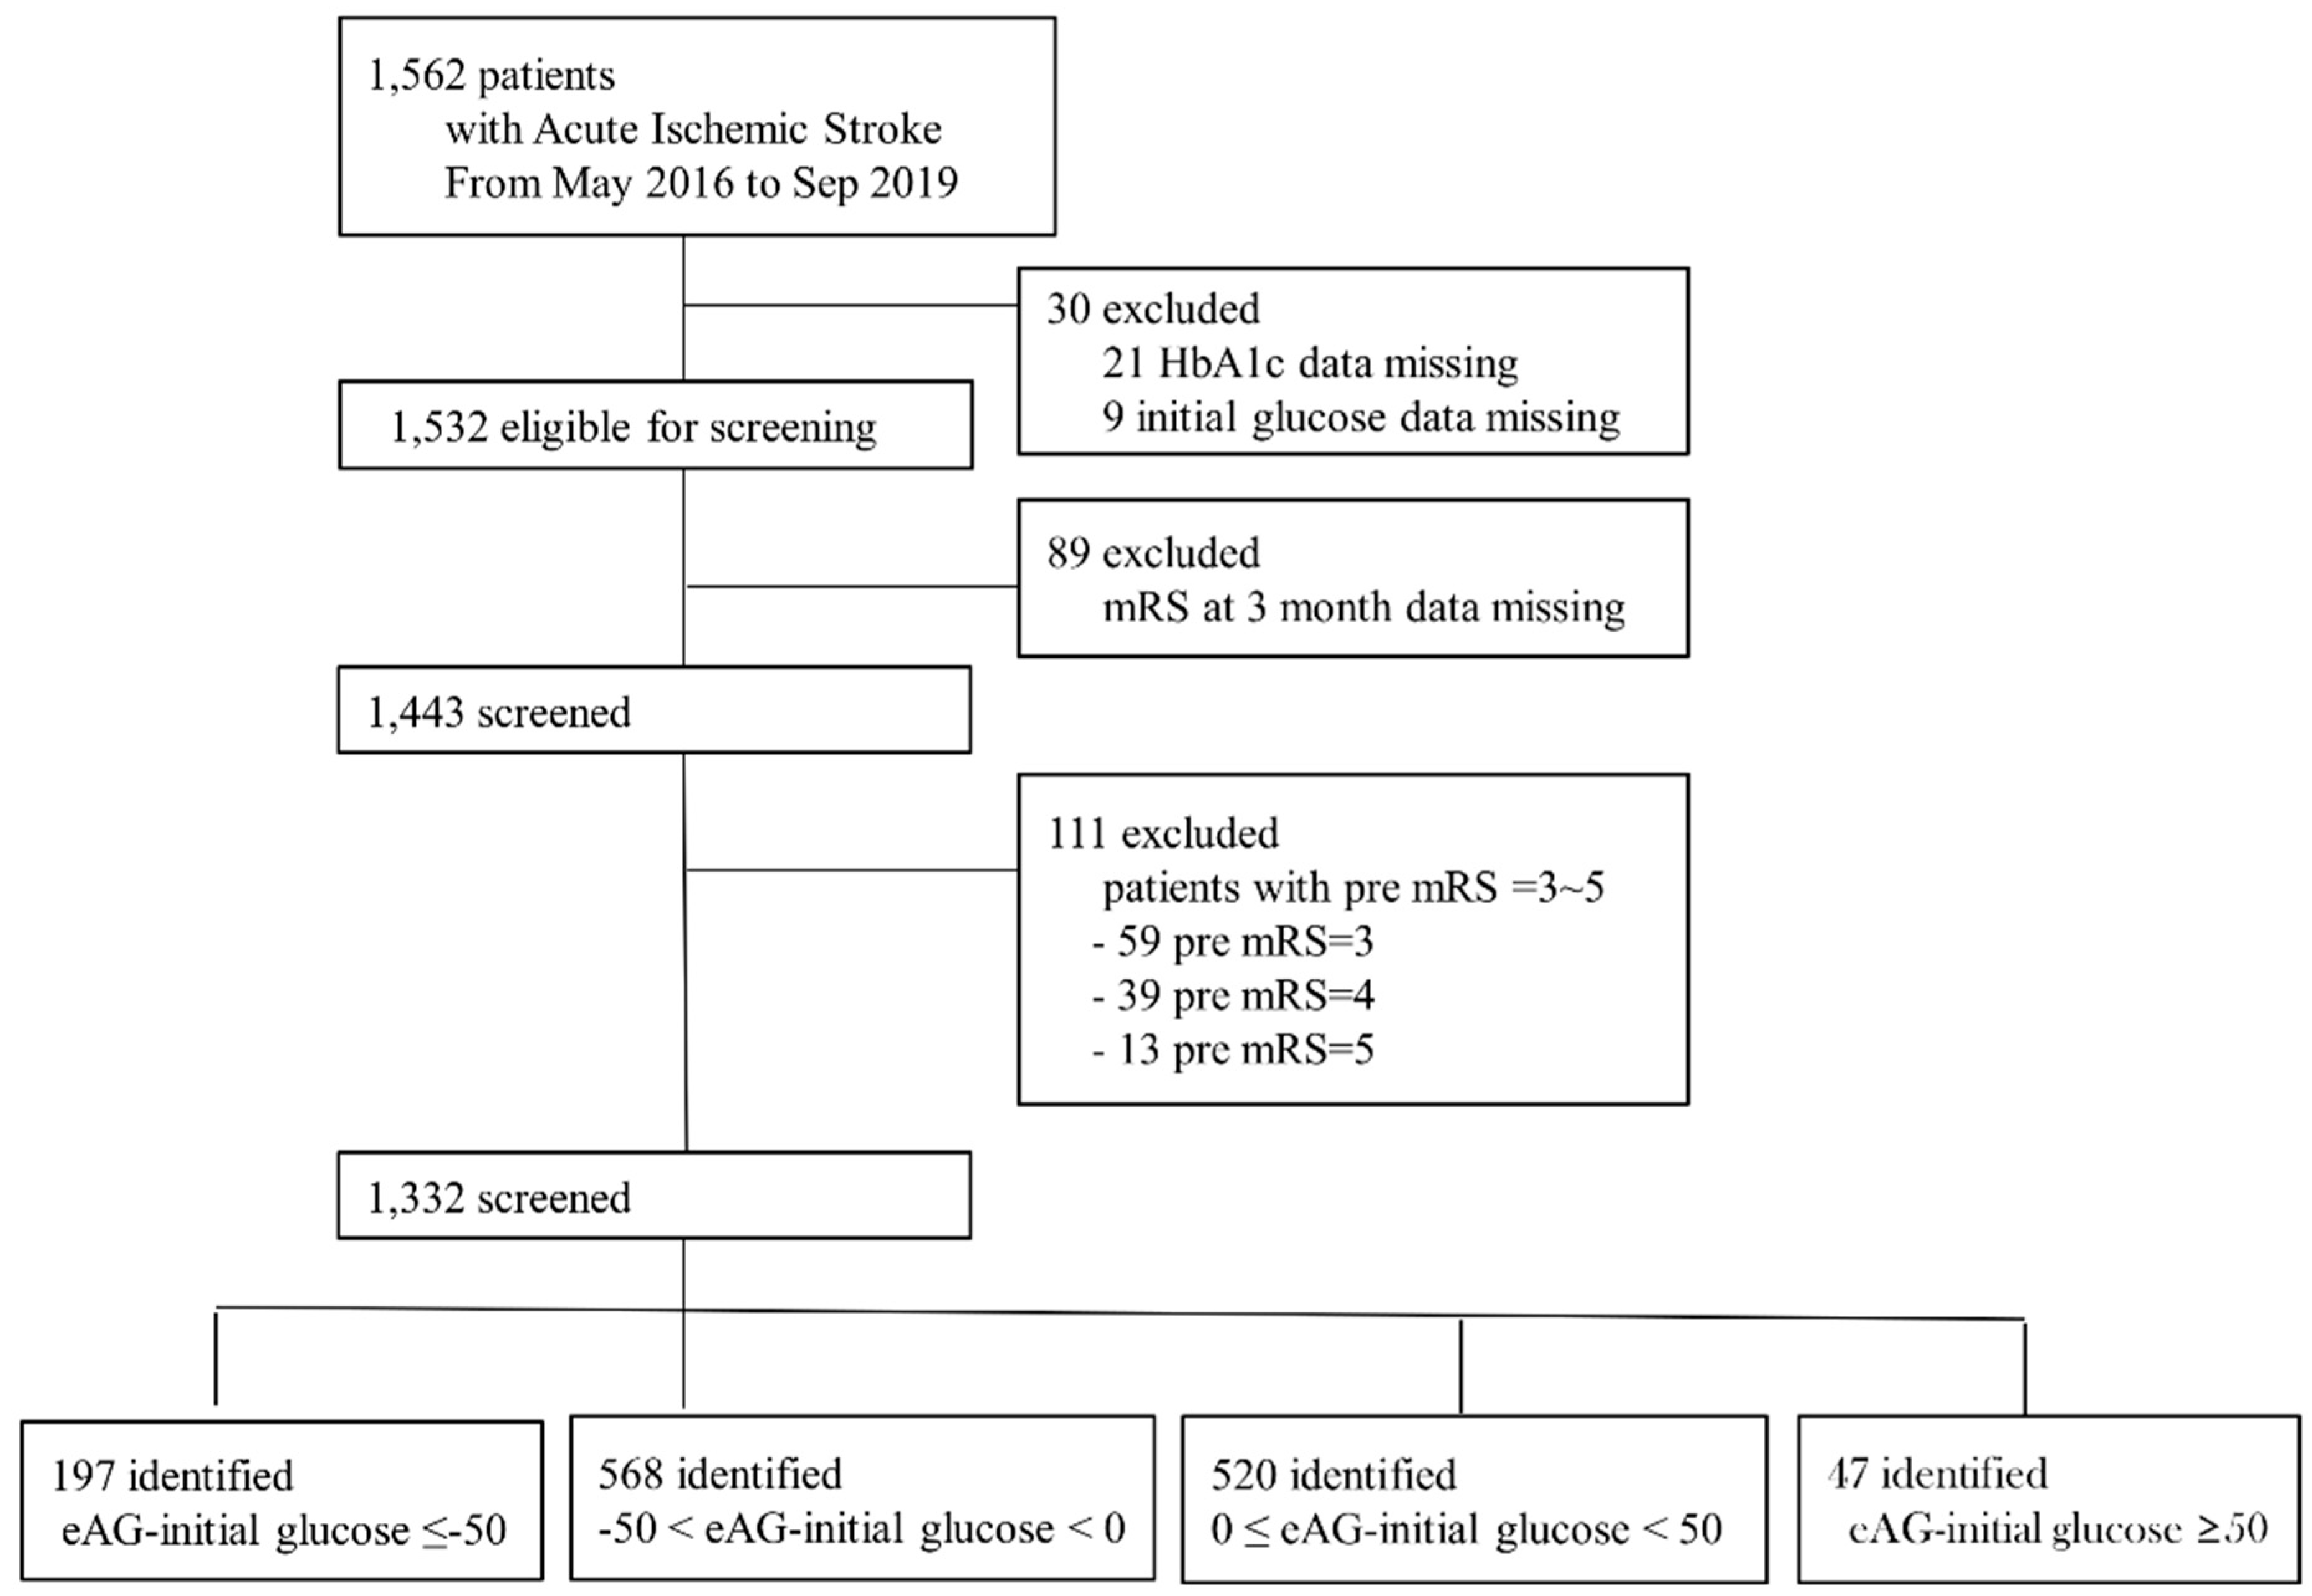
2.1. Study Population
2.2. Clinical Information
2.3. Statistical Analysis
2.4. Data-Availability Statement
3. Results
4. Discussion
5. Conclusions
Supplementary Materials
Author Contributions
Funding
Institutional Review Board Statement
Informed Consent Statement
Data Availability Statement
Acknowledgments
Conflicts of Interest
Abbreviations
| AIS | acute ischemic stroke |
| eAG | estimated average glucose levels |
| mRS | modified Rankin Scale |
| OR | odds ratio |
| HbA1c | glycated hemoglobin |
| TOAST | Trial of Org 10172 in Acute Stroke Treatment |
| BMI | body-mass index |
| INS | initial neurological severity |
| NIHSS | National Institute of Health Stroke Scale (NIHSS) score |
| GA | glycated albumin |
| SD | standard deviation |
| CIs | confidence intervals |
| ECASS-II | second European Cooperative Acute Stroke Study |
References
- Tian, L.; Zhu, J.; Liu, L.; Liang, Y.; Li, J.; Yang, Y. Hemoglobin A1c and short-term outcomes in patients with acute myocardial infarction undergoing primary angioplasty: An observational multicenter study. Coron. Artery Dis. 2013, 24, 16–22. [Google Scholar] [CrossRef]
- Choi, K.H.; Kim, J.H.; Kang, K.W.; Kim, J.T.; Choi, S.M.; Lee, S.H.; Park, M.S.; Kim, B.C.; Kim, M.K.; Cho, K.H. HbA1c (Glycated Hemoglobin) Levels and Clinical Outcome Post-Mechanical Thrombectomy in Patients With Large Vessel Occlusion. Stroke 2018. [Google Scholar] [CrossRef] [PubMed]
- Yong, M.; Kaste, M. Dynamic of hyperglycemia as a predictor of stroke outcome in the ECASS-II trial. Stroke 2008, 39, 2749–2755. [Google Scholar] [CrossRef] [Green Version]
- Song, T.-J.; Chang, Y.; Chun, M.-Y.; Lee, C.-Y.; Kim, A.R.; Kim, Y.; Kim, Y.-J. High Dietary Glycemic Load is Associated with Poor Functional Outcome in Patients with Acute Cerebral Infarction. J. Clin. Neurol. 2018, 14, 165–173. [Google Scholar] [CrossRef] [PubMed] [Green Version]
- Broocks, G.; Kemmling, A.; Aberle, J.; Kniep, H.; Bechstein, M.; Flottmann, F.; Leischner, H.; Faizy, T.D.; Nawabi, J.; Schön, G.; et al. Ischemic Lesion Water Uptake in Acute Stroke: Is Blood Glucose Related to Cause and Effect? J. Stroke 2019, 21, 347–349. [Google Scholar] [CrossRef]
- Baird, T.A.; Parsons, M.W.; Phan, T.; Butcher, K.S.; Desmond, P.M.; Tress, B.M.; Colman, P.G.; Chambers, B.R.; Davis, S.M. Persistent poststroke hyperglycemia is independently associated with infarct expansion and worse clinical outcome. Stroke 2003, 34, 2208–2214. [Google Scholar] [CrossRef] [PubMed] [Green Version]
- Capes, S.E.; Hunt, D.; Malmberg, K.; Pathak, P.; Gerstein, H.C. Stress hyperglycemia and prognosis of stroke in nondiabetic and diabetic patients: A systematic overview. Stroke 2001, 32, 2426–2432. [Google Scholar] [CrossRef] [Green Version]
- Zsuga, J.; Gesztelyi, R.; Kemeny-Beke, A.; Fekete, K.; Mihalka, L.; Adrienn, S.M.; Kardos, L.; Csiba, L.; Bereczki, D. Different effect of hyperglycemia on stroke outcome in non-diabetic and diabetic patients--a cohort study. Neurol. Res. 2012, 34, 72–79. [Google Scholar] [CrossRef] [PubMed]
- Klingbeil, K.D.; Koch, S.; Dave, K.R. Potential link between post-acute ischemic stroke exposure to hypoglycemia and hemorrhagic transformation. Int. J. Stroke Off. J. Int. Stroke Soc. 2020, 15, 477–483. [Google Scholar] [CrossRef]
- Zhang, Z.; Yan, J.; Shi, H. Hyperglycemia as a Risk Factor of Ischemic Stroke. J. Drug Metab. Toxicol. 2013, 4. [Google Scholar] [CrossRef]
- Bruno, A.; Levine, S.R.; Frankel, M.R.; Brott, T.G.; Lin, Y.; Tilley, B.C.; Lyden, P.D.; Broderick, J.P.; Kwiatkowski, T.G.; Fineberg, S.E. Admission glucose level and clinical outcomes in the NINDS rt-PA Stroke Trial. Neurology 2002, 59, 669–674. [Google Scholar] [CrossRef]
- Cheng, Y.; Luo, J.; Lin, Y.; Zeng, Y.; Yu, J.; Lin, Y. Impact of hyperglycaemia on complications in patients who had a stroke after thrombolysis. Postgrad. Med. J. 2020. [Google Scholar] [CrossRef]
- Ahmed, N.; Dávalos, A.; Eriksson, N.; Ford, G.A.; Glahn, J.; Hennerici, M.; Mikulik, R.; Kaste, M.; Lees, K.R.; Lindsberg, P.J.; et al. Association of admission blood glucose and outcome in patients treated with intravenous thrombolysis: Results from the Safe Implementation of Treatments in Stroke International Stroke Thrombolysis Register (SITS-ISTR). Arch. Neurol. 2010, 67, 1123–1130. [Google Scholar] [CrossRef] [Green Version]
- Hu, G.C.; Hsieh, S.F.; Chen, Y.M.; Hu, Y.N.; Kang, C.L.; Chien, K.L. The prognostic roles of initial glucose level and functional outcomes in patients with ischemic stroke: Difference between diabetic and nondiabetic patients. Disabil. Rehabil. 2012, 34, 34–39. [Google Scholar] [CrossRef]
- Nathan, D.M.; Kuenen, J.; Borg, R.; Zheng, H.; Schoenfeld, D.; Heine, R.J. Translating the A1C assay into estimated average glucose values. Diabetes Care 2008, 31, 1473–1478. [Google Scholar] [CrossRef] [Green Version]
- Suh, S.W.; Shin, B.S.; Ma, H.; Van Hoecke, M.; Brennan, A.M.; Yenari, M.A.; Swanson, R.A. Glucose and NADPH oxidase drive neuronal superoxide formation in stroke. Ann. Neurol. 2008, 64, 654–663. [Google Scholar] [CrossRef] [PubMed]
- Kamada, H.; Yu, F.; Nito, C.; Chan, P.H. Influence of hyperglycemia on oxidative stress and matrix metalloproteinase-9 activation after focal cerebral ischemia/reperfusion in rats: Relation to blood-brain barrier dysfunction. Stroke 2007, 38, 1044–1049. [Google Scholar] [CrossRef]
- Ennis, S.R.; Keep, R.F. Effect of sustained-mild and transient-severe hyperglycemia on ischemia-induced blood-brain barrier opening. J. Cereb. Blood Flow Metab. Off. J. Int. Soc. Cereb. Blood Flow Metab. 2007, 27, 1573–1582. [Google Scholar] [CrossRef] [Green Version]
- Ergul, A.; Li, W.; Elgebaly, M.M.; Bruno, A.; Fagan, S.C. Hyperglycemia, diabetes and stroke: Focus on the cerebrovasculature. Vasc. Pharmacol. 2009, 51, 44–49. [Google Scholar] [CrossRef] [PubMed] [Green Version]
- Zoungas, S.; Chalmers, J.; Ninomiya, T.; Li, Q.; Cooper, M.E.; Colagiuri, S.; Fulcher, G.; de Galan, B.E.; Harrap, S.; Hamet, P.; et al. Association of HbA1c levels with vascular complications and death in patients with type 2 diabetes: Evidence of glycaemic thresholds. Diabetologia 2012, 55, 636–643. [Google Scholar] [CrossRef] [PubMed]
- Chan, C.Y.; Li, R.; Chan, J.Y.; Zhang, Q.; Chan, C.P.; Dong, M.; Yan, B.P.; Lam, Y.Y.; Yu, C.M. The value of admission HbA(1c) level in diabetic patients with acute coronary syndrome. Clin. Cardiol. 2011, 34, 507–512. [Google Scholar] [CrossRef]
- Parsons, M.W.; Barber, P.A.; Desmond, P.M.; Baird, T.A.; Darby, D.G.; Byrnes, G.; Tress, B.M.; Davis, S.M. Acute hyperglycemia adversely affects stroke outcome: A magnetic resonance imaging and spectroscopy study. Ann. Neurol. 2002, 52, 20–28. [Google Scholar] [CrossRef] [PubMed]
- Ribo, M.; Molina, C.; Montaner, J.; Rubiera, M.; Delgado-Mederos, R.; Arenillas, J.F.; Quintana, M.; Alvarez-Sabín, J. Acute hyperglycemia state is associated with lower tPA-induced recanalization rates in stroke patients. Stroke 2005, 36, 1705–1709. [Google Scholar] [CrossRef] [PubMed] [Green Version]
- Zhong, C.; Yang, J.; Xu, T.; Xu, T.; Peng, Y.; Wang, A.; Wang, J.; Peng, H.; Li, Q.; Ju, Z.; et al. Serum matrix metalloproteinase-9 levels and prognosis of acute ischemic stroke. Neurology 2017, 89, 805–812. [Google Scholar] [CrossRef]
- Yang, J.L.; Mukda, S.; Chen, S.D. Diverse roles of mitochondria in ischemic stroke. Redox Biol. 2018, 16, 263–275. [Google Scholar] [CrossRef] [PubMed]


| Good Outcome (3 Month mRS 0–1) | Poor Outcome (3 Month mRS 2–6) | p Value | |
|---|---|---|---|
| No. (%) | 784 (58.9) | 548 (41.1) | |
| Age, years | 66 ± 13 | 71 ± 12 | <0.001 |
| Male sex, % | 518 (66.1) | 314 (57.3) | 0.001 |
| Body-mass index, kg/m2 | 24.2 ± 3.3 | 23.8 ± 3.6 | 0.038 |
| Cardiovascular risk factor | |||
| Prior ischemic stroke | 131 (16.7) | 121 (22.1) | 0.014 |
| Hypertension | 459 (58.5) | 352 (64.2) | 0.036 |
| Diabetes | 245 (31.3) | 210 (38.3) | 0.007 |
| Dyslipidemia | 155 (19.8) | 100 (18.2) | 0.487 |
| Smoking | 228 (29.1) | 103 (18.8) | <0.001 |
| Atrial fibrillation | 96 (12.2) | 124 (22.6) | <0.001 |
| Laboratory | |||
| White-blood-cell count | 7778 ± 3482 | 7900 ± 2979 | 0.507 |
| Hematocrit, g/dL | 41.1 ± 5.5 | 40.0 ± 6.4 | 0.001 |
| Fasting blood sugar, mg/dL | 128.5 ± 61.8 | 144.1 ± 88.2 | <0.001 |
| HbA1c, % | 6.19 ± 1.23 | 6.36 ± 1.48 | 0.027 |
| Estimated average glucose (eAG), mg/dL | 130.8 ± 35.2 | 135.7 ± 42.4 | 0.027 |
| eAG–initial glucose, mg/dL | −10.26 ± 43.40 | −14.11 ± 48.89 | 0.139 |
| eAG–initial glucose–four groups | 0.044 * | ||
| eAG–initial glucose ≤ −50, mg/dL | 99 (12.6) | 98 (17.9) | |
| −50 < eAG–initial glucose < 0, mg/dL | 340 (43.4) | 228 (41.6) | |
| 0 ≤ eAG–initial glucose < 50, mg/dL | 319 (40.7) | 201 (36.7) | |
| eAG–initial glucose ≥ 50, mg/dL | 26 (3.3) | 21 (3.8) | |
| Initial glucose, mg/dL | 141.1 ± 58.5 | 149.8 ± 65.7 | 0.013 |
| Glycated albumin, % | 16.0 ± 4.4 | 17.2 ± 4.8 | <0.001 |
| High-sensitivity C-reactive protein, mg/L | 6.49 ± 23.03 | 10.33 ± 26.60 | 0.008 |
| Total cholesterol, mg/dL | 171.1 ± 43.3 | 166.8 ± 42.7 | 0.026 |
| Triglyceride, mg/dL | 144.2 ± 106.2 | 127.0 ± 97.1 | 0.002 |
| Low-density lipoprotein, mg/dL | 104.4 ± 35.4 | 102.3 ± 51.6 | 0.395 |
| Blood urea nitrogen, mg/dL | 16.8 ± 8.2 | 18.6 ± 11.2 | 0.001 |
| Creatinine, mg/dL | 0.99 ± 0.80 | 1.04 ± 0.84 | 0.298 |
| Systolic blood pressure, mmHg | 152 ± 29 | 152 ± 29 | 0.597 |
| Diastolic blood pressure, mmHg | 86 ± 15 | 85 ± 16 | 0.91 |
| Mechanism | <0.001 * | ||
| Large artery atherosclerosis | 266 (34.5) | 195 (35.9) | |
| Small vessel occlusion | 240 (31.0) | 109 (20.1) | |
| Cardioembolic | 114 (14.8) | 115 (21.2) | |
| Other determined | 33 (4.3) | 22 (4.1) | |
| Undetermined | 119 (15.4) | 102 (18.8) | |
| Previous antiplatelet user, n (%) | 208 (26.5) | 158 (28.8) | 0.312 |
| Previous anticoagulant user, n (%) | 25 (3.2) | 33 (6.0) | 0.043 |
| Initial stroke severity, median (IQR) | 2 (1,5) | 4 (2,7) | <0.001 |
| eAG–Initial Glucose ≤ −50, mg/dL | −50 < eAG–Initial Glucose < 0, mg/dL | 0 ≤ eAG–Initial Glucose < 50, mg/dL | eAG–Initial Glucose ≥ 50, mg/dL | p Value | |
|---|---|---|---|---|---|
| No. (%) | 197 (14.8) | 568 (42.6) | 520 (39.0) | 47 (3.5) | |
| Age, years | 69.5 ± 11.6 | 68.1 ± 13.7 | 68.0 ± 12.5 | 68.7 ± 12.8 | 0.712 |
| Male sex, % | 122 (61.9) | 364 (64.1) | 318 (61.2) | 28 (59.6) | 0.751 |
| Body mass index, kg/m2 | 24.40 ± 3.60 | 23.83±3.43 | 23.96 ± 3.37 | 24.62 ± 3.88 | 0.248 |
| Cardiovascular risk factor | |||||
| Prior ischemic stroke | 37 (18.8) | 99 (17.4) | 106 (20.4) | 10 (21.3) | 0.632 |
| Hypertension | 121 (61.4) | 346 (60.9) | 308 (59.2) | 36 (76.6) | 0.139 |
| Diabetes | 116 (58.9) | 146 (25.7) | 159 (30.6) | 34 (72.3) | <0.001 |
| Dyslipidemia | 39 (19.8) | 95 (16.7) | 109 (21.0) | 12 (25.5) | 0.208 |
| Smoking | 47 (23.9) | 140 (24.6) | 132 (25.4) | 12 (25.5) | 0.976 |
| Atrial fibrillation | 36 (18.3) | 81 (14.3) | 93 (17.9) | 10 (21.3) | 0.260 |
| Laboratory | |||||
| White blood cell count | 8052 ± 2981 | 7812 ± 2554 | 7736 ± 4008 | 8099 ± 3484 | 0.258 |
| Hematocrit, g/dL | 39.8 ± 6.1 | 40.8 ± 5.9 | 40.7 ± 5.1 | 42.1 ± 10.3 | 0.321 |
| Fasting blood sugar, mg/dL | 193.1 ± 108.6 | 129.9 ± 56.6 | 119.2 ± 66.7 | 129.6 ± 49.0 | <0.001 |
| HbA1c, % | 7.02 ± 1.78 | 5.89 ± 1.04 | 6.17 ± 1.08 | 8.49 ± 1.58 | <0.001 |
| HbA1c ≥ 6.5% | 101 (51.3) | 109 (19.2) | 130 (25.0) | 43 (91.5) | <0.001 |
| Initial glucose, mg/dL | 246.3 ± 80.2 | 140.4 ± 34.4 | 113.4 ± 30.4 | 115.8 ± 36.0 | <0.001 |
| Glycated albumin, % | 19.3 ± 6.1 | 15.6 ± 3.6 | 15.9 ± 3.8 | 22.6 ± 6.8 | <0.001 |
| Glycated albumin > 15.5% | 114 (65.9) | 201 (39.7) | 189 (43.9) | 36 (85.7) | <0.001 |
| High-sensitivity C-reactive protein, mg/L | 11.69 ± 33.57 | 8.52 ± 26.83 | 6.21 ± 17.36 | 8.67 ± 22.49 | 0.105 |
| Total cholesterol, mg/dL | 168.8 ± 44.3 | 171.9 ± 44.3 | 166.3 ± 41.3 | 161.3 ± 41.8 | 0.153 |
| Triglyceride, mg/dL | 155.7 ± 111.6 | 137.5 ± 106.1 | 129.2 ± 96.1 | 141.8 ± 86.2 | 0.010 |
| Low-density lipoprotein, mg/dL | 100.7 ± 34.7 | 105.2 ± 35.5 | 103.0 ± 52.2 | 101.7 ± 39.2 | 0.357 |
| Blood urea nitrate, mg/dL | 19.2 ± 11.1 | 17.2±9.2 | 17.0 ± 8.7 | 21.3 ± 14.4 | 0.006 |
| Creatinine, mg/dL | 1.07 ± 0.87 | 0.99 ± 0.82 | 0.99 ± 0.71 | 1.28 ± 1.45 | 0.100 |
| Systolic blood pressure, mmHg | 151 ± 31 | 152 ± 30 | 152 ± 26 | 146 ± 29 | 0.230 |
| Diastolic blood pressure, mmHg | 83 ± 15 | 86 ± 16 | 86 ± 14 | 80 ± 15 | 0.006 |
| Mechanism | 0.635 * | ||||
| Large artery atherosclerosis | 71 (36.0) | 211 (37.5) | 159 (31.2) | 20 (42.6) | |
| Small vessel occlusion | 42 (21.3) | 149 (26.5) | 149 (29.2) | 9 (19.1) | |
| Cardioembolic | 34 (17.3) | 87 (15.5) | 98 (19.3) | 10 (21.3) | |
| Other determined | 11 (5.6) | 25 (4.4) | 18 (3.5) | 1 (2.1) | |
| Undetermined | 39 (19.8) | 90 (16.0) | 85 (16.7) | 7 (14.9) | |
| Previous antiplatelet user, n (%) | 53 (26.9) | 133 (23.4) | 165 (31.7) | 15 (31.9) | 0.071 |
| Previous anticoagulant user, n (%) | 11 (5.6) | 20 (3.5) | 25 (4.8) | 2 (4.3) | 0.355 |
| Initial stroke severity, median (IQR) | 3 (1,6) | 3 (1,6) | 3 (1,6) | 3 (2,5) | 0.883 |
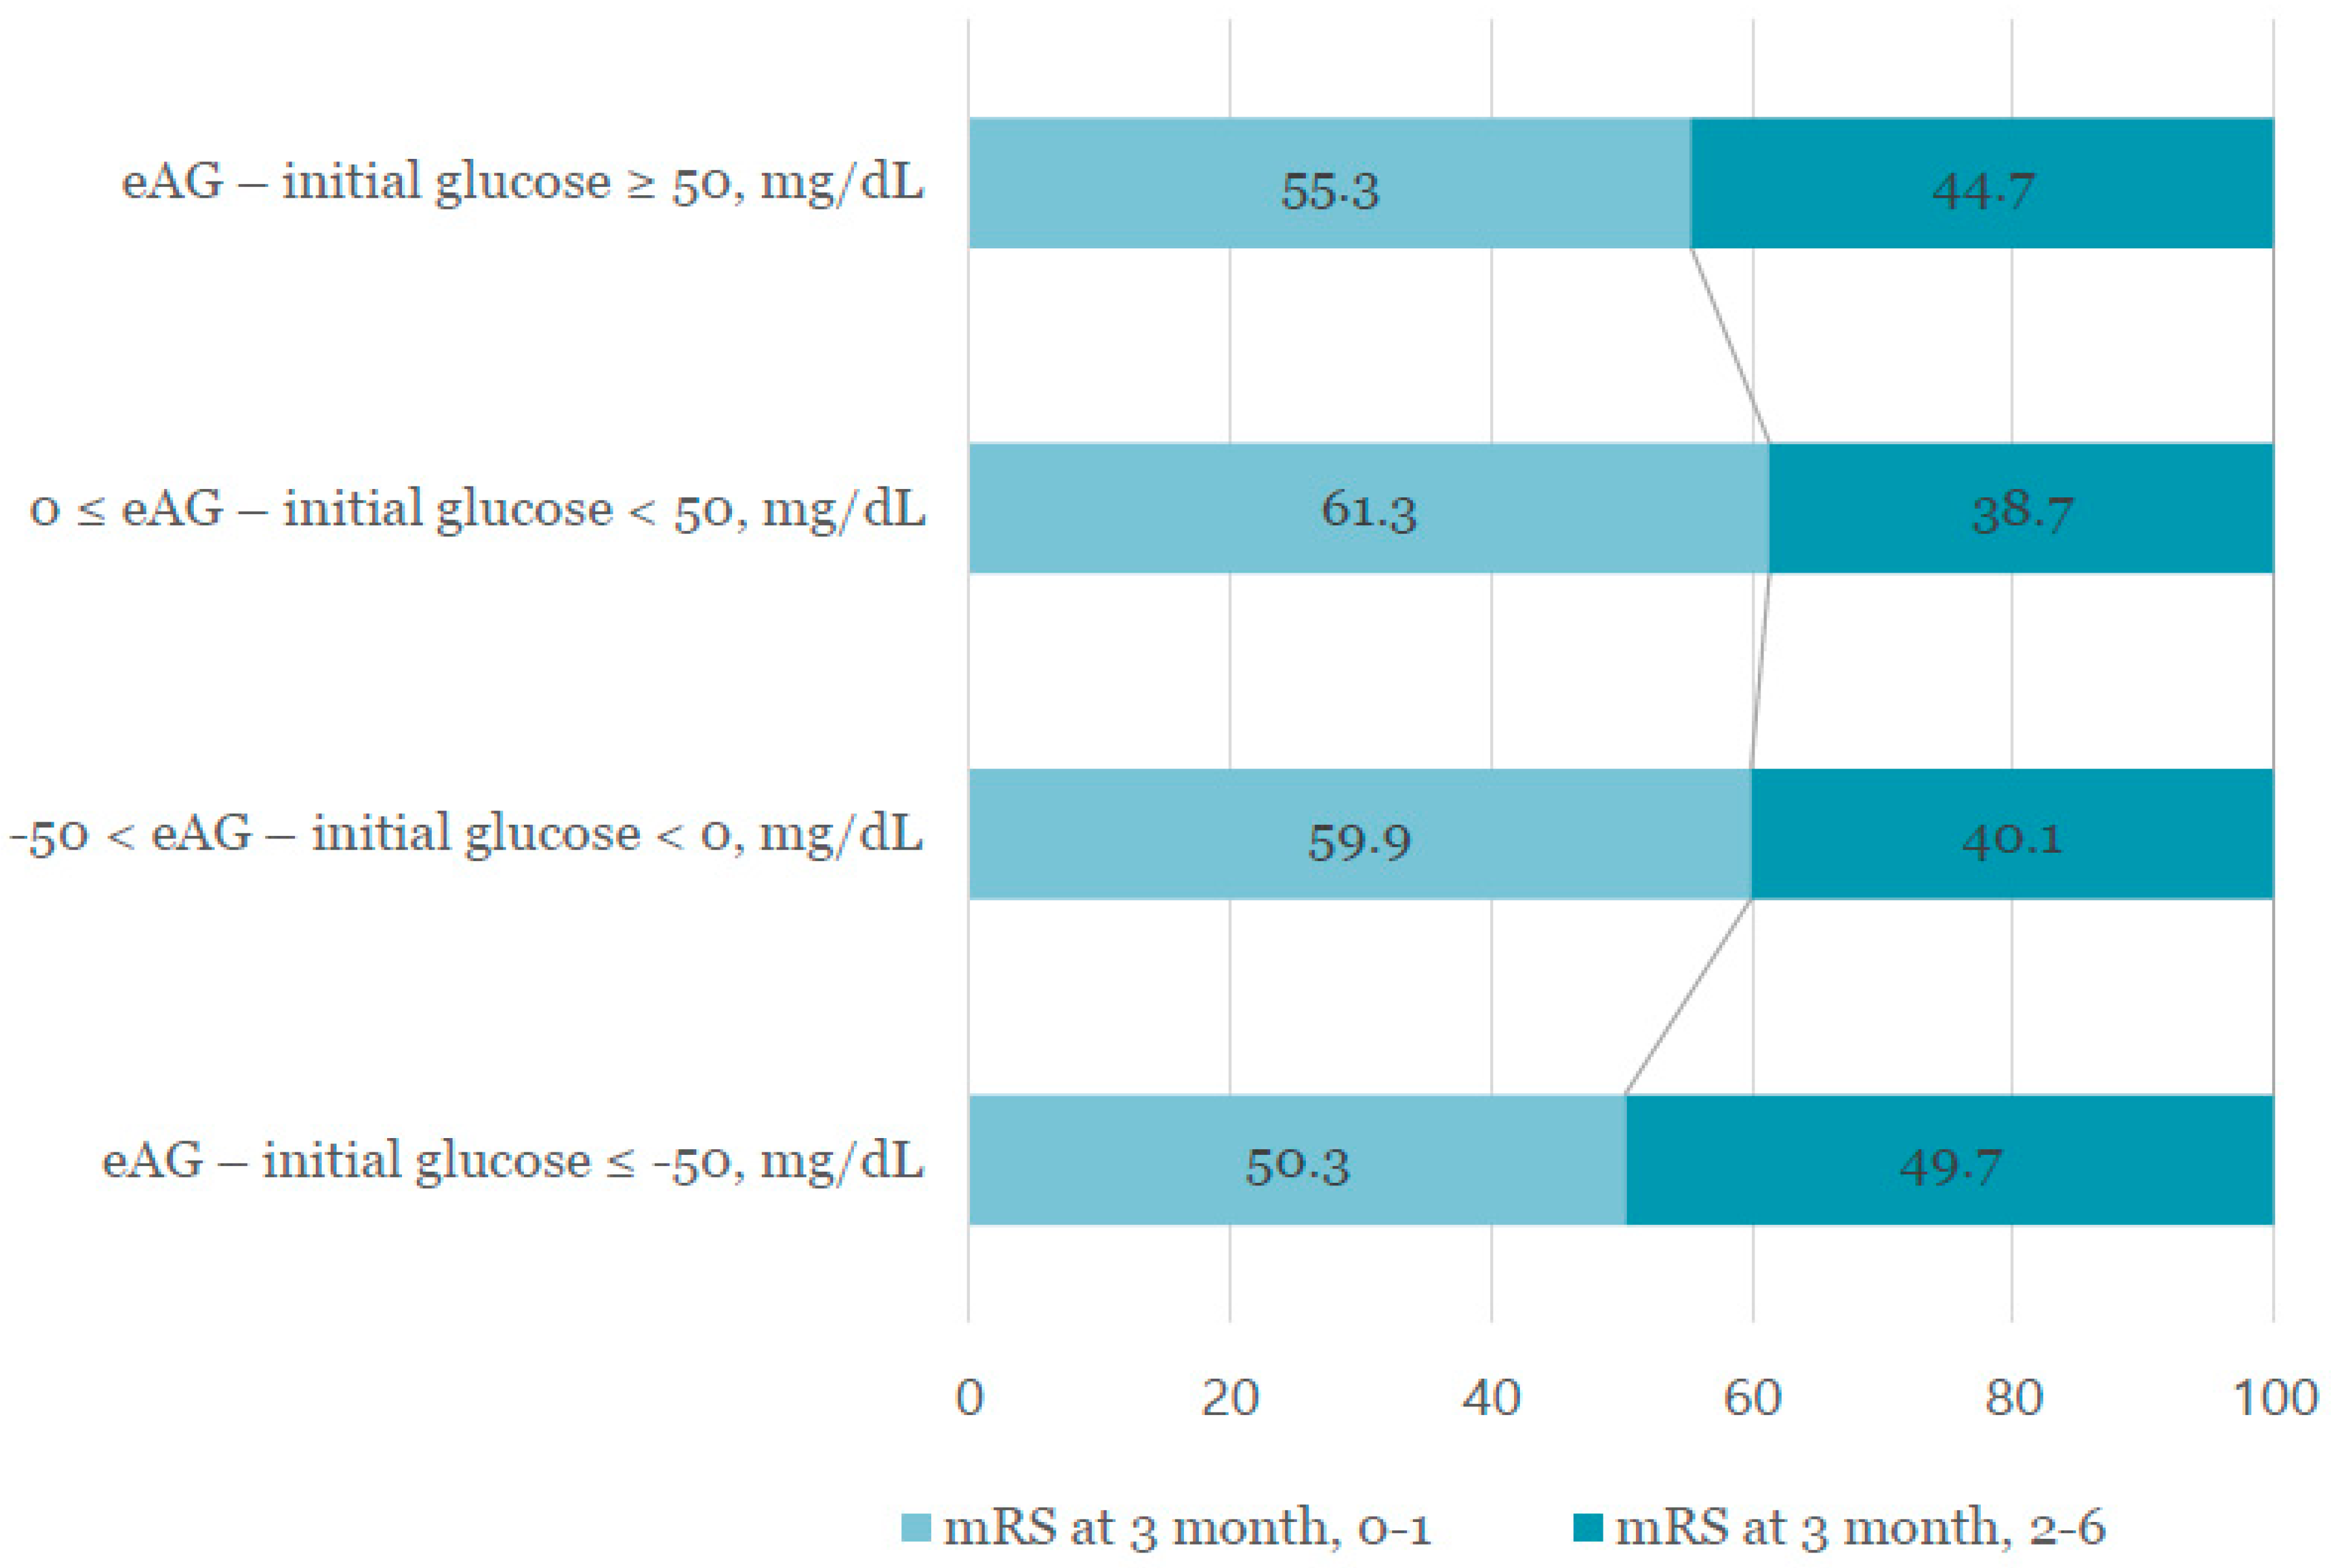
| 3 month mRS 2–6 | 98 (49.7) | 228 (40.1) | 201 (38.7) | 21 (44.7) | 0.050 |
| Odds Ratio (95% Cl) | p Value | |
|---|---|---|
| Male sex | 0.854 (0.653–1.117) | 0.248 |
| Age, years | 1.023 (1.012–1.034) | <0.001 |
| Body mass index, kg/m2 | 0.985 (0.951–1.020) | 0.392 |
| Conventional risk factors | ||
| Prior ischemic stroke | 1.384 (1.030–1.859) | 0.031 |
| Hypertension | 0.974 (0.753–1.259) | 0.840 |
| Dyslipidemia | 0.910 (0.672–1.231) | 0.541 |
| Smoking | 0.846 (0.621–1.153) | 0.289 |
| Atrial fibrillation | 1.534 (1.120–2.101) | 0.008 |
| Hematocrit, g/dL | 1.003 (0.981–1.026) | 0.794 |
| Blood urea nitrogen, mg/dL | 1.010 (0.997–1.023) | 0.116 |
| High-sensitivity C-reactive protein, mg/L | 1.004 (0.999–1.009) | 0.136 |
| eAG–initial glucose, four groups | ||
| eAG–initial glucose ≤ −50 mg/dL | 1.573 (1.101–2.248) | 0.013 |
| −50 < eAG–initial glucose < 0 mg/dL | 1.082 (0.836–1.400) | 0.551 |
| 0 ≤ eAG–initial glucose < 50 mg/dL | reference | |
| eAG–initial glucose ≥ 50 mg/dL | 1.344 (0.711–2.540) | 0.363 |
| Initial stroke severity | 1.039 (1.016–1.062) | 0.001 |
| Odds Ratio (95% Cl) | p Value | |
|---|---|---|
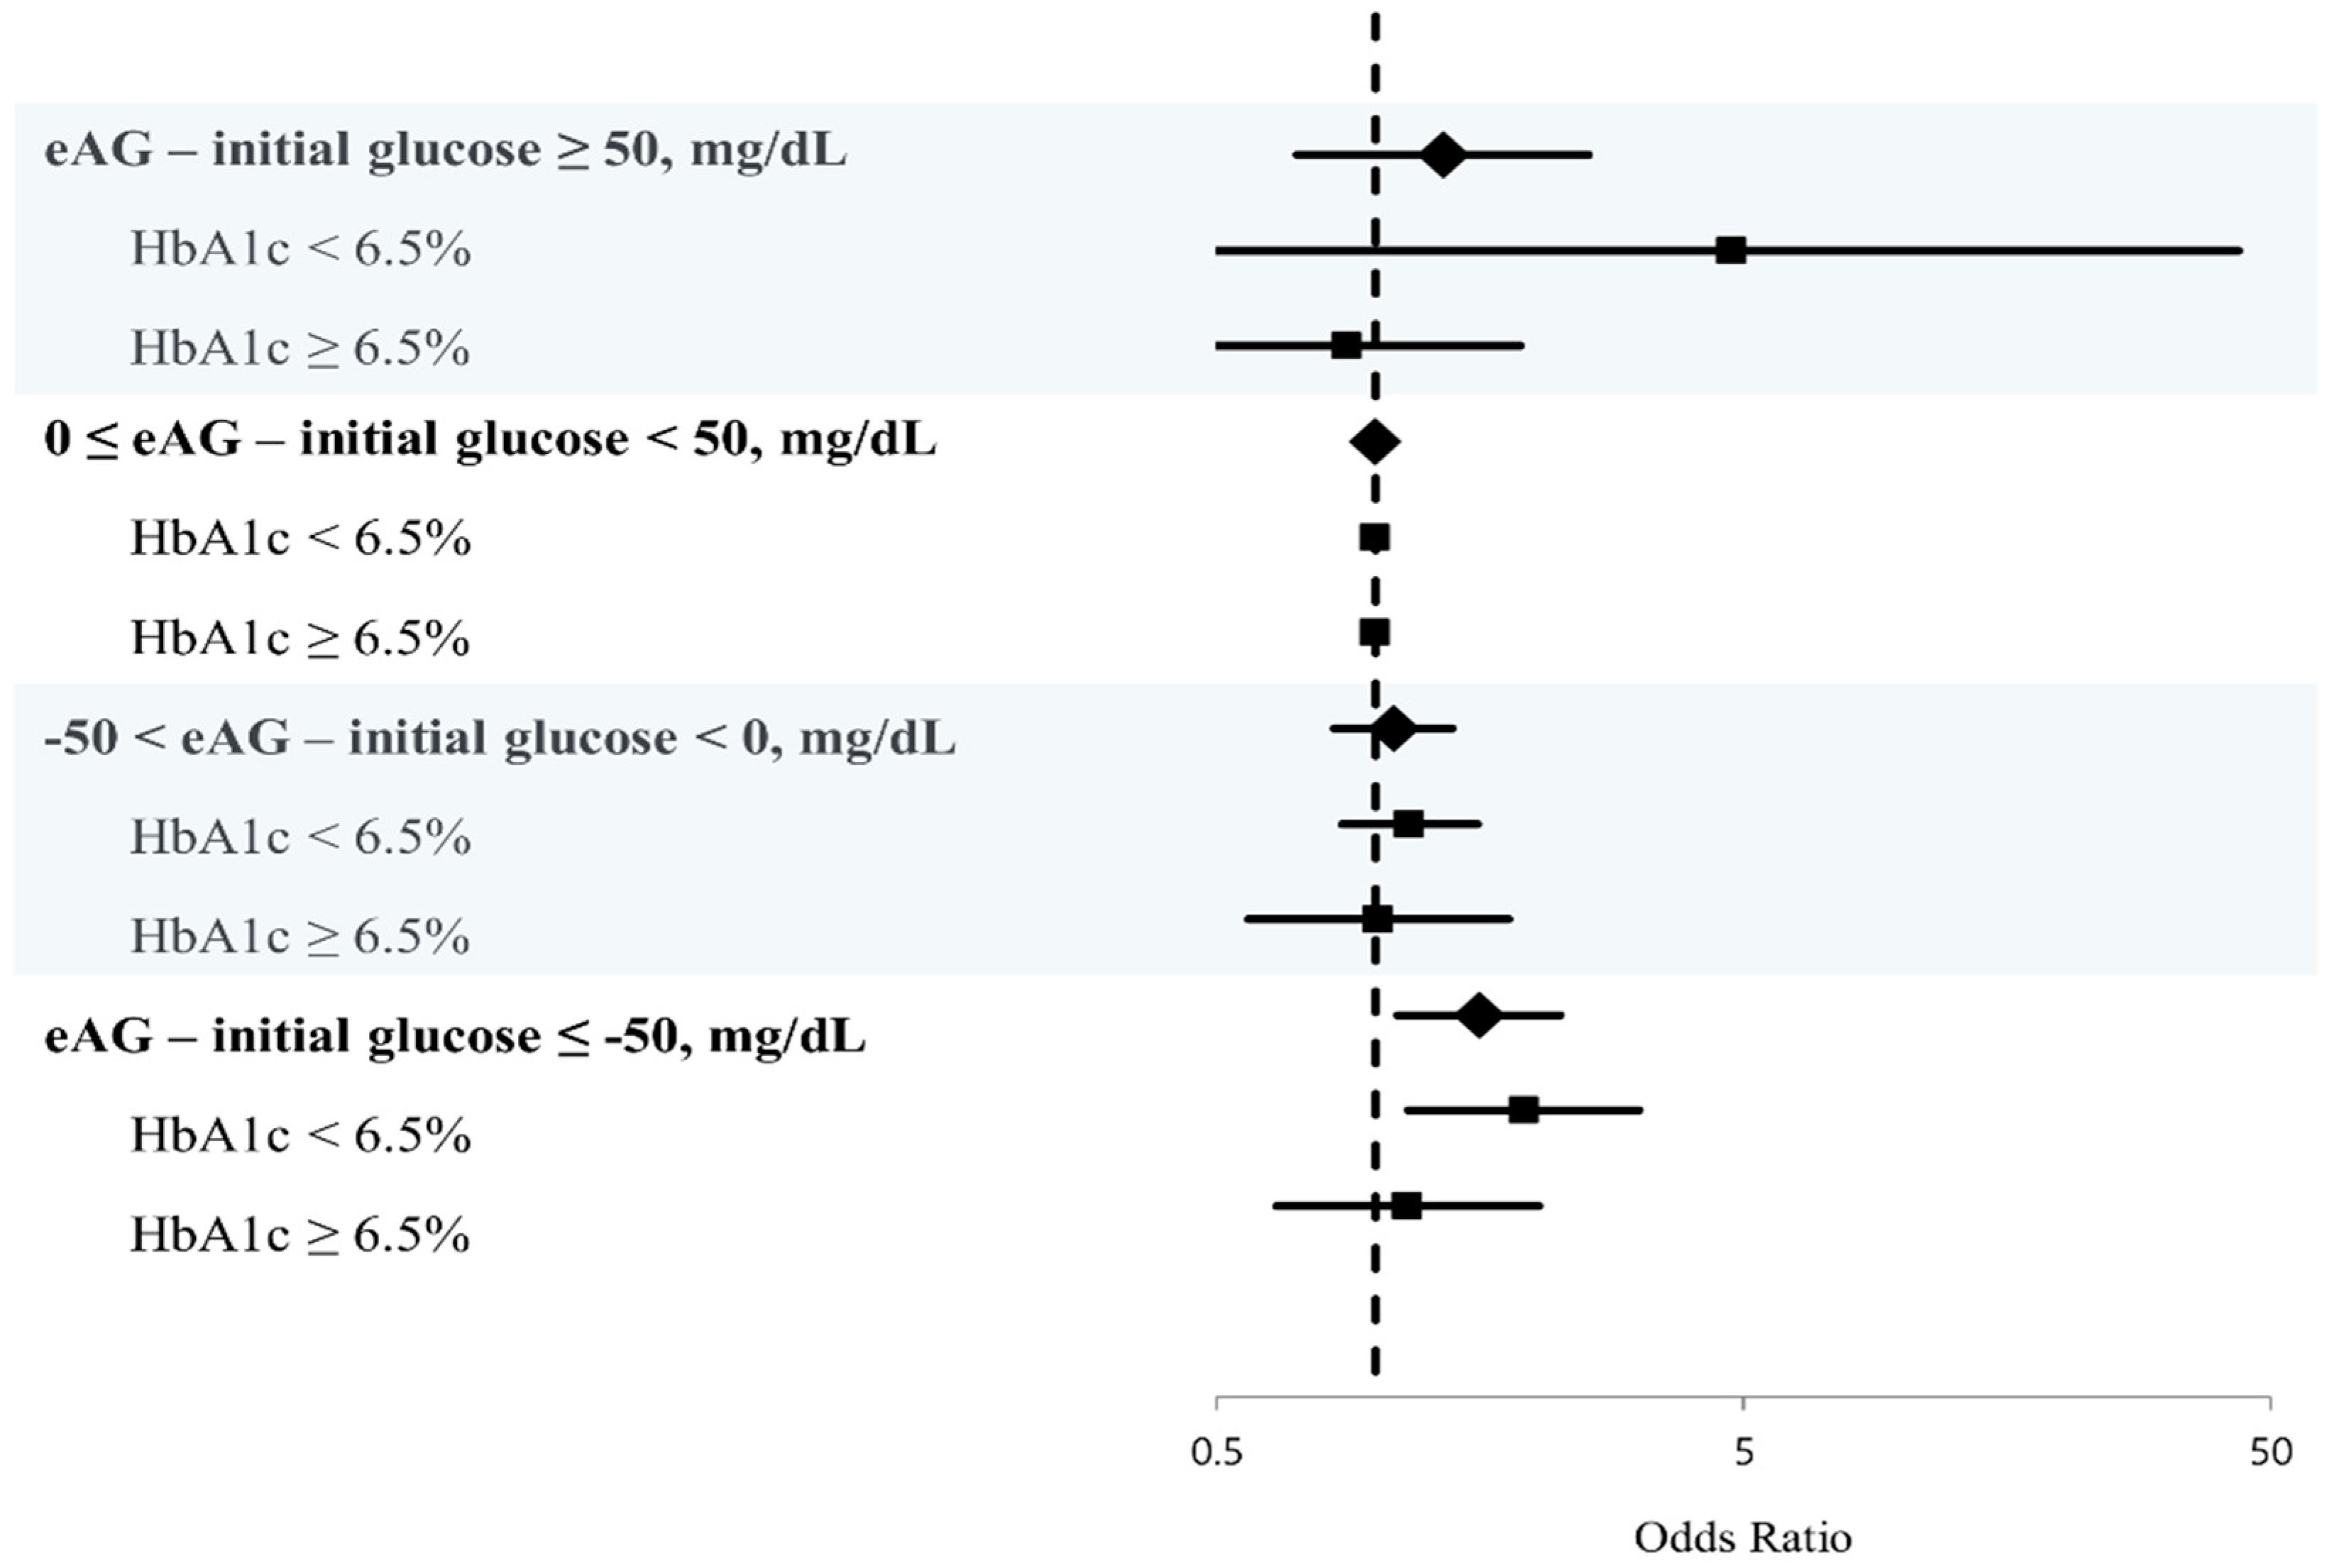
| HbA1c < 6.5% | ||
| eAG–initial glucose, four groups | ||
| eAG–initial glucose ≤ −50, mg/dL | 1.914 (1.155–3.169) | 0.012 |
| −50 < eAG–initial glucose < 0, mg/dL | 1.161 (0.864–1.562) | 0.322 |
| 0 ≤ eAG–initial glucose < 50, mg/dL | Reference | |
| eAG–initial glucose ≥ 50, mg/dL | 4.738 (0.464–43.384) | 0.189 |
| HbA1c ≥ 6.5% | ||
| eAG–initial glucose, four groups | ||
| eAG–initial glucose ≤ −50, mg/dL | 1.152 (0.650–2.042) | 0.628 |
| −50 < eAG–initial glucose < 0, mg/dL | 1.013 (0.574–1.788) | 0.965 |
| 0 ≤ eAG–initial glucose < 50, mg/dL | Reference | |
| eAG–initial glucose ≥ 50, mg/dL | 0.883 (0.415–1.881) | 0.747 |
Publisher’s Note: MDPI stays neutral with regard to jurisdictional claims in published maps and institutional affiliations. |
© 2021 by the authors. Licensee MDPI, Basel, Switzerland. This article is an open access article distributed under the terms and conditions of the Creative Commons Attribution (CC BY) license (http://creativecommons.org/licenses/by/4.0/).
Share and Cite
Kim, Y.; Lee, S.-H.; Kim, C.; Kang, M.K.; Yoon, B.-W.; Kim, T.J.; Bae, J.S.; Lee, J.-H. Personalized Consideration of Admission-Glucose Gap between Estimated Average and Initial Glucose Levels on Short-Term Stroke Outcome. J. Pers. Med. 2021, 11, 139. https://doi.org/10.3390/jpm11020139
Kim Y, Lee S-H, Kim C, Kang MK, Yoon B-W, Kim TJ, Bae JS, Lee J-H. Personalized Consideration of Admission-Glucose Gap between Estimated Average and Initial Glucose Levels on Short-Term Stroke Outcome. Journal of Personalized Medicine. 2021; 11(2):139. https://doi.org/10.3390/jpm11020139
Chicago/Turabian StyleKim, Yerim, Sang-Hwa Lee, Chulho Kim, Min Kyoung Kang, Byung-Woo Yoon, Tae Jung Kim, Jong Seok Bae, and Ju-Hun Lee. 2021. "Personalized Consideration of Admission-Glucose Gap between Estimated Average and Initial Glucose Levels on Short-Term Stroke Outcome" Journal of Personalized Medicine 11, no. 2: 139. https://doi.org/10.3390/jpm11020139
APA StyleKim, Y., Lee, S.-H., Kim, C., Kang, M. K., Yoon, B.-W., Kim, T. J., Bae, J. S., & Lee, J.-H. (2021). Personalized Consideration of Admission-Glucose Gap between Estimated Average and Initial Glucose Levels on Short-Term Stroke Outcome. Journal of Personalized Medicine, 11(2), 139. https://doi.org/10.3390/jpm11020139