Article

Evaluation of the Predictive Role of Blood-Based Biomarkers in the Context of Suspicious Prostate MRI in Patients Undergoing Prostate Biopsy

by
Pawel Rajwa
1,2,*,
Nicolai A. Huebner
2,3,
Dadjar I. Hostermann
2,
Nico C. Grossmann
2,4,5,
Victor M. Schuettfort
2,6,
Stephan Korn
2,
Fahad Quhal
2,7,
Frederik König
2,6,
Hadi Mostafaei
2,8,
Ekaterina Laukhtina
2,9,
Keiichiro Mori
2,10,
Reza Sari Motlagh
2,11,
Takafumi Yanagisawa
2,10,
Abdulmajeed Aydh
2,7,
Piotr Bryniarski
1,
Benjamin Pradere
2,
Andrzej Paradysz
1,
Pascal A. Baltzer
12,
Bernhard Grubmüller
2 and
Shahrokh F. Shariat
2,9,13,14,15,16,17
1
Department of Urology, Medical University of Silesia, 41-800 Zabrze, Poland
2
Department of Urology, Medical University of Vienna, 1090 Vienna, Austria
3
Working Group for Diagnostic Imaging in Urology (ABDU), Austrian Association of Urology (ÖGU), 1090 Vienna, Austria
4
Department of Urology, Luzerner Kantonsspital, 6000 Lucerne, Switzerland
5
Department of Urology, University Hospital Zurich, 8091 Zurich, Switzerland
6
Department of Urology, University Medical Center Hamburg-Eppendorf, 20251 Hamburg, Germany
7
Department of Urology, King Fahad Specialist Hospital, Dammam 32253, Saudi Arabia
8
Research Center for Evidence Based Medicine, Tabriz University of Medical Sciences, Tabriz 51666-15731, Iran
9
Institute for Urology and Reproductive Health, Sechenov University, 19435 Moscow, Russia
10
Department of Urology, The Jikei University School of Medicine, Tokyo 105-8461, Japan
11
Men’s Health and Reproductive Health Research Center, Shahid Beheshti University of Medical Sciences, Tehran 19857-17443, Iran
12
Department of Biomedical Imaging and Image-Guided Therapy, Medical University of Vienna, 1090 Vienna, Austria
13
Karl Landsteiner Institute of Urology and Andrology, 1010 Vienna, Austria
14
Department of Urology, Weill Cornell Medical College, New York, NY 10065, USA
15
Department of Urology, University of Texas Southwestern, Dallas, TX 75390, USA
16
Department of Urology, Second Faculty of Medicine, Charles University, 150 06 Prague, Czech Republic
17
Department of Special Surgery, Jordan University Hospital, The University of Jordan, Amman 11942, Jordan
*
Author to whom correspondence should be addressed.
J. Pers. Med. 2021, 11(11), 1231; https://doi.org/10.3390/jpm11111231
Submission received: 7 October 2021 / Revised: 13 November 2021 / Accepted: 16 November 2021 / Published: 19 November 2021

Abstract

:
The aim of this study was to assess the predictive value of pre-biopsy blood-based markers in patients undergoing a fusion biopsy for suspicious prostate magnetic resonance imaging (MRI). We identified 365 consecutive patients who underwent MRI-targeted and systematic prostate biopsy for an MRI scored Prostate Imaging–Reporting and Data System Version (PI-RADS) ≥ 3. We evaluated the neutrophil/lymphocyte ratio (NLR), derived neutrophil/lymphocyte ratio (dNLR), platelet/lymphocyte ratio (PLR), systemic immune inflammation index (SII), lymphocyte/monocyte ratio (LMR,) de Ritis ratio, modified Glasgow Prognostic Score (mGPS), and prognostic nutrition index (PNI). Uni- and multivariable logistic models were used to analyze the association of the biomarkers with biopsy findings. The clinical benefits of biomarkers implemented in clinical decision-making were assessed using decision curve analysis (DCA). In total, 69% and 58% of patients were diagnosed with any prostate cancer and Gleason Grade (GG) ≥ 2, respectively. On multivariable analysis, only high dNLR (odds ratio (OR) 2.61, 95% confidence interval (CI) 1.23–5.56, p = 0.02) and low PNI (OR 0.48, 95% CI 0.26–0.88, p = 0.02) remained independent predictors for GG ≥ 2. The logistic regression models with biomarkers reached AUCs of 0.824–0.849 for GG ≥ 2. The addition of dNLR and PNI did not enhance the net benefit of a standard clinical model. Finally, we created the nomogram that may help guide biopsy avoidance in patients with suspicious MRI. In patients with PI-RADS ≥ 3 lesions undergoing MRI-targeted and systematic biopsy, a high dNLR and low PNI were associated with unfavorable biopsy outcomes. Pre-biopsy blood-based biomarkers did not, however, significantly improve the discriminatory power and failed to add a clinical benefit beyond standard clinical factors.

1. Introduction

Over the last decade, magnetic resonance imaging (MRI) has become an essential tool for the diagnosis and management of prostate cancer (PCa) [1,2]. Indeed, prostate MRI allows visualization and assessment of the extent of suspicious lesions, in addition to guiding targeted biopsies [3,4,5]. This strategy has led to a higher likelihood of detecting clinically significant PCa (International Society of Urological Pathology (ISUP) Gleason Grade (GG) ≥ 2) compared to the standard systematic biopsy [1,3,4,5]. Several prostate MRI standardized reporting schemes have been developed, with Prostate Imaging–Reporting and Data System version 2 (PI-RADS v2) being the most frequently employed scheme [6]. In the clinical setting, major urological guidelines recommend performing MRI-targeted and systematic biopsy in patients with a PI-RADS ≥ 3 lesion [1,6]. Although the PI-RADS classification limits the intrareader variability and allows, with approximately 80% accuracy, to exclude clinically significant PCa, the overall predictive value remains low to moderate. A recent meta-analysis found a pooled significant PCa detection rate of 17% for PI-RADS 3, 46% for PI-RADS 4, and 75% for PI-RADS 5 [7]. These results suggest that 25–83% of males with suspicious prostate MRI undergo unnecessary biopsies and could benefit from the enhanced risk stratification to avoid an unpleasant, invasive procedure with significant associated risk.
Regarding the necessity of a biopsy, clinical data and biomarkers such as PSA and PSA density (PSAD) have been shown to help guide decision-making in patients with suspected prostate MRI [1,8,9]. Few genomic assays have shown improved detection rates; however, their use is limited owing to the high cost and limited availability [1,10,11]. Several blood-based biomarkers, which combine immune cell counts, have been proposed to have potential diagnostic, predictive, and prognostic values of different disease states [12,13]. These biomarkers represent a systemic inflammatory burden, as immune cells interplay with the cancer-related environment. For instance, neutrophils, platelets, or lymphocytes play a vital role in tumor development, progression, and dissemination [12,13,14]. Most studies analyzing the diagnostic utility of blood-based biomarkers focused on single biomarkers and were tested before the MRI era.
Our primary goal was to analyze the predictive value of multiple biomarkers, including the neutrophil/lymphocyte ratio (NLR), derived neutrophil/lymphocyte ratio (dNLR), platelet/lymphocyte ratio (PLR), systemic immune inflammation index (SII), lymphocyte/monocyte ratio (LMR,) de Ritis ratio, modified Glasgow Prognostic Score (mGPS), and prognostic nutrition index (PNI) in patients with suspicious prostate MRI lesions undergoing MRI-targeted and systematic prostate biopsy. The secondary aim was to determine if the biomarkers can help avoid biopsies in patients with suspicious MRI lesions.

2. Materials and Methods

We retrospectively reviewed our institutional MRI biopsy database and identified patients with prostate MRI PI-RADS ≥ 3 lesions who underwent targeted and systematic diagnostic biopsy between 2017 and 2019. The local institutional review board approved this study (EC no. 2209/2019). In general, patients underwent prostate MRI in the case of suspicious digital rectal examination (DRE) or PSA > 4 ng/mL. No patient underwent any type of PCa therapy, prostate surgery, or oral 5α-reductase inhibitor before the biopsy. All prostate MRIs were performed using a body coil on a 3 Tesla MRI according to the European Society of Urogenital Radiology (ESUR) PI-RADS recommendations. No endorectal coil was used. All patients underwent MRI with T2-weighted imaging (T2WI), diffusion-weighted imaging (DWI), and dynamic contrast-enhanced (DCE) sequences. Images were assessed in line with PI-RADS v2 classification by radiologists experienced in prostate MRI [6]. Patients underwent transrectal MRI-ultrasound fusion biopsy using the UroNav System (Invivo Corporation, PHILIPS©, 3545 SW47th Avenue, Gainesville, Florida 32608 USA), with targeted cores sampled from all MRI regions of interest under local anesthesia. The obtained biopsy specimens were examined centrally using the ISUP grade group (GG) classification in line with ISUP 2014 recommendations [15].

2.1. Biomarkers

Biomarkers data were retrieved from in-house pre-biopsy complete blood count. We calculated the ratios using absolute counts of cells and inflammatory indices as previously reported [12,16,17]—NLR: neutrophils/lymphocyte; dNLR: neutrophils/leukocytes—neutrophils; PLR: platelets/lymphocytes; LMR: lymphocytes/monocytes; SII: neutrophils x platelets/lymphocytes; de Ritis aspartate aminotransferase (AST)/alanine aminotransferase (ALT); mGPS as previously described in detail [18]; PNI 10× serum albumin (g/dL) + 0.005 × total lymphocyte count (per mm3). Pre-biopsy optimal cut-offs were determined by receiver operating characteristics (ROC) curve analysis using the Youden index for GG ≥2 prediction. In summary, the Youden index provides the optimal cut-off from a continuous variable by showing the score that offers the best tradeoff between sensitivity and specificity.

2.2. Statistical Analyses

Associations between biomarkers and patients’ clinicopathologic features were evaluated using the Kruskal–Wallis rank sum test for continuous variables and chi-square test of independence or Fisher’s exact test for categorical variables, as appropriate. Univariable and multivariable logistic regression analyses tested the association of biomarkers with any PCa and GG ≥ 2. We tested the models’ predictive accuracy using receiver operating characteristics (ROC) curves and calculated the derived area under the curve (AUC). The AUCs were statistically compared using DeLong’s test. Based on multivariable logistic regression models, nomograms were created to guide clinical decision-making. Decision curve analysis was used to analyze the clinical net benefit of biomarkers. Analyses were performed using R Version 4.0 (R Foundation for Statistical Computing, Vienna, Austria, 2020).

3. Results

We identified 365 patients with suspicious MRI lesions, out of whom 324 had available in-house pre-operative complete blood counts, which allowed us to calculate biomarkers’ values. The overall cohort characteristics and those stratified by PI-RADS scores and cancer status are presented in Table 1. Of all suspicious MRIs, 11% were scored as PI-RADS 3, 52% as PI-RADS 4, and 37% as PI-RADS 5. The median PSA and PSAD values, age, DRE status, and the PCa detection rate differed between these PI-RADS categories (all p < 0.01). There were no differences in terms of biomarkers levels. GG ≥ 2 disease was diagnosed in 14% of PI-RADS 3 lesions, 52% in PI-RADS 4 lesions, and 79% of PI-RADS 5 lesions; there were also significant differences for core positivity between each PI-RADS category. Moreover, patients with GG ≥ 2 were older (p < 0.001) and had higher values of PSAD (p < 0.001), NLR (p = 0.045), dNLR (p = 0.061), de Ritis ratio (p=0.045), and lower values of PNI (p = 0.002). A similar number of biopsy cores were sampled in patients with benign or GG1 and GG ≥ 2. The optimal marker cut-offs, determined by ROC curve analysis for GG ≥ 2, were: NLR ≥ 2.75, dNLR ≥ 2.06, PLR ≥ 133.5, LMR < 2.07, de Ritis ratio ≥ 1.11, SII ≥ 272.6, and PNI < 52.8 (Supplementary Table S1).
On univariable logistic regression analyses (Supplementary Table S2) along with standard clinical factors, NLR (OR 2.39, 95% CI 1.41–4.05, p = 0.001), dNLR (OR 3.67, 95% CI 1.91–7.07, p < 0.001), LMR (OR 0.35, 95% CI 0.16–0.75, p = 0.007), and PNI (OR 0.39, 95% CI 0.24–0.65, p < 0.001) were associated with GG ≥ 2 prediction.
On multivariable analyses (Table 2), adjusted for the effects of age, PSAD, DRE, and PI-RADS category, a high dNLR predicted both PCa (OR 2.63, 95% CI 1.09–6.35 p = 0.032) and GG ≥ 2 (OR 2.61, 95% CI 1.23–5.56, p = 0.017). In the same multivariable model, PNI was also an independent predictor for both PCa (OR 0.39, 95% CI 0.20–0.78, p = 0.008) and GG ≥ 2 (OR 0.48, 95% CI 0.26–0.88, p = 0.018). For NLR, the results for GG ≥ 2 prediction were close (OR for GG ≥ 2: 1.82, 95% 0.98–3.38, p = 0.057).
The logistic regression models, which comprised age, PSAD, DRE, PI-RADS categories, and dNLR or PNI achieved high accuracy for any PCa (AUCs: 0.831–0.865) and GG ≥ 2 (AUCs: 0.821–0.849). The addition of the biomarkers did not improve the clinical reference models by a statistically significant margin (p ≥ 0.05 for all). For prediction of any PCa and GG ≥ 2, the decision curve analysis showed that the clinical reference model with biomarkers offered a clinical net benefit relative to the all-patient biopsy approach at a threshold of 30–40% (Figure 1). However, the addition of dNLR and PNI did not (or only slightly) increase the net benefit relative to the reference model.
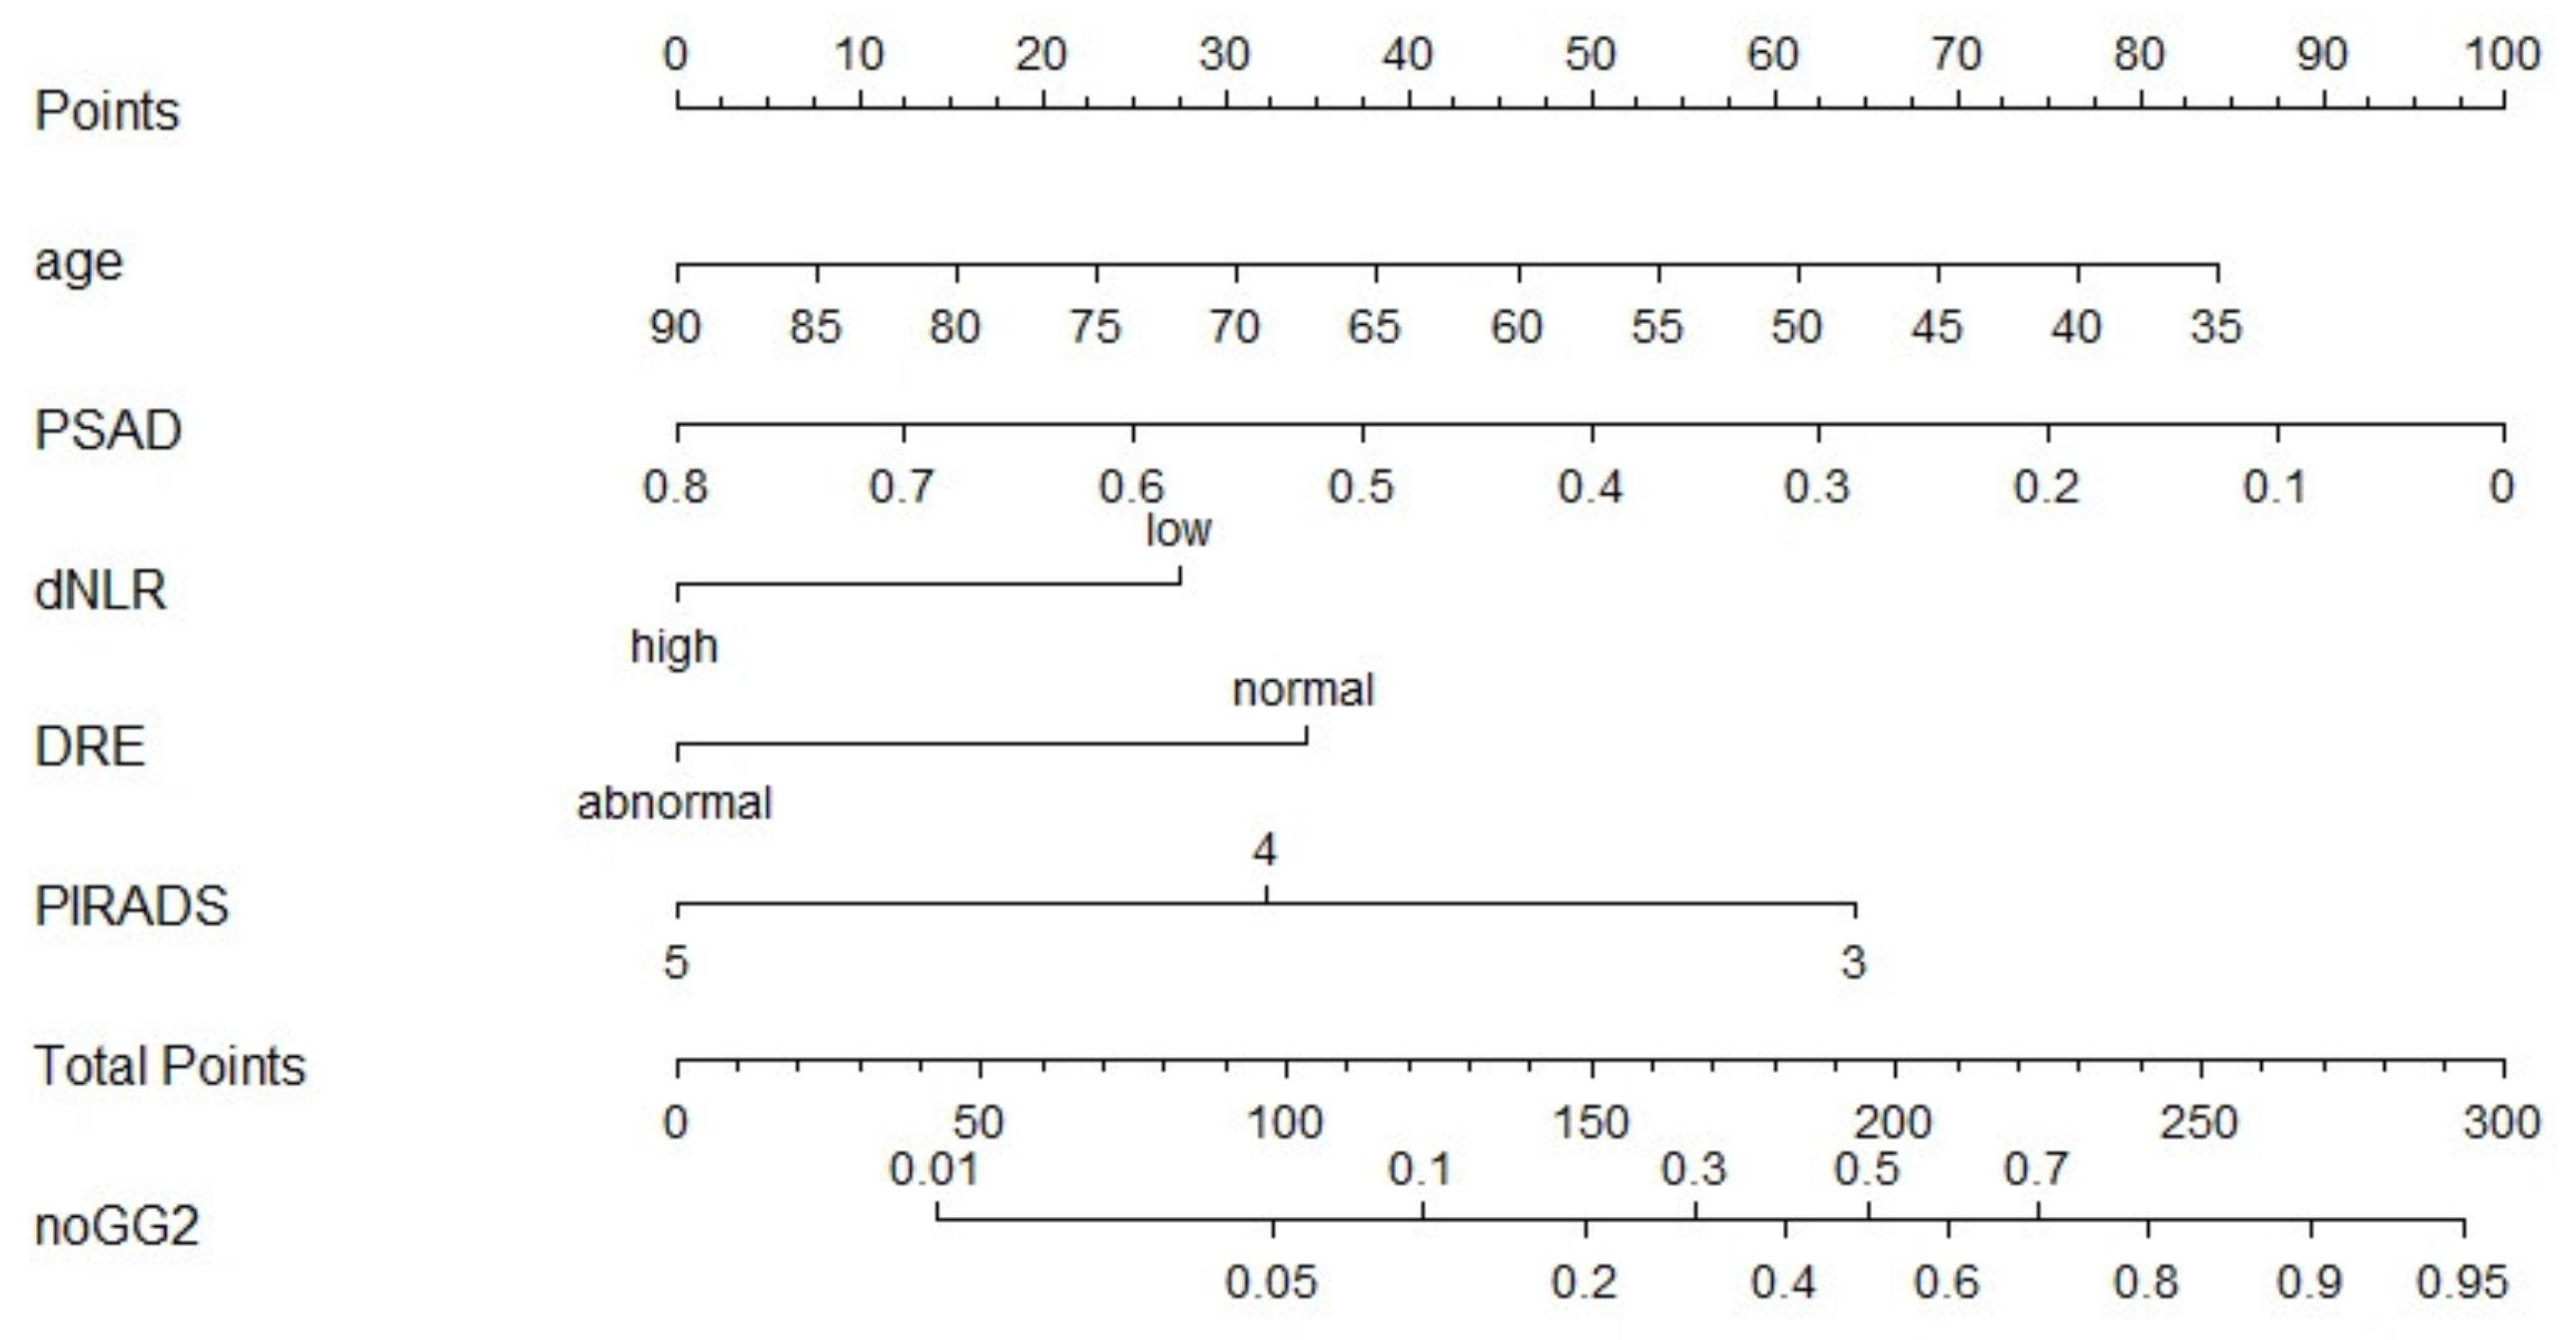
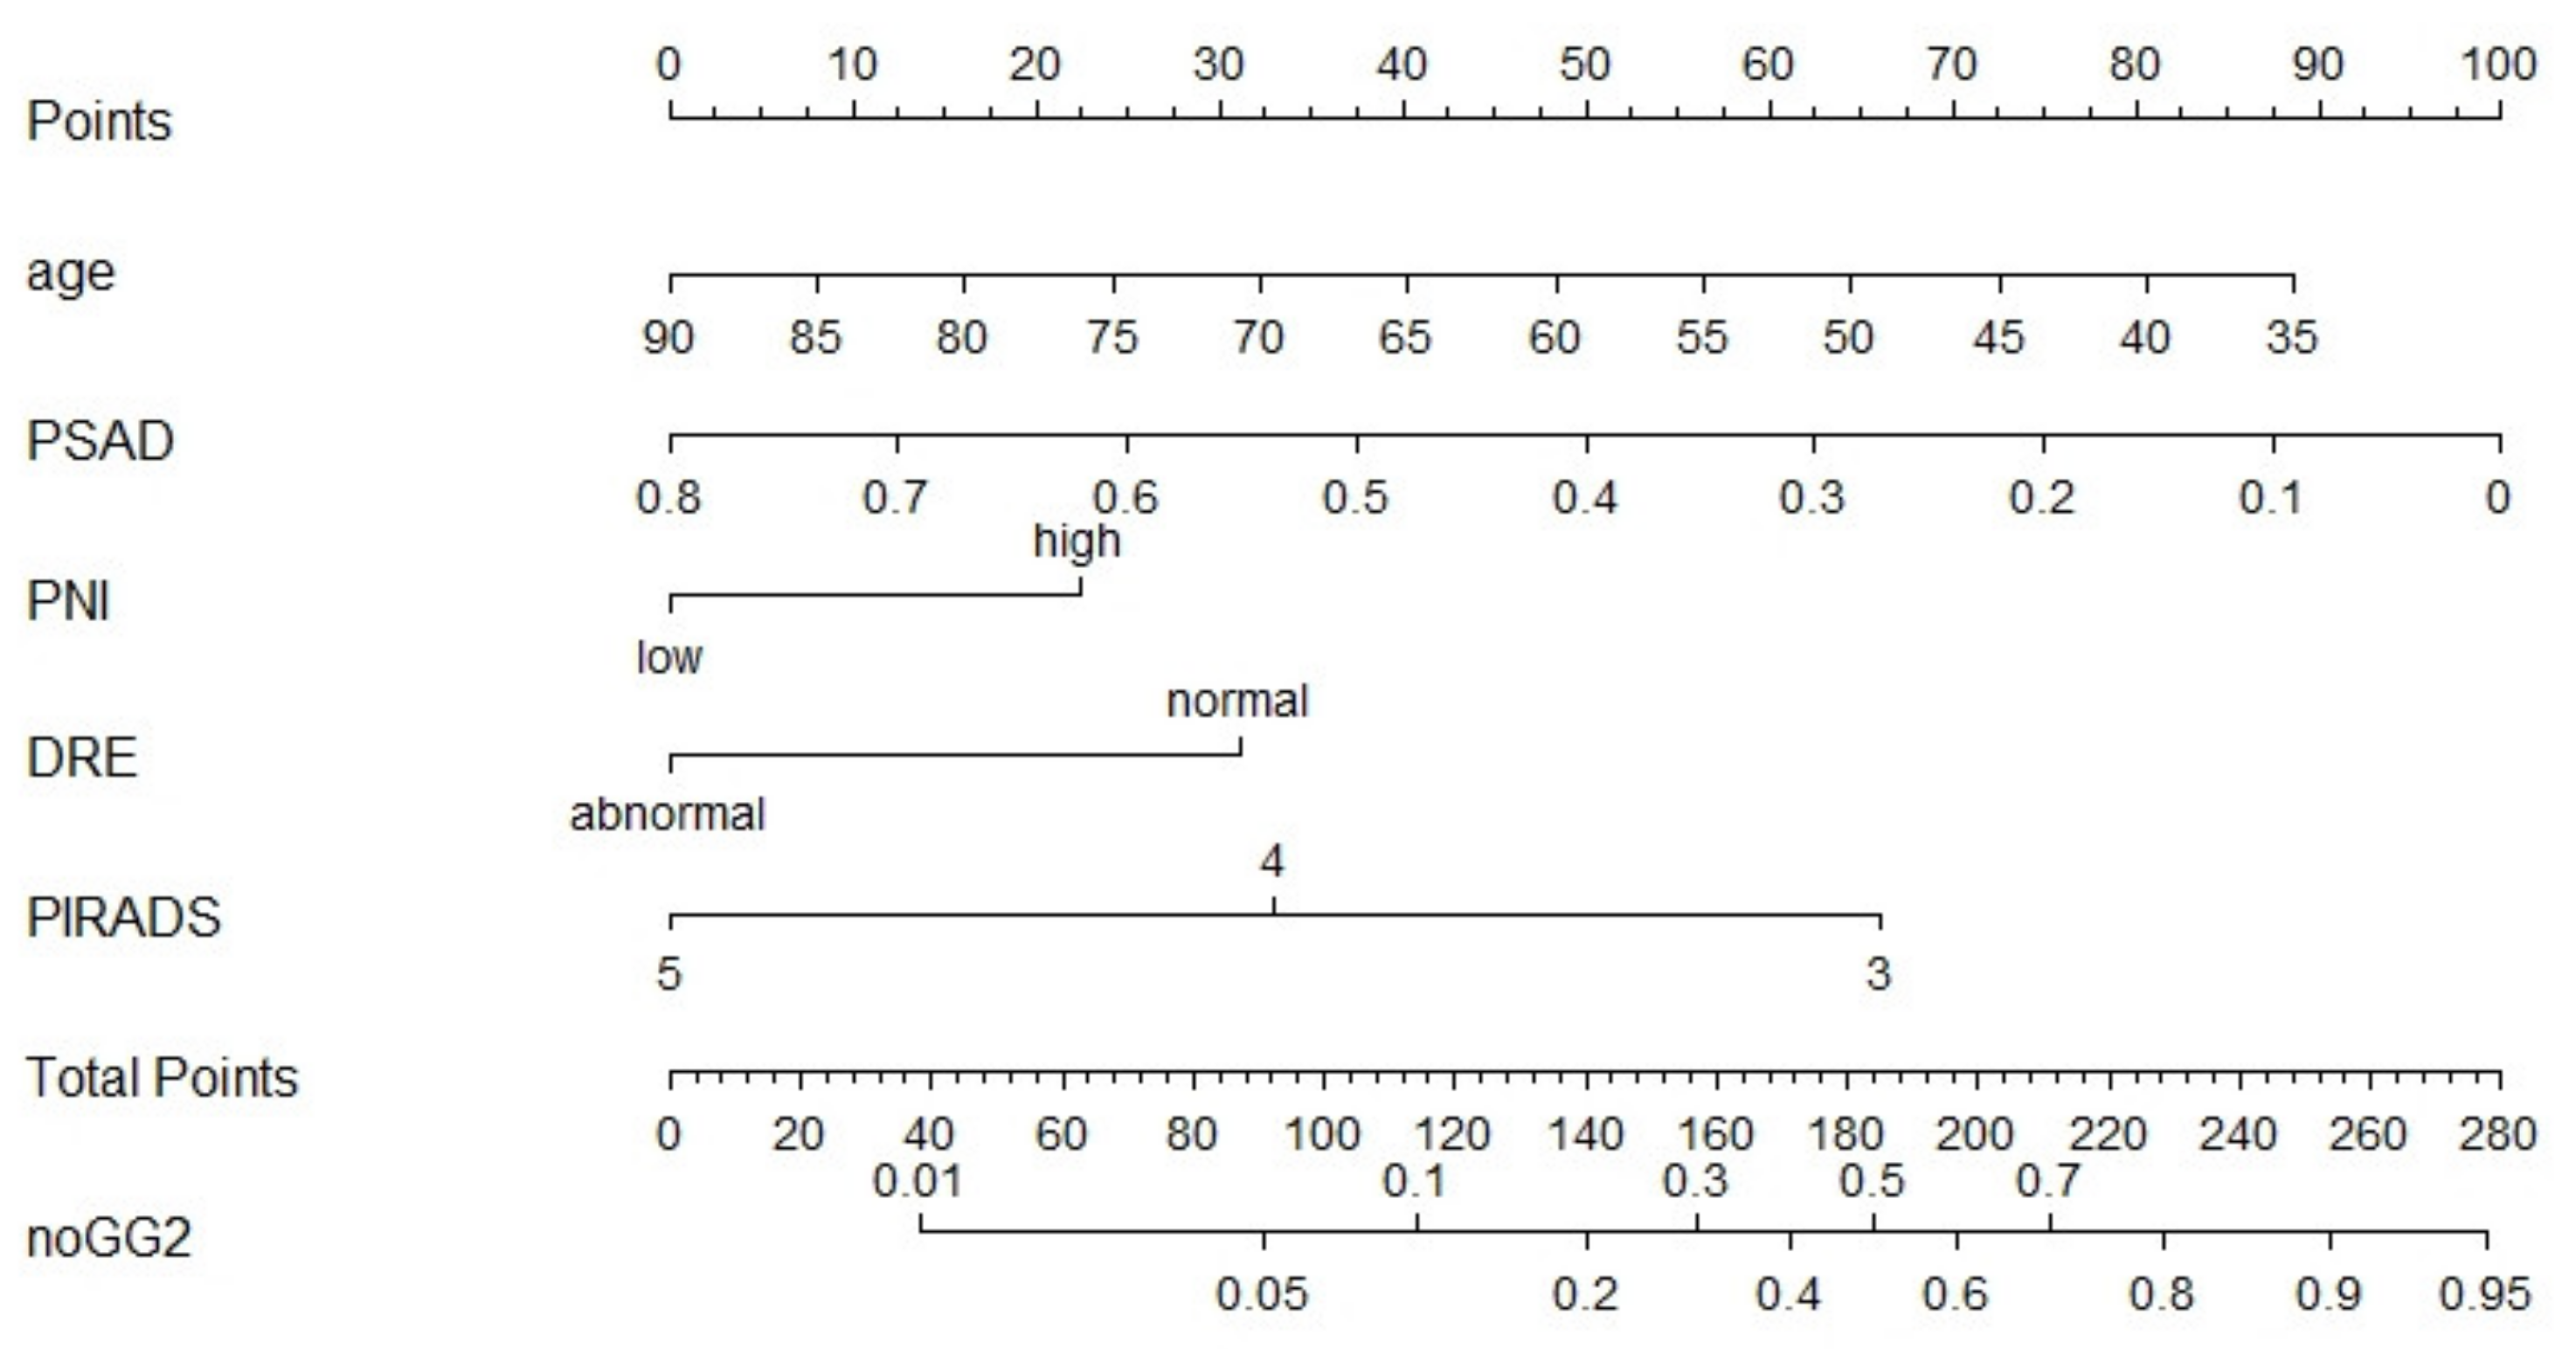
The nomograms for benign histopathology or GG = 1 prediction, which comprised variables from the multivariable logistic regression models, demonstrated a range of predicted probabilities; however, PNI and dNLR did not contribute the highest number of risk points (Figure 2 and Figure 3). In the calibration plots (Supplementary Figures S1 and S2), the models showed near-optimal agreement between the models’ prediction and actual outcome observation; the goodness-of-fit tests were not significant (nomogram with dNLR: mean absolute error = 0.02; nomogram with PNI: mean absolute error = 0.016).

4. Discussion

The fully MRI-guided PCa diagnostic pathway is hampered by the poor positive predictive value of suspicious MRI, which leads to unnecessary biopsies and, despite the strong negative predictive value, a 10–20% risk of missing significant PCa. In the clinical setting, the present tools offer suboptimal accuracy to facilitate biopsy decision-making and patients’ selection in the case of a visible MRI lesion, too. Cheap, easily obtainable, and accurate biomarkers, which reflect the tumor-related inflammatory burden, could improve the current diagnostic strategies and minimize the risk of unnecessary biopsies and avoid missing significant PCa.
In this study, we demonstrate that pre-biopsy blood biomarkers and clinical parameters can help improve patients’ selection for prostate biopsy. Our results suggest that approximately 50% of patients with suspicious MRI do not have significant cancer on biopsy; the probability was highest for patients with PI-RADS 3 lesions (84%). Therefore, even patients with PI-RADS ≥ 3 lesions should undergo pre-biopsy risk stratification as it could spare unpleasant, unnecessary biopsies. Second, we found that other clinical factors enhanced with blood biomarkers achieve over 80% accuracy for detecting significant PCa prediction. Third, we found that out of all analyzed biomarkers, dNLR and PNI were the most valuable predictors and offered unique predictive information beyond PSA and clinical factors. Fourth, we constructed a nomogram as a ready-to-use tool that could help avoid biopsies in patients with suspicious prostate MRI undergoing targeted and systematic biopsy.
In the era of precision medicine, with new imaging modalities and biomarkers, there is a persisting need to further improve pre-biopsy risk stratification. Negative and positive predictive values of MRI and single biomarkers highly depend on disease prevalence; therefore, combined strategies are needed [2,19,20]. Our model and the corresponding nomogram combining readily available biomarkers, including DRE, age, PI-RADS, and PSAD, revealed that even in patients with suspicious MRI, it is possible to include or exclude, with over 82% accuracy, the probability of significant PCa. This is particularly important as invasive biopsies are associated with pain, fever, and sepsis and may lead to hospitalization [21]. Furthermore, enhanced pre-biopsy risk stratification and MRI-guided diagnostic pathway can reduce health care costs and improve quality of life [22,23]. Recently, Deniffel et al. found that PSAD-based strategy in suspicious prostate MRI lesions (PI-RADS ≥ 3) can help reduce biopsies and outperforms MRI-based decision [24]. The analyzed and recalibrated models, which are well established, achieved AUCs of 0.79–0.84, which is comparable to ours [24]. However, in contrast to our cohort, their study included more patients with equivocal (PI-RADS 3) MRI lesions; PSA (median 7.8–7.9 ng/mL), age (median 65–67 years), and other clinical variables were similar to those of our cohort [24]. In the future, new tools such as artificial intelligence with radiomics may limit the MRI inter-reader variability and further enhance risk stratification in patients with suspicious MRI [19,20,25,26,27].
To our knowledge, we have presented the first study that specifically analyzed a panel of systemic inflammatory response biomarkers in PI-RADS ≥ 3 patients who underwent MRI-targeted and systematic biopsies. We found that patients with high dNLR were at two times higher risk of GG ≥ 2 and any PCa, irrespective of other confounders. Cancer can modulate polarization and excessive release of neutrophils, which are involved in tumor initiation and progression [28]. A decreased number of lymphocytes, which are the major component of dNLR denominator, is a poor prognosticator in cancer patients and is associated with excessive cancer expression of proapoptotic ligands [29,30]. Up to now, only a few studies have analyzed the predictive value of single or few blood biomarkers in the context of MRI-guided biopsies [31,32] and others in prostate MRI followed by radical prostatectomy [33]. In a study by Sun et al., who evaluated 335 men with both suspicious and non-suspicious MRIs, NLR (OR 2.37, 95% CI 1.38–4.06, p = 0.002), but not PLR or LMR, was an independent predictor of significant PCa [31]. Furthermore, the addition of NLR to the reference model (DRE, % free PSA, age) improved the AUC to 0.813, which was further enhanced by the incorporation of PI-RADS (AUC 0.873). Our model showed that dNLR, but not NLR (p = 0.06), was a significant predictor of any and GG ≥ 2 PCa. This is partly in line with the study of Pichler et al., who found that dNLR, but not NLR, independently predicted oncological outcomes in renal cell carcinoma patients [34]. Concordantly, in two prospective randomized trials, which included metastatic castration-resistant PCa (mCRPC) treated with chemotherapy, high (≥2) dNLR was prognostic for overall survival (hazard ratio 1.43, 95% CI 1.20–1.70, p < 0.001) [14].
No prior study evaluated the value of PNI in the context of prostate biopsy and only several in metastatic PCa [35,36]. In a study by Fan et al., PNI predicted response to abiraterone in patients with mCRPC [35]. In another study by Li et al., low PNI was associated with adverse oncologic outcomes in hormone-sensitive PCa treated with androgen-deprivation therapy [36]. In general, hypoalbuminemia is a poor prognostic factor in cancer patients and is associated with cancer-related inflammation and malnutrition [37]. High PNI, which combines albumins and lymphocytes, is a good prognostic factor in cancer patients [36,37]. We found that patients with high PNI were over 50% less likely to be diagnosed with GG≥2 on MRI-targeted and systematic biopsy, which suggests that with risk stratification using PNI and other clinical factors, some of the patients with suspicious MRI may forgo biopsy. Still, PCa is one of the most common causes of cancer-specific death [1]. Therefore, there is a need to improve the understanding of cancer development [38] and search for new PCa markers [39].
Our study has several limitations. First, there are limitations inherent to any retrospective data collection, especially concerning any potential selection bias. Second, some of the patients could suffer from chronic inflammatory conditions that could have influence markers levels; nevertheless, none of the patients suffered from acute inflammatory disease. Third, patients did not undergo pre-diagnosis and advanced imaging such as PSMA/PET-CT, and our staging was limited to DRE. Fourth, our nomograms lack external validation. Despite these limitations, we present the first study that comprehensively analyzes the role of multiple biomarkers in patients with suspicious prostate MRI undergoing MRI-targeted and systematic biopsy. Prospective studies are warranted to validate our results.

5. Conclusions

We found that despite suspicious prostate MRI, a meaningful number of patients would benefit from enhanced pre-biopsy risk stratification. In patients with PI-RADS ≥ 3 lesions undergoing MRI-targeted and systematic biopsy, high dNLR and low PNI, but not NLR, PLR, LMR, SII, and mGPS, were independent predictors of any PCa and/or GG ≥ 2. Nevertheless, these biomarkers did not improve the discriminatory ability of a reference model comprising DRE, PI-RADS category, PSAD, and age, which reached over 80% accuracy.

Supplementary Materials

The following are available online at https://www.mdpi.com/article/10.3390/jpm11111231/s1: Figure S1: Calibration plots of the pre-biopsy nomogram based on clinical variables and dNLR predicting absence of GG ≥ 2.; Figure S2: Calibration plots of the pre-biopsy nomogram based on clinical variables and PNI predicting absence of GG ≥ 2.; Table S1: Biomarker cut-offs with diagnostic estimates for GG ≥ 2 prediction; Table S2: Univariable analyses for GG ≥ 2 and any PCa detection in patients with PI-RADS ≥ 3 undergoing MRI-targeted and systematic biopsy.

Author Contributions

Conceptualization: P.R., N.A.H., P.B., A.P. and S.F.S.; data curation, P.R., D.I.H., S.K., F.Q., F.K., H.M., E.L., K.M., R.S.M., T.Y., B.P., P.A.B. and B.G.; formal analysis, P.R., N.C.G., V.M.S. and A.A.; investigation, S.K.; methodology, P.R. and S.F.S.; project administration, P.R. and N.A.H.; resources, P.R.; supervision, P.A.B., B.G. and S.F.S.; writing—original draft, P.R., N.A.H., N.C.G., V.M.S., F.K. and S.F.S.; writing—review and editing, F.Q., H.M., E.L., K.M., R.S.M., T.Y., A.A., P.B.,B.P., A.P., P.A.B. and B.G. All authors have read and agreed to the published version of the manuscript.

Funding

This research received no external funding. P.R. and E.L. are supported by the EUSP Scholarship of the European Association of Urology (EAU). N.C.G. is supported by the Zurich Cancer League. K.M. is supported by the Uehara Memorial Foundation.

Institutional Review Board Statement

The research was conducted ethically in accordance with the World Medical Association Declaration of Helsinki. The Ethics Committee of the Medical University of Vienna approved this retrospective study (EC no. 2209/2019).

Informed Consent Statement

Considering the retrospective nature of the study and the fact that all the procedures were part of routine care, there was no need for the informed consent.

Data Availability Statement

The data presented in this study are available on request from the corresponding author. The data are not publicly available due to privacy and ethical restrictions.

Conflicts of Interest

The authors declare no conflict of interest.

References

  1. Mottet, N.; van den Bergh, R.C.; Briers, E.; van den Broeck, T.; Cumberbatch, M.G.; De Santis, M.; Fanti, S.; Fossati, N.; Gandaglia, G.; Gillessen, S.; et al. EAU-EANM-ESTRO-ESUR-SIOG Guidelines on Prostate Cancer—2020 Update. Part 1: Screening, Diagnosis, and Local Treatment with Curative Intent. Eur. Urol. 2021, 79, 243–262. [Google Scholar] [CrossRef] [PubMed]
  2. Rajwa, P.; Pradere, B.; Quhal, F.; Mori, K.; Laukhtina, E.; Huebner, N.A.; D’Andrea, D.; Krzywon, A.; Shim, S.R.; Baltzer, P.A.; et al. Reliability of Serial Prostate Magnetic Resonance Imaging to Detect Prostate Cancer Progression During Active Surveillance: A Systematic Review and Meta-analysis. Eur. Urol. 2021, 80, 549–563. [Google Scholar] [CrossRef]
  3. Ahdoot, M.; Wilbur, A.R.; Reese, S.E.; Lebastchi, A.H.; Mehralivand, S.; Gomella, P.; Bloom, J.; Gurram, S.; Siddiqui, M.; Pinsky, P.; et al. MRI-Targeted, Systematic, and Combined Biopsy for Prostate Cancer Diagnosis. N. Engl. J. Med. 2020, 382, 917–928. [Google Scholar] [CrossRef]
  4. Klotz, L.; Chin, J.; Black, P.C.; Finelli, A.; Anidjar, M.; Bladou, F.; Mercado, A.; Levental, M.; Ghai, S.; Chang, S.D.; et al. Comparison of Multiparametric Magnetic Resonance Imaging–Targeted Biopsy With Systematic Transrectal Ultrasonography Biopsy for Biopsy-Naive Men at Risk for Prostate Cancer: A Phase 3 Randomized Clinical Trial. JAMA Oncol. 2021, 7, 534. [Google Scholar] [CrossRef]
  5. Klotz, L.; Pond, G.; Loblaw, A.; Sugar, L.; Moussa, M.; Berman, D.; Van der Kwast, T.; Vesprini, D.; Milot, L.; Kebabdjian, M.; et al. Randomized Study of Systematic Biopsy Versus Magnetic Resonance Imaging and Targeted and Systematic Biopsy in Men on Active Surveillance (ASIST): 2-year Postbiopsy Follow-up. Eur. Urol. 2020, 77, 311–317. [Google Scholar] [CrossRef] [PubMed] [Green Version]
  6. Padhani, A.; Weinreb, J.; Rosenkrantz, A.B.; Villeirs, G.; Turkbey, B.; Barentsz, J. Prostate Imaging-Reporting and Data System Steering Committee: PI-RADS v2 Status Update and Future Directions. Eur. Urol. 2019, 75, 385–396. [Google Scholar] [CrossRef] [Green Version]
  7. Park, K.J.; Choi, S.H.; Lee, J.S.; Kim, J.K.; Kim, M.-H.; Jeong, I.G. Risk Stratification of Prostate Cancer According to PI-RADS® Version 2 Categories: Meta-Analysis for Prospective Studies. J. Urol. 2020, 204, 1141–1149. [Google Scholar] [CrossRef] [PubMed]
  8. Distler, F.A.; Radtke, J.P.; Bonekamp, D.; Kesch, C.; Schlemmer, H.-P.; Wieczorek, K.; Kirchner, M.; Pahernik, S.; Hohenfellner, M.; Hadaschik, B. The Value of PSA Density in Combination with PI-RADS™ for the Accuracy of Prostate Cancer Prediction. J. Urol. 2017, 198, 575–582. [Google Scholar] [CrossRef]
  9. Falagario, U.G.; Lantz, A.; Jambor, I.; Martini, A.; Ratnani, P.; Wagaskar, V.; Treacy, P.; Veccia, A.; Bravi, C.A.; Bashorun, H.O.; et al. Using biomarkers in patients with positive multiparametric magnetic resonance imaging: 4Kscore predicts the presence of cancer outside the index lesion. Int. J. Urol. 2020, 28, 47–52. [Google Scholar] [CrossRef]
  10. Hendriks, R.J.; Van Der Leest, M.M.G.; Dijkstra, S.; Barentsz, J.O.; Van Criekinge, W.; De Kaa, C.A.H.-V.; Schalken, J.A.; Mulders, P.F.A.; Van Oort, I.M. A urinary biomarker-based risk score correlates with multiparametric MRI for prostate cancer detection. Prostate 2017, 77, 1401–1407. [Google Scholar] [CrossRef]
  11. Rajwa, P.; Syed, J.; Leapman, M.S. How Should Radiologists Incorporate Non-Imaging Prostate Cancer Biomarkers Into Daily Practice? Abdom. Radiol. 2020, 45, 4031–4039. [Google Scholar] [CrossRef]
  12. Rajwa, P.; Schuettfort, V.M.; D’Andrea, D.; Quhal, F.; Mori, K.; Katayama, S.; Laukhtina, E.; Pradere, B.; Motlagh, R.S.; Mostafaei, H.; et al. Impact of systemic Immune–inflammation Index on oncologic outcomes in patients treated with radical prostatectomy for clinically nonmetastatic prostate cancer. Urol. Oncol. Semin. Orig. Investig. 2021, 39, 785.e19–785.e27. [Google Scholar] [CrossRef] [PubMed]
  13. Ferro, M.; Musi, G.; Serino, A.; Cozzi, G.; Mistretta, F.A.; Costa, B.; Bianchi, R.; Cordima, G.; Luzzago, S.; Di Trapani, E.; et al. Neutrophil, Platelets, and Eosinophil to Lymphocyte Ratios Predict Gleason Score Upgrading in Low-Risk Prostate Cancer Patients. Urol. Int. 2018, 102, 43–50. [Google Scholar] [CrossRef]
  14. Van Soest, R.J.; Templeton, A.J.; Vera-Badillo, F.E.; Mercier, F.; Sonpavde, G.; Amir, E.; Tombal, B.; Rosenthal, M.; Eisenberger, M.A.; Tannock, I.F.; et al. Neutrophil-to-lymphocyte ratio as a prognostic biomarker for men with metastatic castration-resistant prostate cancer receiving first-line chemotherapy: Data from two randomized phase III trials. Ann. Oncol. 2015, 26, 743–749. [Google Scholar] [CrossRef]
  15. Epstein, J.I.; Zelefsky, M.; Sjoberg, D.D.; Nelson, J.B.; Egevad, L.; Magi-Galluzzi, C.; Vickers, A.J.; Parwani, A.V.; Reuter, V.E.; Fine, S.W.; et al. A Contemporary Prostate Cancer Grading System: A Validated Alternative to the Gleason Score. Eur. Urol. 2016, 69, 428–435. [Google Scholar] [CrossRef] [PubMed] [Green Version]
  16. Rajwa, P.; Życzkowski, M.; Paradysz, A.; Slabon-Turska, M.; Suliga, K.; Bujak, K.; Bryniarski, P. Novel hematological biomarkers predict survival in renal cell carcinoma patients treated with nephrectomy. Arch. Med Sci. 2020, 16, 1062–1071. [Google Scholar] [CrossRef]
  17. Laukhtina, E.; Pradere, B.; D’Andrea, D.; Rosiello, G.; Luzzago, S.; Pecoraro, A.; Palumbo, C.; Knipper, S.; Karakiewicz, P.I.; Margulis, V.; et al. Association of preoperative serum De Ritis ratio with oncological outcomes in patients treated with cytoreductive nephrectomy for metastatic renal cell carcinoma. Urol. Oncol. Semin. Orig. Investig. 2020, 38, 936.e7–936.e14. [Google Scholar] [CrossRef] [PubMed]
  18. Schuettfort, V.M.; Gust, K.; D’Andrea, D.; Quhal, F.; Mostafaei, H.; Laukhtina, E.; Mori, K.; Rink, M.; Abufaraj, M.; Karakiewicz, P.I.; et al. Impact of the preoperative modified glasgow prognostic score on disease outcome after radical cystectomy for urothelial carcinoma of the bladder. Minerva Urol. Nephrol. 2021. [Google Scholar] [CrossRef]
  19. Falagario, U.G.; Martini, A.; Wajswol, E.; Treacy, P.-J.; Ratnani, P.; Jambor, I.; Anastos, H.; Lewis, S.; Haines, K.; Cormio, L.; et al. Avoiding Unnecessary Magnetic Resonance Imaging (MRI) and Biopsies: Negative and Positive Predictive Value of MRI According to Prostate-specific Antigen Density, 4Kscore and Risk Calculators. Eur. Urol. Oncol. 2020, 3, 700–704. [Google Scholar] [CrossRef] [Green Version]
  20. Maggi, M.; Del Giudice, F.; Falagario, U.; Cocci, A.; Russo, G.; Di Mauro, M.; Sepe, G.; Galasso, F.; Leonardi, R.; Iacona, G.; et al. SelectMDx and Multiparametric Magnetic Resonance Imaging of the Prostate for Men Undergoing Primary Prostate Biopsy: A Prospective Assessment in a Multi-Institutional Study. Cancers 2021, 13, 2047. [Google Scholar] [CrossRef]
  21. Loeb, S.; Vellekoop, A.; Ahmed, H.U.; Catto, J.; Emberton, M.; Nam, R.; Rosario, D.J.; Scattoni, V.; Lotan, Y. Systematic Review of Complications of Prostate Biopsy. Eur. Urol. 2013, 64, 876–892. [Google Scholar] [CrossRef] [Green Version]
  22. De Rooij, M.; Crienen, S.; Witjes, J.A.; Barentsz, J.O.; Rovers, M.M.; Grutters, J.P. Cost-effectiveness of Magnetic Resonance (MR) Imaging and MR-guided Targeted Biopsy Versus Systematic Transrectal Ultrasound–Guided Biopsy in Diagnosing Prostate Cancer: A Modelling Study from a Health Care Perspective. Eur. Urol. 2014, 66, 430–436. [Google Scholar] [CrossRef] [PubMed]
  23. Barnett, C.L.; Davenport, M.S.; Montgomery, J.S.; Wei, J.T.; Montie, J.E.; Denton, B.T. Cost-effectiveness of magnetic resonance imaging and targeted fusion biopsy for early detection of prostate cancer. BJU Int. 2018, 122, 50–58. [Google Scholar] [CrossRef] [Green Version]
  24. Deniffel, D.; Healy, G.M.; Dong, X.; Ghai, S.; Salinas-Miranda, E.; Fleshner, N.; Hamilton, R.; Kulkarni, G.; Toi, A.; van der Kwast, T.; et al. Avoiding Unnecessary Biopsy: MRI-based Risk Models versus a PI-RADS and PSA Density Strategy for Clinically Significant Prostate Cancer. Radiology 2021, 300, 369–379. [Google Scholar] [CrossRef] [PubMed]
  25. Wajswol, E.; Winoker, J.S.; Anastos, H.; Falagario, U.; Okhawere, K.; Martini, A.; Treacy, P.; Voutsinas, N.; Knauer, C.J.; Sfakianos, J.P.; et al. A cohort of transperineal electromagnetically tracked magnetic resonance imaging/ultrasonography fusion-guided biopsy: Assessing the impact of inter-reader variability on cancer detection. BJU Int. 2020, 125, 531–540. [Google Scholar] [CrossRef] [PubMed]
  26. Msc, I.M.P.; Merisaari, H.; Jambor, I.; Ettala, O.; Taimen, P.; Knaapila, J.; Kekki, H.; Khan, F.L.; Syrjälä, E.; Steiner, A.; et al. Detection of Prostate Cancer Using Biparametric Prostate MRI, Radiomics, and Kallikreins: A Retrospective Multicenter Study of Men With a Clinical Suspicion of Prostate Cancer. J. Magn. Reson. Imaging 2021. [Google Scholar] [CrossRef]
  27. Tătaru, O.; Vartolomei, M.; Rassweiler, J.; Virgil, O.; Lucarelli, G.; Porpiglia, F.; Amparore, D.; Manfredi, M.; Carrieri, G.; Falagario, U.; et al. Artificial Intelligence and Machine Learning in Prostate Cancer Patient Management—Current Trends and Future Perspectives. Diagnostics 2021, 11, 354. [Google Scholar] [CrossRef] [PubMed]
  28. Coffelt, S.B.; Wellenstein, M.D.; De Visser, K.E. Neutrophils in cancer: Neutral no more. Nat. Rev. Cancer 2016, 16, 431–446. [Google Scholar] [CrossRef] [Green Version]
  29. Ray-Coquard, I.; Cropet, C.; Van Glabbeke, M.; Sebban, C.; Le Cesne, A.; Judson, I.; Tredan, O.; Verweij, J.; Biron, P.; Labidi-Galy, S.I.; et al. Lymphopenia as a Prognostic Factor for Overall Survival in Advanced Carcinomas, Sarcomas, and Lymphomas. Cancer Res. 2009, 69, 5383–5391. [Google Scholar] [CrossRef] [Green Version]
  30. Kim, R.; Emi, M.; Tanabe, K.; Uchida, Y.; Toge, T. The role of Fas ligand and transforming growth factor beta in tumor progression: Molecular mechanisms of immune privilege via Fas-mediated apoptosis and potential targets for cancer therapy. Cancer 2004, 100, 2281–2291. [Google Scholar] [CrossRef]
  31. Sun, J.; Zhang, Z.; OuYang, J. A novel nomogram combined PIRADS v2 and neutrophil-to-lymphocyte ratio to predict the risk of clinically significant prostate cancer in men with PSA <10 ng/ml at first biopsy. Urol. Oncol. Semin. Orig. Investig. 2019, 38, 401–409. [Google Scholar] [CrossRef]
  32. Wang, H.; Tai, S.; Zhang, L.; Zhou, J.; Liang, C. A calculator based on prostate imaging reporting and data system version 2 (PI-RADS V2) is a promising prostate cancer predictor. Sci. Rep. 2019, 9, 6870. [Google Scholar] [CrossRef]
  33. Ferro, M.; Musi, G.; Matei, D.; Mistretta, A.; Luzzago, S.; Cozzi, G.; Bianchi, R.; Di Trapani, E.; Cioffi, A.; Lucarelli, G.; et al. Assessment of PSIM (Prostatic Systemic Inflammatory Markers) Score in Predicting Pathologic Features at Robotic Radical Prostatectomy in Patients with Low-Risk Prostate Cancer Who Met the Inclusion Criteria for Active Surveillance. Diagnostics 2021, 11, 355. [Google Scholar] [CrossRef] [PubMed]
  34. Dalpiaz, O.; Luef, T.; Seles, M.; Stotz, M.; Stojakovic, T.; Pummer, K.; Zigeuner, R.; Hutterer, G.C.; Pichler, M. Critical evaluation of the potential prognostic value of the pretreatment-derived neutrophil–lymphocyte ratio under consideration of C-reactive protein levels in clear cell renal cell carcinoma. Br. J. Cancer 2016, 116, 85–90. [Google Scholar] [CrossRef] [PubMed] [Green Version]
  35. Fan, L.; Wang, X.; Chi, C.; Wang, Y.; Cai, W.; Shao, X.; Xu, F.; Pan, J.; Zhu, Y.; Shangguan, X.; et al. Prognostic nutritional index predicts initial response to treatment and prognosis in metastatic castration-resistant prostate cancer patients treated with abiraterone. Prostate 2017, 77, 1233–1241. [Google Scholar] [CrossRef] [PubMed]
  36. Li, B.; Lu, Z.; Wang, S.; Hou, J.; Xia, G.; Li, H.; Yin, B.; Lu, W. Pretreatment elevated prognostic nutritional index predicts a favorable prognosis in patients with prostate cancer. BMC Cancer 2020, 20, 361. [Google Scholar] [CrossRef]
  37. Mohri, Y.; Inoue, Y.; Tanaka, K.; Hiro, J.; Uchida, K.; Kusunoki, M. Prognostic Nutritional Index Predicts Postoperative Outcome in Colorectal Cancer. World J. Surg. 2013, 37, 2688–2692. [Google Scholar] [CrossRef]
  38. Baldassarri, M.; Fallerini, C.; Cetta, F.; Ghisalberti, M.; Bellan, C.; Furini, S.; Spiga, O.; Crispino, S.; Gotti, G.; Ariani, F.; et al. Omic Approach in Non-smoker Female with Lung Squamous Cell Carcinoma Pinpoints to Germline Susceptibility and Personalized Medicine. Cancer Res. Treat. 2018, 50, 356–365. [Google Scholar] [CrossRef] [PubMed] [Green Version]
  39. Cochetti, G.; de Vermandois, J.A.R.; Maulà, V.; Giulietti, M.; Cecati, M.; Del Zingaro, M.; Cagnani, R.; Suvieri, C.; Paladini, A.; Mearini, E. Role of miRNAs in prostate cancer: Do we really know everything? Urol. Oncol. Semin. Orig. Investig. 2020, 38, 623–635. [Google Scholar] [CrossRef]
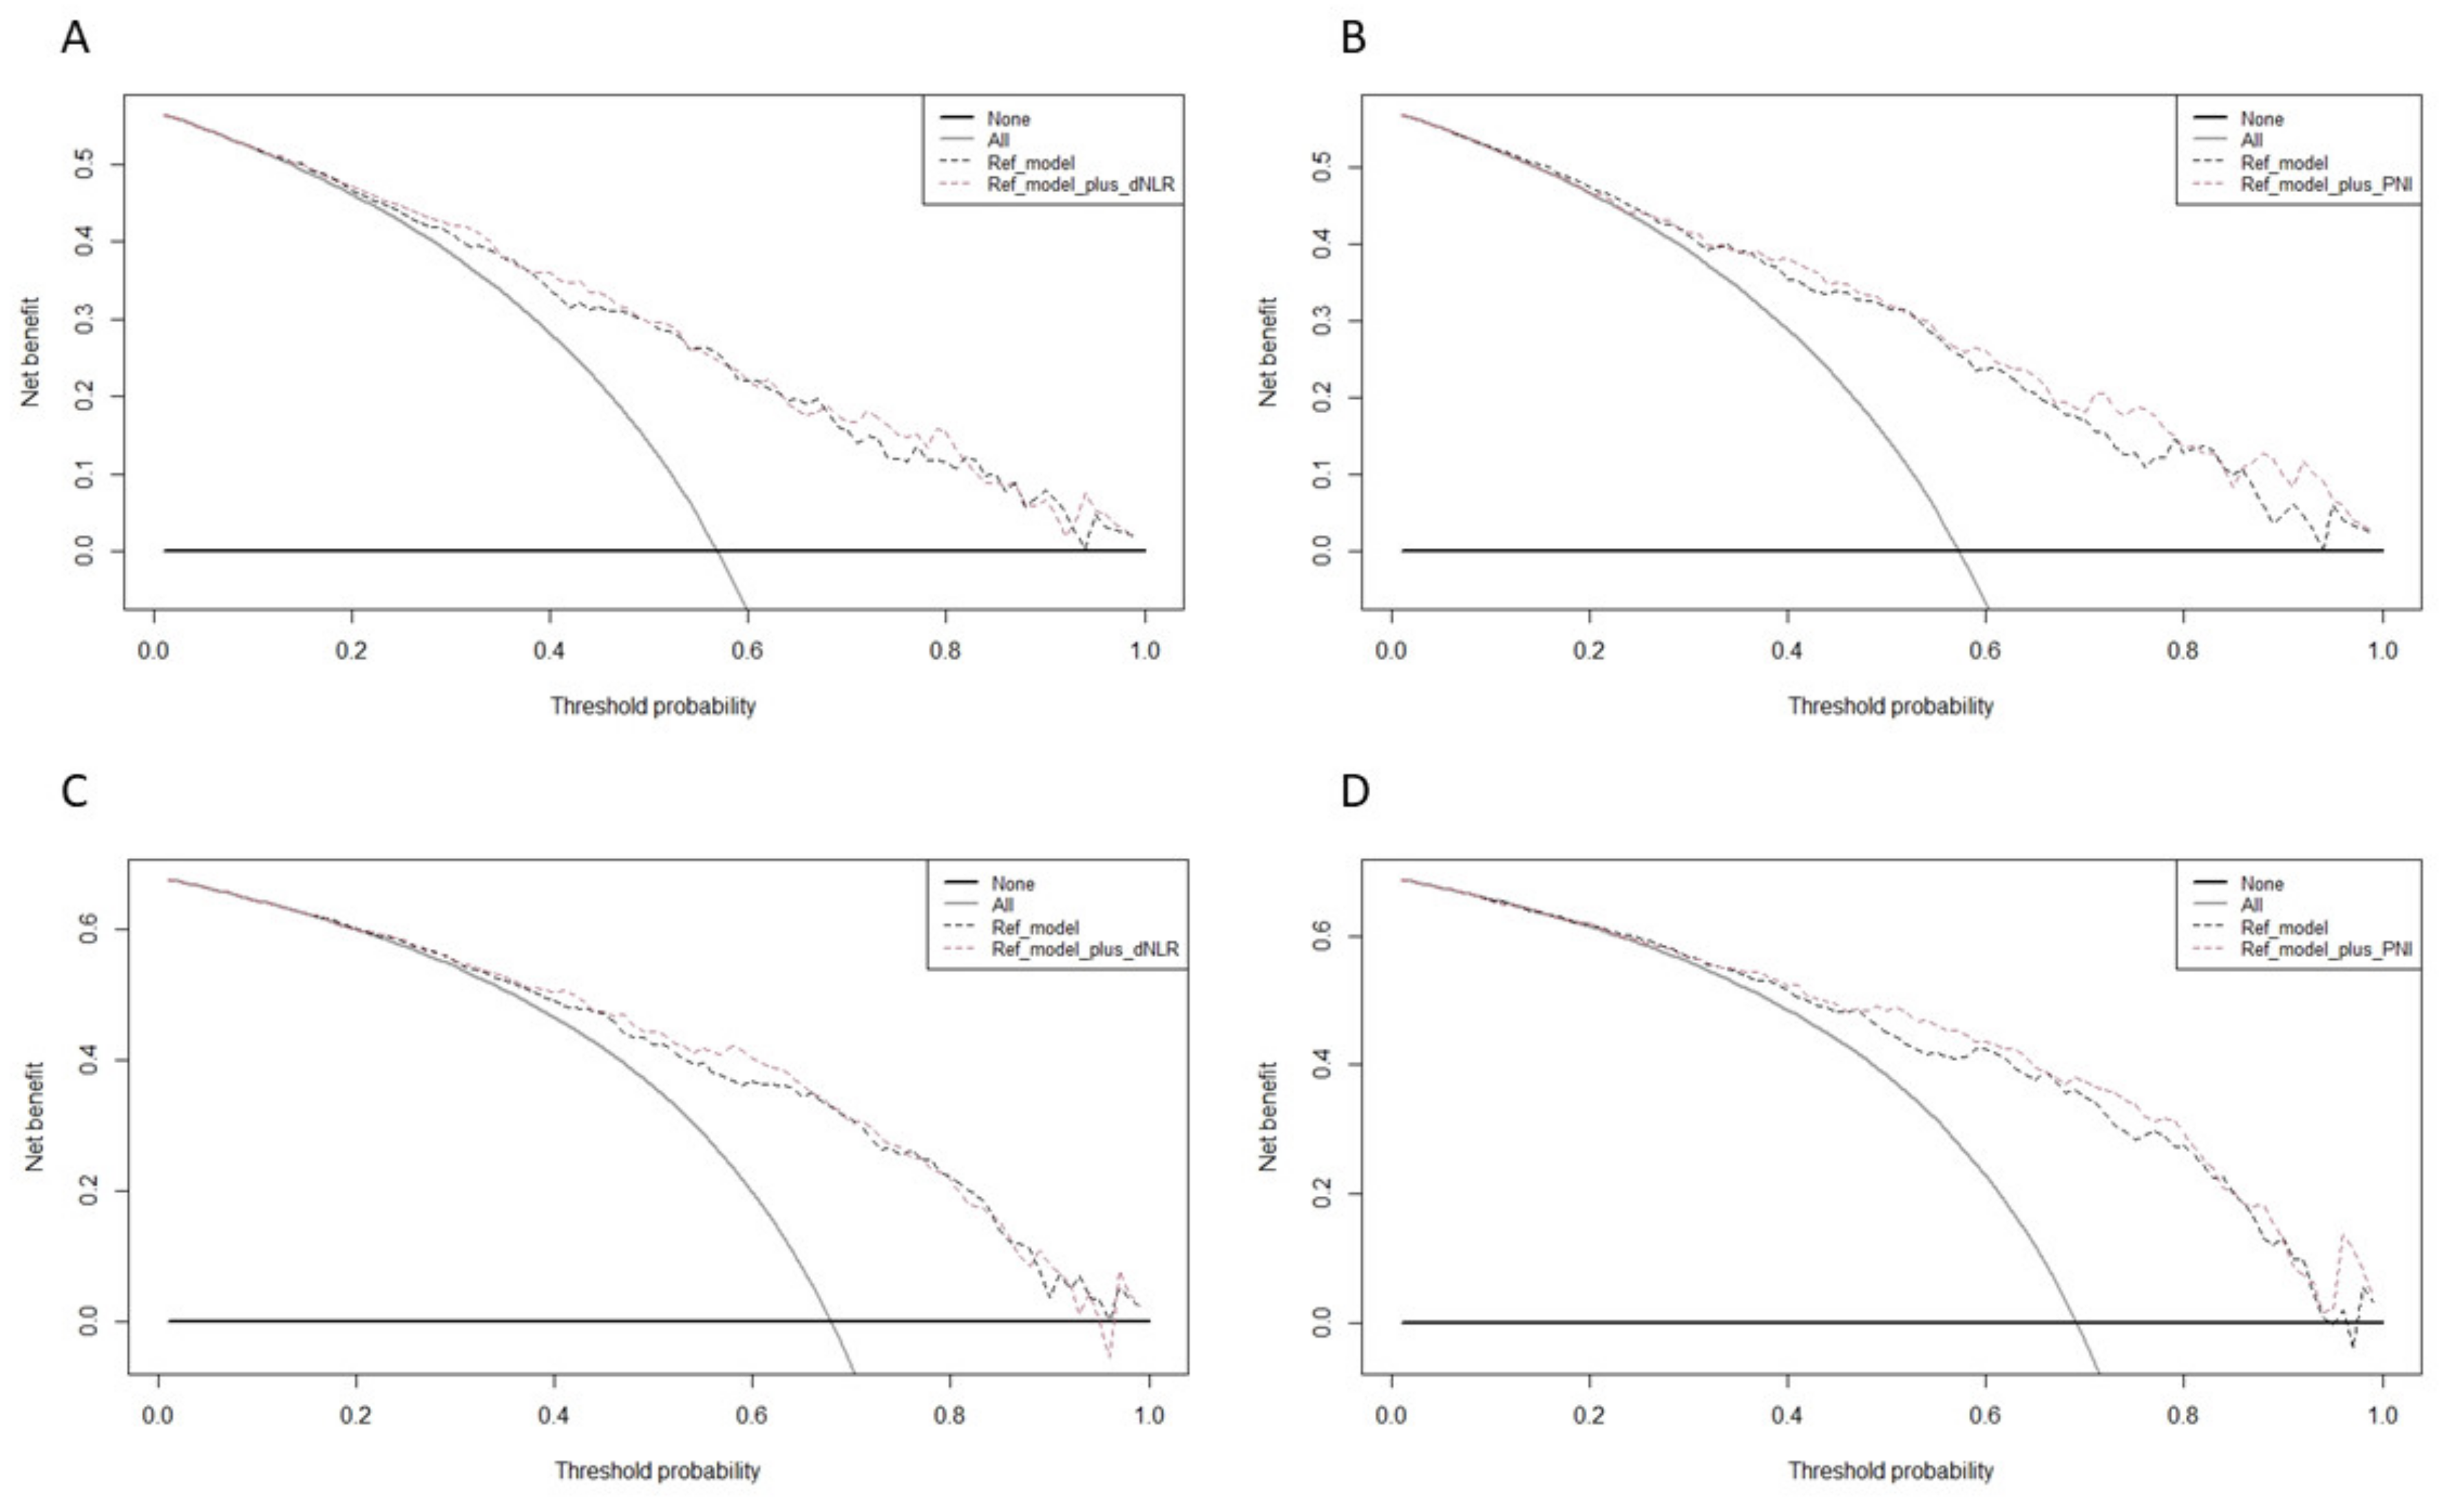
Figure 1. Decision curve analysis (DCA) for the net benefit of the pre-biopsy biomarkers based on the reference model for the prediction of (A) dNLR for GG ≥ 2, (B) PNI for GG ≥ 2, (C) dNLR for PCA, and (D) PNI for PCa. Decision curve analysis evaluating the clinical impact of clinical pre-biopsy models (reference model) with the integration of biomarker (reference model plus A,C: dNLR; B,D: PNI) estimating (A,B) GG ≥ 2 and (C,D) PCA in patients with MRI score PI-RADS ≥ 3 undergoing MRI-targeted and systematic biopsy. The x axis is the threshold probability. The y axis measures the net benefit, which is calculated by adding the true positives and subtracting the false positives. The horizontal line representing the x axis assumes that no patients undergo biopsy, whereas the gray line assumes that all patients undergo biopsy at a specific threshold probability. The dashed black line represents the net benefit of the regression model that was fitted using established clinicopathological variables. The dashed red line represents the net benefit of the same regression models with biomarkers.
Jpm 11 01231 g001
Figure 2. Pre-biopsy nomogram based on multivariable logistic regression model with dNLR predicting benign pathology or GG1 disease in patients with PI-RADS ≥ 3 lesions undergoing systematic and targeted biopsy. Instructions for physicians: Locate the patients status on the corresponding axis. Draw a straight line to determine how many points the patients should receive for each variable. Sum the points received and locate the number on the total points axis. Draw a line down from total points to the noGG2 axis.
Jpm 11 01231 g002
Figure 3. Pre-biopsy nomogram based on the multivariable logistic regression model with PNI predicting benign pathology or GG1 disease in patients with PI-RADS ≥ 3 lesions undergoing systematic and targeted biopsy. Instructions for physicians: Locate the patients status on the corresponding axis. Draw a straight line to determine how many points the patients should receive for each variable. Sum the points received and locate the number on the total points axis. Draw a line down from total points to the noGG2 axis.
Jpm 11 01231 g003
Table 1. Consecutive patients with PI-RADS ≥ 3 lesions undergoing MRI.
OverallPI-RADSGG ≥ 2
Characteristicn = 3243, n = 37 (11%)4, n = 168 (52%)5, n = 119 (37%)p-valuenegative, n = 137 (42%)positive, n = 187 (58%)p-value
Age (years)67 (60–73)66 (58–72)65 (59–72)72 (63–75)<0.00165 (58–70)69 (62–75)<0.001
PSA (ng/mL)7 (5–11)7 (5–8)7 (5–10)9 (5–14)0.0016 (4–9)8 (5–12)<0.001
PSAD (ng/mL2)0.17 (0.10–0.28)0.14 (0.08–0.19)0.16 (0.09–0.25)0.23 (0.15–0.37)<0.0010.13 (0.08–0.19)0.22 (0.14–0.35)<0.001
DRE (cT ≥ 2) (%)85 (26)3 (8.1)29 (17)53 (45)<0.00115 (11)70 (37)<0.001
NLR2.16 (1.66–2.88)2.19 (1.58–2.67)2.12 (1.57–2.75)2.29 (1.72–3.15)0.22.14 (1.57–2.61)2.21 (1.69–3.08)0.045
dNLR1.51 (1.16–1.94)1.61 (1.12–1.92)1.46 (1.16–1.86)1.60 (1.19–2.08)0.31.47 (1.13–1.80)1.54 (1.19–2.11)0.061
PLR124 (96–151)117 (95–140)125 (93–153)128 (104–156)0.3120 (94–146)128 (101–156)0.2
LMR3.17 (2.41–4.00)3.12 (2.55–4.05)3.20 (2.45–4.33)3.00 (2.37–4.00)0.133.20 (2.50–4.00)3.14 (2.35–4.00)0.3
SII482 (359–651)488 (341–633)458 (358–637)513 (366–674)0.6478 (366–629)485 (350–674)0.6
PNI *54.5 (51.0–57.0)54.7 (53.7–56.7)54.8 (50.9–57.6)53.8 (50.6–56.7)0.354.8 (53.2– 57.2)53.3 (50.5–56.6)0.002
De Ritis ratio0.96 (0.82–1.16)0.95 (0.81–1.18)0.93 (0.79–1.11)1.00 (0.86–1.26)0.0840.94 (0.78–1.10)1.00 (0.84–1.21)0.045
mGPS ** >0.9 0.8
0 (%)234 (87)27 (87)117 (86)90 (88) 99 (86)135 (88)
1 (%)34 (13)4 (13)18 (13)12 (12) 16 (14)18 (12)
2 (%)1 (0.4)0 (0)1 (0.7)0 (0) 0 (0)1 (0.6)
No. of total cores14 (12–16)13 (13–14)15 (12–16)14 (10–16)0.1015 (12–16)14 (12–16)0.7
No. of targeted cores4 (4–5)4. (4–4)4 (4–5)4 (4–6.00)0.44.00 (4.00–5.00)4 (4–5)0.8
No of systematic cores1 (6–12)10 (10– 12)10 (8–12)10 (6–12)0.07010 (8–12)10 (6–12)0.5
PCa (%)222 (69)9 (24)107 (64)106 (89)<0.00135 (26)187 (100)<0.001
GG≥2 (%)187 (58)5 (14)88 (52)94 (79)<0.0010187 (100)
>50% positive cores (%)85 (26)1 (2.7)24 (14)60 (50)<0.0013 (2.2)82 (44)<0.001
n (%); median (IQR); Kruskal–Wallis rank sum test; Pearson’s chi-squared test; Fisher’s exact test; * PNI (n = 278); ** mGPS (n = 269). Abbreviations: dNLR: derived neutrophil-lymphocyte ratio; DRE: digital rectal examination; GG: Gleason Grade; LMR: lymphocyte-monocyte ratio; n: number; mGPS: modified Glasgow prognostic score; NLR: neutrophil-lymphocyte ratio; PCA: prostate cancer; PI-RADS: Prostate Imaging-Reporting and Data System; PLR, platelet-lymphocyte ratio; PNI: prognostic nutrition index; PSA: prostate-specific antigen; PSAD: PSA density; SII: systemic immune-inflammation index.
Table 2. Consecutive patients with PI-RADS ≥ 3 lesions undergoing MRI-targeted and systematic biopsy stratified by PI-RADS and cancer status.
GG ≥ 2 PredictionPCa Prediction
BiomarkerOR95% CIp-valueAUC (clinical model + biomarker)OR95% CIp-valueAUC (clinical model + biomarker)
NLR (high vs. low) *1.820.98–3.380.0570.8211.730.87–3.340.1100.831
dNLR (high vs. low) *2.611.23–5.560.0170.8242.631.09–6.350.0320.834
LMR (high vs. low) *0.620.25–1.540.3020.8200.350.11–1.130.0790.828
PNI * (high vs. low)0.480.26–0.880.0180.8400.390.20–0.780.0080.865
Clinical model ** AUC = 0.818 Clinical model ** AUC = 0.826
Abbreviations: AUC: area under curve; dNLR: derived neutrophil–lymphocyte ratio; DRE: digital rectal examination; GG: Gleason Grade; LMR: lymphocyte–monocyte ratio; n: number; NLR: neutrophil–lymphocyte ratio; PCa: prostate cancer; PI-RADS: Prostate Imaging–Reporting and Data System; PNI: prognostic nutrition index; PSA: prostate-specific antigen; PSAD: PSA density. * Corrected for PSAD, age, PI-RADS, DRE. ** Clinical model: PSAD, age, PI-RADS, DRE.
Publisher’s Note: MDPI stays neutral with regard to jurisdictional claims in published maps and institutional affiliations.