
Machine Learning Consensus Clustering Approach for Patients with Lactic Acidosis in Intensive Care Units

 , ,
, ,  ,
,  , , ,
, , , 
Abstract
:1. Introduction
2. Methods
2.1. Patient Population
2.2. Data Collection
2.3. Cluster Analysis
2.4. Statistical Analysis
3. Results
4. Discussion
5. Conclusions
Supplementary Materials
Author Contributions
Funding
Institutional Review Board Statement
Informed Consent Statement
Data Availability Statement
Conflicts of Interest
References
- Vernon, C.; Letourneau, J.L. Lactic acidosis: Recognition, kinetics, and associated prognosis. Crit. Care Clin. 2010, 26, 255–283. [Google Scholar] [CrossRef]
- Levy, B. Lactate and shock state: The metabolic view. Curr. Opin. Crit. Care 2006, 12, 315–321. [Google Scholar] [CrossRef] [PubMed]
- Trzeciak, S.; Dellinger, R.P.; Chansky, M.E.; Arnold, R.C.; Schorr, C.; Milcarek, B.; Hollenberg, S.M.; Parrillo, J.E. Serum lactate as a predictor of mortality in patients with infection. Intensive Care Med. 2007, 33, 970–977. [Google Scholar] [CrossRef] [PubMed]
- Jansen, T.C.; van Bommel, J.; Woodward, R.; Mulder, P.G.; Bakker, J. Association between blood lactate levels, Sequential Organ Failure Assessment subscores, and 28-day mortality during early and late intensive care unit stay: A retrospective observational study. Crit. Care Med. 2009, 37, 2369–2374. [Google Scholar] [CrossRef]
- Pattharanitima, P.; Thongprayoon, C.; Kaewput, W.; Qureshi, F.; Qureshi, F.; Petnak, T.; Srivali, N.; Gembillo, G.; O’Corragain, O.A.; Chesdachai, S.; et al. Machine Learning Prediction Models for Mortality in Intensive Care Unit Patients with Lactic Acidosis. J. Clin. Med. 2021, 10, 5021. [Google Scholar] [CrossRef]
- Correia, C.S.; Bronander, K.A. Metformin-associated lactic acidosis masquerading as ischemic bowel. Am. J. Med. 2012, 125, e9. [Google Scholar] [CrossRef]
- Cheungpasitporn, W.; Zand, L.; Dillon, J.J.; Qian, Q.; Leung, N. Lactate clearance and metabolic aspects of continuous high-volume hemofiltration. Clin. Kidney J. 2015, 8, 374–377. [Google Scholar] [CrossRef] [PubMed] [Green Version]
- Dellinger, R.P.; Levy, M.M.; Carlet, J.M.; Bion, J.; Parker, M.M.; Jaeschke, R.; Reinhart, K.; Angus, D.C.; Brun-Buisson, C.; Beale, R.; et al. Surviving Sepsis Campaign: International guidelines for management of severe sepsis and septic shock: 2008. Crit. Care Med. 2008, 36, 296–327. [Google Scholar] [CrossRef] [Green Version]
- Bakker, J.; Gris, P.; Coffernils, M.; Kahn, R.J.; Vincent, J.L. Serial blood lactate levels can predict the development of multiple organ failure following septic shock. Am. J. Surg. 1996, 171, 221–226. [Google Scholar] [CrossRef]
- Sammour, T.; Kahokehr, A.; Caldwell, S.; Hill, A.G. Venous glucose and arterial lactate as biochemical predictors of mortality in clinically severely injured trauma patients--a comparison with ISS and TRISS. Injury 2009, 40, 104–108. [Google Scholar] [CrossRef]
- Lavery, R.F.; Livingston, D.H.; Tortella, B.J.; Sambol, J.T.; Slomovitz, B.M.; Siegel, J.H. The utility of venous lactate to triage injured patients in the trauma center. J. Am. Coll. Surg. 2000, 190, 656–664. [Google Scholar] [CrossRef]
- Weil, M.H.; Afifi, A.A. Experimental and clinical studies on lactate and pyruvate as indicators of the severity of acute circulatory failure (shock). Circulation 1970, 41, 989–1001. [Google Scholar] [CrossRef] [Green Version]
- O’Connor, E.; Fraser, J.F. The interpretation of perioperative lactate abnormalities in patients undergoing cardiac surgery. Anaesth. Intensive Care 2012, 40, 598–603. [Google Scholar] [CrossRef] [PubMed] [Green Version]
- Ranucci, M.; De Toffol, B.; Isgrò, G.; Romitti, F.; Conti, D.; Vicentini, M. Hyperlactatemia during cardiopulmonary bypass: Determinants and impact on postoperative outcome. Crit. Care 2006, 10, R167. [Google Scholar] [CrossRef] [PubMed] [Green Version]
- Toraman, F.; Evrenkaya, S.; Yuce, M.; Aksoy, N.; Karabulut, H.; Bozkulak, Y.; Alhan, C. Lactic acidosis after cardiac surgery is associated with adverse outcome. Heart Surg. Forum 2004, 7, E155–E159. [Google Scholar] [CrossRef] [PubMed]
- Renew, J.R.; Barbara, D.W.; Hyder, J.A.; Dearani, J.A.; Rivera, M.; Pulido, J.N. Frequency and outcomes of severe hyperlactatemia after elective cardiac surgery. J. Thorac. Cardiovasc. Surg. 2016, 151, 825–830. [Google Scholar] [CrossRef] [PubMed] [Green Version]
- Maillet, J.M.; Le Besnerais, P.; Cantoni, M.; Nataf, P.; Ruffenach, A.; Lessana, A.; Brodaty, D. Frequency, risk factors, and outcome of hyperlactatemia after cardiac surgery. Chest 2003, 123, 1361–1366. [Google Scholar] [CrossRef] [Green Version]
- Demers, P.; Elkouri, S.; Martineau, R.; Couturier, A.; Cartier, R. Outcome with high blood lactate levels during cardiopulmonary bypass in adult cardiac operation. Ann. Thorac. Surg. 2000, 70, 2082–2086. [Google Scholar] [CrossRef]
- Ranucci, M.; Ballotta, A.; Castelvecchio, S.; Baryshnikova, E.; Brozzi, S.; Boncilli, A. Intensive care unit admission parameters improve the accuracy of operative mortality predictive models in cardiac surgery. PLoS ONE 2010, 5, e13551. [Google Scholar] [CrossRef] [Green Version]
- Peters, N.; Jay, N.; Barraud, D.; Cravoisy, A.; Nace, L.; Bollaert, P.E.; Gibot, S. Metformin-associated lactic acidosis in an intensive care unit. Crit. Care 2008, 12, R149. [Google Scholar] [CrossRef] [Green Version]
- Biradar, V.; Moran, J.L.; Peake, S.L.; Peter, J.V. Metformin-associated lactic acidosis (MALA): Clinical profile and outcomes in patients admitted to the intensive care unit. Crit. Care Resusc. 2010, 12, 191–195. [Google Scholar] [PubMed]
- Fröhlich, H.; Balling, R.; Beerenwinkel, N.; Kohlbacher, O.; Kumar, S.; Lengauer, T.; Maathuis, M.H.; Moreau, Y.; Murphy, S.A.; Przytycka, T.M.; et al. From hype to reality: Data science enabling personalized medicine. BMC Med. 2018, 16, 150. [Google Scholar] [CrossRef]
- Sohail, A.; Arif, F. Supervised and unsupervised algorithms for bioinformatics and data science. Prog. Biophys. Mol. Biol. 2020, 151, 14–22. [Google Scholar] [CrossRef] [PubMed]
- Thongprayoon, C.; Mao, M.A.; Keddis, M.T.; Kattah, A.G.; Chong, G.Y.; Pattharanitima, P.; Nissaisorakarn, V.; Garg, A.K.; Erickson, S.B.; Dillon, J.J.; et al. Hypernatremia subgroups among hospitalized patients by machine learning consensus clustering with different patient survival. J. Nephrol. 2021, 1–9. [Google Scholar] [CrossRef]
- MacEachern, S.J.; Forkert, N.D. Machine learning for precision medicine. Genome 2021, 64, 416–425. [Google Scholar] [CrossRef] [PubMed]
- Zheng, Z.; Waikar, S.S.; Schmidt, I.M.; Landis, J.R.; Hsu, C.Y.; Shafi, T.; Feldman, H.I.; Anderson, A.H.; Wilson, F.P.; Chen, J.; et al. Subtyping CKD Patients by Consensus Clustering: The Chronic Renal Insufficiency Cohort (CRIC) Study. J. Am. Soc. Nephrol. 2021, 32, 639–653. [Google Scholar] [CrossRef] [PubMed]
- Xue, Y.; Shen, J.; Hong, W.; Zhou, W.; Xiang, Z.; Zhu, Y.; Huang, C.; Luo, S. Risk stratification of ST-segment elevation myocardial infarction (STEMI) patients using machine learning based on lipid profiles. Lipids Health Dis. 2021, 20, 48. [Google Scholar] [CrossRef] [PubMed]
- Johnson, A.E.; Pollard, T.J.; Shen, L.; Lehman, L.W.; Feng, M.; Ghassemi, M.; Moody, B.; Szolovits, P.; Celi, L.A.; Mark, R.G. MIMIC-III, a freely accessible critical care database. Sci. Data 2016, 3, 160035. [Google Scholar] [CrossRef] [PubMed] [Green Version]
- Elixhauser, A.; Steiner, C.; Harris, D.R.; Coffey, R.M. Comorbidity measures for use with administrative data. Med. Care 1998, 36, 8–27. [Google Scholar] [CrossRef] [PubMed]
- Charlson, M.E.; Pompei, P.; Ales, K.L.; MacKenzie, C.R. A new method of classifying prognostic comorbidity in longitudinal studies: Development and validation. J. Chronic. Dis. 1987, 40, 373–383. [Google Scholar] [CrossRef]
- Le Gall, J.R.; Lemeshow, S.; Saulnier, F. A new Simplified Acute Physiology Score (SAPS II) based on a European/North American multicenter study. JAMA 1993, 270, 2957–2963. [Google Scholar] [CrossRef] [PubMed]
- Levey, A.S.; Stevens, L.A.; Schmid, C.H.; Zhang, Y.L.; Castro, A.F.; Feldman, H.I.; Kusek, J.W.; Eggers, P.; Van Lente, F.; Greene, T.; et al. A new equation to estimate glomerular filtration rate. Ann. Intern. Med. 2009, 150, 604–612. [Google Scholar] [CrossRef] [PubMed]
- Kellum, J.A.; Lameire, N.; Aspelin, P.; Barsoum, R.S.; Burdmann, E.A.; Goldstein, S.L.; Herzog, C.A.; Joannidis, M.; Kribben, A.; Levey, A.S. Kidney disease: Improving global outcomes (KDIGO) acute kidney injury work group. KDIGO clinical practice guideline for acute kidney injury. Kidney Int. Suppl. 2012, 2, 1–138. [Google Scholar]
- Monti, S.; Tamayo, P.; Mesirov, J.; Golub, T. Consensus clustering: A resampling-based method for class discovery and visualization of gene expression microarray data. Mach. Learn. 2003, 52, 91–118. [Google Scholar] [CrossRef]
- Șenbabaoğlu, Y.; Michailidis, G.; Li, J.Z. Critical limitations of consensus clustering in class discovery. Sci. Rep. 2014, 4, 6207. [Google Scholar] [CrossRef] [PubMed] [Green Version]
- Wilkerson, M.D.; Hayes, D.N. ConsensusClusterPlus: A class discovery tool with confidence assessments and item tracking. Bioinformatics 2010, 26, 1572–1573. [Google Scholar] [CrossRef] [PubMed] [Green Version]
- Stekhoven, D.J.; Bühlmann, P. MissForest—non-parametric missing value imputation for mixed-type data. Bioinformatics 2012, 28, 112–118. [Google Scholar] [CrossRef] [PubMed] [Green Version]
- Alyousef, A.A.; Nihtyanova, S.; Denton, C.; Bosoni, P.; Bellazzi, R.; Tucker, A. Nearest Consensus Clustering Classification to Identify Subclasses and Predict Disease. J. Healthc. Inform. Res. 2018, 2, 402–422. [Google Scholar] [CrossRef] [PubMed] [Green Version]
- Wang, Y.; Zhao, Y.; Therneau, T.M.; Atkinson, E.J.; Tafti, A.P.; Zhang, N.; Amin, S.; Limper, A.H.; Khosla, S.; Liu, H. Unsupervised machine learning for the discovery of latent disease clusters and patient subgroups using electronic health records. J. Biomed. Inform. 2020, 102, 103364. [Google Scholar] [CrossRef] [PubMed] [Green Version]
- Minton, J.; Sidebotham, D.A. Hyperlactatemia and Cardiac Surgery. J. Extra Corpor. Technol. 2017, 49, 7–15. [Google Scholar] [PubMed]
- Raper, R.F.; Cameron, G.; Walker, D.; Bowey, C.J. Type B lactic acidosis following cardiopulmonary bypass. Crit. Care Med. 1997, 25, 46–51. [Google Scholar] [CrossRef] [PubMed]
- Bahlmann, L.; Misfeld, M.; Klaus, S.; Leptien, A.; Heringlake, M.; Schmucker, P.; Sievers, H.H.; Ungerstedt, U.; Kraatz, E.G. Myocardial redox state during coronary artery bypass grafting assessed with microdialysis. Intensive Care Med. 2004, 30, 889–894. [Google Scholar] [CrossRef] [PubMed]
- Pojar, M.; Mand’ák, J.; Cibícek, N.; Lonský, V.; Dominik, J.; Palicka, V.; Kubícek, J. Peripheral tissue metabolism during off-pump versus on-pump coronary artery bypass graft surgery: The microdialysis study. Eur. J. Cardiothorac. Surg. 2008, 33, 899–905. [Google Scholar] [CrossRef] [Green Version]
- Landow, L. Splanchnic lactate production in cardiac surgery patients. Crit. Care Med. 1993, 21, S84–S91. [Google Scholar] [CrossRef] [PubMed]
- Totaro, R.J.; Raper, R.F. Epinephrine-induced lactic acidosis following cardiopulmonary bypass. Crit. Care Med. 1997, 25, 1693–1699. [Google Scholar] [CrossRef] [PubMed]
- Freitas, A.D.; Franzon, O. Lactate as predictor of mortality in polytrauma. Arq. Bras. Cir. Dig. 2015, 28, 163–166. [Google Scholar] [CrossRef] [PubMed] [Green Version]
- Claridge, J.A.; Crabtree, T.D.; Pelletier, S.J.; Butler, K.; Sawyer, R.G.; Young, J.S. Persistent occult hypoperfusion is associated with a significant increase in infection rate and mortality in major trauma patients. J. Trauma 2000, 48, 8–14. [Google Scholar] [CrossRef] [PubMed]
- Abramson, D.; Scalea, T.M.; Hitchcock, R.; Trooskin, S.Z.; Henry, S.M.; Greenspan, J. Lactate clearance and survival following injury. J. Trauma 1993, 35, 584–588, discussion 588–589. [Google Scholar] [CrossRef] [PubMed]
- Blow, O.; Magliore, L.; Claridge, J.A.; Butler, K.; Young, J.S. The golden hour and the silver day: Detection and correction of occult hypoperfusion within 24 hours improves outcome from major trauma. J. Trauma 1999, 47, 964–969. [Google Scholar] [CrossRef]
- Lefering, R.; Zielske, D.; Bouillon, B.; Hauser, C.; Levy, H. Lactic acidosis is associated with multiple organ failure and need for ventilator support in patients with severe hemorrhage from trauma. Eur. J. Trauma Emerg. Surg. 2013, 39, 487–493. [Google Scholar] [CrossRef]
- Callaway, D.W.; Shapiro, N.I.; Donnino, M.W.; Baker, C.; Rosen, C.L. Serum lactate and base deficit as predictors of mortality in normotensive elderly blunt trauma patients. J. Trauma 2009, 66, 1040–1044. [Google Scholar] [CrossRef] [PubMed]
- Husain, F.A.; Martin, M.J.; Mullenix, P.S.; Steele, S.R.; Elliott, D.C. Serum lactate and base deficit as predictors of mortality and morbidity. Am. J. Surg. 2003, 185, 485–491. [Google Scholar] [CrossRef]
- Kauvar, D.S.; Wade, C.E. The epidemiology and modern management of traumatic hemorrhage: US and international perspectives. Crit. Care 2005, 9 (Suppl. 5), S1–S9. [Google Scholar] [CrossRef] [PubMed] [Green Version]
- Kaplan, L.J.; Kellum, J.A. Comparison of acid-base models for prediction of hospital mortality after trauma. Shock 2008, 29, 662–666. [Google Scholar] [CrossRef] [PubMed]
- Manikis, P.; Jankowski, S.; Zhang, H.; Kahn, R.J.; Vincent, J.L. Correlation of serial blood lactate levels to organ failure and mortality after trauma. Am. J. Emerg. Med. 1995, 13, 619–622. [Google Scholar] [CrossRef]
- Neligan, P.J.; Baranov, D. Trauma and aggressive homeostasis management. Anesthesiol. Clin. 2013, 31, 21–39. [Google Scholar] [CrossRef] [PubMed]
- Odom, S.R.; Howell, M.D.; Silva, G.S.; Nielsen, V.M.; Gupta, A.; Shapiro, N.I.; Talmor, D. Lactate clearance as a predictor of mortality in trauma patients. J. Trauma Acute Care Surg. 2013, 74, 999–1004. [Google Scholar] [CrossRef] [PubMed]
- Caputo, N.; Fraser, R.; Paliga, A.; Kanter, M.; Hosford, K.; Madlinger, R. Triage vital signs do not correlate with serum lactate or base deficit, and are less predictive of operative intervention in penetrating trauma patients: A prospective cohort study. Emerg. Med. J. 2013, 30, 546–550. [Google Scholar] [CrossRef] [PubMed]
- Guyette, F.; Suffoletto, B.; Castillo, J.L.; Quintero, J.; Callaway, C.; Puyana, J.C. Prehospital serum lactate as a predictor of outcomes in trauma patients: A retrospective observational study. J. Trauma 2011, 70, 782–786. [Google Scholar] [CrossRef] [PubMed] [Green Version]
- Mutschler, M.; Nienaber, U.; Brockamp, T.; Wafaisade, A.; Fabian, T.; Paffrath, T.; Bouillon, B.; Maegele, M. Renaissance of base deficit for the initial assessment of trauma patients: A base deficit-based classification for hypovolemic shock developed on data from 16,305 patients derived from the TraumaRegister DGU®. Crit. Care 2013, 17, R42. [Google Scholar] [CrossRef] [PubMed] [Green Version]
- Kraut, J.A.; Madias, N.E. Lactic acidosis. N. Engl. J. Med. 2014, 371, 2309–2319. [Google Scholar] [CrossRef] [PubMed]
- Seheult, J.; Fitzpatrick, G.; Boran, G. Lactic acidosis: An update. Clin. Chem. Lab. Med. 2017, 55, 322–333. [Google Scholar] [CrossRef] [PubMed]
- Suetrong, B.; Walley, K.R. Lactic Acidosis in Sepsis: It’s Not All Anaerobic: Implications for Diagnosis and Management. Chest 2016, 149, 252–261. [Google Scholar] [CrossRef] [PubMed]


| Characteristics | Overall | Cluster 1 | Cluster 2 | Cluster 3 | p-Value |
|---|---|---|---|---|---|
| (n = 1919) | (n = 554) | (n = 815) | (n = 550) | ||
| Age (years) | 61.8 ± 17.1 | 68.9 ± 12.4 | 54.7 ± 18.4 | 65.0 ± 15.1 | <0.001 |
| Male sex | 1118 (58) | 295 (53) | 498 (61) | 325 (59) | 0.01 |
| Race | |||||
| − White | 1560 (81) | 487 (88) | 647 (79) | 426 (77) | <0.001 |
| − Black | 152 (8) | 20 (4) | 66 (8) | 66 (12) | |
| − Hispanic | 79 (4) | 14 (2) | 46 (6) | 19 (4) | |
| − Other | 128 (7) | 33 (6) | 56 (7) | 39 (7) | |
| ICU type | |||||
| − Cardiac ICU | 206 (11) | 20 (3) | 90 (11) | 96 (17) | <0.001 |
| − Cardiac surgery ICU | 467 (24) | 392 (71) | 52 (7) | 23 (4) | |
| − Medical ICU | 605 (32) | 28 (5) | 255 (31) | 322 (59) | |
| − Surgical ICU | 295 (15) | 76 (14) | 148 (18) | 71 (13) | |
| − Trauma/surgical ICU | 346 (18) | 38 (7) | 270 (33) | 38 (7) | |
| Elixhauser Comorbidities | |||||
| − Congestive heart failure | 456 (24) | 185 (33) | 118 (14) | 153 (28) | <0.001 |
| − Valvular disease | 352 (18) | 263 (47) | 41 (5) | 48 (9) | <0.001 |
| − Pulmonary circulation disorders | 133 (7) | 49 (9) | 36 (4) | 48 (9) | 0.001 |
| − Peripheral vascular disease | 286 (15) | 182 (33) | 49 (6) | 55 (10) | <0.001 |
| − Hypertension | 884 (46) | 345 (62) | 286 (35) | 253 (46) | <0.001 |
| − Paralysis | 55 (3) | 19 (3) | 26 (3) | 10 (2) | 0.21 |
| − Neurologic disorders | 174 (9) | 29 (5) | 100 (12) | 45 (8) | <0.001 |
| − Chronic pulmonary disease | 266 (14) | 87 (16) | 108 (13) | 71 (13) | 0.33 |
| − Uncomplicated diabetes | 385 (20) | 115 (21) | 133 (16) | 137 (25) | <0.001 |
| − Complicated diabetes | 73 (4) | 29 (5) | 10 (1) | 34 (6) | <0.001 |
| − Hypothyroidism | 134 (7) | 58 (10) | 33 (4) | 43 (8) | <0.001 |
| − Liver disease | 291 (15) | 64 (12) | 72 (9) | 155 (28) | <0.001 |
| − Peptic ulcer | 1 (0.05) | 0 (0) | 1 (0.1) | 0 (0) | 0.51 |
| − AIDS/HIV | 27 (1) | 4 (1) | 9 (1) | 14 (3) | 0.02 |
| − Lymphoma | 52 (3) | 7 (1) | 18 (2) | 27 (5) | <0.001 |
| − Metastatic cancer | 136 (7) | 17 (3) | 39 (5) | 80 (15) | <0.001 |
| − Solid tumor | 128 (7) | 34 (6) | 53 (7) | 41 (7) | 0.66 |
| − Rheumatoid arthritis | 41 (2) | 19 (3) | 10 (1) | 12 (2) | 0.02 |
| − Coagulopathy | 500 (26) | 138 (25) | 123 (15) | 239 (43) | <0.001 |
| − Obesity | 97 (5) | 39 (7) | 36 (4) | 22 (4) | 0.04 |
| − Weight loss | 68 (4) | 14 (3) | 20 (2) | 34 (6) | <0.001 |
| − Fluid and electrolyte disorders | 843 (44) | 158 (29) | 314 (39) | 371 (67) | <0.001 |
| − Blood loss anemia | 36 (2) | 11 (2) | 10 (1) | 15 (3) | 0.13 |
| − Deficiency anemia | 275 (14) | 79 (14) | 105 (13) | 91 (17) | 0.17 |
| − Alcohol abuse | 199 (10) | 24 (4) | 110 (13) | 65 (12) | <0.001 |
| − Drug abuse | 70 (4) | 9 (2) | 45 (6) | 16 (3) | <0.001 |
| − Psychosis | 71 (4) | 10 (2) | 40 (5) | 21 (4) | 0.01 |
| − Depression | 104 (5) | 25 (5) | 53 (7) | 26 (5) | 0.20 |
| Charlson comorbidity score | 4.4 ± 2.7 | 4.9 ± 2.3 | 3.0 ± 2.4 | 5.8 ± 2.7 | <0.001 |
| Vital signs | |||||
| − Temperature (F) | 97.2 ± 2.2 | 96.7 ± 1.9 | 97.7 ± 2.1 | 97.0 ± 2.4 | <0.001 |
| − Heart rate (per minute) | 97 ± 21 | 87 ± 15 | 100 ± 22 | 102 ± 23 | <0.001 |
| − Systolic blood pressure (mmHg) | 117 ± 26 | 116 ± 21 | 126 ± 26 | 105 ± 24 | <0.001 |
| − Diastolic blood pressure (mmHg) | 62 ± 15 | 58 ± 11 | 69 ± 15 | 56 ± 14 | <0.001 |
| − Mean blood pressure (mmHg) | 81 ± 21 | 78 ± 14 | 89 ± 22 | 74 ± 21 | <0.001 |
| − Respiratory rate (per minute) | 17 ± 9 | 12 ± 7 | 18 ± 8 | 22 ± 9 | <0.001 |
| − Oxygen saturation (%) | 97 ± 5 | 98 ± 3 | 97 ± 4 | 95 ± 6 | <0.001 |
| − Glasgow coma score | 8 ± 5 | 5 ± 4 | 9 ± 5 | 10 ± 5 | <0.001 |
| Vasopressor use | 1230 (64) | 446 (80) | 361 (44) | 423 (77) | <0.001 |
| Ventilator use | 1608 (84) | 540 (97) | 640 (79) | 428 (78) | <0.001 |
| Any renal replacement therapies | 54 (3) | 11 (2) | 14 (2) | 29 (5) | <0.001 |
| − Hemodialysis | 35 (2) | 7 (1) | 9 (1) | 19 (3) | 0.003 |
| − CRRT | 22 (1) | 6 (1) | 5 (1) | 11 (2) | 0.06 |
| SAPS II score | 61 ± 20 | 63 ± 14 | 52 ± 18 | 73 ± 20 | <0.001 |
| Acute kidney injury | 1401 (73) | 422 (76) | 494 (61) | 485 (88) | <0.001 |
| Laboratory data | |||||
| − BUN (mg/dL) | 27 ± 21 | 20 ± 11 | 19 ± 11 | 46 ± 27 | <0.001 |
| − eGFR (mL/min/1.73 m2) | 68 ± 31 | 69 ± 23 | 80 ± 29 | 50 ± 32 | <0.001 |
| − Sodium (mEq/L) | 138 ± 5 | 137 ± 4 | 139 ± 5 | 138 ± 6 | <0.001 |
| − Potassium (mEq/L) | 4.4 ± 0.9 | 4.6 ± 0.9 | 4.0 ± 0.7 | 4.6 ± 1.0 | <0.001 |
| − Chloride (mEq/L) | 106 ± 7 | 108 ± 5 | 107 ± 6 | 104 ± 8 | <0.001 |
| − Bicarbonate (mEq/L) | 20 ± 5 | 23 ± 4 | 20 ± 4 | 16 ± 5 | <0.001 |
| − Anion gap (mEq/L) | 18 ± 6 | 14 ± 4 | 17 ± 4 | 22 ± 6 | <0.001 |
| − Total calcium (mg/dL) | 8.2 ± 1.2 | 8.7 ± 1.2 | 8.0 ± 1.1 | 7.9 ± 1.1 | <0.001 |
| − Ionized calcium (mmol/L) | 1.1 ± 0.2 | 1.2 ± 0.2 | 1.1 ± 0.1 | 1.0 ± 0.1 | <0.001 |
| − Phosphate (mg/dL) | 4.1 ± 1.8 | 3.8 ± 1.3 | 3.5 ± 1.4 | 5.3 ± 2.1 | <0.001 |
| − Magnesium (mg/dL) | 1.9 ± 0.5 | 2.1 ± 0.6 | 1.7 ± 0.4 | 2.1 ± 0.5 | <0.001 |
| − Lactate (mmol/L) | 6.2 ± 2.6 | 5.7 ± 1.9 | 5.6 ± 1.7 | 7.7 ± 3.4 | <0.001 |
| − Glucose (mg/dL) | 179 ± 89 | 170 ± 63 | 185 ± 87 | 181 ± 111 | 0.009 |
| − Hemoglobin (g/dL) | 10.6 ± 2.3 | 9.1 ± 1.8 | 11.9 ± 2.1 | 10.1 ± 2.1 | <0.001 |
| − WBC (109 cells/L) | 14.1 ± 8.3 | 12.4 ± 6.4 | 14.4 ± 8.1 | 15.4 ± 10.0 | <0.001 |
| − Platelet (109 cells/L) | 170 ± 103 | 146 ± 68 | 208 ± 103 | 172 ± 120 | <0.001 |
| − pH | 7.31 ± 0.12 | 7.36 ± 0.10 | 7.32 ± 0.10 | 7.26 ± 0.13 | <0.001 |
| − pCO2 (mmHg) | 39 ± 11 | 41 ± 9 | 40 ± 11 | 36 ± 2 | <0.001 |
| − pO2 (mmHg) | 209 ± 133 | 309 ± 117 | 180 ± 118 | 151 ± 113 | <0.001 |
| − PT (second) | 18 ± 6 | 17 ± 4 | 16 ± 4 | 22 ± 9 | <0.001 |
| − INR | 1.8 ± 1.0 | 1.6 ± 0.5 | 1.6 ± 0.6 | 2.5 ± 1.6 | <0.001 |
| − PTT (second) | 49 ± 30 | 54 ± 31 | 40 ± 24 | 56 ± 34 | <0.001 |
| Culture data, n (%) | |||||
| − Positive blood culture | 197 (10) | 7 (1) | 76 (9) | 114 (21) | <0.001 |
| − Positive urine culture | 284 (15) | 32 (6) | 138 (17) | 114 (21) | <0.001 |
| − Positive sputum culture | 205 (11) | 23 (4) | 76 (9) | 106 (19) | <0.001 |
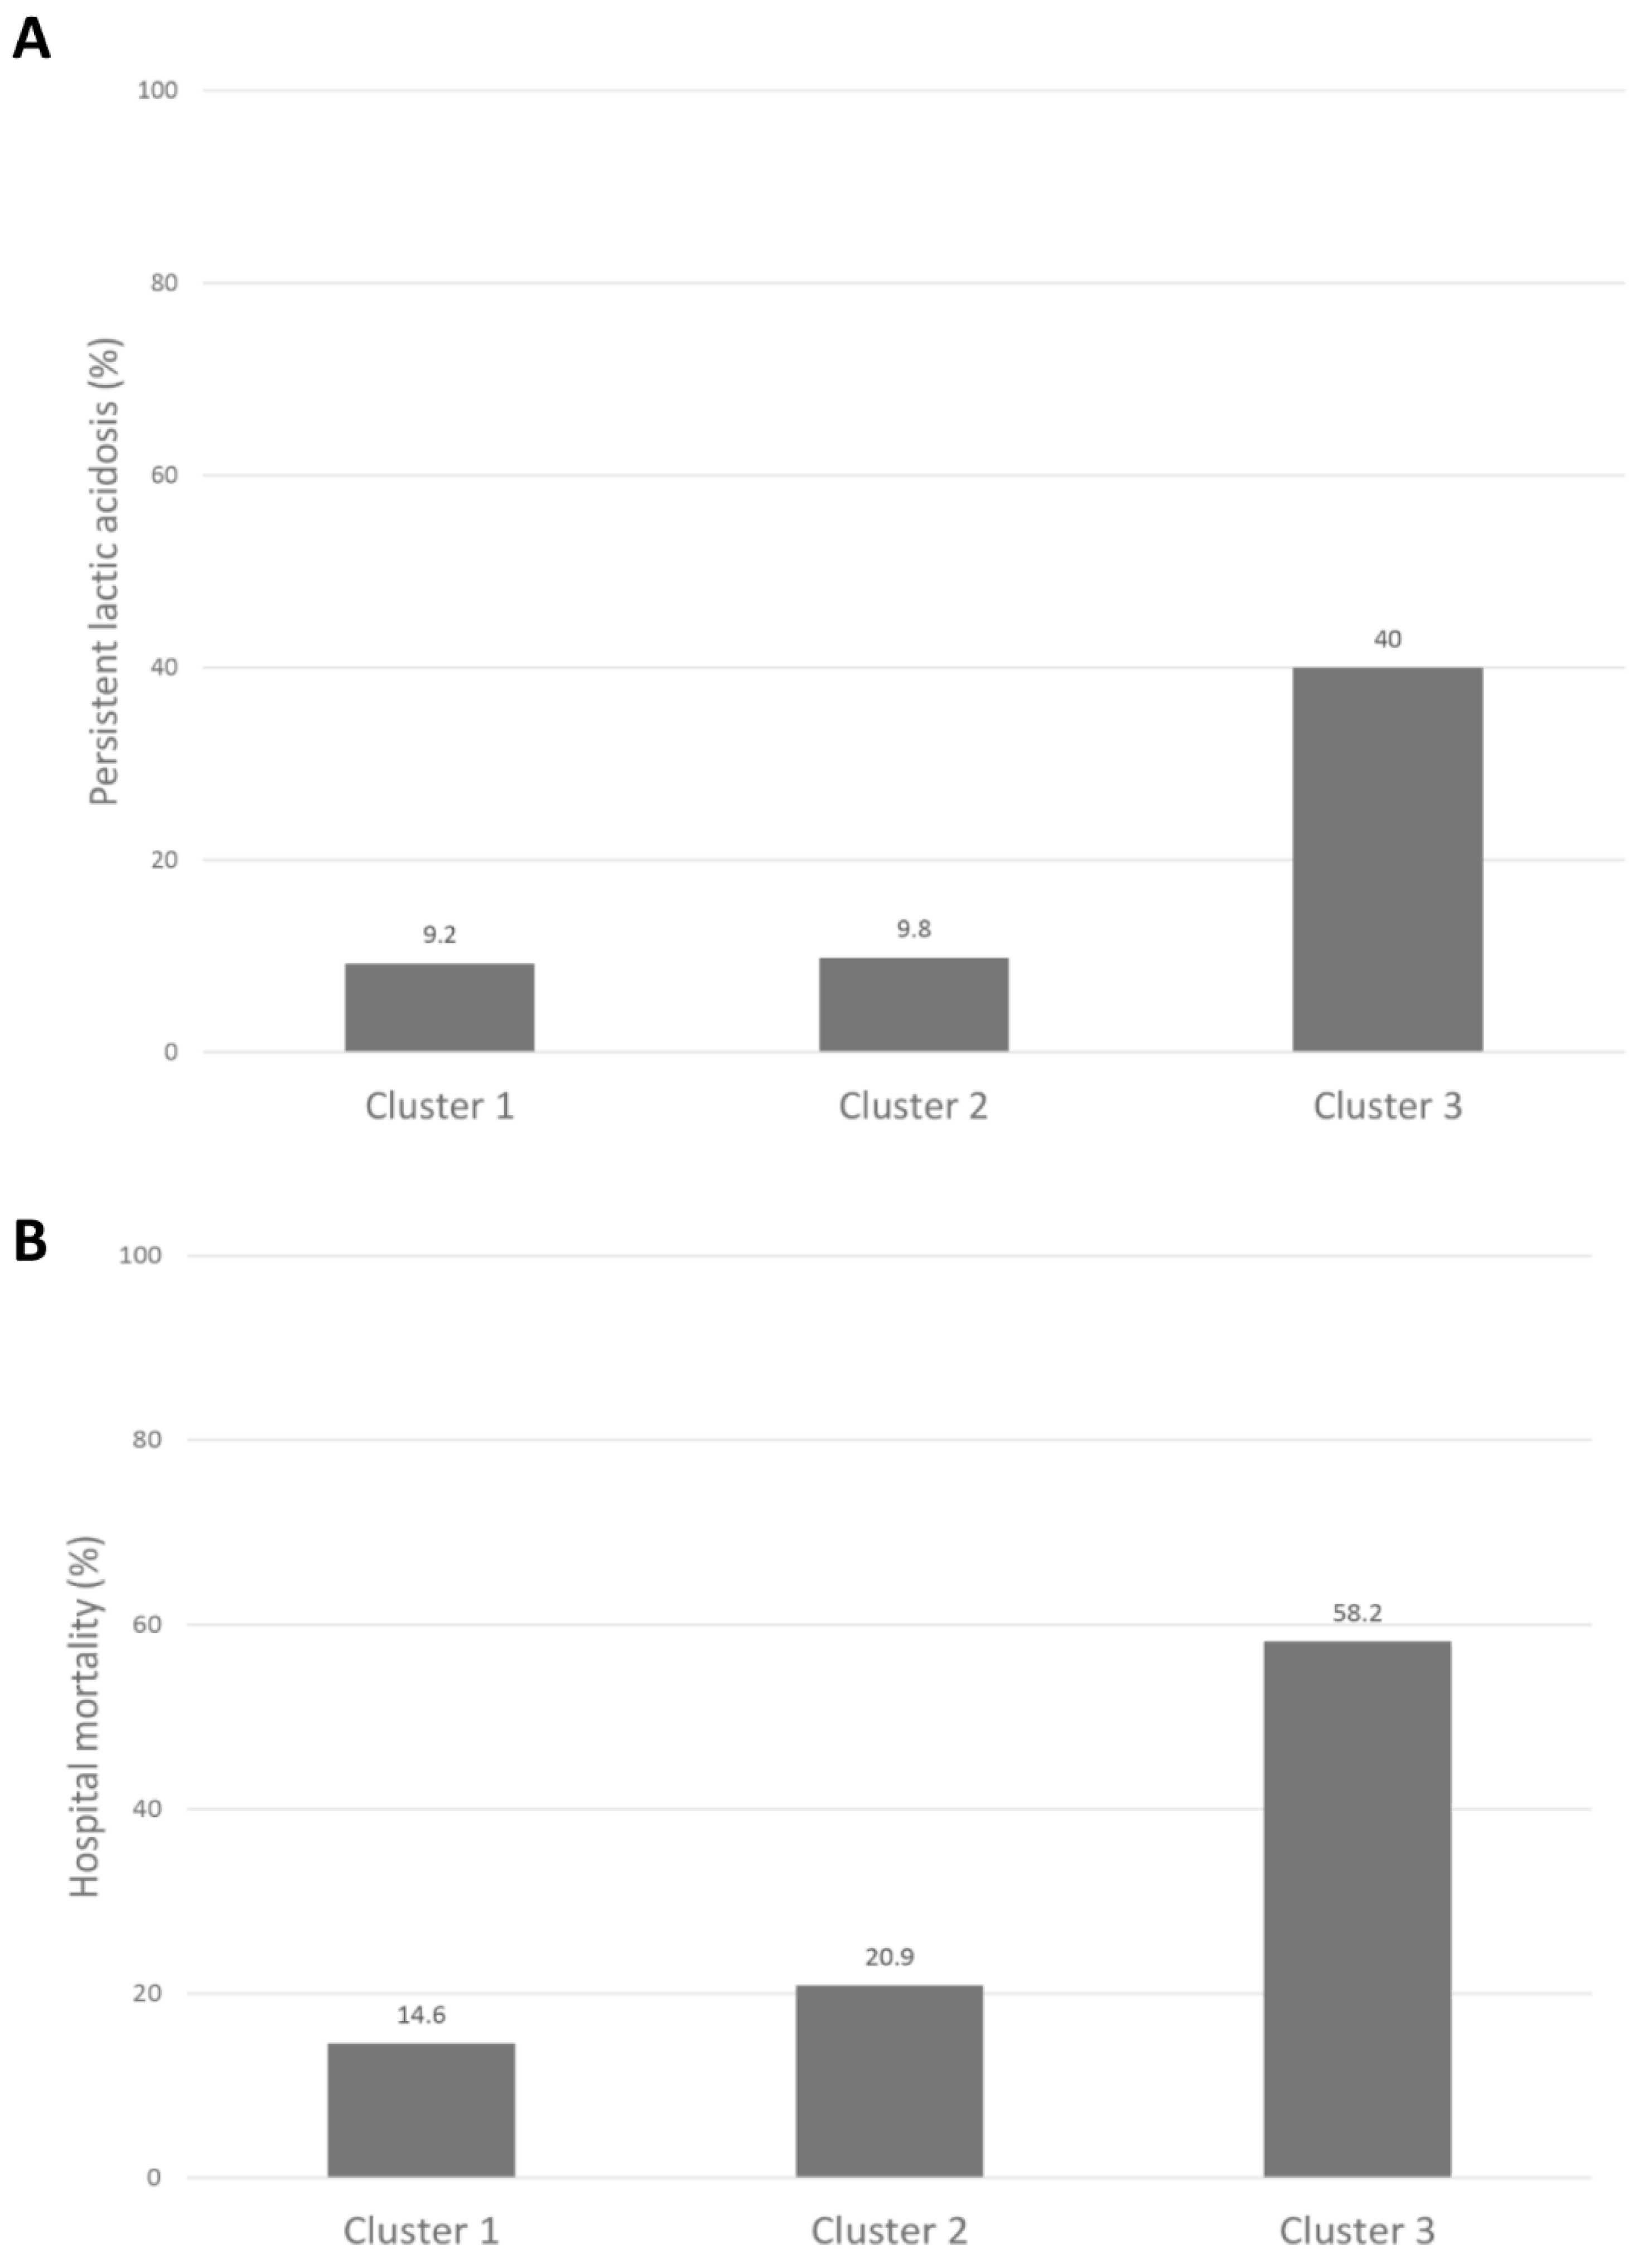
| Cluster | Persistent Lactic Acidosis | Hospital Mortality | 90-Day Mortality | |||
|---|---|---|---|---|---|---|
| % | OR (95% CI) | % | OR (95% CI) | % | HR (95% CI) | |
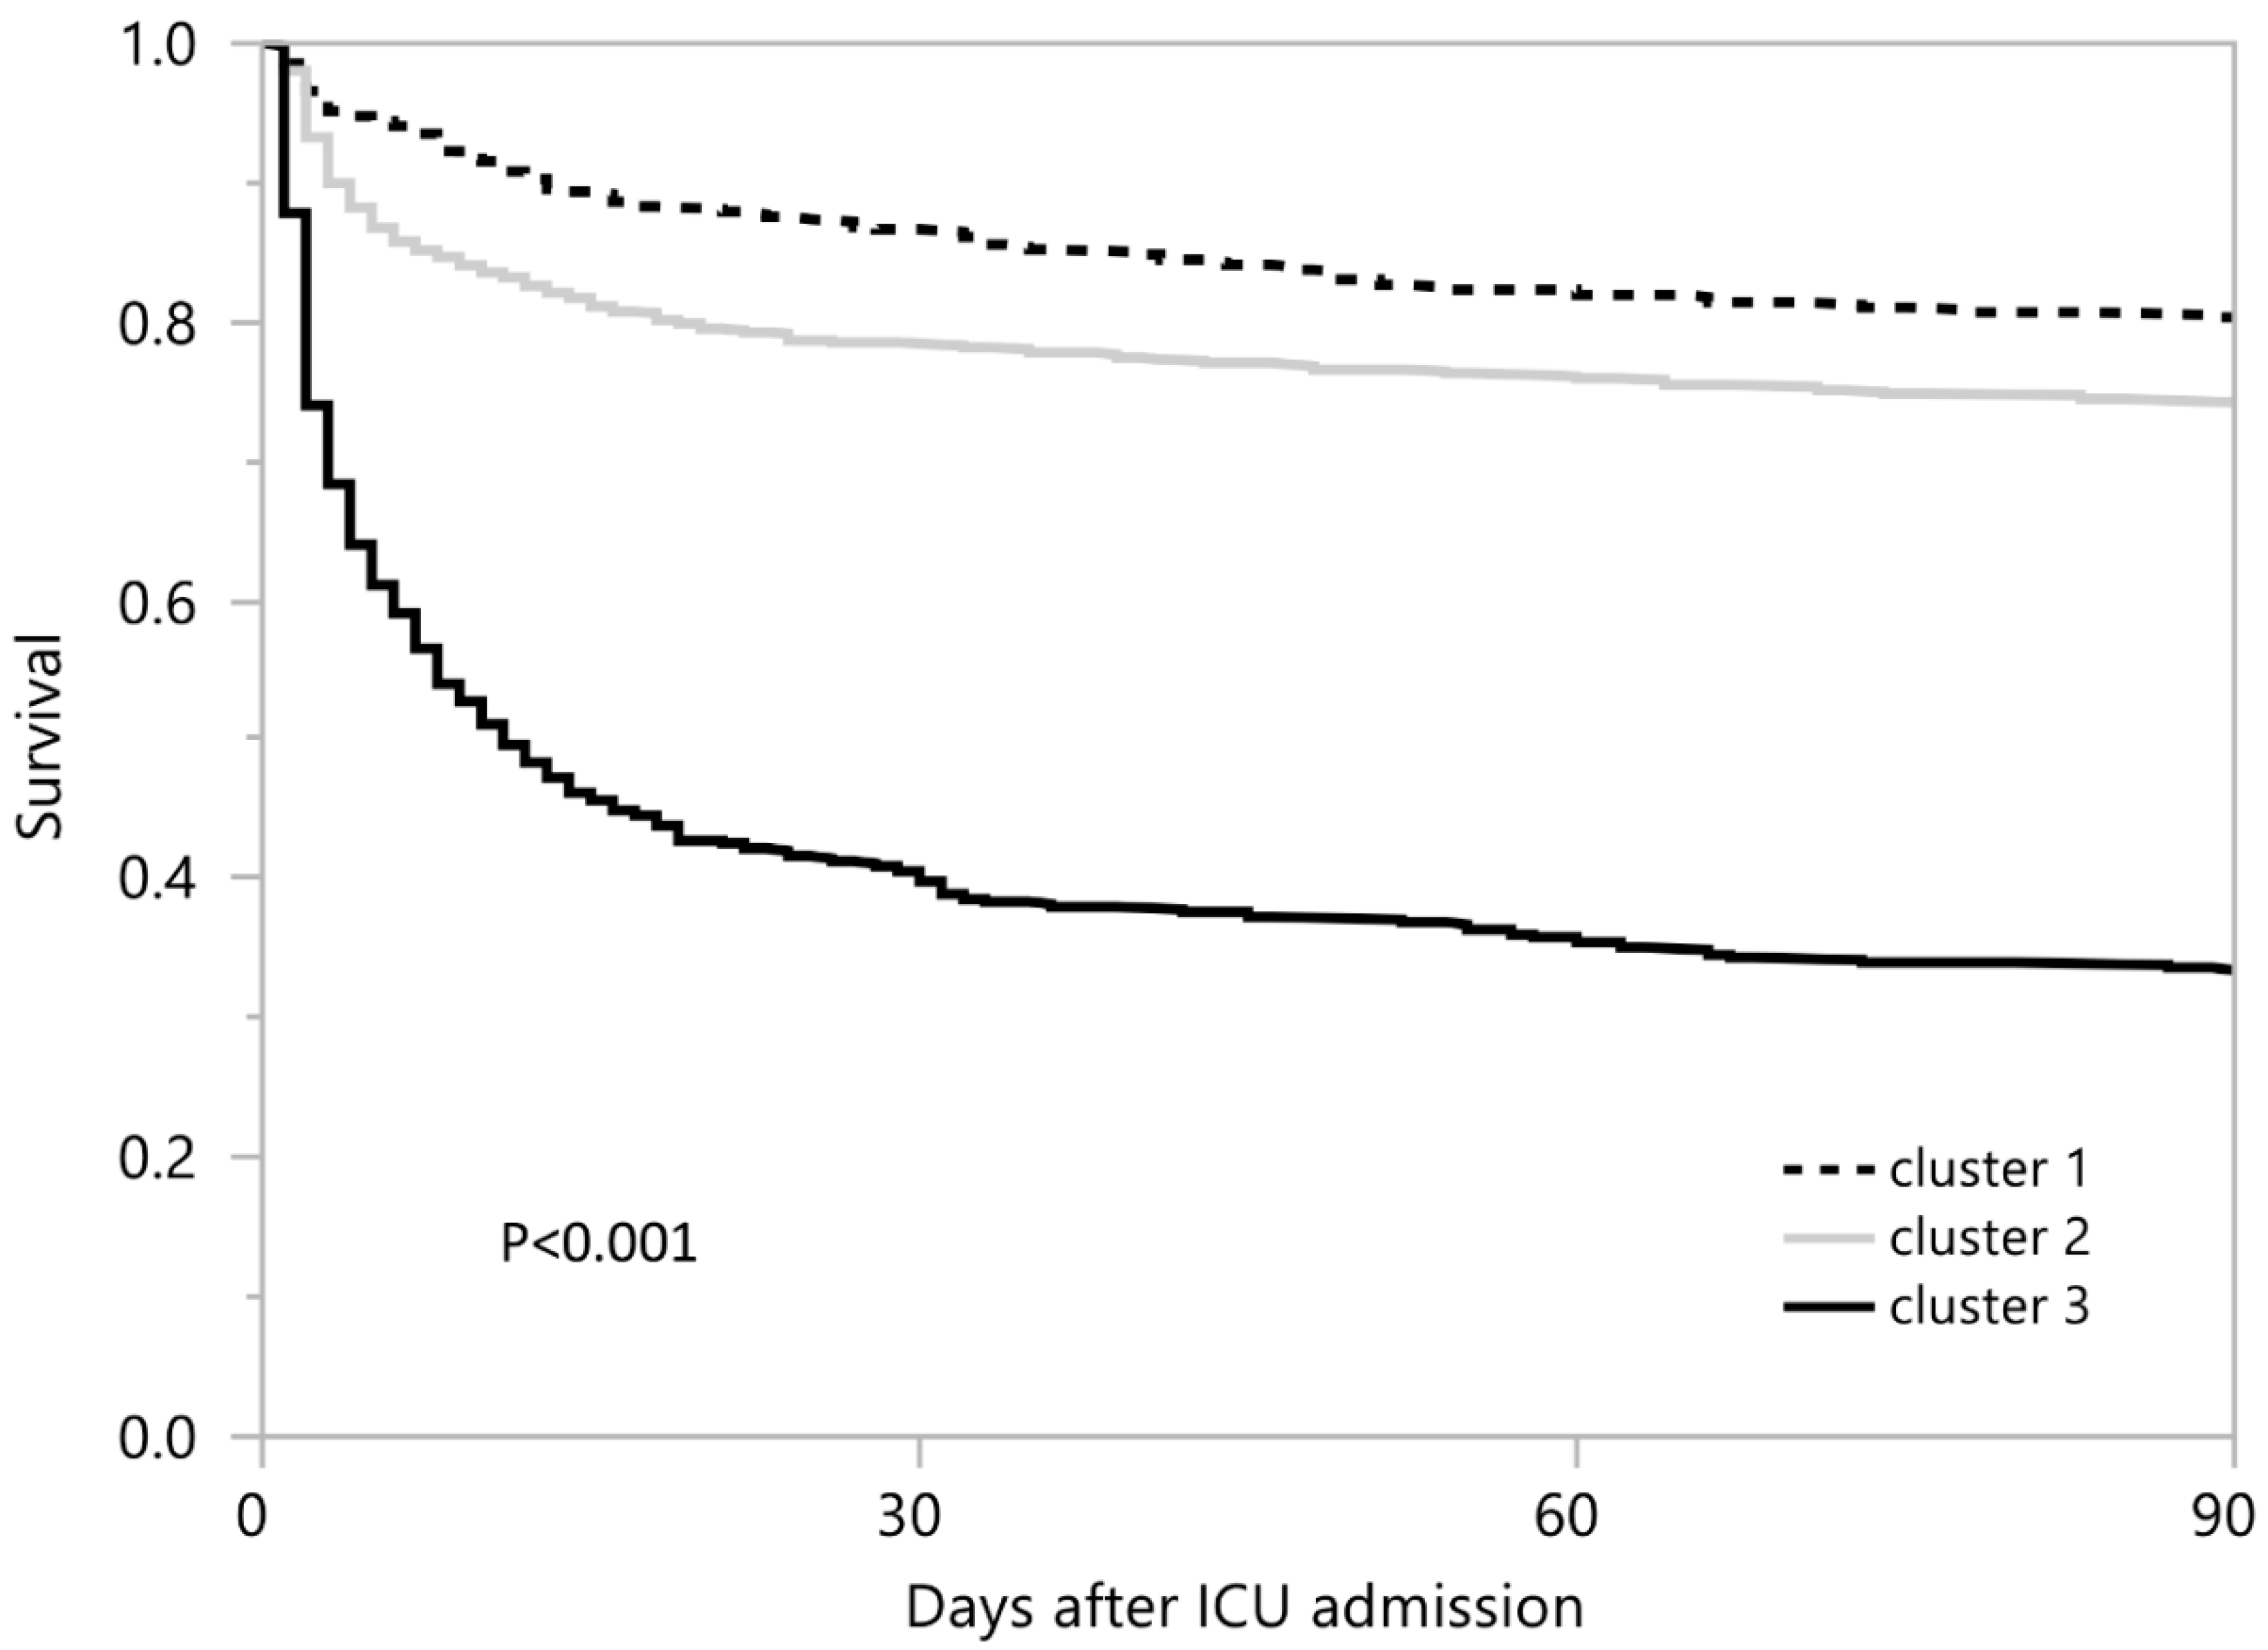
| Cluster 1 | 9.2% | 1 (ref) | 14.6% | 1 (ref) | 19.9% | 1 (ref) |
| Cluster 2 | 9.8% | 1.08 (0.73–1.59) | 20.9% | 1.54 (1.15–2.06) | 25.9% | 1.38 (1.10–1.74) |
| Cluster 3 | 40.0% | 6.59 (4.62–9.39) | 58.2% | 8.12 (6.08–10.86) | 66.6% | 5.06 (4.09–6.27) |
Publisher’s Note: MDPI stays neutral with regard to jurisdictional claims in published maps and institutional affiliations. |
© 2021 by the authors. Licensee MDPI, Basel, Switzerland. This article is an open access article distributed under the terms and conditions of the Creative Commons Attribution (CC BY) license (https://creativecommons.org/licenses/by/4.0/).
Share and Cite
Pattharanitima, P.; Thongprayoon, C.; Petnak, T.; Srivali, N.; Gembillo, G.; Kaewput, W.; Chesdachai, S.; Vallabhajosyula, S.; O’Corragain, O.A.; Mao, M.A.; et al. Machine Learning Consensus Clustering Approach for Patients with Lactic Acidosis in Intensive Care Units. J. Pers. Med. 2021, 11, 1132. https://doi.org/10.3390/jpm11111132
Pattharanitima P, Thongprayoon C, Petnak T, Srivali N, Gembillo G, Kaewput W, Chesdachai S, Vallabhajosyula S, O’Corragain OA, Mao MA, et al. Machine Learning Consensus Clustering Approach for Patients with Lactic Acidosis in Intensive Care Units. Journal of Personalized Medicine. 2021; 11(11):1132. https://doi.org/10.3390/jpm11111132
Chicago/Turabian StylePattharanitima, Pattharawin, Charat Thongprayoon, Tananchai Petnak, Narat Srivali, Guido Gembillo, Wisit Kaewput, Supavit Chesdachai, Saraschandra Vallabhajosyula, Oisin A. O’Corragain, Michael A. Mao, and et al. 2021. "Machine Learning Consensus Clustering Approach for Patients with Lactic Acidosis in Intensive Care Units" Journal of Personalized Medicine 11, no. 11: 1132. https://doi.org/10.3390/jpm11111132