Article

Matching Clinical Diagnosis and Amyloid Biomarkers in Alzheimer’s Disease and Frontotemporal Dementia

1
Department of Neuroscience, Psychology, Drug Research and Child Health, University of Florence (NEUROFARBA), Azienda Ospedaliera-Universitaria Careggi, Largo Brambilla 3, 50134 Florence, Italy
2
IRCCS Fondazione Don Carlo Gnocchi, Via Scandicci 269, 50143 Florence, Italy
3
Faculty of Medicine and Surgery, University of Florence, Largo Brambilla 3, 50134 Florence, Italy
4
Department of Biomedical, Experimental and Clinical Sciences “Mario Serio”, University of Florence, Via Giovanni Battista Morgagni 50, 50134 Florence, Italy
5
Nuclear Medicine Unit, Azienda Ospedaliero-Universitaria Careggi, Largo Piero Palagi 1, 50139 Florence, Italy
*
Author to whom correspondence should be addressed.
J. Pers. Med. 2021, 11(1), 47; https://doi.org/10.3390/jpm11010047
Submission received: 1 December 2020 / Revised: 8 January 2021 / Accepted: 9 January 2021 / Published: 14 January 2021
(This article belongs to the Section Methodology, Drug and Device Discovery)

Abstract

:
Background: The aims of this study were to compare the diagnostic accuracy, sensitivity, specificity, and positive and negative predictive values (PPV, NPV) of different cerebrospinal fluid (CSF) amyloid biomarkers and amyloid-Positron Emission Tomography (PET) in patients with a clinical diagnosis of Alzheimer’s disease (AD) and Frontotemporal Dementia (FTD); to compare concordance between biomarkers; and to provide an indication of their use and interpretation. Methods: We included 148 patients (95 AD and 53 FTD), who underwent clinical evaluation, neuropsychological assessment, and at least one amyloid biomarker (CSF analysis or amyloid-PET). Thirty-six patients underwent both analyses. One-hundred-thirteen patients underwent Apolipoprotein E (ApoE) genotyping. Results: Amyloid-PET presented higher diagnostic accuracy, sensitivity, and NPV than CSF Aβ1–42 but not Aβ42/40 ratio. Concordance between CSF biomarkers and amyloid-PET was higher in FTD patients compared to AD cases. None of the AD patients presented both negative Aβ biomarkers. Conclusions: CSF Aβ42/40 ratio significantly increased the diagnostic accuracy of CSF biomarkers. On the basis of our current and previous data, we suggest a flowchart to guide the use of biomarkers according to clinical suspicion: due to the high PPV of both amyloid-PET and CSF analysis including Aβ42/40, in cases of concordance between at least one biomarker and clinical diagnosis, performance of the other analysis could be avoided. A combination of both biomarkers should be performed to better characterize unclear cases. If the two amyloid biomarkers are both negative, an underlying AD pathology can most probably be excluded.

Graphical Abstract

1. Introduction

Alzheimer’s disease (AD) is the most prevalent type of dementia and it has an increasing incidence worldwide [1]. AD progression has an impact on the length and quality of a patient’s life and represents a healthcare and economic burden. Therefore, it requires therapies able to stop disease progression [1].
Until 2007, AD diagnosis was based on clinical symptoms and cognitive examination, while a defined diagnosis was possible only by postmortem pathological confirmation [2]. The diagnosis of AD dementia has undergone a major change, from a purely clinical entity [2] toward a clinicobiological classification. In fact, in 2007 and then in 2014, the International Working Group (IWG) for New Research Criteria for the Diagnosis of Alzheimer’s Disease introduced a set of revised and updated criteria. They proposed to anchor the diagnosis of AD on the presence of biomarkers [3] whose practical application might allow earlier intervention in the prodromal stages of the disease and also facilitate diagnosis in doubtful cases.
The major biochemical biomarkers of AD pathology include: cerebrospinal fluid (CSF) 42 amino acid isoform of amyloid β (Aβ1–42) [4] and amyloid β 42/40 ratio (Aβ42/40) [5], which mirror the deposition of Aβ in brain tissue, and CSF total tau (t-tau) and hyperphosphorylated tau (p-tau), to assess neurofibrillary tangles and neuronal loss in the brain [6,7,8]. Amyloid-β pathology can also be detected in vivo by positron emission tomography (PET) using amyloid-β radiotracers such as [11C]Pittsburgh compound-B (PIB), [18F]Florbetapir, [18F]Florbetaben, or [18F]Flutemetamol, which allows one to directly visualize fibrillary amyloid-β deposits in brain tissue [9,10,11,12].
After the introduction of IWG criteria [3], biomarkers became the cornerstone of this new clinical-biological classification of AD, since they strongly improved the diagnostic accuracy, sensitivity, and specificity of previous clinical criteria. However, despite the high concordance with histopathology [8,9], there are some caveats in the validation of the use of biomarkers. PET and CSF have been included as equal alternatives to diagnostic criteria for both research [3,13,14] and clinical practice [15,16,17], although they measure amyloid in different pools (CSF and cortical brain tissue). However, several studies have shown that in 10–20% of patients, these modalities yield discordant results [18,19,20]. This discordance between amyloid biomarkers represents a challenging topic to explore.
The positivity of amyloid burden biomarkers has been found in other neurodegenerative diseases such as Frontotemporal Dementia (FTD). In fact, in rare cases, FTD patients might present a co-existing AD pathology [21]. Some cases of non-fluent and semantic variants of Primary Progressive Aphasia (nfv-PPA and sv-PPA) could be correlated to AD [22,23].
In an effort to improve the reliability of an AD diagnosis, it is important to distinguish between AD and other types of dementia that are not characterized by amyloid pathology, since the cognitive symptoms are often diffuse and overlap with other disorders [24,25].
In this study, we focused on a group of patients selected from a clinical setting cohort in order to provide an indication on the use of CSF biomarkers and amyloid-PET. In particular, the aims of this study were: (1) to compare the diagnostic accuracy, sensitivity, specificity, and positive and negative predictive values of different amyloid biomarkers in distinguishing between patients with clinical diagnosis of AD or FTD; (2) to compare the concordance between amyloid-PET and CSF biomarkers; and (3) to provide a flowchart to better clarify the use and interpretation of Aβ biomarkers according to clinical suspicion.

2. Materials and Methods

2.1. Patients

We included 148 patients who were referred to the Centre for Alzheimer’s Disease and Adult Cognitive Disorders of Careggi Hospital in Florence between January 2010 and March 2020 for evaluation of cognitive decline. All patients underwent a comprehensive family and clinical history, neurological examination, extensive neuropsychological investigation, estimation of premorbid intelligence, and assessment of depression. A positive family history was defined as one or more first-degree relatives with documented cognitive decline. All patients underwent measurement of at least one biomarker of amyloid burden: CSF biomarker analysis or amyloid-PET brain scan.
We included patients who met the following inclusion criteria: (1) patients who received a clinical diagnosis of AD according to the NIA-AA criteria, including the atypical variant [16], and (2) patients who received a clinical diagnosis of FTD according to the Neary criteria, including the behavioral variant (bv-FTD), non-fluent variant, and semantic variants of primary progressive aphasia (nfv-PPA and sv-PPA) [26].
Therefore, we finally included 95 AD and 53 FTD patients. Thirty-six patients (23 AD and 13 FTD) underwent both CSF biomarker analysis and amyloid-PET brain scan. Aβ pathology was defined as positive (Aβ+) if at least one of the amyloid biomarkers (CSF or amyloid PET) revealed the presence of Aβ pathology, or negative (Aβ-) if none of the biomarkers revealed the presence of Aβ pathology. We further classified patients as CSFAβ+ if they had at least one of Aβ1–42 or Aβ42/40 ratio positive, or CSF Aβ- if none of the CSF biomarkers revealed the presence of Aβ pathology.
One-hundred-thirteen subjects (72 AD and 41 FTD) underwent Apolipoprotein E (ApoE) genotyping: ApoE genotype was coded as ApoE ε4- (no ApoE ε4 alleles) and ApoE ε4+ (presence of one or two ApoE ε4 alleles).
Study procedures and data analysis were performed in accordance with the Declaration of Helsinki and with the ethical standards of the Committee on Human Experimentation of our Institute. The study was approved by the local Institutional Review Board (reference 15691oss). All individuals involved in this research agreed to participate and agreed to have details and results of the research about them published.

2.2. Neuropsychological Assessment

All subjects were evaluated by an extensive neuropsychological test battery standardized and described in further detail elsewhere [27]. The test battery consisted of global measurements (Mini-Mental State Examination), tasks exploring verbal and spatial short-term memory (Digit Span; Corsi Tapping Test), verbal long-term memory (Five Words and Paired Words Acquisition; Recall after 10 min; Recall after 24 h; Babcock Short Story Immediate and Delayed Recall), and language (Token Test; Category Fluency Task) [27]. Visuospatial abilities were also evaluated by Rey–Osterrieth Complex Figure copy and visuospatial long-term memory was assessed by means of recall of the Rey–Osterrieth Complex Figure test [28]. Attention/executive function was explored by means of Dual Task [29], the Phonemic Fluency Test [30], and the Trail Making Test [31]. Everyday memory was assessed by means of the Rivermead Behavioral Memory Test (RBMT) [32]. All raw test scores were adjusted for age, education, and gender according to the correction factor reported in validation studies for the Italian population [27,28,29,30,31,32]. Pre-morbid intelligence was estimated by the TIB (Test di Intelligenza Breve) [33], an Italian version of the National Adult Reading Test [34]. The presence and severity of depressive symptoms were evaluated by means of the 22-item Hamilton Depression Rating Scale (HRSD) [35].

2.3. PET Imaging Acquisition and Analysis

Fifty-eight patients (39 AD and 19 FTD) underwent amyloid-PET. Amyloid-PET imaging was performed according to standard national and international guidelines [36], with any of the available 18F-labeled tracers ([18]Florbetaben (FBB)—Bayer-Piramal; [18]Flutemetamol (FMM)—General Electric). Images were rated as either positive or negative according to the criteria defined by the manufacturers.

2.4. CSF Collection and Biomarkers Analysis

The CSF samples were collected by lumbar puncture, then immediately centrifuged and stored at −80 °C until performing the analysis. Two different methods of analysis were used to establish CSF measurements. In 59 patients (39 AD and 20 FTD), Aβ1–42, t-tau, and p-tau were measured with ELISA kits (INNOTEST Abeta 1–42, INNOTEST PHOSPHO P Tau (181), and INNOTEST HTAU AG.). Cut-offs for normal values were: Aβ1–42 > 600 pg/mL; t-tau < 300 pg/mL; and p-tau < 60 pg/mL [37]. For 67 patients (40 AD and 27 FTD), Aβ1–42, Aβ42/40 ratio, t-tau, and p-tau were measured using a chemiluminescent enzyme immunoassay (CLEIA) analyzer LUMIPULSE G600 (Lumipulse Beta Amyloid1–40, Lumipulse Beta Amyloid1–42, Lumipulse GTotal Tau, and Lumipulse GPhospho Tau (181)). Cut-offs for normal values were: for Aβ1–42 > 670 pg/mL; Aβ42/40 ratio > 0.062; t-tau < 400 pg/mL; and p-tau < 60 pg/mL [38]. Reagent kits were obtained from Fujirebio.

2.5. Apolipoprotein E ε4 Genotyping, FAD and FTD Genes Mutation Analysis

A standard automated method (QIAcube, QIAGEN) was used to isolate DNA from peripheral blood samples. ApoE genotypes were investigated by high-resolution melting analysis (HRMA) [39]. Two sets of PCR primers were designed to amplify the regions encompassing rs7412 [NC_000019.9:g.45412079C>T] and rs429358 (NC_000019.9:g.45411941T>C). The samples with known ApoE genotypes, which had been validated by DNA sequencing, were used as standard references.
All the coding exons and the intron/exon boundaries of the familial AD genes (APP, PSEN1, and PSEN2) and frontotemporal dementia genes (GRN and MAPT) were amplified by polymerase chain reaction (PCR) using primers designed with Primer3 software (http://bioinfo.ut.ee/primer3-0.4.0/primer3/) [40]. The analysis was performed using high-resolution melting analysis (HRMA) followed by direct sequencing of amplicons showing heteroduplex (310 ABI PRISM Genetic Analyzer; Applied Biosystems, Foster City, USA). C9orf72 repeat expansion was searched using the repeat-primed PCR and automatic sequencing (3700 ABI PRISM Genetic Analyzer; Applied Biosystem, Foster City, USA); the characteristic stutter amplification pattern was considered as an indication of pathogenic repeat expansion (>22 repeats).

2.6. Statistical Analysis

Patient groups were characterized using means and standard deviations (SD). We tested for the normality distribution of the data using the Kolmogorov–Smirnov test. Depending on the distribution of our data, we used t-tests or non-parametric Mann–Whitney U tests for between-group comparisons and Pearson’s correlation coefficient or non-parametric Spearman’s ρ (rho) to evaluate correlations between groups’ numeric measures. We used a Chi-square test to compare categorical data and calculated the effect size by Cohen’s d for numeric measures and Cramer’s V for categorical data. All statistical analyses were performed with SPSS software v.25 (SPSS Inc., Chicago, IL, USA) and the computing environment R 4.0.3 (R Foundation for Statistical Computing, Vienna, 2013). The significance level was set at p < 0.05.

2.7. Data Availability

Raw data that support the findings of this study are not presented due to ethical and patient data security reasons but will be shared upon request from any qualified investigator.

3. Results

3.1. Description of the Sample

There were no statistically significant differences between AD and FTD groups with respect to age at onset of symptoms, age at baseline evaluation, disease duration (time from onset of symptoms and baseline evaluation), age at CSF analysis, age at amyloid-PET, family history of dementia, sex, years of education, MMSE, and HDRS. Proportion of ApoE ε4+ was higher in the AD group compared to FTD (χ2 = 7.077 p = 0.008) (Table 1). In two nfv-PPA patients, the p.T272Sfs *10 and p.C149Lfs*10 GRN gene mutation were detected, described elsewhere [41,42]. We did not find any other variations in analyzed genes (PSEN1, PSEN2, APP, MAPT, and C9orf72).

3.2. Aβ Biomarkers Positivity Prevalence

Seventy-seven AD (81.05%) and 12 FTD (22.64%) patients were Aβ+. Aβ+ pathology proportion was higher in AD compared to FTD (χ2 = 48.42 p < 0.001).
Concerning CSF biomarkers, 48 AD (60.75%) and 8 FTD (17.02%) had positive Aβ1–422 = 22.83 p < 0.001); 31 AD (75.60%) and 5 FTD (17.85%) had positive Aβ42/402 = 22.24 p < 0.001). Fifty-one AD (64.55%) and 9 FTD (19.14%) were CSF Aβ+ (χ2 = 24.36 p < 0.001). Aβ1–42 and Aβ42/40 were both positive in 28 AD patients (70.00%) and in 4 FTD patients (14.81%).
Out of 58 patients who underwent amyloid-PET, 35 AD (89.74%) and 4 FTD subjects (21.05%) had positive scans for amyloid deposition (χ2 = 27.37 p < 0.001).
Considering the group of patients who underwent both CFS biomarkers analysis and amyloid-PET, 23 AD (100%) and 4 FTD (30.76%) were Aβ+ (χ2 = 21.23 p < 0.001).

3.3. Concordance between CSF and Amyloid PET

Considering the group of patients who underwent both CFS biomarkers analysis and amyloid-PET, we evaluated the concordance among the two Aβ biomarkers. Concordance was very low in AD patients, while it was significantly higher in the FTD group (39.13%, 95% C.I. 19.18–59.08 vs. 76.92%, 95% C.I. 54.02–99.83) (Table 2). CSF Aβ biomarkers and amyloid-PET were discordant in 17 patients (14 AD and 3 FTD). Of the 14 discordant patients, 13 had positive amyloid-PET but negative CSF Aβ biomarkers (CSF-/PET+). Two out of the three FTD discordant cases were CSF Aβ+ but had negative amyloid-PET (CSF+/PET-). One FTD patient presented both positive CSF Aβ biomarkers and positive amyloid-PET (CSF+/PET+). All FTD patients with at least one positive Aβ biomarker had a diagnosis of sv-PPA.
To assess if the discordance between CSF Aβ biomarkers and amyloid-PET was influenced by demographic features, we divided patients into two groups: patients whose biomarkers were both positive and patients with only one positive biomarker. There were no statistically significant differences between the two groups with respect to demographic features, MMSE, and ApoE ε4 prevalence. We also found no differences when we considered AD and FTD patients separately. Amyloid-PET was performed before CSF analysis in FTD patients (p = 0.034) (Table 1).
As regards the AD CSF-/PET+ patient subgroup, CSF Aβ1–42 was available for 10 cases: from a qualitative point of view, CSF Aβ1–42 levels were lower than 700 pg/mL in 9 cases, only slightly higher than the cut-off values. CSF Aβ42/40 ratio was available for three cases: similarly, two of them had CSF Aβ42/40 ratio values less than 0.7, slightly higher than the cut-off values. Moreover, they underwent CSF analysis more than 3 months before amyloid-PET. On the other hand, the only CSF+/PET- case underwent CSF analysis 2 months before amyloid-PET.

3.4. Concordance between Aβ1–42 and Aβ42/40

Concordance between Aβ1–42 and Aβ42/40 was 89.55% (95% C.I. 82.33–96.88) in the whole cohort, 92.25% (95% I.C. 84.34–100) in AD patients, and 85.19% (95% C.I. 71.75–98.59) in FTD patients (Table 2). In order to assess whether the discordance was influenced by demographic features, we divided patients into two groups: patients with positive Aβ1–42 and negative Aβ42/40, and patients with negative Aβ1–42 and positive Aβ42/40. There were no statistically significant differences between the two groups with respect to demographic features, MMSE, and ApoE ε4 prevalence, and also when we considered AD patients only.
From a qualitative point of view, all three AD discordant patients had positive Aβ42/40 but negative Aβ1–42.

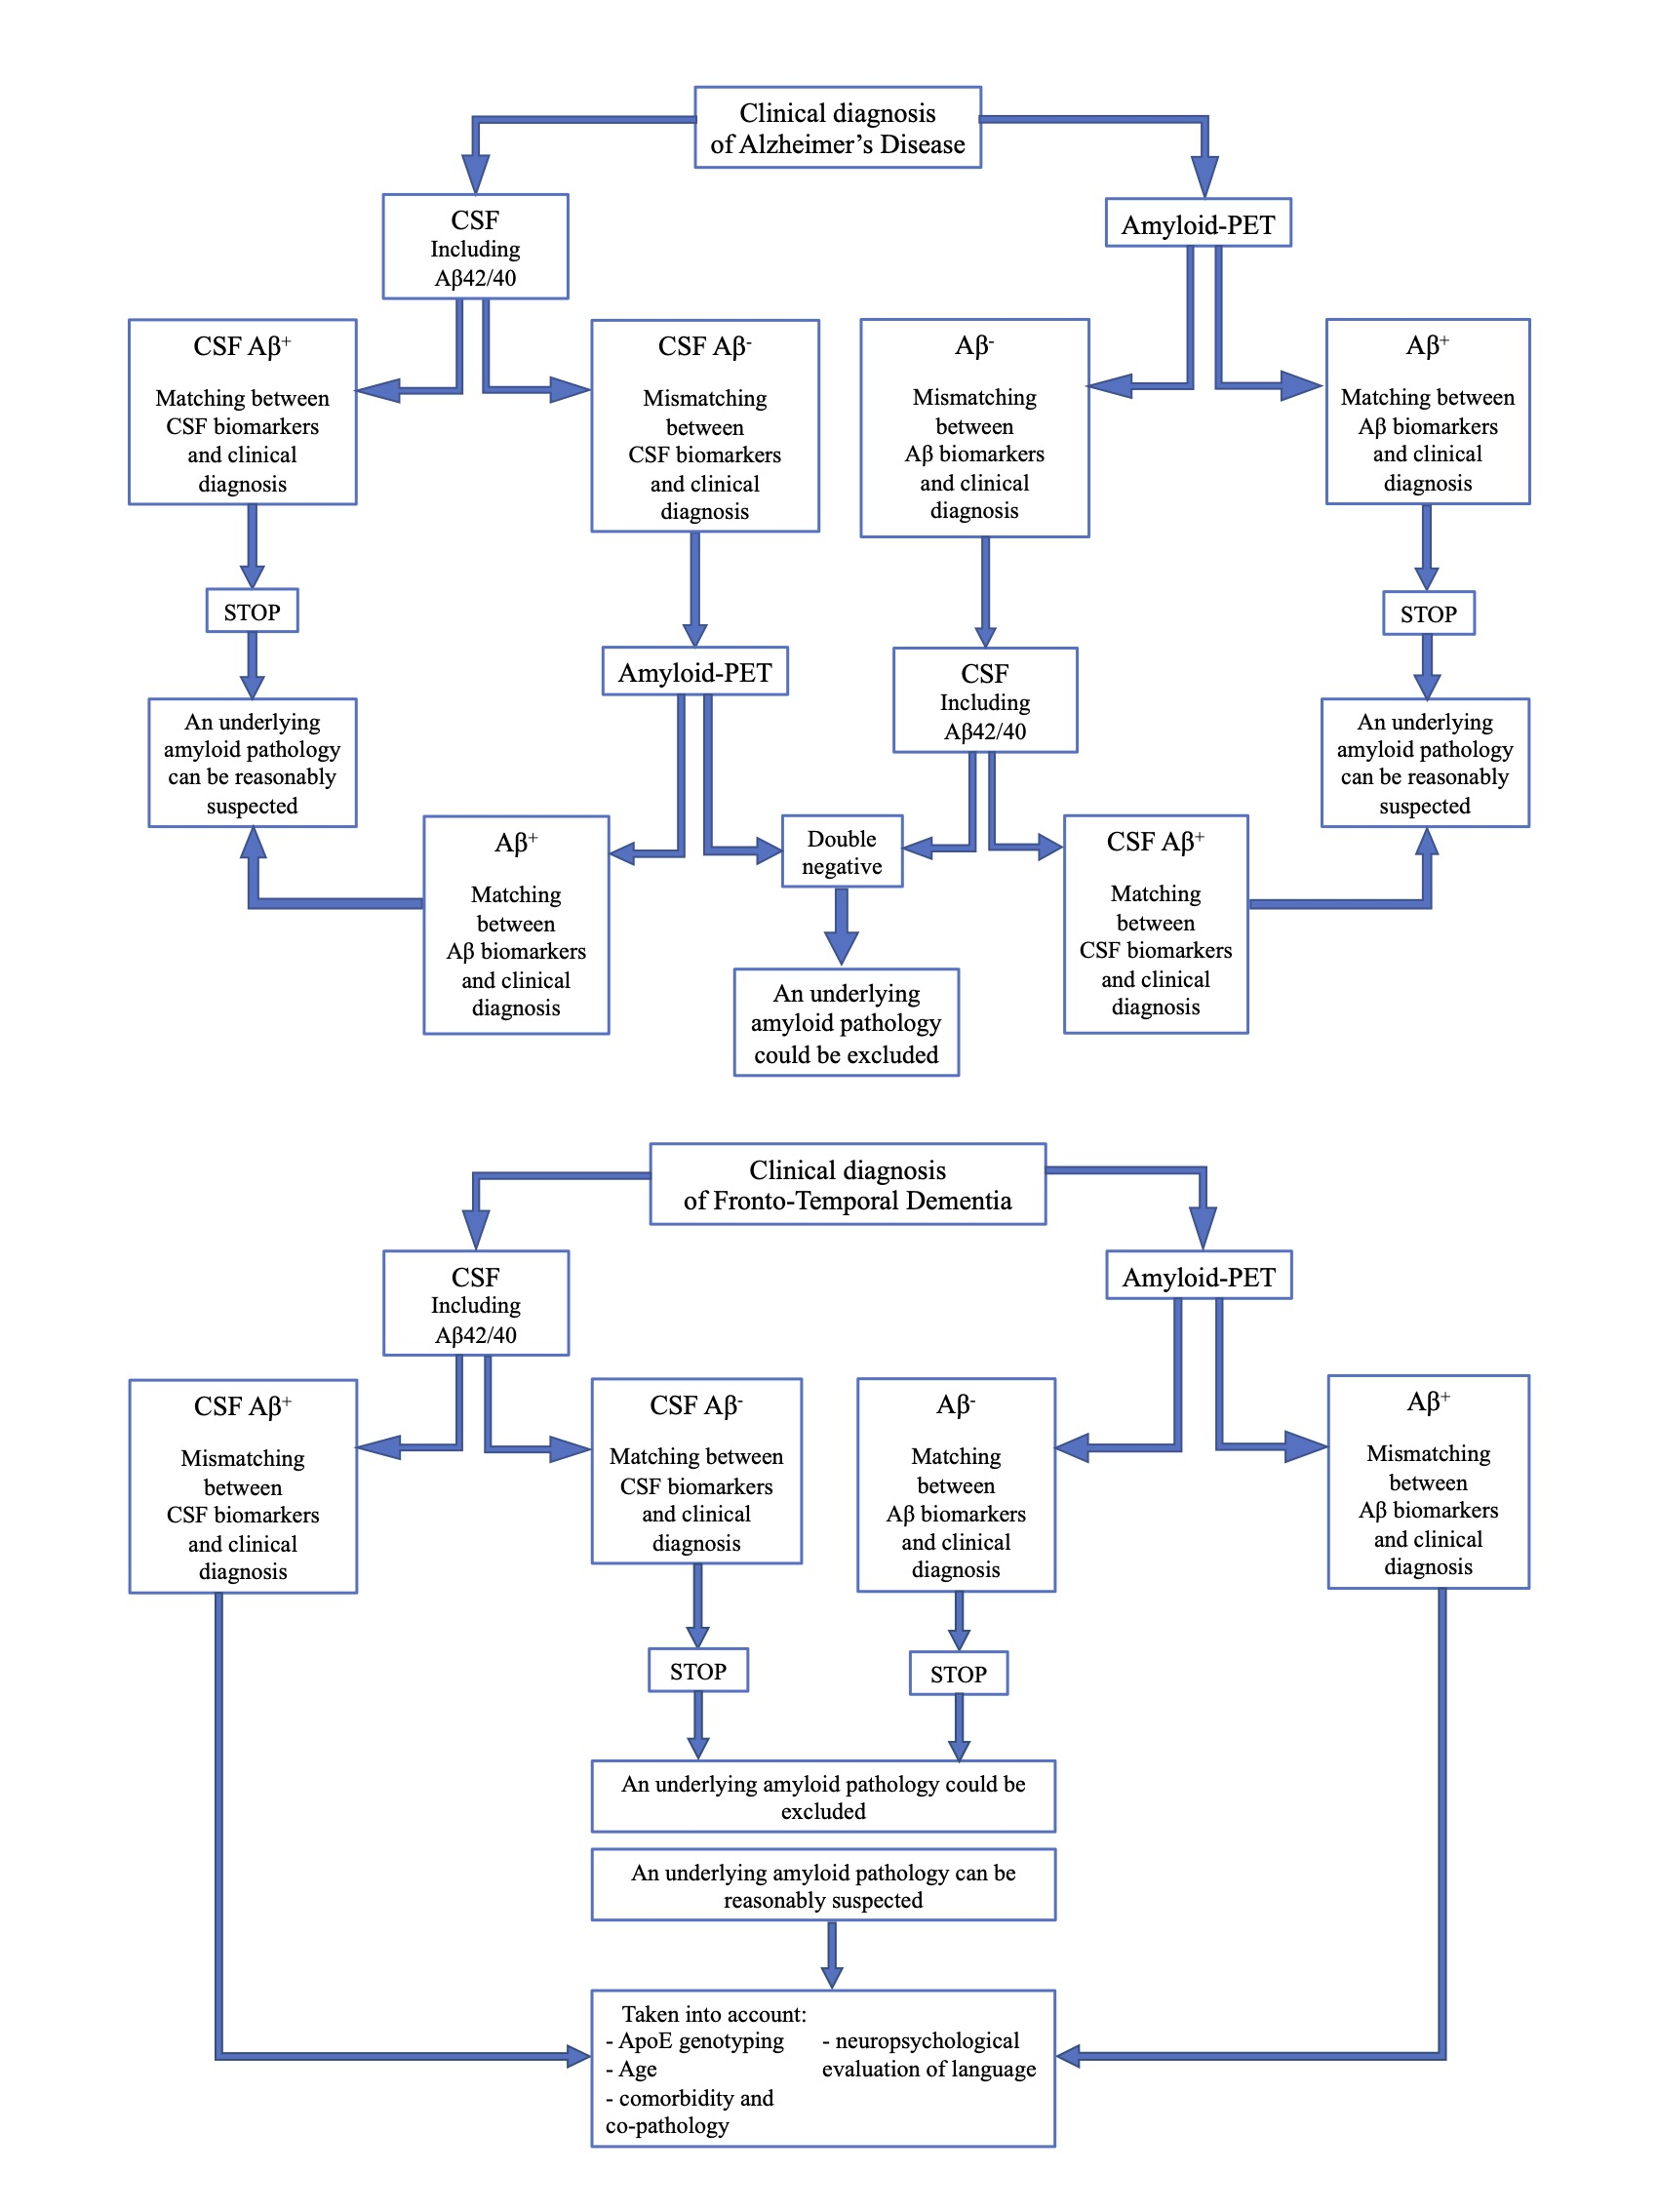
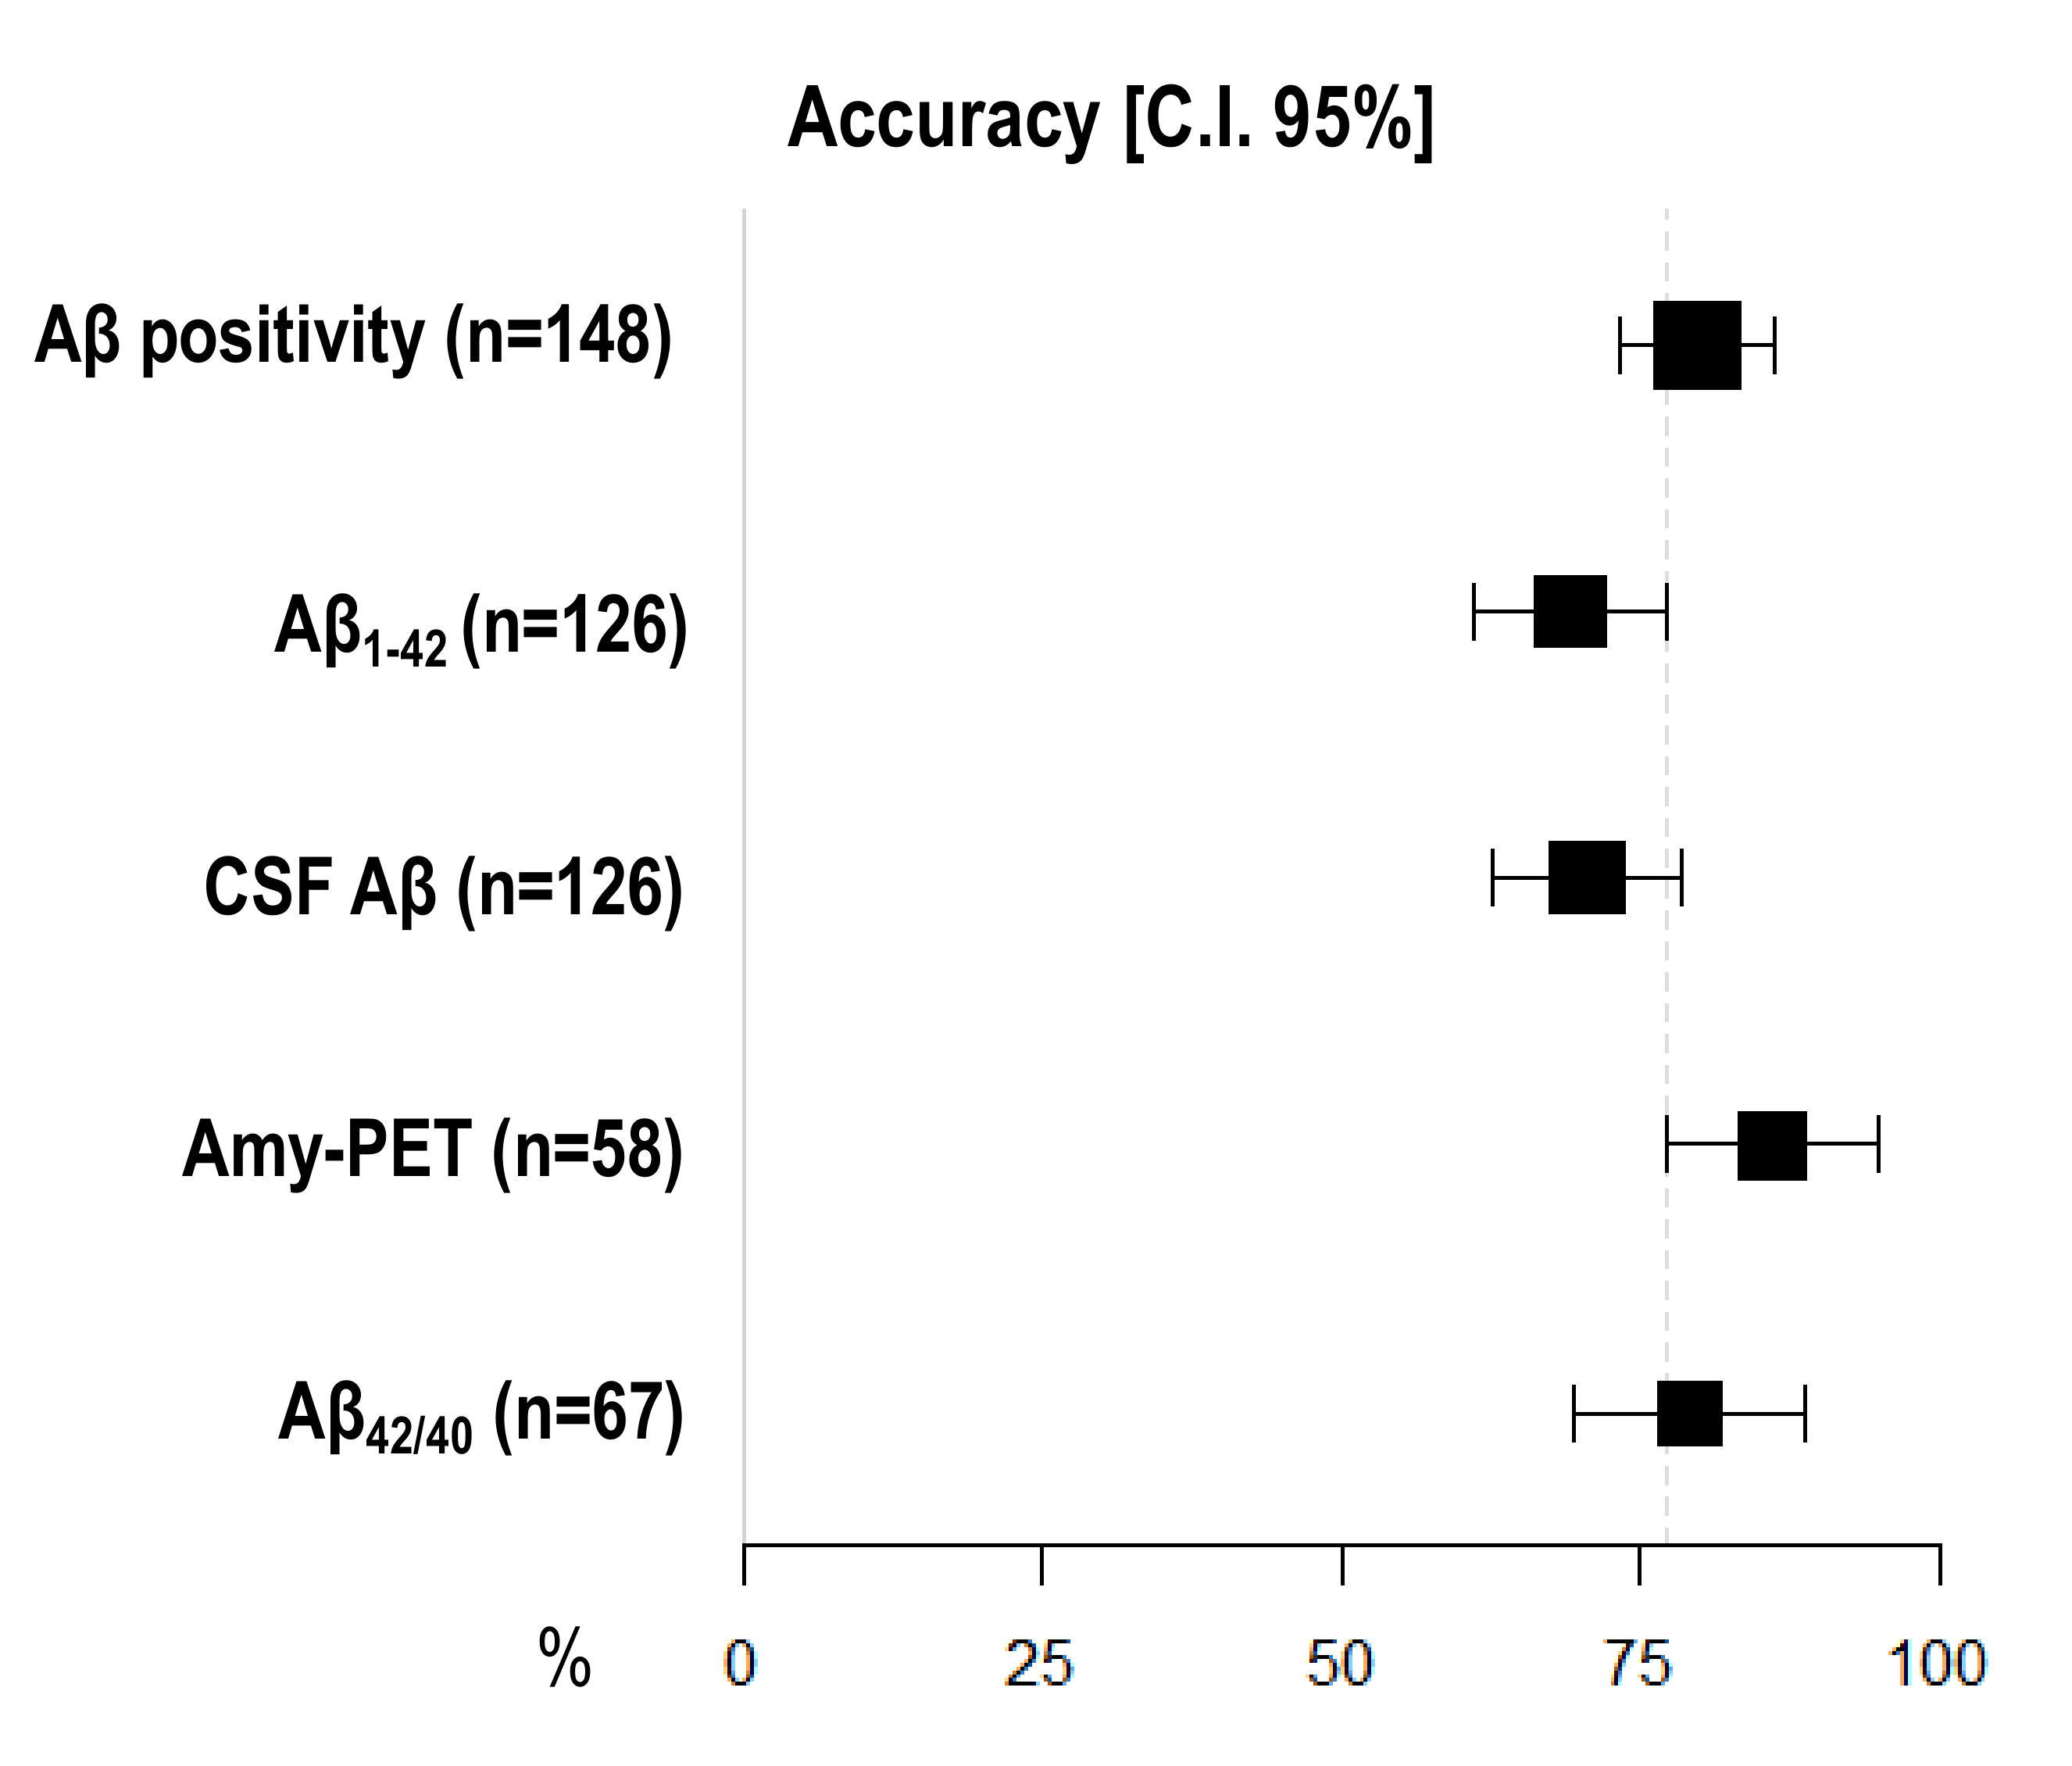
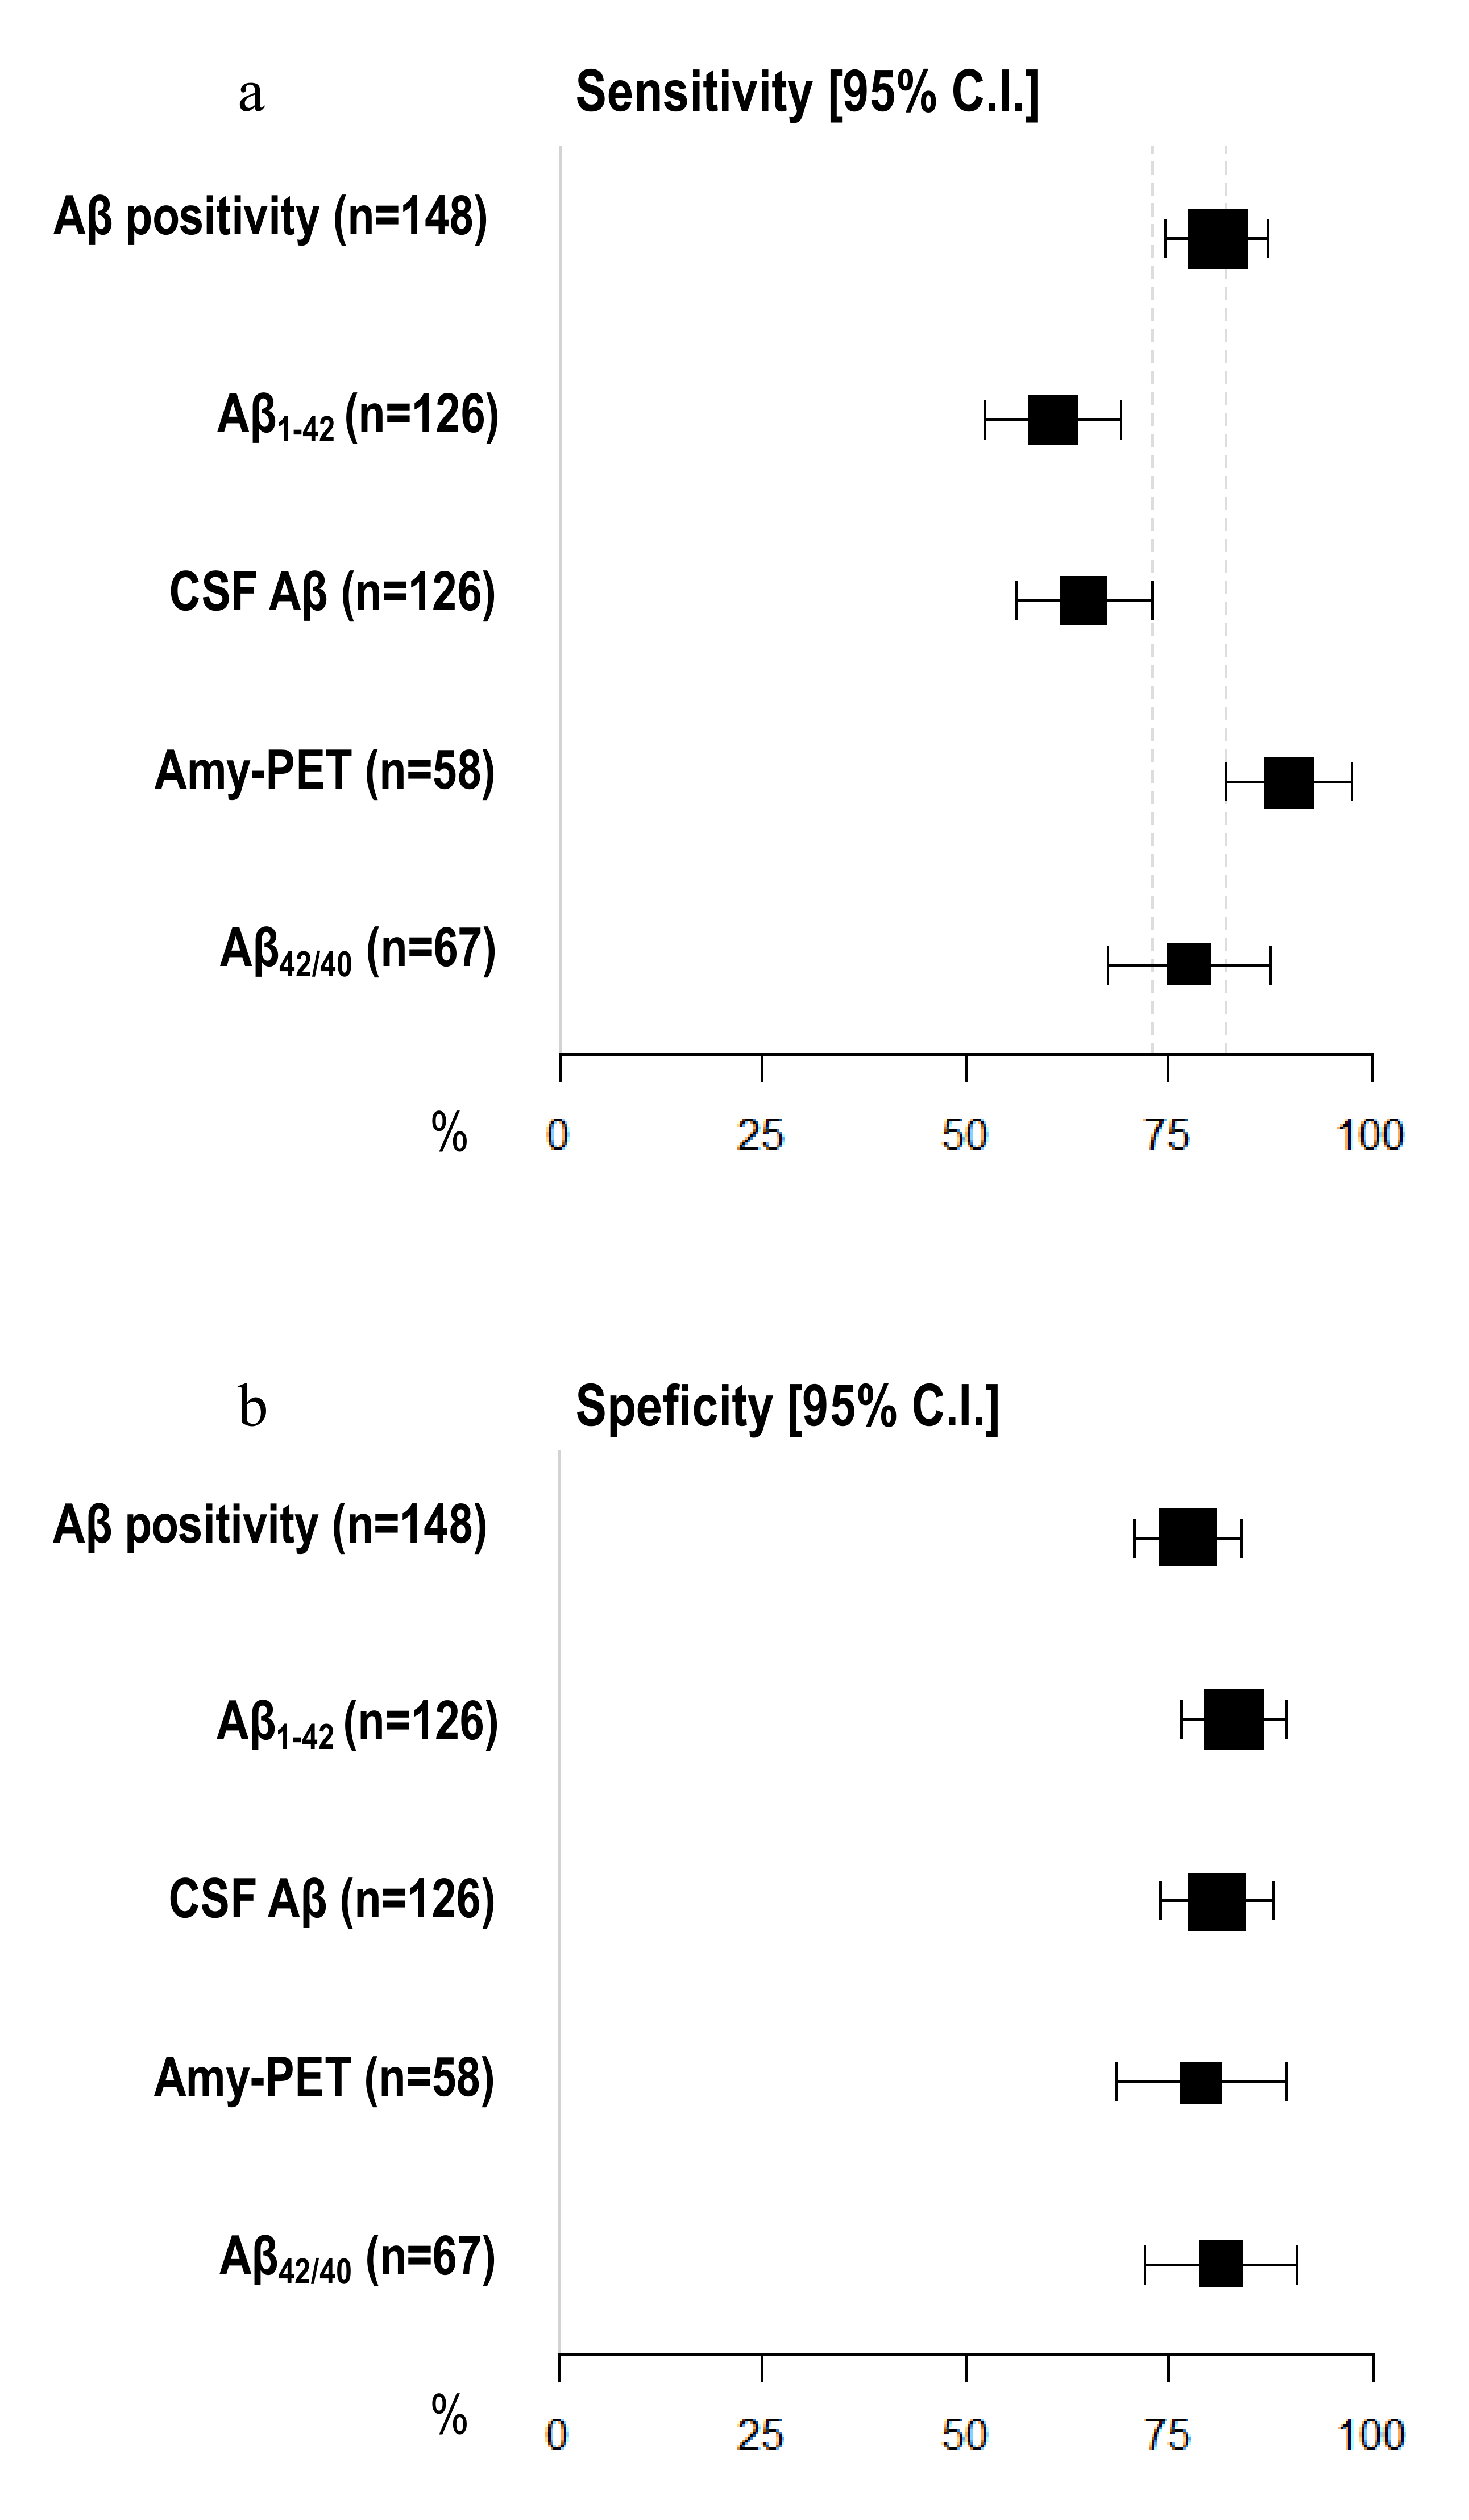
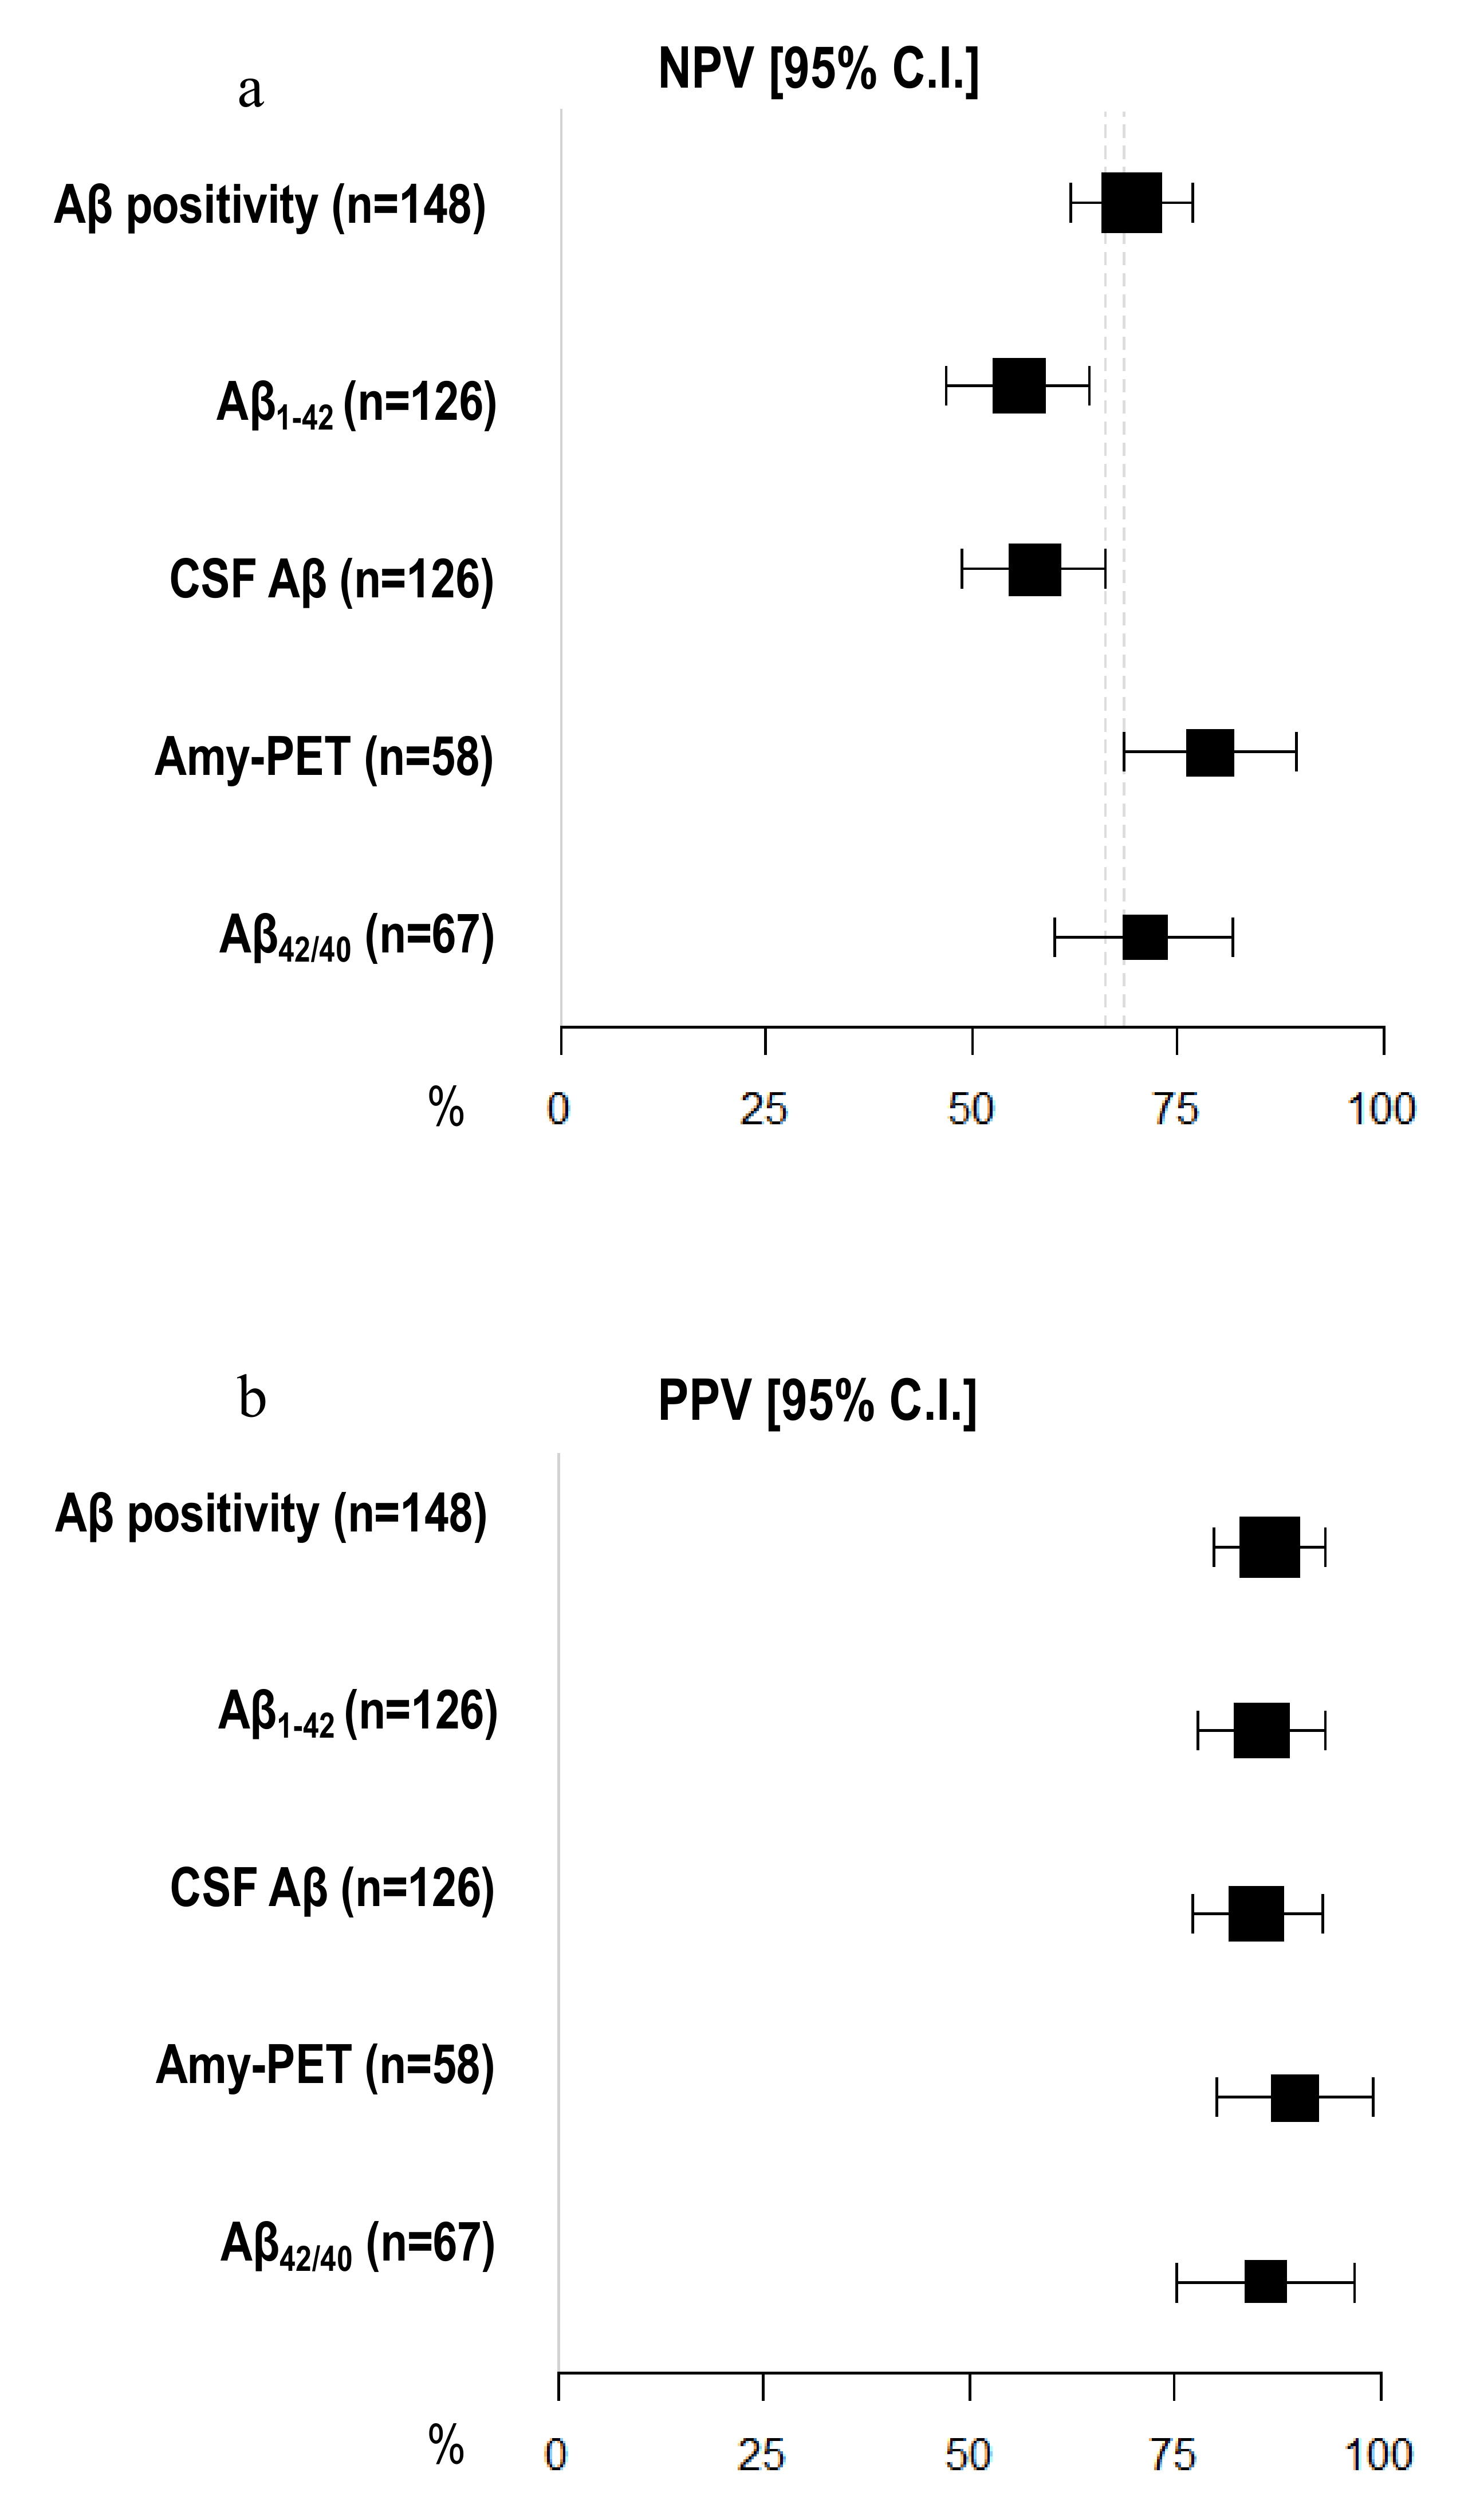
3.5. Diagnostic Accuracy of Amyloid Burden Biomarkers

We evaluated the diagnostic accuracy of single or combined Aβ biomarkers. In the whole cohort, concordance between clinical diagnosis and Aβ pathology was 79.73% (95% C.I. 73.25–86.21). When we considered the subgroup of patients who underwent both CFS biomarkers analysis and amyloid-PET, the concordance was 88.89% (95% C.I. 78.62–99.16).
In order to assess if the discordance between amyloid biomarkers and clinical diagnosis was influenced by demographic features, we divided patients into two groups: the first including Aβ+ AD and Aβ- FTD (concordant cases), the second including Aβ- AD and Aβ+ FTD (discordant cases). There were no statistically significant differences between the two groups with respect to demographic features, MMSE, and ApoE ε4 prevalence. We also found no differences when we considered AD and FTD patients separately for this analysis. Considering Aβ+ FTD patients, we found a trend to significance for the ApoE ε4 allele (p = 0.065), which was more frequent in Aβ+ FTD patients.
Amyloid-PET showed the highest diagnostic accuracy, statistically significantly higher than CSF Aβ1–42 (86.21%, 95% I.C. 77.33–95.08 vs. 69.05, 95% C.I. 60.98–77.12), but not than CSF Aβ42/40 ratio (79.10%, 95% C.I. 69.37–88.84) and CSF Aβ (70.63%, 95% C.I. 62.68–78.59) (Figure 1) (Table 3).
Amyloid-PET sensibility was statistically significantly higher than CSF Aβ biomarkers (89.74%, 95% C.I. 81.94–97.55 vs. 64.56%, 95% C.I. 56.20–72.91) and CSF Aβ1–42 (60.76%, 95% C.I. 52.23–69.29%), but not the Aβ42/40 ratio (77.50%, 95% C.I. 67.50–87.50%). We did not detect any differences in specificity between amyloid-PET and CSF Aβ biomarkers (Figure 2) (Table 2). Moreover, the NPV of amyloid-PET (78.95%, 95% C.I. 68.46–89.44) was statistically significantly higher than the NPVs of CSF Aβ1–42 (55.71%, 95% C.I. 47.04–64.39) and CSF Aβ (57.58%, 95% C.I. 48.95–66.21) (Figure 3) (Table 3).

4. Discussion

One aim of this study was to evaluate the diagnostic accuracy, sensitivity, specificity, and positive and negative predictive values of single or combined Aβ biomarkers. We found that the concordance with clinical diagnosis, sensitivity, and NPV of amyloid-PET were higher than CSF Aβ1–42 but not the CSF Aβ42/40 ratio. In more detail, the sensitivity and specificity of the amyloid-PET scan were 90% and 79%, respectively. Considering the possible overlap of clinical symptoms between AD and other types of dementia [43], amyloid-PET can be used to discriminate the different forms of dementia. Rabinovici et al. reported a sensitivity of 89% and a specificity of 83% of amyloid-PET in differentiating AD and FTD [44]. Previous studies showed similar diagnostic accuracy of CSF Aβ1–42 and florbetapir amyloid-PET [45,46], with a slightly higher diagnostic specificity for PET reported by Mattson et al. [47].
Previous studies have shown that CSF Aβ1–42 alone is relatively poor in distinguishing AD from other neurodegenerative disorders [25] and our results are in line with previous data. Interestingly, our results also showed that the diagnostic accuracy, sensitivity, and NPV of CSF Aβ biomarkers were significantly improved when the Aβ42/40 ratio was analyzed, as reported by several previous works [25,48,49,50]. Moreover, when concordance between CSF Aβ1–42 and Aβ42/40 ratio was evaluated, we found only three AD discordant patients, and all of them had a positive Aβ42/40 ratio but negative Aβ1–42. In fact, CSF Aβ1–42 measurements are influenced by several factors, thus false negatives may be found, leading to misinterpretation of the CSF profile. Aβ40 is the most abundant soluble Aβ peptide and less likely than Aβ1–42 to aggregate; thus, the use of a ratio may account for interindividual physiological differences in amyloid processing [50]. Therefore, recent recommendations suggested that the Aβ42/40 ratio should always be analyzed, irrespective of the results of other AD biomarkers [51]. Our results further support these conclusions.
Another aim of our study was to compare the concordance between the amyloid-PET and CSF Aβ biomarkers in the group of patients who underwent both the analyses. Regarding AD patients, we found a very low concordance (39%), which was different from previous works showing higher levels of concordance: Leuzy et al. reported a concordance around 60% [52], Jung et al. of 85% [53], de Wilde et al. and Reimand et al. of 91% [54,55]. Several alternative mechanisms have been proposed to explain discordance between amyloid-PET and CSF Aβ biomarkers. Previous studies showed that the majority of discordant cases were CSF+/PET−, with the highest proportion of CSF+/PET− profiles observed in cognitively normal individuals [56,57,58]. It was hypothesized that CSF biomarkers are able to detect Aβ accumulation earlier than amyloid-PET [58,59,60]. However, it is not exactly known which biomarker becomes positive first. CSF Aβ1–42 may also be affected by variations in amyloid precursor protein (APP) processing, Aβ production [61,62,63], and non-fibrillar aggregation [64]. Moreover, it could be reduced in other medical conditions where plaques are not present [65,66]. Finally, it could be influenced by analytical artifacts [67]. On the other hand, amyloid-PET may yield false positive results with the increasing age of patients with non-Aβ [68]. False-negative PET scans may reflect reduced sensitivity to the detection of advanced amyloid pathology, possibly caused by distinct conformations of amyloid plaques with atypical forms of Aβ pathology [69], amyloid deposition in reference regions, or severe neurodegeneration [68]. Moreover, despite current research inferring that CSF analysis and amyloid-PET could be interchangeably used in the clinic, it is well known that these two methods gauge somewhat different aspects of AD pathophysiology: CSF Aβ1–42 measures soluble forms of Aβ, and a low concentration suggests that significant parenchymal deposition has occurred, whereas amyloid imaging directly identifies fibrillar Aβ in brain tissue [3,69].
Despite previous works describing a higher prevalence of CSF+/PET- discordant cases compared to CSF-/PET+ [56,57,58], our findings showed a higher prevalence of patients with positive amyloid-PET but with negative CSF Aβ biomarkers. In fact, in our subgroup of AD patients who underwent both biomarkers analyses, only one patient was CSF+/PET-. In this case, CSF analysis was performed 2 months before amyloid-PET. On the other hand, 13 AD patients were CSF-PET+: the majority of these cases underwent CSF analysis more than 3 months before amyloid-PET, so we can hypothesize that this discordance could be explained by this temporal distance. Moreover, most of these patients presented CSF Aβ levels, both of Aβ1–42 and of the Aβ42/40 ratio (when available), slightly higher than cut-off values. These data are in accordance with previous reports, which suggested that amyloid-PET scans could have clinical utility in addition to CSF examination, where results are borderline and diagnostic uncertainty remains [70].
Nevertheless, our results showed that none of the patients with a clinical diagnosis of AD presented both negative Aβ biomarkers, in accordance with previous works showing that no subjects diagnosed with AD during life had a non-AD pathological diagnosis [25].
In our cohort, concordance between CSF Aβ biomarkers and amyloid-PET was higher in FTD patients than in AD patients, since the two biomarkers were both negative in 70% of cases. According to a multicenter European memory clinic study [56], the concordance rate in subjects diagnosed with FTD was 55%, lower than what we reported in our subgroup. However, 30% of our patients presented at least one positive amyloid biomarker. In more detail, two patients with clinical diagnosis of FTD were CSF+/PET-, one patient was CSF-/PET+, and only one FTD patient presented both CSF Aβ+ and positive amyloid-PET (CSF+/PET+). Amyloid positivity could be age-related, and the cognitive impairment might not be due to the amyloid burden shown by biomarkers. In fact, positive Aβ biomarkers in non-AD syndromes do not necessarily mandate a diagnostic change, because Aβ could be considered comorbid to a primary pathology that drives the clinical presentation [54]. A previous work reported that Aβ biomarkers’ positivity had been detected in 20 to 30% of cognitively normal individuals and also that patients with non-AD dementias (such as FTD) could present positive amyloid-PET, especially elderly cases carrying an APOE ε4 allele [68].
Interestingly, we found a trend toward significance for the ApoE ε4 allele in FTD patients with Aβ positivity. It has been proposed that the presence of an ApoE ε4 allele could increase AD co-pathology across neurodegenerative diseases [71].
In the FTD group in which both amyloid biomarker analyses were performed, all Aβ+ cases had a clinical diagnosis of sv-PPA. It is well known that PPA is a group of neurodegenerative diseases with heterogeneous neuropathologic causes. A recent work showed that Aβ positivity was detected in 25% of sv-PPA cases and in 40% of patients with mixed PPA with overlapping linguistic features for sv-PPA and lv-PPA (s/lv-PPA) [42]. A recent meta-analysis on 1251 PPA patients reported that Aβ positivity was found in 16% of sv-PPA [72]. Therefore, positive amyloid biomarkers in our patients with FTD clinical diagnosis could also be linked to the inclusion of patients with sv-PPA.
On the basis of our current and previous data [73], we would like to suggest a flowchart to guide the use and interpretation of amyloid biomarkers according to different clinical diagnoses, in order to reach conclusions in specific clinical situations (Figure 4).
  • In case of a clinical diagnosis of AD [16] (Figure 4a):
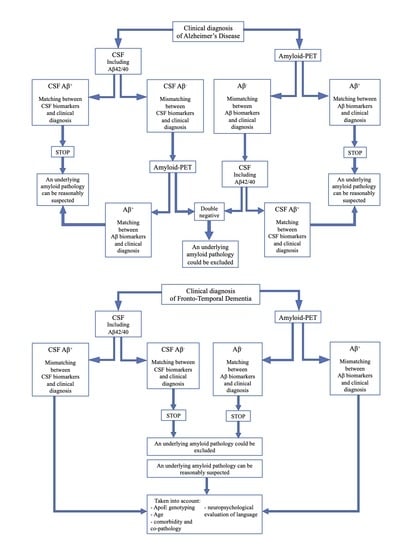
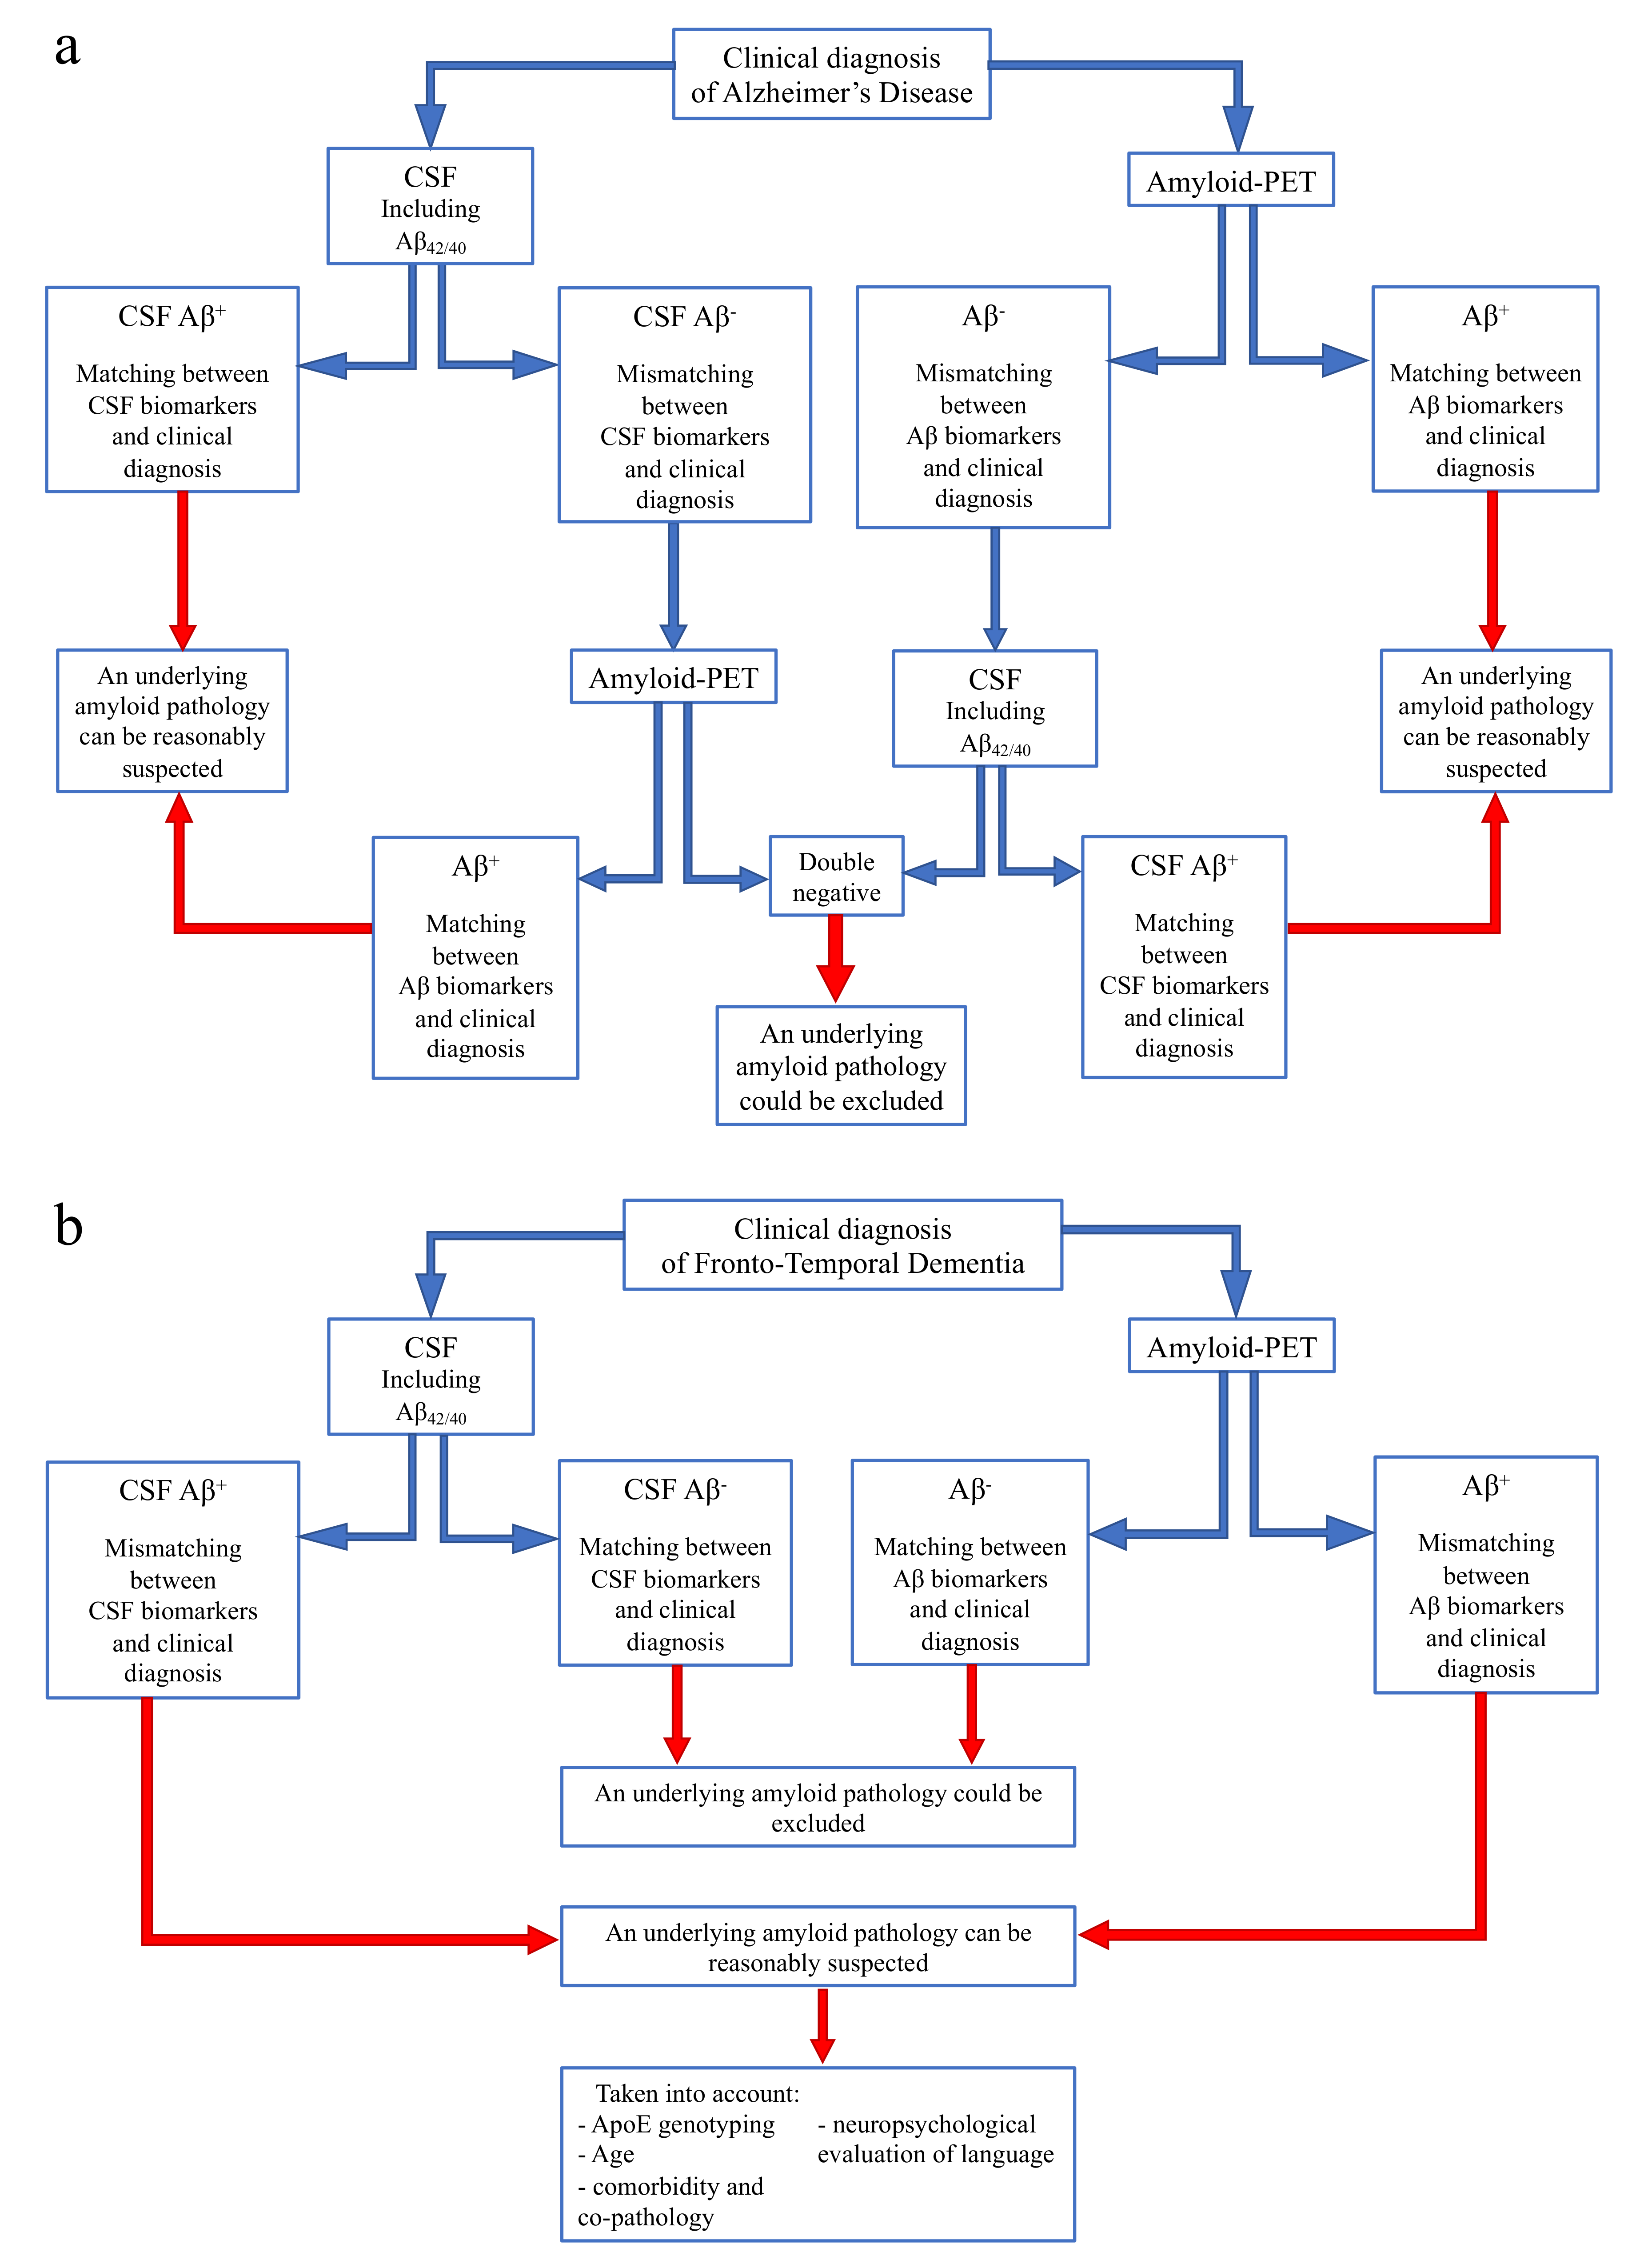
    • If CSF analysis including Aβ42/40 ratio is positive, underlying Aβ pathology can be reasonably suspected and amyloid-PET might be avoided. Similarly, if amyloid-PET detects cortical amyloid deposition, CSF analysis cannot be performed. In conclusion, as also reported in a recent study [73], the matching between clinical diagnosis and a single amyloid biomarker could be sufficient, considering the high PPV of both CSF analysis and amyloid-PET.
    • In case of a mismatch between clinical diagnosis and one amyloid biomarker, we suggest performing the other analysis, due to the low NPV of both CSF and amyloid-PET. In particular:
      If CSF shows Aβ-, amyloid-PET should be performed, also considering previous results highlighting an advantage of amyloid-PET when used as a second biomarker [74].
      If amyloid-PET is negative for cortical deposition, CSF analysis including Aβ42/40 ratio is suggested.
    In conclusion, if both the analyses show Aβ-, an underlying amyloid pathology could most probably be excluded, and a revision of clinical diagnosis should be considered. On the contrary, if the second analysis detects Aβ+, and matching between clinical diagnosis and biomarkers is achieved, amyloid pathology can be reasonably suspected.
  • In case of a clinical diagnosis of FTD [26] (Figure 4b):
    • If CSF analysis or amyloid-PET shows Aβ-, an underlying amyloid pathology could most probably be excluded. Thus, the performance of the other biomarker is not required, due to the high concordance between these two analyses in FTD cases.
    • If CSF or amyloid PET detects Aβ+, some factors should be taken into account, in particular ApoE genotyping, age, and a deep neuropsychological evaluation of language to exclude a diagnosis of PPA. Moreover, the presence of comorbidity and co-pathology should be considered, as also suggested by other recent reports [73].
Several studies have highlighted that biomarkers strongly improved the diagnostic accuracy of clinical diagnostic criteria, and it has been suggested that their combination seems to add accuracy to clinical evaluation [75]. However, their use presents some limitations due to the cost of amyloid-PET and the invasiveness of CSF analysis, especially in primary care settings. In the future, the use of blood biomarkers could be validated, in addition to an accurate clinical and neuropsychological diagnosis, due to their potential low cost and low invasiveness. Current research is focusing on these promising biomarkers, although further work is needed on both clinical and analytical validation of these candidates. These blood biomarkers might be helpful not only in early identification of neurodegeneration but also as a starting point to differentiate AD from FTD.
The main limitation of our study was the lack of autopsy confirmation of Aβ pathology. We only tested the associations between amyloid biomarkers and clinical diagnosis and the concordance between CSF Aβ biomarkers and amyloid-PET, and it is possible that some subjects were clinically misdiagnosed with AD. However, we detected GRN pathogenetic mutations in two cases with nfv-PPA, so we can diagnose these patients with PPA with defined pathology [76]. Secondly, the retrospective design of the study could have led to some bias: not all patients had both biomarkers analyzed as CSF analysis of the Aβ42/40 ratio was not available in all cases. Moreover, the subgroup of patients who underwent both the analyses was relatively small, making it difficult to perform multivariate analysis to correct for possible confounding factors. Furthermore, CSF and amyloid-PET were not performed at the same time. Another limitation was that FTD patients who underwent both amyloid biomarkers had amyloid-PET performed before CSF analysis, so we cannot exclude that differences in the proportion of Aβ positivity between AD and FTD were influenced by the time between the two analyses. Moreover, APOE genotyping was not available for all patients.
However, our study presents some remarkable strengths. First of all, a relatively large number of patients of our cohort underwent at least one amyloid burden biomarker. Another strength of this study is that it was based on a clinical setting cohort; therefore, it provides realistic information on the use and interpretation of amyloid biomarkers. Third, all patients were evaluated by an extensive neuropsychological battery and their clinical diagnosis was well defined.

5. Conclusions

In conclusion, due to the high PPV of both amyloid-PET and CSF analysis including Aβ42/40, in cases of concordance between at least one amyloid biomarker and clinical diagnosis, performance of the other analysis could be avoided; on the other hand, a combination of both amyloid-PET and CSF biomarkers should be performed to better characterize unclear cases of dementia. If the two biomarkers of amyloid burden are both negative, an underlying AD pathology could most probably be excluded.

Author Contributions

Conceptualization, G.G., S.M., S.S., B.N. and V.B. (Valentina Bessi); data curation, G.G., S.M., S.B., M.C., S.P., C.P., V.B. (Valentina Berti), J.B., C.F., G.L., A.I. and V.B. (Valentina Bessi); formal analysis, S.M., S.B., M.C. and V.B. (Valentina Berti); funding acquisition, S.S. and B.N.; investigation, G.G., S.M., M.C., S.P., C.P., J.B. and V.B. (Valentina Bessi); methodology, G.G. and S.M.; project administration, S.S., B.N. and V.B. (Valentina Bessi); resources, B.N.; software, S.M.; supervision, G.G., S.M., S.S. and V.B. (Valentina Bessi); validation, G.G., S.M., S.B., M.C., S.P., C.P., V.B. (Valentina Berti), J.B., C.F., G.L., A.I., S.S., B.N. and V.B. (Valentina Bessi); visualization, G.G., S.M., S.B., M.C., S.P., C.P., V.B. (Valentina Berti), J.B., C.F., G.L., A.I., S.S., B.N. and V.B. (Valentina Bessi); writing—original draft, G.G. and V.B. (Valentina Bessi); writing—review and editing, G.G., S.M., S.S., B.N. and V.B. (Valentina Bessi). All the authors have read and agreed to the published version of the manuscript. All authors have read and agreed to the published version of the manuscript.

Funding

This research was funded by Fondazione Cassa di Risparmio di Firenze (ECRF16-CONTRIBUTO 2015.0713, SORBI), and by Ateneo dell’Università di Firenze (fondi Ateneo 2020, Sorbi and Nacmias; fondi Ateneo 2021, Nacmias).

Institutional Review Board Statement

The study was conducted according to the guidelines of the Declaration of Helsinki, and approved by the Ethics Committee of University of Florence (reference 15691oss).

Informed Consent Statement

Informed consent was obtained from all subjects involved in the study.

Data Availability Statement

Raw data that support the findings of this study are not presented due to ethical and patient data security reasons but will be shared upon request from any qualified investigator.

Conflicts of Interest

The authors have no conflict of interest.

References

  1. Scheltens, P.; Blennow, K.; Breteler, M.M.; de Strooper, B.; Frisoni, G.B.; Salloway, S.; Van der Flier, W.M. Alzheimer’s disease. Lancet 2016, 388, 505–517. [Google Scholar] [CrossRef]
  2. McKhann, G.; Drachman, D.; Folstein, M.; Katzman, R.; Price, D.; Stadlan, E.M. Clinical diagnosis of Alzheimer’s disease: Report of the NINCDS-ADRDA Work Group under the auspices of Department of Health and Human Services Task Force on Alzheimer’s Disease. Neurology 1984, 34, 939–944. [Google Scholar] [CrossRef] [Green Version]
  3. Dubois, B.; Feldman, H.H.; Jacova, C.; Hampel, H.; Molinuevo, J.L.; Blennow, K.; DeKosky, S.T.; Gauthier, S.; Selkoe, D.; Bateman, R.; et al. Advancing research diagnostic criteria for Alzheimer’s disease: The IWG-2 criteria. Lancet Neurol. 2014, 13, 614–629. [Google Scholar] [CrossRef]
  4. Strozyk, D.; Blennow, K.; White, L.R.; Launer, L.J. CSF Abeta 42 levels correlate with amyloid-neuropathology in a population-based autopsy study. Neurology 2003, 60, 652–656. [Google Scholar] [CrossRef]
  5. Lewczuk, P.; Esselmann, H.; Otto, M.; Maler, J.M.; Henkel, A.W.; Henkel, M.K.; Eikenberg, O.; Antz, C.; Krause, W.R.; Reulbach, U.; et al. Neurochemical diagnosis of Alzheimer’s dementia by CSF Abeta42, Abeta42/Abeta40 ratio and total tau. Neurobiol. Aging 2004, 25, 273–281. [Google Scholar] [CrossRef]
  6. Tapiola, T.; Overmyer, M.; Lehtovirta, M.; Helisalmi, S.; Ramberg, J.; Alafuzoff, I.; Riekkinen, P.S.; Soininen, H. The level of cerebrospinal fluid tau correlates with neurofibrillary tangles in Alzheimer’s disease. Neuroreport 1997, 8, 3961–3963. [Google Scholar] [CrossRef] [PubMed]
  7. Buerger, K.; Ewers, M.; Pirttila, T.; Zinkowski, R.; Alafuzoff, I.; Teipel, S.J.; DeBernardis, J.; Kerkman, D.; McCulloch, C.; Hampel, H.; et al. CSF phosphorylated tau protein correlates with neocortical neurofibrillary pathology in Alzheimer’s disease. Brain 2006, 129, 3035–3041. [Google Scholar] [CrossRef] [PubMed]
  8. Tapiola, T.; Alafuzoff, I.; Herukka, S.K.; Parkkinen, L.; Hartikainen, P.; Soininen, H.; Pirttilä, T. Cerebrospinal fluid {beta}-amyloid 42 and tau proteins as biomarkers of Alzheimer-type pathologic changes in the brain. Arch. Neurol. 2009, 66, 382–389. [Google Scholar] [CrossRef] [PubMed] [Green Version]
  9. Ikonomovic, M.D.; Klunk, W.E.; Abrahamson, E.E.; Mathis, C.A.; Price, J.C.; Tsopelas, N.D.; Lopresti, B.J.; Ziolko, S.; Bi, W.; Paljug, W.R.; et al. Post-mortem correlates of in vivo PiB-PET amyloid imaging in a typical case of Alzheimer’s disease. Brain 2008, 131, 1630–1645. [Google Scholar] [CrossRef] [PubMed] [Green Version]
  10. Sabri, O.; Sabbagh, M.N.; Seibyl, J.; Barthel, H.; Akatsu, H.; Ouchi, Y.; Senda, K.; Murayama, S.; Ishii, K.; Takao, M.; et al. Florbetaben PET imaging to detect amyloid beta plaques in Alzheimer’s disease: Phase 3 study. Alzheimers Dement. 2015, 11, 964–974. [Google Scholar] [CrossRef] [PubMed] [Green Version]
  11. Curtis, C.; Gamez, J.E.; Singh, U.; Sadowsky, C.H.; Villena, T.; Sabbagh, M.N.; Beach, T.G.; Duara, R.; Fleisher, A.S.; Frey, K.A.; et al. Phase 3 trial of flutemetamol labeled with radioactive fluorine 18 imaging and neuritic plaque density. JAMA Neurol. 2015, 72, 287–294. [Google Scholar] [CrossRef] [PubMed]
  12. Clark, C.M.; Pontecorvo, M.J.; Beach, T.G.; Bedell, B.J.; Coleman, R.E.; Doraiswamy, P.M.; Fleisher, A.S.; Reiman, E.M.; Sabbagh, M.N.; Sadowsky, C.H.; et al. Cerebral PET with florbetapir compared with neuropathology at autopsy for detection of neuritic amyloid-β plaques: A prospective cohort study. Lancet Neurol. 2012, 11, 669–678. [Google Scholar] [CrossRef]
  13. Jack, C.R.; Bennett, D.A.; Blennow, K.; Carrillo, M.C.; Dunn, B.; Haeberlein, S.B.; Holtzman, D.M.; Jagust, W.; Jessen, F.; Karlawish, J.; et al. NIA-AA research framework: Toward a biological definition of Alzheimer’s disease. Alzheimer’s Dement. 2018, 14, 535–562. [Google Scholar] [CrossRef] [PubMed]
  14. Sperling, R.A.; Aisen, P.S.; Beckett, L.A.; Bennett, D.A.; Craft, S.; Fagan, A.M.; Iwatsubo, T.; Jack, C.R., Jr.; Kaye, J.; Montine, T.J.; et al. Toward defining the preclinical stages of Alzheimer’s disease: Recommendations from the National Institute on Aging-Alzheimer’s Association workgroups on diagnostic guidelines for Alzheimer’s disease. Alzheimer’s Dement. 2011, 7, 280–292. [Google Scholar] [CrossRef] [PubMed] [Green Version]
  15. Albert, M.S.; DeKosky, S.T.; Dickson, D.; Dubois, B.; Feldman, H.H.; Fox, N.C.; Gamst, A.; Holtzman, D.M.; Jagust, W.J.; Petersen, R.C.; et al. The diagnosis of mild cognitive impairment due to Alzheimer’s disease: Recommendations from the National Institute on Aging-Alzheimer’s Association workgroups on diagnostic guidelines for Alzheimer’s disease. Alzheimer’s Dement. 2011, 7, 270–279. [Google Scholar] [CrossRef] [Green Version]
  16. McKhann, G.M.; Knopman, D.S.; Chertkow, H.; Hyman, B.T.; Jack, C.R., Jr.; Kawas, C.H.; Klunk, W.E.; Koroshetz, W.J.; Manly, J.J.; Mayeux, R.; et al. The diagnosis of dementia due to Alzheimer’s disease: Recommendations from the National Institute on Aging-Alzheimer’s Association workgroups on diagnostic guidelines for Alzheimer’s disease. Alzheimer’s Dement. 2011, 7, 263–269. [Google Scholar] [CrossRef] [Green Version]
  17. Fagan, A.M. What does it mean to be “amyloid-positive”? Brain 2015, 138, 514–516. [Google Scholar] [CrossRef] [Green Version]
  18. Fagan, A.M.; Mintun, M.A.; Shah, A.R.; Aldea, P.; Roe, C.M.; Mach, R.H.; Marcus, D.; Morris, J.C.; Holtzman, D.M. Cerebrospinal fluid tau and ptau181 increase with cortical amyloid deposition in cognitively normal individuals: Implications for future clinical trials of Alzheimer’s disease. EMBO Mol. Med. 2009, 1, 371–380. [Google Scholar] [CrossRef]
  19. Zwan, M.D.; Rinne, J.O.; Hasselbalch, S.G.; Nordberg, A.; Lleó, A.; Herukka, S.K.; Soininen, H.; Law, I.; Bahl, J.M.; Carter, S.F.; et al. Use of amyloid-PET to determine cutpoints for CSF markers: A multicenter study. Neurol. Int. 2016, 86, 50–58. [Google Scholar] [CrossRef] [Green Version]
  20. Blennow, K.; Mattsson, N.; Schöll, M.; Hansson, O.; Zetterberg, H. Amyloid biomarkers in Alzheimer’s disease. Trends Pharmacol. Sci. 2015, 36, 297–309. [Google Scholar] [CrossRef]
  21. Rohrer, J.D.; Lashley, T.; Schott, J.M.; Warren, J.E.; Mead, S.; Isaacs, A.M.; Beck, J.; Hardy, J.; de Silva, R.; Warrington, E.; et al. Clinical and neuroanatomical signatures of tissue pathology in frontotemporal lobar degeneration. Brain 2011, 134, 2565–2581. [Google Scholar] [CrossRef] [PubMed] [Green Version]
  22. Knibb, J.A.; Xuereb, J.H.; Patterson, K.; Hodges, J.R. Clinical and pathological characterization of progressive aphasia. Ann. Neurol. 2006, 59, 156–165. [Google Scholar] [CrossRef] [PubMed]
  23. Alladi, S.; Xuereb, J.; Bak, T.; Nestor, P.; Knibb, J.; Patterson, K.; Hodges, J.R. Focal cortical presentations of Alzheimer’s disease. Brain 2007, 130, 2636–2645. [Google Scholar] [CrossRef] [Green Version]
  24. Blennow, K. A review of fluid biomarkers for Alzheimer’s Disease: Moving from CSF to blood. Neurol. Ther. 2017, 6, 15–24. [Google Scholar] [CrossRef] [PubMed]
  25. Paterson, R.W.; Slattery, C.F.; Poole, T.; Nicholas, J.M.; Magdalinou, N.K.; Toombs, J.; Chapman, M.D.; Lunn, M.P.; Heslegrave, A.J.; Foiani, M.S.; et al. Cerebrospinal fluid in the differential diagnosis of Alzheimer’s disease: Clinical utility of an extended panel of biomarkers in a specialist cognitive clinic. Alzheimers Res. Ther. 2018, 10, 32. [Google Scholar] [CrossRef]
  26. Neary, D.; Snowden, J.S.; Gustafson, L.; Passant, U.; Stuss, D.; Black, S.; Freedman, M.; Kertesz, A.; Robert, P.H.; Albert, M.; et al. Frontotemporal lobar degeneration: A consensus on clinical diagnostic criteria. Neurology 1998, 51, 1546–1554. [Google Scholar] [CrossRef] [Green Version]
  27. Bracco, L.; Amaducci, L.; Pedone, D.; Bino, G.; Lazzaro, M.P.; Carella, F.; D’Antona, R.; Gallato, R.; Denes, G. Italian Multicentre Study on Dementia (SMID): A neuropsychological test battery for assessing Alzheimer’s disease. J. Psychiatr. Res. 1990, 24, 213–226. [Google Scholar] [CrossRef]
  28. Caffarra, P.; Vezzadini, G.; Dieci, F.; Zonato, F.; Venneri, A. Rey-Osterrieth complex figure: Normative values in an Italian population sample. Neurol. Sci. 2002, 22, 443–447. [Google Scholar] [CrossRef] [PubMed]
  29. Baddeley, A.; Della Sala, S.; Papagno, C.; Spinnler, H. Dual-task performance in dysexecutive and nondysexecutive patients with a frontal lesion. Neuropsychology 1997, 11, 187–194. [Google Scholar] [CrossRef]
  30. Spinnler, H.; Tognoni, G. Standardizzazione e taratura italiana di test neuropsicologici: Gruppo italiano per lo studio neuropsicologico dell’invecchiamento. Ital. J. Neurol. Sci. 1987, 6, 21–120. [Google Scholar]
  31. Giovagnoli, A.R.; Del Pesce, M.; Mascheroni, S.; Simoncelli, M.; Laiacona, M.; Capitani, E. Trailmaking test: Normative values from 287 normaladultcontrols. Ital. J. Neurol. Sci. 1996, 17, 305–309. [Google Scholar] [CrossRef] [PubMed]
  32. Brazzelli, M.; Della Sala, S.; Laiacona, M. Calibration of the Italian version of the Rivermead Behavioural Memory Test: A test for the ecological evaluation of memory. Boll. Psicol. Appl. 1993, 206, 33–42. [Google Scholar]
  33. Colombo, L.; Sartori, G.; Brivio, C. Stima del quoziente intellettivo tramite l’applicazione del TIB (Test Breve di Intelligenza). Giomale Ital. Psicol. 2002, 3, 613–663. [Google Scholar]
  34. Nelson, H. National Adult Reading Test (NART): For the Assessment of Premorbid Intelligence in Patients with Dementia: Test Manual; NFER-Nelson: Windsor, UK, 1982. [Google Scholar]
  35. Hamilton, M. A rating scale for depression. J. Neurol. Neurosurg. Psychiatry 1960, 23, 56–62. [Google Scholar] [CrossRef] [Green Version]
  36. Minoshima, S.; Drzezga, A.E.; Barthel, H.; Bohnen, N.; Djekidel, M.; Lewis, D.H.; Mathis, C.A.; McConathy, J.; Nordberg, A.; Sabri, O.; et al. SNMMI Procedure Standard/EANM Practice Guideline for Amyloid PET Imaging of the Brain 1.0. J. Nucl. Med. Off. Publ. Soc. Nucl. Med. 2016, 57, 1316–1322. [Google Scholar] [CrossRef] [Green Version]
  37. Molinuevo, J.L.; Gispert, J.D.; Dubois, B.; Heneka, M.T.; Lleo, A.; Engelborghs, S.; Pujol, J.; de Souza, L.C.; Alcolea, D.; Jessen, F.; et al. The AD-CSF-index discriminates Alzheimer’s disease patients from healthy controls: A validation study. J. Alzheimers Dis. JAD 2013, 36, 67–77. [Google Scholar] [CrossRef]
  38. Alcolea, D.; Pegueroles, J.; Muñoz, L.; Camacho, V.; López-Mora, D.; Fernández-León, A.; Le Bastard, N.; Huyck, E.; Nadal, A.; Olmedo, V.; et al. Agreement of amyloid PET and CSF biomarkers for Alzheimer’s disease on Lumipulse. Ann. Clin. Transl. Neurol. 2019, 6, 1815–1824. [Google Scholar] [CrossRef] [Green Version]
  39. Sorbi, S.; Nacmias, B.; Forleo, P.; Latorraca, S.; Gobbini, I.; Bracco, L.; Piacentini, S.; Amaducci, L. ApoE allele frequencies in Italian sporadic and familial Alzheimer’s disease. Neurosci. Lett. 1994, 177, 100–102. [Google Scholar] [CrossRef]
  40. Primer3 (v.0.4.0) Pick primers from a DNA sequence. Available online: http://bioinfo.ut.ee/primer3-0.4.0/primer3/ (accessed on 8 September 2020).
  41. Bessi, V.; Piaceri, I.; Padiglioni, S.; Bagnoli, S.; Berti, V.; Sorbi, S.; Nacmias, B. Crossed aphasia in nonfluent variant of primary progressive aphasia carrying a GRN mutation. J. Neurol. Sci. 2018, 15, 34–37. [Google Scholar] [CrossRef]
  42. Mazzeo, S.; Polito, C.; Padiglioni, S.; Berti, V.; Bagnoli, S.; Lombardi, G.; Piaceri, I.; Carraro, M.; De Cristofaro, M.T.; Passeri, A.; et al. Linguistic profiles, brain metabolic patterns and rates of amyloid-β biomarker positivity in patients with mixed primary progressive aphasia. Neurobiol. Aging 2020, 96, 155–164. [Google Scholar] [CrossRef]
  43. Varma, A.R.; Snowden, J.S.; Lloyd, J.J.; Talbot, P.R.; Mann, D.M.; Neary, D. Evaluation of the NINCDS-ADRDA criteria in the differentiation of Alzheimer’s disease and frontotemporal dementia. J. Neurol. Neurosurg. Psychiatry 1999, 66, 184–188. [Google Scholar] [CrossRef] [PubMed] [Green Version]
  44. Rabinovici, G.D.; Rosen, H.J.; Alkalay, A.; Kornak, J.; Furst, A.J.; Agarwal, N.; Mormino, E.C.; O’Neil, J.P.; Janabi, M.; Karydas, A.; et al. Amyloid vs FDG-PET in the differential diagnosis of AD and FTLD. Neurology 2001, 77, 2034–2042. [Google Scholar] [CrossRef] [PubMed] [Green Version]
  45. Landau, S.M.; Lu, M.; Joshi, A.D.; Pontecorvo, M.; Mintun, M.A.; Trojanowski, J.Q.; Shaw, L.M.; Jagust, W.J.; Alzheimer’s Disease Neuroimaging Initiative. Comparing positron emission tomography imaging and cerebrospinal fluid measurements of β-amyloid. Ann. Neurol. 2013, 74, 826–836. [Google Scholar] [CrossRef] [PubMed]
  46. Jagust, W.J.; Landau, S.M.; Shaw, L.M.; Trojanowski, J.Q.; Koeppe, R.A.; Reiman, E.M.; Foster, N.L.; Petersen, R.C.; Weiner, M.W.; Price, J.C.; et al. Relationships between biomarkers in aging and dementia. Neurology 2009, 73, 1193–1199. [Google Scholar] [CrossRef]
  47. Mattsson, N.; Insel, P.S.; Landau, S.; Jagust, W.; Donohue, M.; Shaw, L.M.; Trojanowski, J.Q.; Zetterberg, H.; Blennow, K.; Weiner, M. Alzheimer’s Disease Neuroimaging Initiativea. Diagnostic accuracy of CSF Ab42 and florbetapir PET for Alzheimer’s disease. Ann. Clin. Transl. Neurol. 2014, 1, 534–543. [Google Scholar] [CrossRef]
  48. Spies, P.E.; Slats, D.; Sjogren, J.M.; Kremer, B.P.; Verhey, F.R.; Rikkert, M.G.; Verbeek, M.M. The cerebrospinal fluid amyloid beta42/40 ratio in the differentiation of Alzheimer’s disease from non-Alzheimer’s dementia. Curr. Alzheimer Res. 2010, 7, 470–476. [Google Scholar] [CrossRef] [Green Version]
  49. Slaets, S.; Le Bastard, N.; Martin, J.J.; Sleegers, K.; Van Broeckhoven, C.; De Deyn, P.P.; Engelborghs, S. Cerebrospinal fluid Abeta1-40 improves differential dementia diagnosis in patients with intermediate P-tau181P levels. J. Alzheimers Dis. 2013, 36, 759–767. [Google Scholar] [CrossRef] [Green Version]
  50. Portelius, E.; Westman-Brinkmalm, A.; Zetterberg, H.; Blennow, K. Determination of beta-amyloid peptide signatures in cerebrospinal fluid using immunoprecipitation-mass spectrometry. J. Proteome Res. 2006, 5, 1010–1016. [Google Scholar] [CrossRef]
  51. Hansson, O.; Lehmann, S.; Otto, M.; Zetterberg, H.; Lewczuk, P. Advantages and disadvantages of the use of the CSF Amyloid β (Aβ) 42/40 ratio in the diagnosis of Alzheimer’s Disease. Alzheimers Res. Ther. 2019, 11, 34. [Google Scholar] [CrossRef]
  52. Leuzy, A.; Carter, S.F.; Chiotis, K.; Almkvist, O.; Wall, A.; Nordberg, A. Concordance and Diagnostic Accuracy of [11C]PIB PET and Cerebrospinal Fluid Biomarkers in a Sample of Patients with Mild Cognitive Impairment and Alzheimer’s Disease. J. Alzheimers Dis. 2015, 45, 1077–1088. [Google Scholar] [CrossRef] [Green Version]
  53. Jung, N.Y.; Kim, E.S.; Kim, H.S.; Jeon, S.; Lee, M.J.; Pak, K.; Lee, J.H.; Lee, Y.M.; Lee, K.; Shin, J.H.; et al. Comparison of Diagnostic Performances Between Cerebrospinal Fluid Biomarkers and Amyloid PET in a Clinical Setting. J. Alzheimers Dis. 2020, 74, 473–490. [Google Scholar] [CrossRef] [PubMed]
  54. De Wilde, A.; Reimand, J.; Teunissen, C.E.; Zwan, M.; Windhorst, A.D.; Boellaard, R.; van der Flier, W.M.; Scheltens, P.; van Berckel, B.N.M.; Bouwman, F.; et al. Discordant amyloid-β PET and CSF biomarkers and its clinical consequences. Alzheimers Res. Ther. 2019, 11, 78. [Google Scholar] [CrossRef] [PubMed]
  55. Reimand, J.; de Wilde, A.; Teunissen, C.E.; Zwan, M.; Windhorst, A.D.; Boellaard, R.; Barkhof, F.; van der Flier, W.M.; Scheltens, P.; van Berckel, B.N.M.; et al. PET and CSF amyloid-β status are differently predicted by patient features: Information from discordant cases. Alzheimers Res. Ther. 2019, 11, 100. [Google Scholar] [CrossRef] [PubMed] [Green Version]
  56. Leuzy, A.; Chiotis, K.; Hasselbalch, S.G.; Rinne, J.O.; de Mendonça, A.; Otto, M.; Lleó, A.; Castelo-Branco, M.; Santana, I.; Johansson, J.; et al. Pittsburgh compound B imaging and cerebrospinal fluid amyloid-β in a multicentre European memory clinic study. Brain 2016, 139, 2540–2553. [Google Scholar] [CrossRef] [Green Version]
  57. Palmqvist, S.; Zetterberg, H.; Mattsson, N.; Johansson, P.; Alzheimer’s Disease Neuroimaging Initiative; Minthon, L.; Blennow, K.; Olsson, M.; Hansson, O.; Swedish BioFINDER Study Group. Detailed comparison of amyloid PET and CSF biomarkers for identifying early Alzheimer disease. Neurology 2015, 85, 1240–1249. [Google Scholar] [CrossRef]
  58. Mattsson, N.; Insel, P.S.; Donohue, M.; Landau, S.; Jagust, W.J.; Shaw, L.M.; Trojanowski, J.Q.; Zetterberg, H.; Blennow, K.; Weiner, M.W.; et al. Independent information from cerebrospinal fluid amyloid-β and florbetapir imaging in Alzheimer’s disease. Brain 2015, 138, 772–783. [Google Scholar] [CrossRef] [Green Version]
  59. Palmqvist, S.; Mattsson, N.; Hansson, O.; Initiative, A. Cerebrospinal fluid analysis detects cerebral amyloid-β accumulation earlier than positron emission tomography. Brain 2016, 139, 1226–1236. [Google Scholar] [CrossRef] [Green Version]
  60. Morris, E.; Chalkidou, A.; Hammers, A.; Peacock, J.; Summers, J.; Keevil, S. Diagnostic accuracy of (18)F amyloid PET tracers for the diagnosis of Alzheimer’s disease: A systematic review and meta-analysis. Eur. J. Nucl. Med. Mol. Imaging 2016, 43, 374–385. [Google Scholar] [CrossRef] [Green Version]
  61. Mattsson, N.; Rajendran, L.; Zetterberg, H.; Gustavsson, M.; Andreasson, U.; Olsson, M.; Brinkmalm, G.; Lundkvist, J.; Jacobson, L.H.; Perrot, L.; et al. BACE1 Inhibition induces a specific cerebrospinal fluid beta-amyloid pattern that identifies drug effects in the central nervous system. PLoS ONE 2012, 7, e31084. [Google Scholar] [CrossRef]
  62. Reiman, E.M.; Quiroz, Y.T.; Fleisher, A.S.; Chen, K.; Velez-Pardo, C.; Jimenez-Del-Rio, M.; Fagan, A.M.; Shah, A.R.; Alvarez, S.; Arbelaez, A.; et al. Brain imaging and fluid biomarker analysis in young adults at genetic risk for autosomal dominant Alzheimer’s disease in the presenilin 1 E280A kindred: A case-control study. Lancet Neurol. 2012, 11, 1048–1056. [Google Scholar] [CrossRef] [Green Version]
  63. Potter, R.; Patterson, B.W.; Elbert, D.L.; Ovod, V.; Kasten, T.; Sigurdson, W.; Mawuenyega, K.; Blazey, T.; Goate, A.; Chott, R.; et al. Increased in vivo amyloid-b42 production, exchange, and loss in presenilin mutation carriers. Sci. Transl. Med. 2013, 5, 189ra77. [Google Scholar] [CrossRef] [PubMed] [Green Version]
  64. Scholl, M.; Wall, A.; Thordardottir, S.; Ferreira, D.; Bogdanovic, N.; Långström, B.; Almkvist, O.; Graff, C.; Nordberg, A. Low PiB PET retention in presence of pathologic CSF biomarkers in Arctic APP mutation carriers. Neurology 2012, 79, 229–236. [Google Scholar] [CrossRef]
  65. Mattsson, N.; Axelsson, M.; Haghighi, S.; Malmestrom, C.; Wu, G.; Anckarsäter, R.; Sankaranarayanan, S.; Andreasson, U.; Fredrikson, S.; Gundersen, A.; et al. Reduced cerebrospinal fluid BACE1 activity in multiple sclerosis. Mult. Scler. 2009, 15, 448–454. [Google Scholar] [CrossRef] [PubMed]
  66. Selnes, P.; Blennow, K.; Zetterberg, H.; Grambaite, R.; Rosengren, L.; Johnsen, L.; Stenset, V.; Fladby, T. Effects of cerebrovascular disease on amyloid precursor protein metabolites in cerebrospinal fluid. Cereb. Fluid Res. 2010, 7, 10. [Google Scholar] [CrossRef] [PubMed] [Green Version]
  67. Hansson, O.; Mikulskis, A.; Fagan, A.M.; Teunissen, C.; Zetterberg, H.; Vanderstichele, H.; Molinuevo, J.L.; Shaw, L.M.; Vandijck, M.; Verbeek, M.M.; et al. The impact of preanalytical variables on measuring cerebrospinal fluid biomarkers for Alzheimer’s disease diagnosis: A review. Alzheimers Dement. 2018, 14, 1313–1333. [Google Scholar] [CrossRef] [PubMed] [Green Version]
  68. Ossenkoppele, R.; Jansen, W.J.; Rabinovici, G.D.; Knol, D.L.; van der Flier, W.M.; van Berckel, B.N.; Scheltens, P.; Visser, P.J.; Amyloid PET Study Group; Verfaillie, S.C.; et al. Prevalence of amyloid PET positivity in dementia syndromes: A meta-analysis. JAMA 2015, 313, 1939–1949. [Google Scholar] [CrossRef] [Green Version]
  69. Clark, C.M.; Schneider, J.A.; Bedell, B.J.; Beach, T.G.; Bilker, W.B.; Mintun, M.A.; Pontecorvo, M.J.; Hefti, F.; Carpenter, A.P.; Flitter, M.L.; et al. Use of florbetapir-PET for imaging beta-amyloid pathology. JAMA 2011, 305, 275–283. [Google Scholar] [CrossRef] [PubMed] [Green Version]
  70. Weston, P.S.; Paterson, R.W.; Dickson, J.; Barnes, A.; Bomanji, J.B.; Kayani, I.; Lunn, M.P.; Mummery, C.J.; Warren, J.D.; Rossor, M.N.; et al. Diagnosing Dementia in the Clinical Setting: Can Amyloid PET Provide Additional Value Over Cerebrospinal Fluid? J. Alzheimers Dis. 2016, 54, 1297–1302. [Google Scholar] [CrossRef] [Green Version]
  71. Robinson, J.L.; Lee, E.B.; Xie, S.X.; Rennert, L.; Suh, E.; Bredenberg, C.; Caswell, C.; Van Deerlin, V.M.; Yan, N.; Yousef, A.; et al. Neurodegenerative disease concomitant proteinopathies are prevalent, age-related and APOE4-associated. Brain 2018, 141, 2181–2193. [Google Scholar] [CrossRef] [PubMed] [Green Version]
  72. Bergeron, D.; Gorno-Tempini, M.L.; Rabinovici, G.D.; Santos-Santos, M.A.; Seeley, W.; Miller, B.L.; Pijnenburg, Y.; Keulen, M.A.; Groot, C.; van Berckel, B.N.M.; et al. Prevalence of amyloid-b pathology in distinct variants of primary progressive aphasia. Ann. Neurol. 2018, 84, 729–740. [Google Scholar] [CrossRef] [Green Version]
  73. Chételat, G.; Arbizu, J.; Barthel, H.; Garibotto, V.; Law, I.; Morbelli, S.; van de Giessen, E.; Agosta, F.; Barkhof, F.; Brooks, D.J.; et al. Amyloid-PET and 18F-FDG-PET in the diagnostic investigation of Alzheimer’s disease and other dementias. Lancet Neurol. 2020, 19, 951–962. [Google Scholar] [CrossRef]
  74. Ramusino, M.C.; Garibotto, V.; Bacchin, R.; Altomare, D.; Dodich, A.; Assal, F.; Mendes, A.; Costa, A.; Tinazzi, M.; Morbelli, S.D.; et al. Incremental value of amyloid-PET versus CSF in the diagnosis of Alzheimer’s disease. Eur. J. Nucl. Med. Mol. Imaging 2020, 47, 270–280. [Google Scholar] [CrossRef] [PubMed]
  75. Fink, H.A.; Linskens, E.J.; Silverman, P.C.; McCarten, J.R.; Hemmy, L.S.; Ouellette, J.M.; Greer, N.L.; Wilt, T.J.; Butler, M. Accuracy of Biomarker Testing for Neuropathologically Defined Alzheimer Disease in Older Adults With Dementia. Ann. Intern. Med. 2020, 172, 669–677. [Google Scholar] [CrossRef] [PubMed]
  76. Gorno-Tempini, M.L.; Hillis, A.E.; Weintraub, S.; Kertesz, A.; Mendez, M.; Cappa, S.F.; Ogar, J.M.; Rohrer, J.D.; Black, S.; Boeve, B.F.; et al. Classification of primary progressive aphasia and its variants. Neurology 2011, 76, 1006–1014. [Google Scholar] [CrossRef] [PubMed] [Green Version]
Figure 1. Comparison of diagnostic accuracy among different Aβ biomarkers. X-axis represents diagnostic accuracy in % (95% C.I.); different amyloid biomarkers are shown in Y-axis. The area of each square is proportional to the degree of the distribution of values of diagnostic accuracy of each biomarker and to the number of patients for whom each biomarker is available. The whiskers represent 95% C.I. The dotted vertical lines separate accuracy values that are significantly different.
Jpm 11 00047 g001
Figure 2. Comparison of sensitivity and specificity among different Aβ biomarkers. (a) X-axis represents sensitivity in % (95% C.I.); different amyloid biomarkers are shown in Y-axis. (b) X-axis represents specificity in % (95% C.I.); different amyloid biomarkers are shown in Y-axis. The area of each square is proportional to the degree of the distribution of values of sensitivity and specificity of each biomarker and to the number of patients for whom each biomarker is available. The whiskers represent 95% C.I. The dotted vertical lines separate sensitivity (a) and specificity (b) values that are significantly different.
Jpm 11 00047 g002
Figure 3. Comparison of negative and positive predictive values among different Aβ biomarkers. (a) X-axis represents negative predictive value (NPV) in % (95% C.I.); different amyloid biomarkers are shown in Y-axis. (b) X-axis represents positive predictive value (PPV) in % (95% C.I.); different amyloid biomarkers are shown in Y-axis. The area of each square is proportional to the degree of the distribution of values of positive and negative predictive values of each biomarker and to the number of patients for whom each biomarker is available. The whiskers represent 95% C.I. The dotted vertical lines separate NPV (a) and PPV (b) that are significantly different.
Jpm 11 00047 g003
Figure 4. Flow chart for use and interpretation of amyloid biomarkers according to clinical suspect. (a) Indication for interpretation of amyloid biomarkers in the case of a clinical diagnosis of Alzheimer’s disease. (b) Indication for interpretation of amyloid biomarkers in the case of a clinical diagnosis of Frontotemporal dementia.
Jpm 11 00047 g004
Table 1. Demographic variables, cognitive data, and ApoE ε 4 proportion.
DemographicAD (n = 95)FTD (n = 53)p
Age at baseline (±SD)66.69 (±7.98)67.04 (±8.17)0.650
Age at onset (±SD) 63.49 (±8.88)64.24 (±8.27)0.661
Age at CSF analysis (±SD)68.02 (±8.04)67.86 (±7.50)0.906
Age at amyloid-PET (±SD)66.76 (±7.34)67.36 (±8.73)0.587
Time from CSF to amyloid-PET (±SD) *0.562 (±0.78)−0.18 (±0.88)0.034
Disease duration (±SD)3.03 (±3.31)2.61 (±1.84)0.951
Sex (women/men)54/4128/250.638
Familiality (%)41.4050.000.902
Education (±SD) 10.56 (±5.10) 9.37 (±4.20)0.205
TIB (±SD)108.70 (±8.02)104 (±4.03)0.292
MMSE (±SD) 19.55 (±5.44)20.32 (±5.68)0.400
HDRS (±SD)28.45 (±5.61)30.75 (±6.18)0.525
ApoE ε4+ (%)24.483.690.008
Values quoted in the table are mean (±SD). Age at baseline, age at onset, age at CSF analysis, age at amyloid-PET, disease duration, and schooling are expressed in years. Age at baseline indicates age at the baseline evaluation; age at onset indicates age at the onset of symptoms; disease duration indicates time from onset of symptoms and baseline evaluation; follow-up time indicates the time from baseline visit to the last evaluation. * indicates time from CSF analysis and amyloid-PET, and it refers only to patients who underwent both amyloid biomarkers analyses. p indicates level of significance for comparison between AD and FTD. TIB (Test di Intelligenza Breve); HDRS (Hamilton Depression Rating Scale). The bold: statistically significatant results.
Table 2. Concordance between CSF biomarkers and amyloid-PET and between CSF Aβ1–42 and Aβ42/40.
Amyloid-PET +Concordance [95% C.I.] %
CSF Aβ+AD9/23 (39.13%)39.13% [19.94–63.40]
FTD1/12 (8.33%)76.92% [54.02–99.83]
Total10/36 (27.28%)52.78% [36.47–69.09]
42/40 +Concordance [95% C.I.] %
1–42 +AD28/40 (70.00%) 92.50% [84.34–100]
FTD4/27 (7.41%)85.19% [71.79–98.59]
Total32/67 (47.76%)89.55% [82.23–96.88]
CSF Aβ was defined as positive if at least one Aβ1–42 level or Aβ42/40 ratio was reduced under cut-off values. Aβ1–42 cut-off: ELISA = 600.00 pg/mL, LUMIPULSE = 670.00 pg/mL; Aβ42/40 cut-off = 0.062.
Table 3. Sensitivity, specificity, and accuracy of each biomarker.
Sensitivity
[95% C.I.]
Specificity
[95% C.I.]
Accuracy
[95% C.I.]
(%)(%)(%)
Aβ positivity (n = 148)81.05 [74.74–87.37]77.36 [70.62–84.10]79.73 [73.25–86.21]
CSF Aβ (n = 126)64.56 [56.20–72.91]80.85 [73.98–87.72]70.63 [62.68–78.59]
1–42 (n = 126)60.76 [52.23–69.29]82.98 [76.42–89.54]69.05 [60.98–77.12]
42/40 (n = 67)77.50 [67.50–87.50]81.48 [72.18–90.78]79.10 [69.37–88.84]
Amyloid-PET (n = 58)89.74 [81.94–97.55]78.95 [68.46–89.44]86.21 [77.33–95.08]
Aβ positivity was defined if at least one of the amyloid biomarkers (CSF or amyloid PET) revealed the presence of Aβ pathology. CSF Aβ was defined as positive if at least one of either the Aβ1–42 level or the Aβ42/40 ratio was reduced under cut-off values. Aβ1–42 cut-off: ELISA = 600.00 pg/mL, LUMIPULSE = 670.00 pg/mL; Aβ42/40: cut-off = 0.062.
Publisher’s Note: MDPI stays neutral with regard to jurisdictional claims in published maps and institutional affiliations.

