Evaluation of Scalability and Degree of Fine-Tuning of Deep Convolutional Neural Networks for COVID-19 Screening on Chest X-ray Images Using Explainable Deep-Learning Algorithm

 ,
,  , ,
, , 
Abstract
1. Introduction
2. Materials and Methods
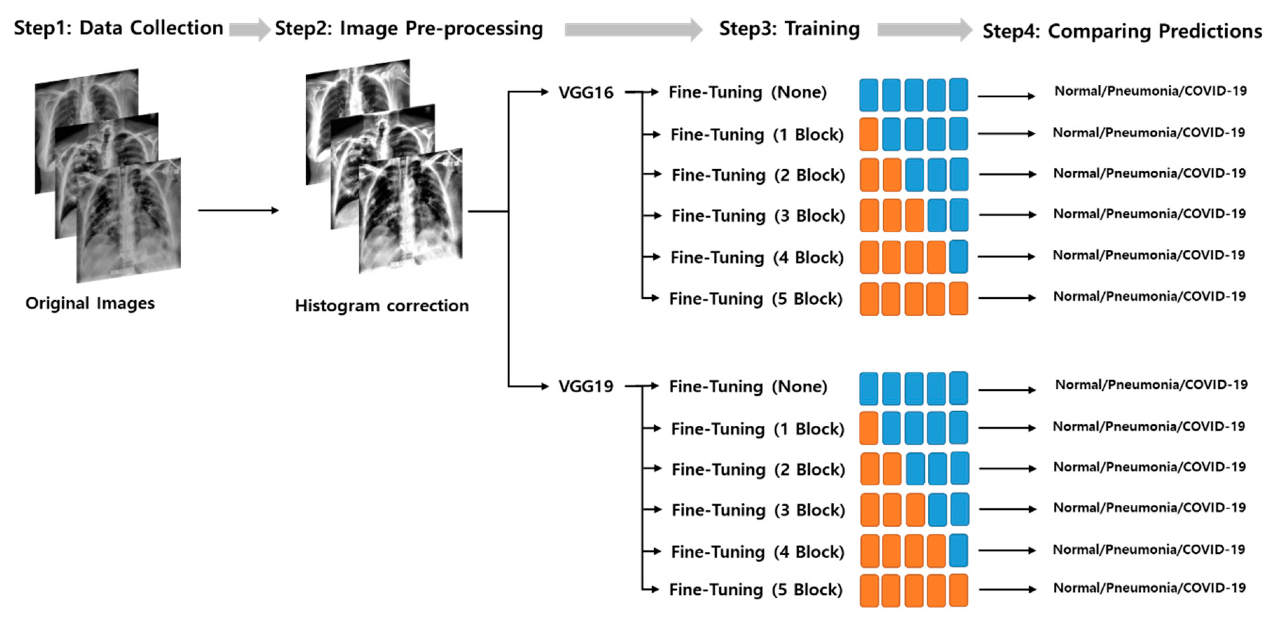
2.1. Experimental Design
2.2. Datasets
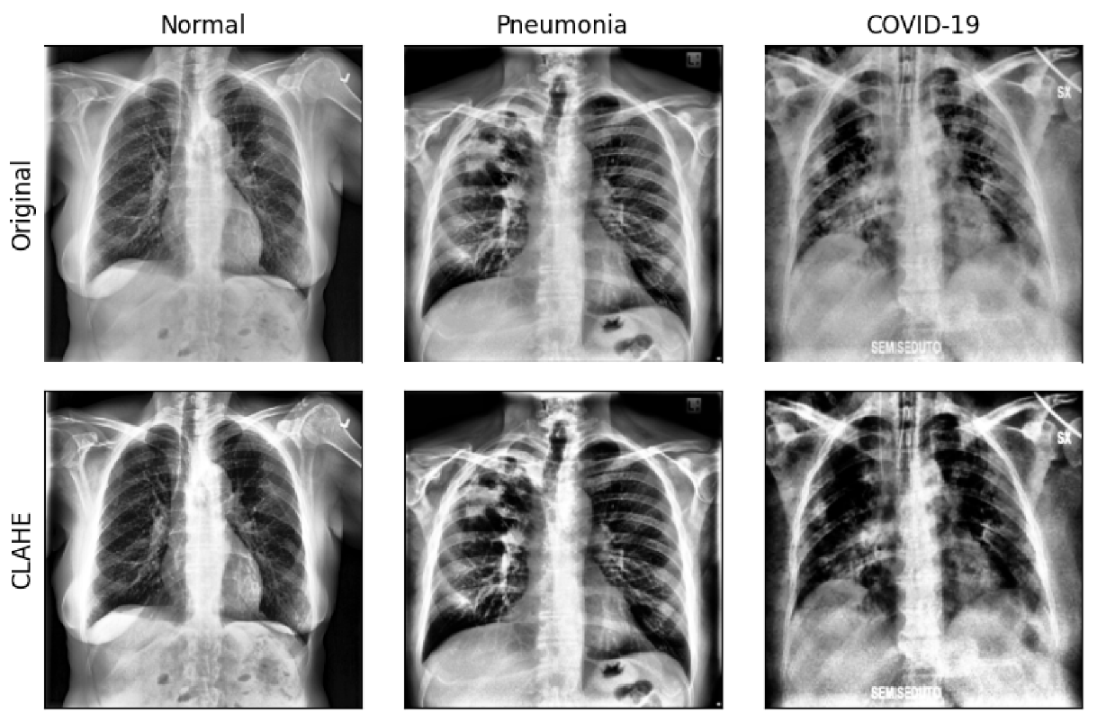
2.3. Image Preprocessing
2.4. Convolutional Neural Networks
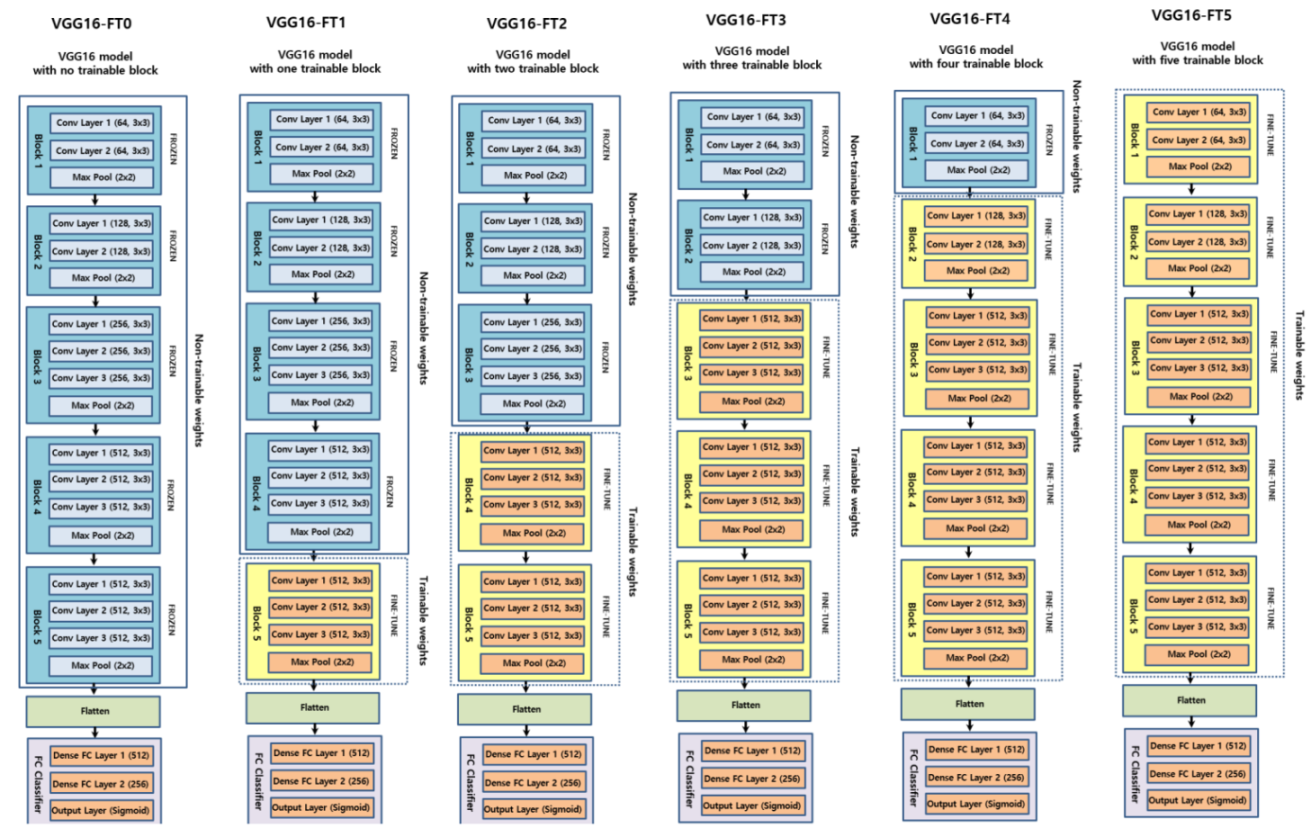
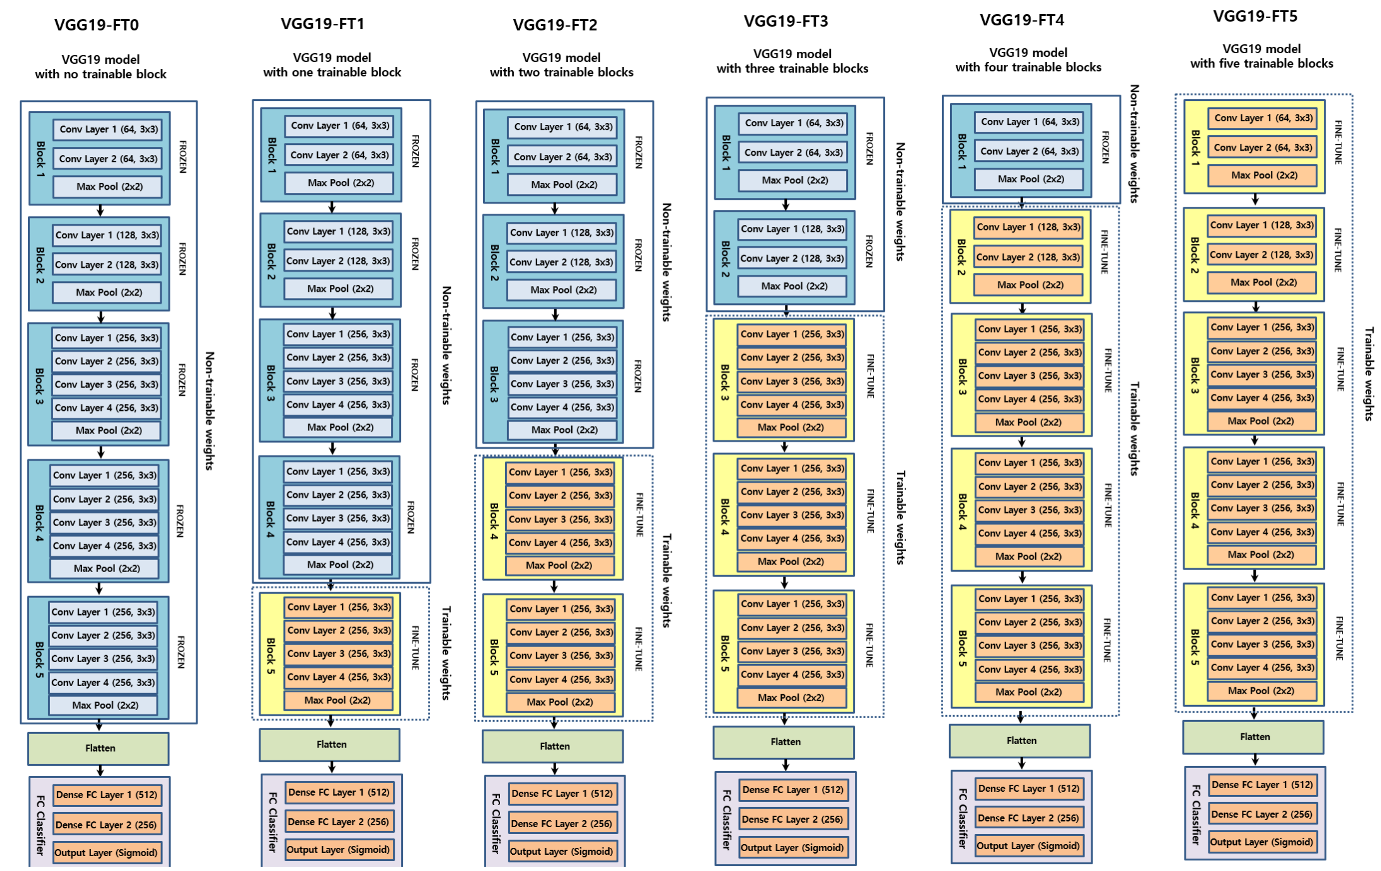
2.5. Fine-Tuning
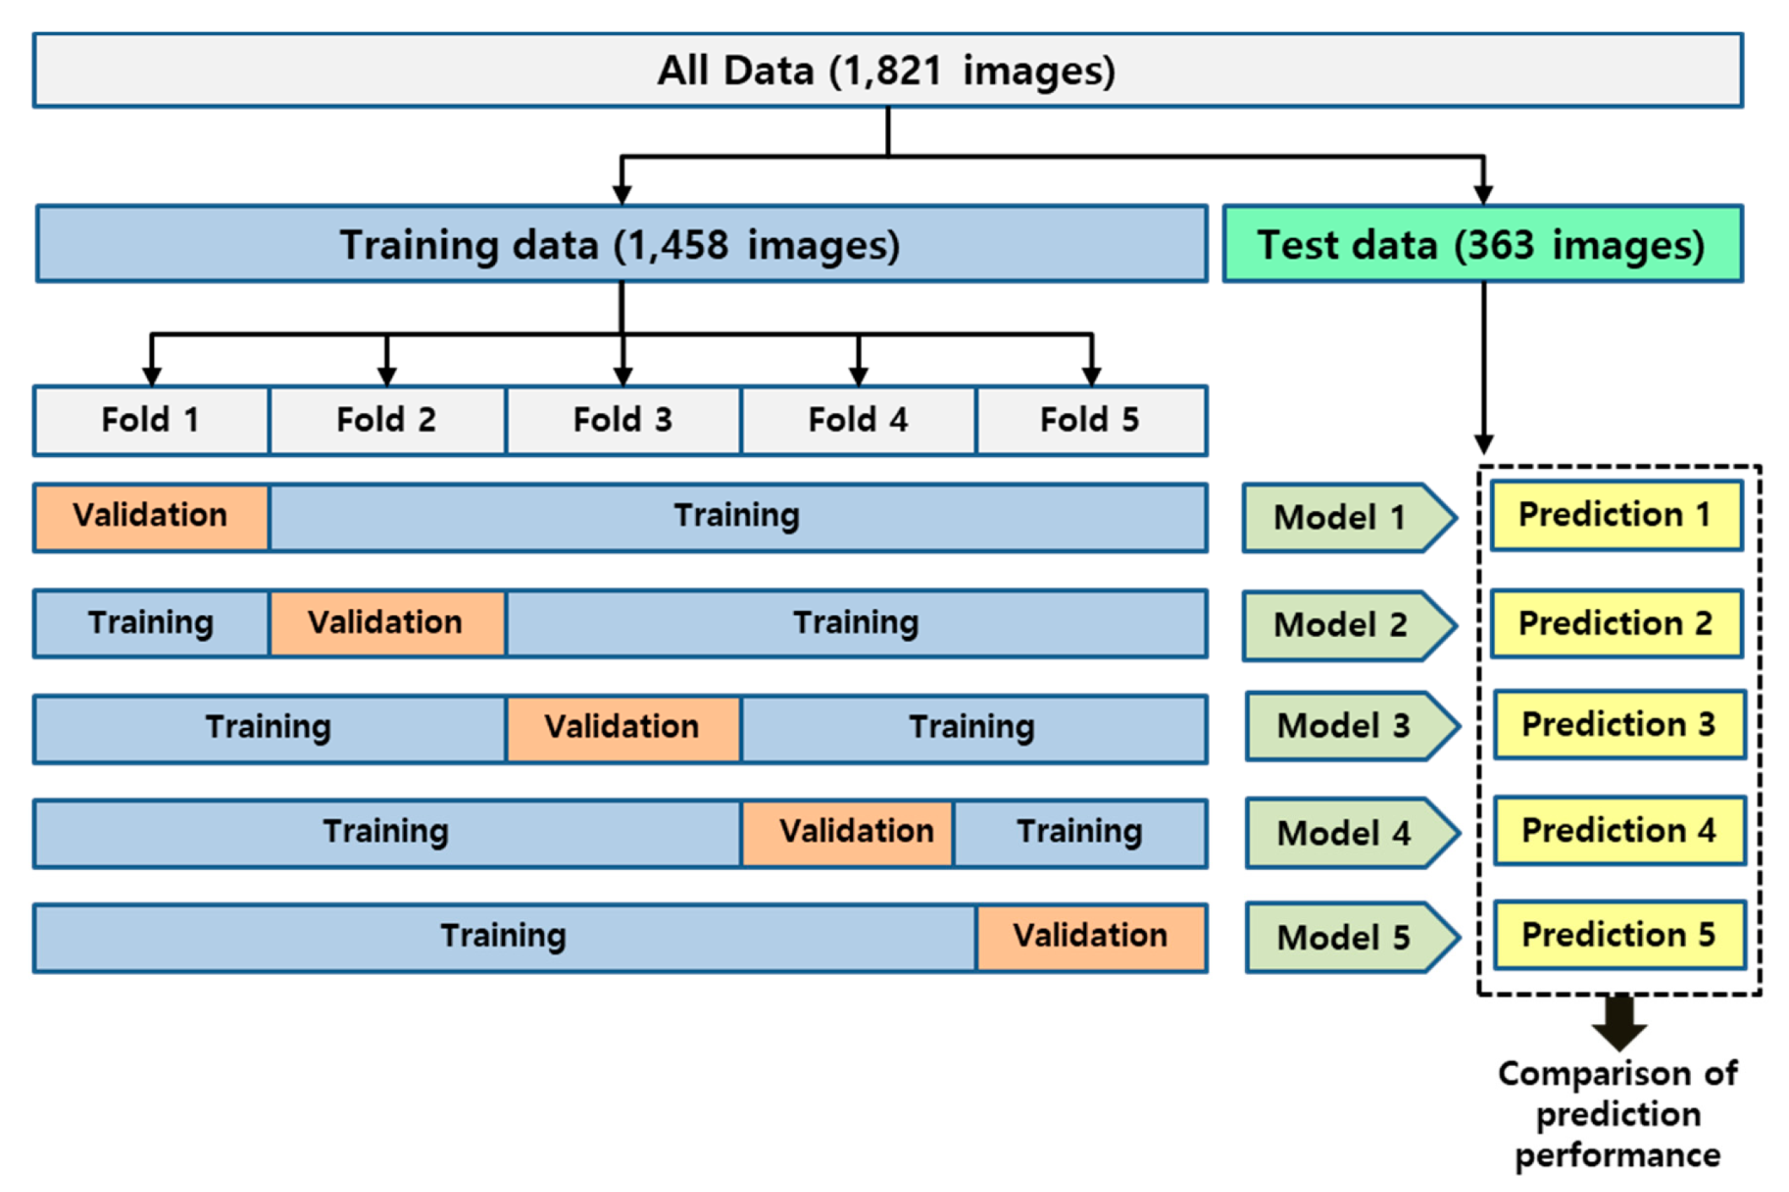
2.6. Training
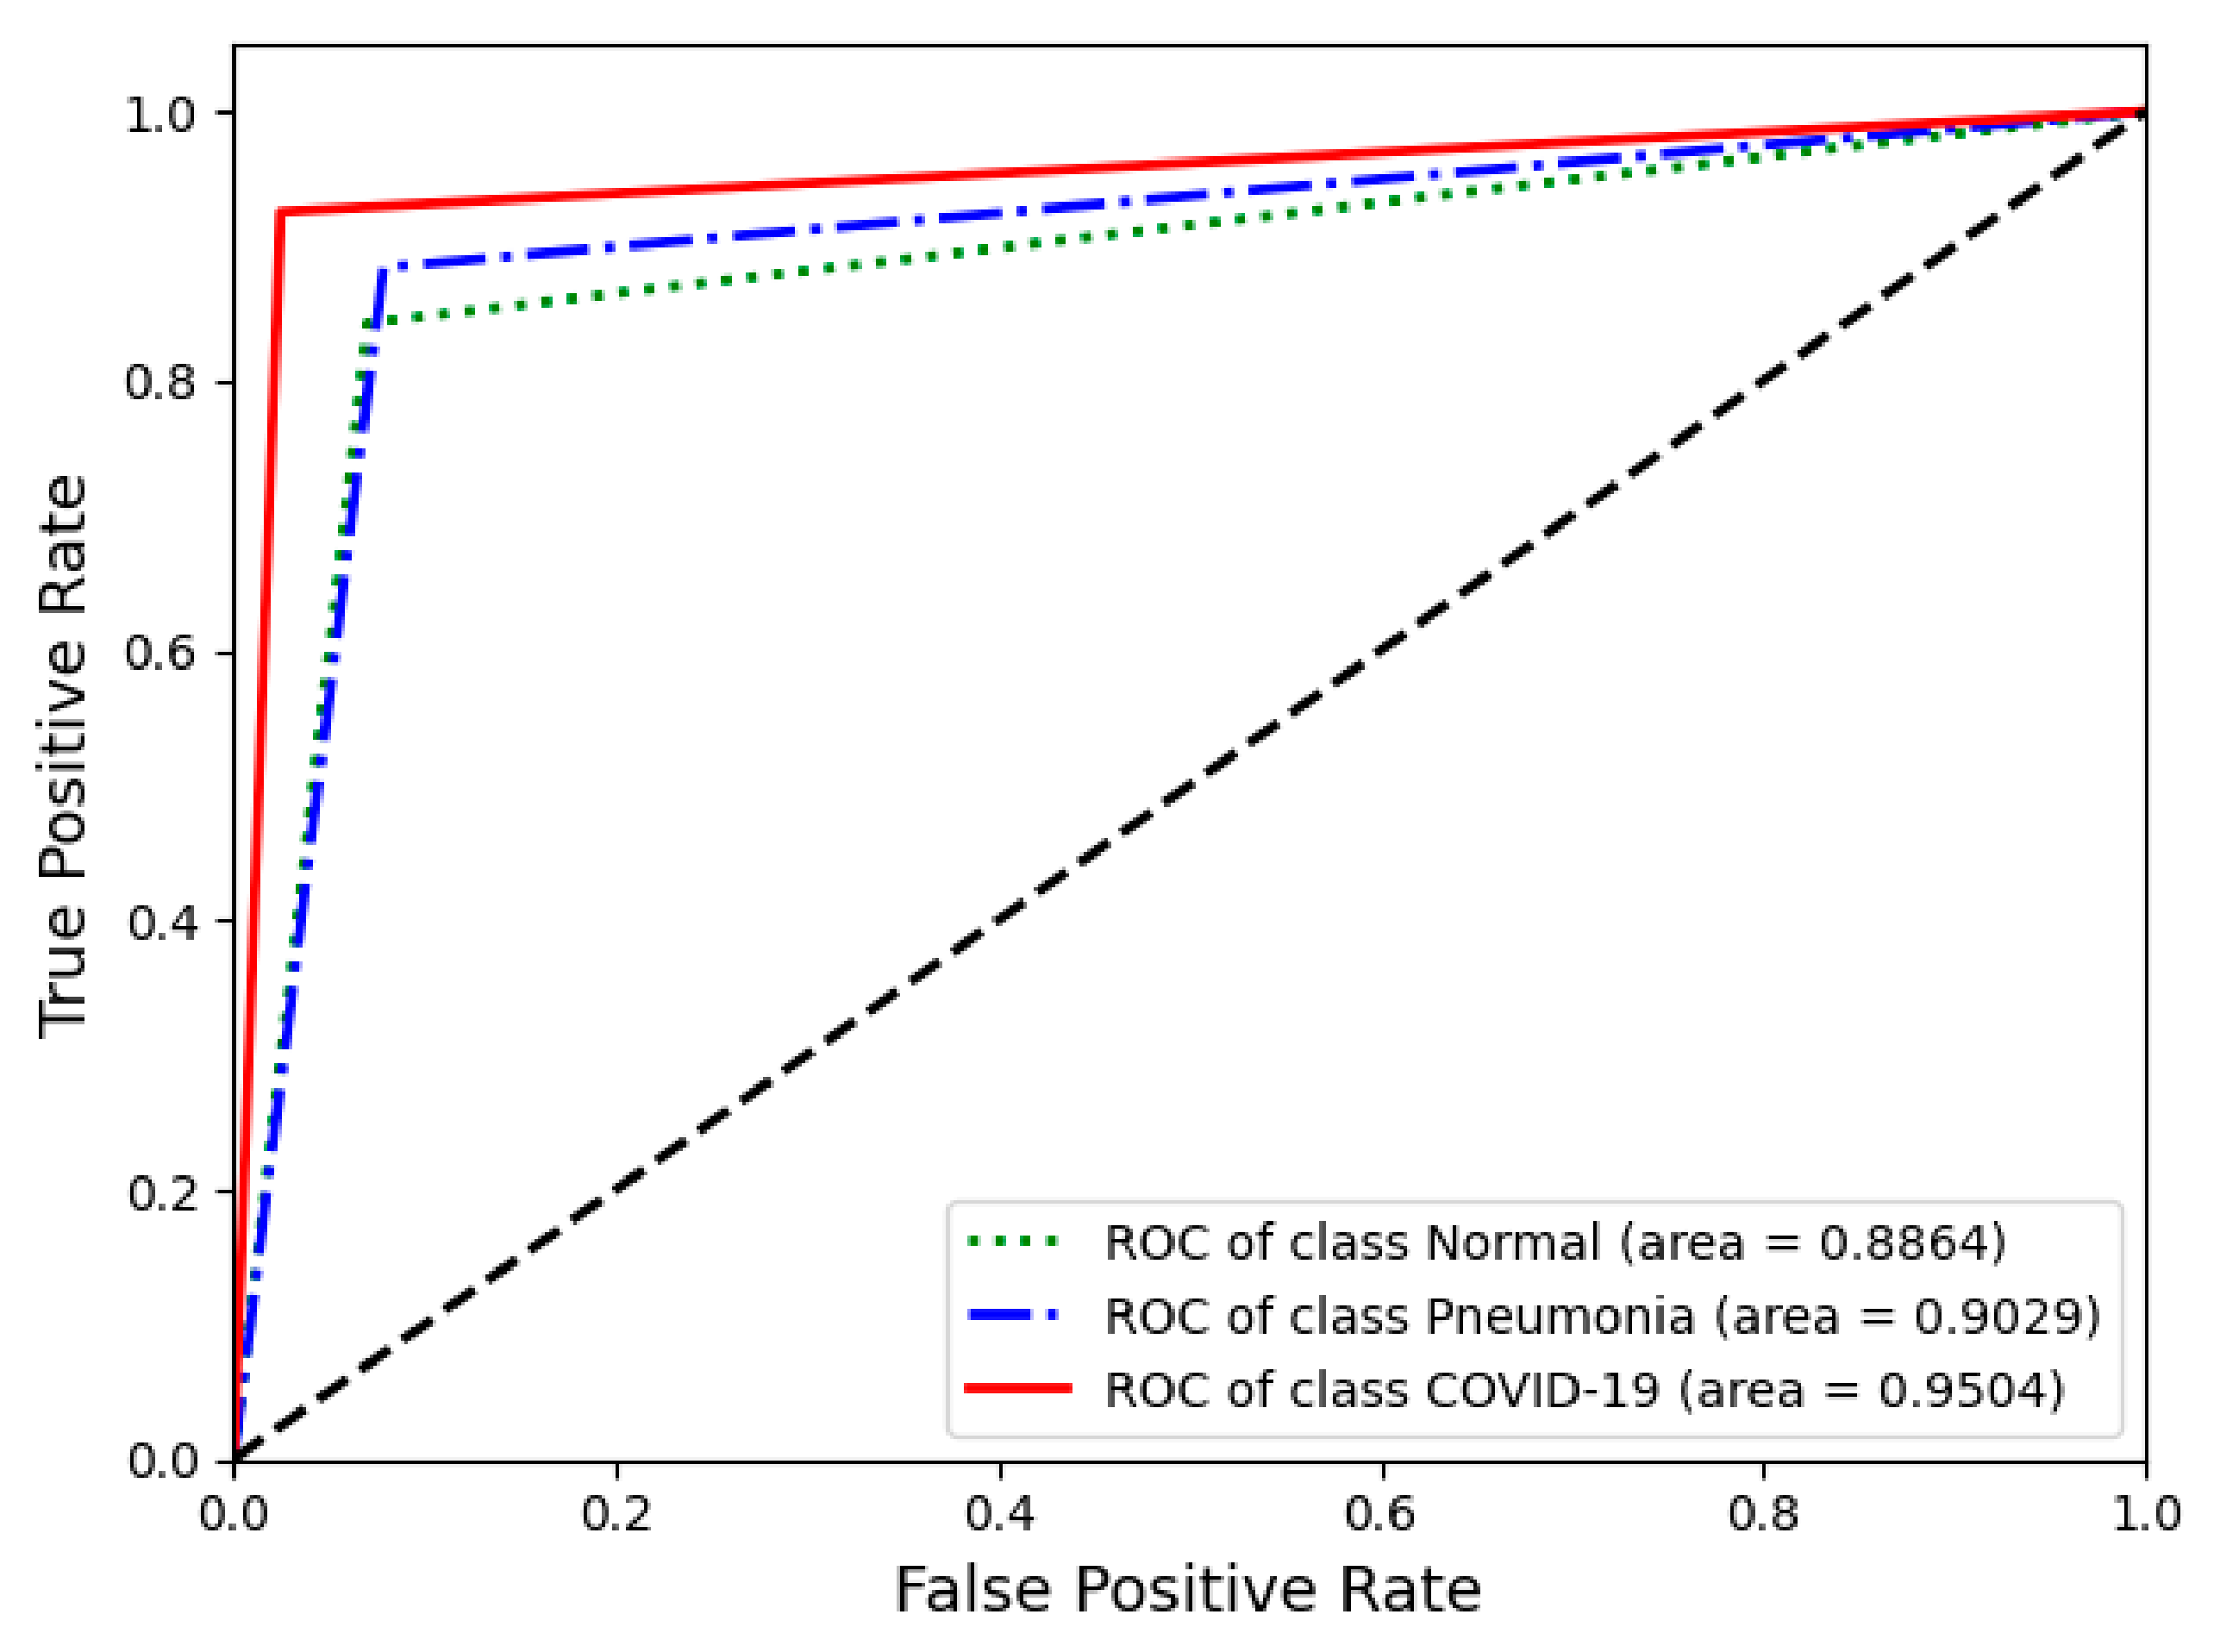
2.7. Performance Evaluation
2.8. Interpretation of Model Prediction
3. Results
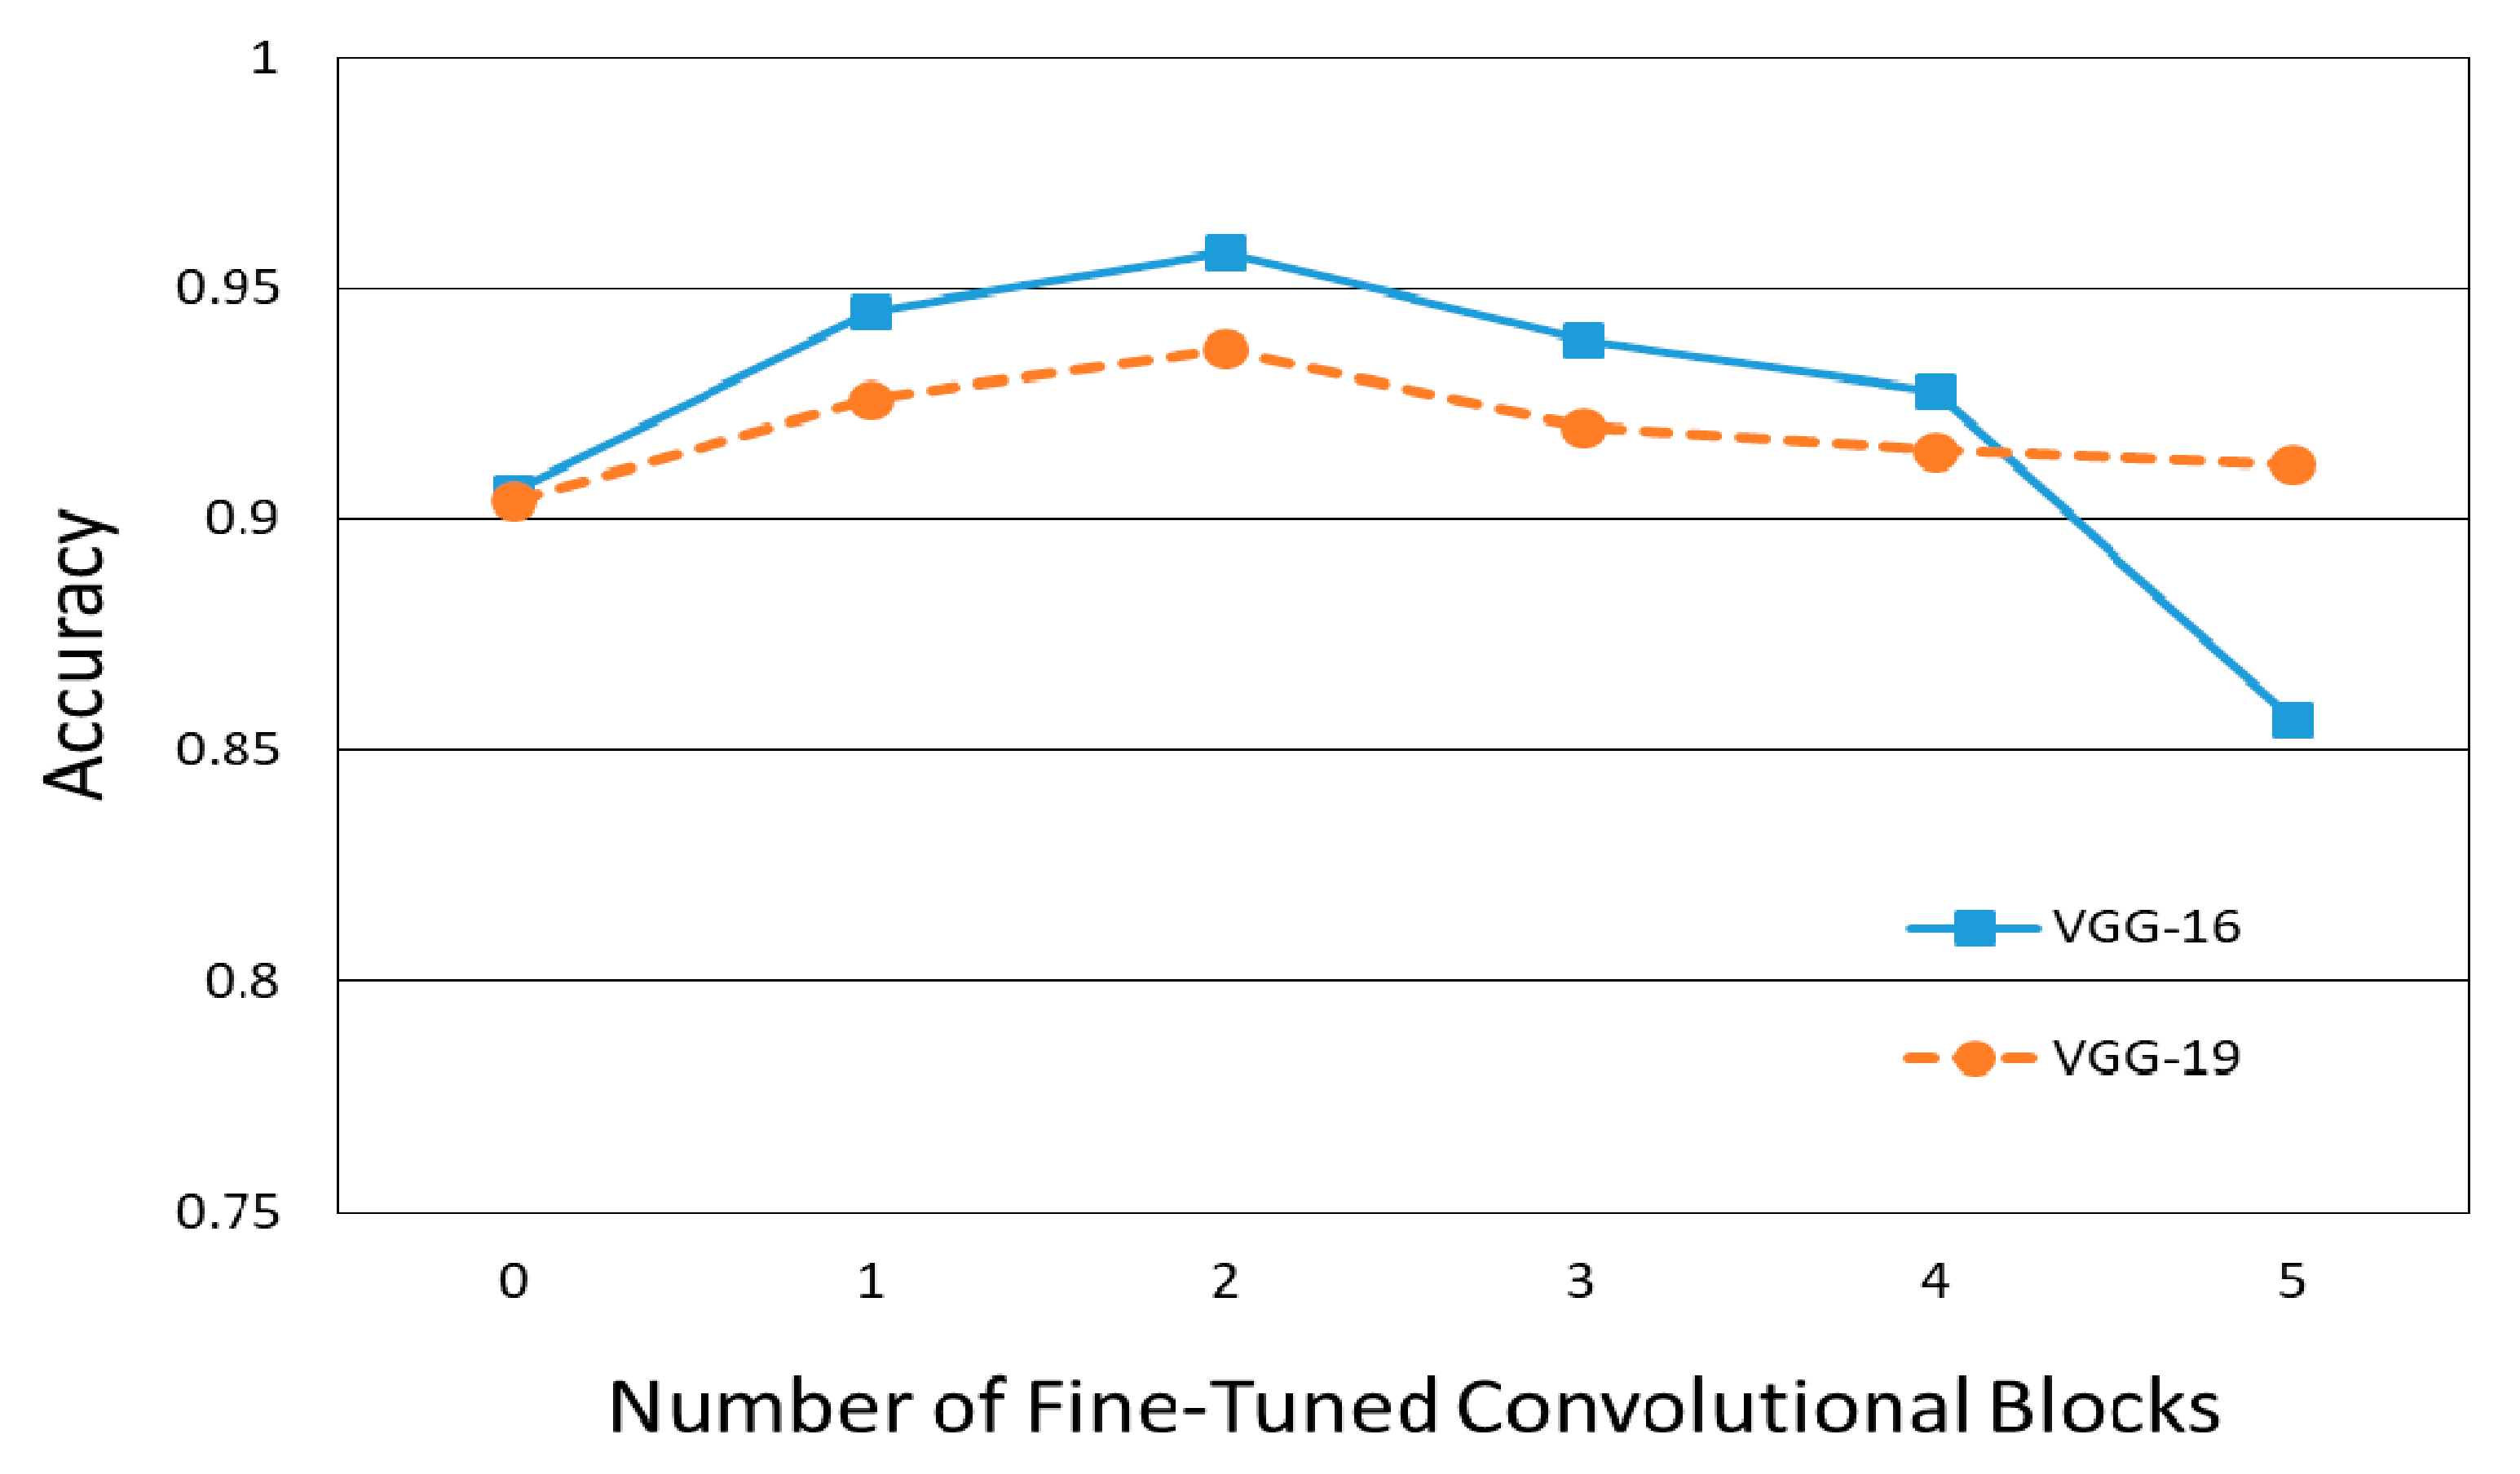
3.1. Classification Performance
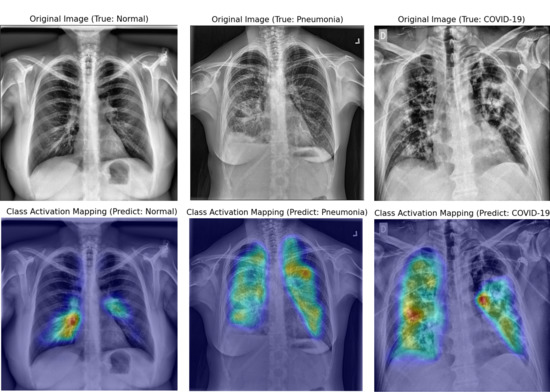
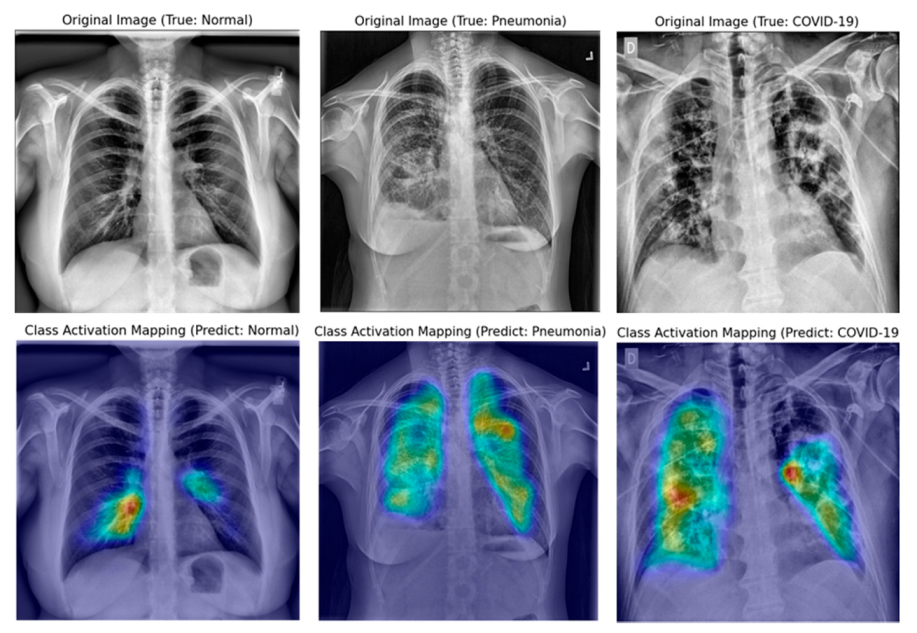
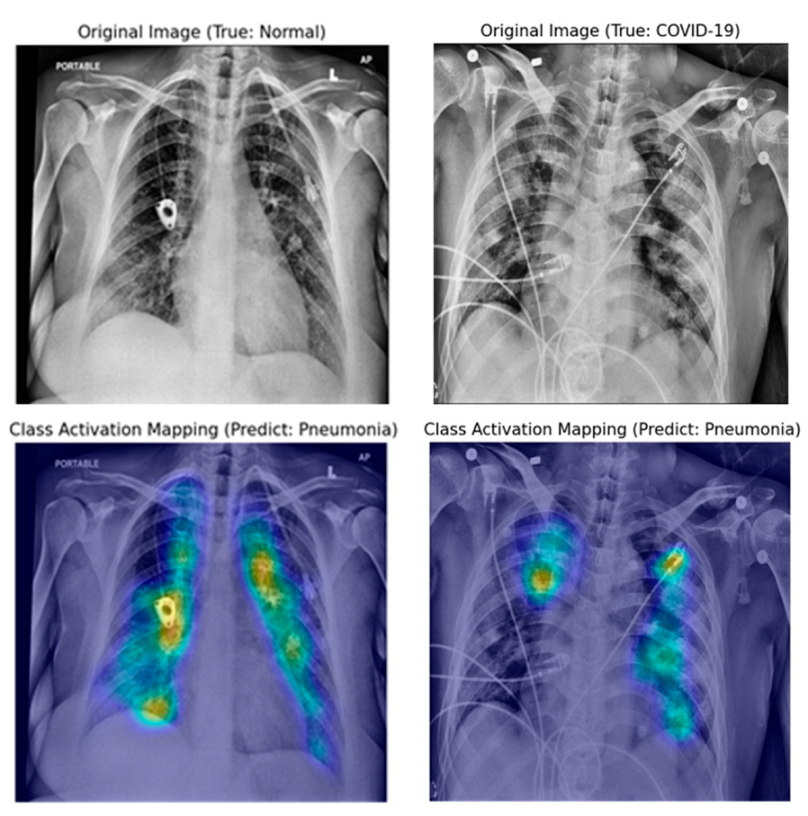
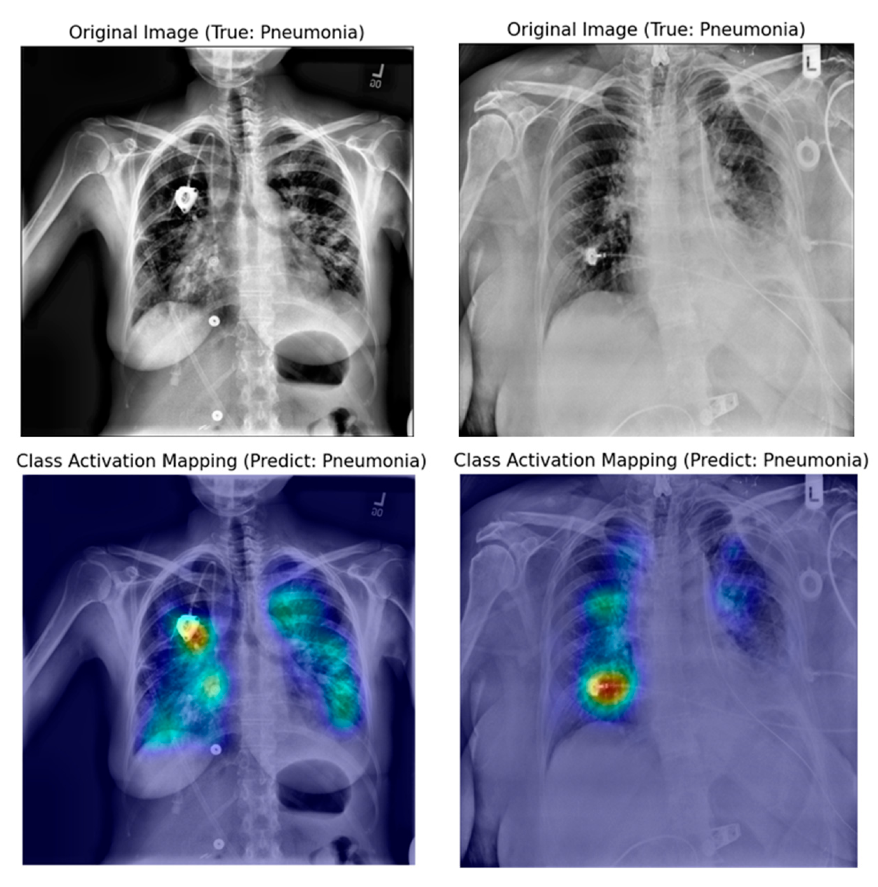
3.2. Interpretation of Model Decision Using Grad-CAM
4. Discussion
4.1. Scalability of Deep CNN
4.2. Degree of Fine-Tuning of Deep CNN
4.3. Visual Interpretation Using Grad-CAM
5. Conclusions
Author Contributions
Funding
Conflicts of Interest
References
- World Health Organization. Coronavirus Disease (COVID-19): Situation Report, 182; World Health Organization: Geneva, Switzerland, 2020. [Google Scholar]
- Wang, W.; Xu, Y.; Gao, R.; Lu, R.; Han, K.; Wu, G.; Tan, W. Detection of SARS-CoV-2 in different types of clinical specimens. JAMA 2020, 323, 1843–1844. [Google Scholar] [CrossRef] [PubMed]
- Yang, Y.; Yang, M.; Shen, C.; Wang, F.; Yuan, J.; Li, J.; Zhang, M.; Wang, Z.; Xing, L.; Wei, J. Laboratory diagnosis and monitoring the viral shedding of 2019-nCoV infections. MedRxiv 2020. [Google Scholar] [CrossRef]
- Kanne, J.P.; Little, B.P.; Chung, J.H.; Elicker, B.M.; Ketai, L.H. Essentials for Radiologists on COVID-19: An Update—Radiology Scientific Expert Panel; Radiological Society of North America: Oak Brook, IL, USA, 2020. [Google Scholar]
- Ai, T.; Yang, Z.; Hou, H.; Zhan, C.; Chen, C.; Lv, W.; Tao, Q.; Sun, Z.; Xia, L. Correlation of chest CT and RT-PCR testing in coronavirus disease 2019 (COVID-19) in China: A report of 1014 cases. Radiology 2020, 296, 200642. [Google Scholar] [CrossRef] [PubMed]
- Kong, W.; Agarwal, P.P. Chest imaging appearance of COVID-19 infection. Radiol. Cardiothorac. Imaging 2020, 2, e200028. [Google Scholar] [CrossRef]
- Rodrigues, J.; Hare, S.; Edey, A.; Devaraj, A.; Jacob, J.; Johnstone, A.; McStay, R.; Nair, A.; Robinson, G. An update on COVID-19 for the radiologist—A British society of Thoracic Imaging statement. Clin. Radiol. 2020, 75, 323–325. [Google Scholar] [CrossRef]
- Zhou, S.K.; Greenspan, H.; Shen, D. Deep Learning for Medical Image Analysis; Academic Press: Cambridge, MA, USA, 2017. [Google Scholar]
- Shen, D.; Wu, G.; Suk, H.-I. Deep learning in medical image analysis. Annu. Rev. Biomed. Eng. 2017, 19, 221–248. [Google Scholar] [CrossRef] [PubMed]
- Wang, L.; Wong, A. COVID-Net: A Tailored Deep Convolutional Neural Network Design for Detection of COVID-19 Cases from Chest X-ray Images. arXiv 2020, arXiv:2003.09871. [Google Scholar]
- Narin, A.; Kaya, C.; Pamuk, Z. Automatic detection of coronavirus disease (covid-19) using X-ray images and deep convolutional neural networks. arXiv 2020, arXiv:2003.10849. [Google Scholar]
- Hemdan, E.E.-D.; Shouman, M.A.; Karar, M.E. Covidx-net: A framework of deep learning classifiers to diagnose covid-19 in X-ray images. arXiv 2020, arXiv:2003.11055. [Google Scholar]
- Farooq, M.; Hafeez, A. Covid-resnet: A deep learning framework for screening of covid19 from radiographs. arXiv 2020, arXiv:2003.14395. [Google Scholar]
- Afshar, P.; Heidarian, S.; Naderkhani, F.; Oikonomou, A.; Plataniotis, K.N.; Mohammadi, A. Covid-caps: A capsule network-based framework for identification of covid-19 cases from X-ray images. arXiv 2020, arXiv:2004.02696. [Google Scholar] [CrossRef] [PubMed]
- Oh, Y.; Park, S.; Ye, J.C. Deep learning covid-19 features on cxr using limited training data sets. IEEE Trans. Med Imaging 2020, 39, 2688–2700. [Google Scholar] [CrossRef] [PubMed]
- Minaee, S.; Kafieh, R.; Sonka, M.; Yazdani, S.; Jamalipour Soufi, G. Deep-COVID: Predicting COVID-19 from chest X-ray images using deep transfer learning. Med. Image Anal. 2020, 65, 101794. [Google Scholar] [CrossRef] [PubMed]
- Apostolopoulos, I.D.; Mpesiana, T.A. Covid-19: Automatic detection from X-ray images utilizing transfer learning with convolutional neural networks. Phys. Eng. Sci. Med. 2020, 43, 635–640. [Google Scholar] [CrossRef]
- Selvaraju, R.R.; Cogswell, M.; Das, A.; Vedantam, R.; Parikh, D.; Batra, D. Grad-cam: Visual explanations from deep networks via gradient-based localization. In Proceedings of the IEEE International Conference on Computer Vision, Venice, Italy, 22–29 October 2017; pp. 618–626. [Google Scholar]
- Chattopadhay, A.; Sarkar, A.; Howlader, P.; Balasubramanian, V.N. Grad-cam++: Generalized gradient-based visual explanations for deep convolutional networks. In Proceedings of the 2018 IEEE Winter Conference on Applications of Computer Vision (WACV), Lake Tahoe, NV, USA, 12–15 March 2018; pp. 839–847. [Google Scholar]
- Radiological Society of North America. RSNA Pneumonia Detection Challenge; Radiological Society of North America: Oak Brook, IL, USA, 2018. [Google Scholar]
- Cohen, J.P.; Morrison, P.; Dao, L. COVID-19 image data collection. arXiv 2020, arXiv:2003.11597. [Google Scholar]
- Chung, A. Figure 1 COVID-19 Chest X-ray Data Initiative. 2020. Available online: https://github.com/agchung/Figure1-COVID-chestxray-dataset (accessed on 4 May 2020).
- Chung, A. Actualmed COVID-19 Chest X-ray Data Initiative. 2020. Available online: https://github.com/agchung/Actualmed-COVID-chestxray-dataset (accessed on 6 May 2020).
- Rahman, T.; Chowdhury, M.; Khandakar, A. COVID-19 Radiography Database; Kaggle: San Francisco, CA, USA, 2020. [Google Scholar]
- Stark, J.A. Adaptive image contrast enhancement using generalizations of histogram equalization. IEEE Trans. Image Process. 2000, 9, 889–896. [Google Scholar] [CrossRef] [PubMed]
- Ferreira, J.R.; Cardenas, D.A.C.; Moreno, R.A.; de Sá Rebelo, M.d.F.; Krieger, J.E.; Gutierrez, M.A. Multi-View Ensemble Convolutional Neural Network to Improve Classification of Pneumonia in Low Contrast Chest X-ray Images. In Proceedings of the 2020 42nd Annual International Conference of the IEEE Engineering in Medicine & Biology Society (EMBC), Montreal, QC, Canada, 20–24 July 2020; pp. 1238–1241. [Google Scholar]
- Ntirogiannis, K.; Gatos, B.; Pratikakis, I. A combined approach for the binarization of handwritten document images. Pattern Recognit. Lett. 2014, 35, 3–15. [Google Scholar] [CrossRef]
- Singh, R.K.; Pandey, R.; Babu, R.N. COVIDScreen: Explainable deep learning framework for differential diagnosis of COVID-19 using chest X-rays. Res. Sq. 2020. [Google Scholar] [CrossRef]
- Simonyan, K.; Zisserman, A. Very deep convolutional networks for large-scale image recognition. arXiv 2014, arXiv:1409.1556. [Google Scholar]
- Litjens, G.; Kooi, T.; Bejnordi, B.E.; Setio, A.A.A.; Ciompi, F.; Ghafoorian, M.; Van Der Laak, J.A.; Van Ginneken, B.; Sánchez, C.I. A survey on deep learning in medical image analysis. Med. Image Anal. 2017, 42, 60–88. [Google Scholar] [CrossRef]
- Yosinski, J.; Clune, J.; Bengio, Y.; Lipson, H. How transferable are features in deep neural networks? In Proceedings of the Advances in Neural Information Processing Systems (NIPS 2014), Montreal, QC, Canada, 8–13 December 2014; pp. 3320–3328. [Google Scholar]
- Pan, S.J.; Yang, Q. A survey on transfer learning. IEEE Trans. Knowl. Data Eng. 2009, 22, 1345–1359. [Google Scholar] [CrossRef]
- Stone, M. Cross-validatory choice and assessment of statistical predictions. J. R. Stat. Soc. Ser. B Methodol. 1974, 36, 111–133. [Google Scholar] [CrossRef]
- Cawley, G.C.; Talbot, N.L. On over-fitting in model selection and subsequent selection bias in performance evaluation. J. Mach. Learn. Res. 2010, 11, 2079–2107. [Google Scholar]
- Steyerberg, E.W.; Harrell, F.E. Prediction models need appropriate internal, internal–external, and external validation. J. Clin. Epidemiol. 2016, 69, 245–247. [Google Scholar] [CrossRef]
- Chollet, F. Keras: The python deep learning library. ascl, 2018; ascl: 1806.1022. [Google Scholar]
- Abadi, M.; Agarwal, A.; Barham, P.; Brevdo, E.; Chen, Z.; Citro, C.; Corrado, G.S.; Davis, A.; Dean, J.; Devin, M. Tensorflow: Large-scale machine learning on heterogeneous distributed systems. arXiv 2016, arXiv:1603.04467. [Google Scholar]
- Ouchicha, C.; Ammor, O.; Meknassi, M. CVDNet: A novel deep learning architecture for detection of coronavirus (Covid-19) from chest X-ray images. ChaosSolitons Fractals 2020, 140, 110245. [Google Scholar] [CrossRef]
- Bressem, K.K.; Adams, L.; Erxleben, C.; Hamm, B.; Niehues, S.; Vahldiek, J. Comparing Different Deep Learning Architectures for Classification of Chest Radiographs. arXiv 2020, arXiv:2002.08991. [Google Scholar]
- Marques, G.; Agarwal, D.; de la Torre Díez, I. Automated medical diagnosis of COVID-19 through EfficientNet convolutional neural network. Appl. Soft Comput. 2020, 96, 106691. [Google Scholar] [CrossRef]
- Tajbakhsh, N.; Shin, J.Y.; Gurudu, S.R.; Hurst, R.T.; Kendall, C.B.; Gotway, M.B.; Liang, J. Convolutional neural networks for medical image analysis: Full training or fine tuning? IEEE Trans. Med. Imaging 2016, 35, 1299–1312. [Google Scholar] [CrossRef]
- Singh, R.; Kalra, M.K.; Nitiwarangkul, C.; Patti, J.A.; Homayounieh, F.; Padole, A.; Rao, P.; Putha, P.; Muse, V.V.; Sharma, A. Deep learning in chest radiography: Detection of findings and presence of change. PLoS ONE 2018, 13, e0204155. [Google Scholar] [CrossRef] [PubMed]


| Class | Reference | Samples |
|---|---|---|
| Normal | RSNA pneumonia detection challenge [20] | 607 |
| Pneumonia | RSNA pneumonia detection challenge [20] | 607 |
| COVID-19 | COVID-19 image data collection [21] | 468 |
| Figure 1 COVID-19 Chest X-ray [22] | 35 | |
| Actualmed COVID-19 Chest X-rays [23] | 58 | |
| COVID-19 Radiography Database [24] | 46 | |
| Total | 1821 |
| CNN Models | Number of Fine-Tuning Blocks | Accuracy | Specificity | Sensitivity | AUC | |
|---|---|---|---|---|---|---|
| VGG-16 | 0 | N | 0.871 | 0.909 | 0.793 | 0.851 |
| P | 0.832 | 0.814 | 0.868 | 0.841 | ||
| C | 0.906 | 0.883 | 0.752 | 0.868 | ||
| 1 | N | 0.873 | 0.884 | 0.851 | 0.868 | |
| P | 0.884 | 0.913 | 0.826 | 0.870 | ||
| C | 0.945 | 0.979 | 0.876 | 0.928 | ||
| 2 | N | 0.901 | 0.930 | 0.842 | 0.886 | |
| P | 0.909 | 0.921 | 0.884 | 0.903 | ||
| C | 0.959 | 0.975 | 0.925 | 0.950 | ||
| 3 | N | 0.884 | 0.888 | 0.876 | 0.882 | |
| P | 0.884 | 0.909 | 0.835 | 0.872 | ||
| C | 0.939 | 0.983 | 0.851 | 0.917 | ||
| 4 | N | 0.901 | 0.934 | 0.835 | 0.884 | |
| P | 0.862 | 0.847 | 0.893 | 0.870 | ||
| C | 0.928 | 0.988 | 0.810 | 0.899 | ||
| 5 | N | 0.873 | 0.905 | 0.810 | 0.857 | |
| P | 0.796 | 0.748 | 0.893 | 0.820 | ||
| C | 0.857 | 0.992 | 0.587 | 0.789 | ||
| VGG-19 | 0 | N | 0.873 | 0.971 | 0.678 | 0.824 |
| P | 0.804 | 0.777 | 0.860 | 0.818 | ||
| C | 0.904 | 0.938 | 0.835 | 0.886 | ||
| 1 | N | 0.893 | 0.913 | 0.851 | 0.882 | |
| P | 0.857 | 0.893 | 0.785 | 0.836 | ||
| C | 0.926 | 0.950 | 0.876 | 0.913 | ||
| 2 | N | 0.882 | 0.909 | 0.826 | 0.868 | |
| P | 0.868 | 0.905 | 0.793 | 0.849 | ||
| C | 0.937 | 0.950 | 0.909 | 0.930 | ||
| 3 | N | 0.879 | 0.897 | 0.843 | 0.870 | |
| P | 0.847 | 0.876 | 0.777 | 0.826 | ||
| C | 0.920 | 0.959 | 0.843 | 0.901 | ||
| 4 | N | 0.860 | 0.872 | 0.835 | 0.853 | |
| P | 0.840 | 0.876 | 0.769 | 0.822 | ||
| C | 0.915 | 0.963 | 0.818 | 0.890 | ||
| 5 | N | 0.862 | 0.864 | 0.860 | 0.862 | |
| P | 0.835 | 0.888 | 0.727 | 0.808 | ||
| C | 0.912 | 0.955 | 0.826 | 0.890 |
Publisher’s Note: MDPI stays neutral with regard to jurisdictional claims in published maps and institutional affiliations. |
© 2020 by the authors. Licensee MDPI, Basel, Switzerland. This article is an open access article distributed under the terms and conditions of the Creative Commons Attribution (CC BY) license (http://creativecommons.org/licenses/by/4.0/).
Share and Cite
Lee, K.-S.; Kim, J.Y.; Jeon, E.-t.; Choi, W.S.; Kim, N.H.; Lee, K.Y. Evaluation of Scalability and Degree of Fine-Tuning of Deep Convolutional Neural Networks for COVID-19 Screening on Chest X-ray Images Using Explainable Deep-Learning Algorithm. J. Pers. Med. 2020, 10, 213. https://doi.org/10.3390/jpm10040213
Lee K-S, Kim JY, Jeon E-t, Choi WS, Kim NH, Lee KY. Evaluation of Scalability and Degree of Fine-Tuning of Deep Convolutional Neural Networks for COVID-19 Screening on Chest X-ray Images Using Explainable Deep-Learning Algorithm. Journal of Personalized Medicine. 2020; 10(4):213. https://doi.org/10.3390/jpm10040213
Chicago/Turabian StyleLee, Ki-Sun, Jae Young Kim, Eun-tae Jeon, Won Suk Choi, Nan Hee Kim, and Ki Yeol Lee. 2020. "Evaluation of Scalability and Degree of Fine-Tuning of Deep Convolutional Neural Networks for COVID-19 Screening on Chest X-ray Images Using Explainable Deep-Learning Algorithm" Journal of Personalized Medicine 10, no. 4: 213. https://doi.org/10.3390/jpm10040213
APA StyleLee, K.-S., Kim, J. Y., Jeon, E.-t., Choi, W. S., Kim, N. H., & Lee, K. Y. (2020). Evaluation of Scalability and Degree of Fine-Tuning of Deep Convolutional Neural Networks for COVID-19 Screening on Chest X-ray Images Using Explainable Deep-Learning Algorithm. Journal of Personalized Medicine, 10(4), 213. https://doi.org/10.3390/jpm10040213