Abstract
Inactivity, lack of sleep, and poor nutrition predispose individuals to health risks. Patient-Reported Outcomes (PROs) assess physical behaviours and psychological states but are subject of self-reporting biases. Conversely, wearables are an increasingly accurate source of behavioural Technology-Reported Outcomes (TechROs). However, the extent to which PROs and TechROs provide convergent information is unknown. We propose the coQoL PRO-TechRO co-calibration method and report its feasibility, reliability, and human factors influencing data quality. Thirty-nine seniors provided 7.4 ± 4.4 PROs for physical activity (IPAQ), social support (MSPSS), anxiety/depression (GADS), nutrition (PREDIMED, SelfMNA), memory (MFE), sleep (PSQI), Quality of Life (EQ-5D-3L), and 295 ± 238 days of TechROs (Fitbit Charge 2) along two years. We co-calibrated PROs and TechROs by Spearman rank and reported human factors guiding coQoL use. We report high PRO—TechRO correlations ( ≥ 0.8) for physical activity (moderate domestic activity—light+fair active duration), social support (family help—fair activity), anxiety/depression (numeric score—sleep duration), or sleep (duration to sleep—sleep duration) at various durations (7–120 days). coQoL feasibly co-calibrates constructs within physical behaviours and psychological states in seniors. Our results can inform designs of longitudinal observations and, whenever appropriate, personalized behavioural interventions.
1. Introduction
Chronic diseases represent a significant share of the burden of disease globally [1]. They are responsible for 86% of all deaths [2]. In Europe, chronic diseases affect over 80% of adults over 65 and incur 70% of the increasing healthcare costs [3]. The most common chronic diseases are cardiovascular, pancreatic, pulmonary, and neoplastic. Unhealthy lifestyle and behaviours, such as physical inactivity, insufficient sleep, poor nutrition, and tobacco intake, explain up to 50% of the risk of chronic disease [4]. We expect the importance of the long-term risk of disease to increase as the world population is ageing [5]. As age dramatically contributes to the risk of multiple diseases [1], the healthy old is a population both inherently at risk and appropriate for primary disease prevention.
Currently, human health studies assess behaviours through a combination of self-reported outcomes [6], in particular patient-reported outcomes (PRO, [6]), and, more recently, patient-generated technology-reported outcomes (TechRO, [6]). Patient-reported outcomes include questionnaires with validated scales that assess individual outcomes momentarily or for a given recall period (e.g., “During the past month, how often have you had trouble sleeping?”). However, self-reports are known to be the subject of biases related to the inherent shortcomings of participant reporting. The questionnaires are inconvenient, infrequent, memory-biased, socially conditioned, and qualitative. For example, seniors reporting physical activity tend to overestimate the amount undertaken [7], while subjective sleep is less reliable than objective sleep according to studies of sleep, ageing, and cognition [8,9].
In an attempt to address the shortcomings of self-reports and based on technological advances, we propose the coQoL PRO-TechRO co-calibration method. Our research primarily focuses on assessing behaviours and outcomes by combining questionnaires with devices such as smartphones and wearables, assessing multiple outcomes (e.g., physical activity, sleep, and heart rate) momentarily, and, if collected for a long time, also longitudinally [10]. Numerous studies used validated, expensive, and bulky lab-grade devices (e.g., ActiGraph), although for a limited time due to the user burden and discomfort of wearing them [11]. Conversely, consumer-friendly wearables measure continuously and objectively TechROs, increasingly more accurately, as technology progresses [12]. Also, more individuals opt for consumer-friendly wearable devices; the market size for consumer wearables will likely double by 2022 [13]. More recent research showed that consumer wearables could assess multiple behaviours accurately [14], unobtrusively [15], and continuously [16] while worn by participants during the natural unfolding of their daily lives. Overall, consumer devices are accurate and used enough to be leveraged in human health studies.
There exist prior work aiming at co-calibration of physical and psychological outcomes with technology-related ones, as discussed in this paper. We identify the previous work by following by following a semi-structured literature review detailed in Appendix A.1. Table 1 presents the PRO-TechRO co-calibration studies resulting from our literature review for the following outcomes: physical activity, social support, anxiety and depression, memory, sleep, and health-related Quality of Life. For each study, the table presents the PROs and TechROs used for co-calibration, the study design, the analysis methodology, and a summary of results. As for the PRO, the table presents the long names of the PRO instruments leveraged in the study, followed by the TechRO details, at least including the name and its form factor (consumer wearable or research-grade accelerometer, and position on the body). The study design details include its target population, sample size and age, and study duration. Past co-calibration methods range from simple descriptive statistics to inferential statistics via correlation methods, to machine learning, including regression and classification. The results bring a summary of PRO-TechRO co-calibration efforts, as presented in the paper.

Table 1.
Previous PRO-TechRO Co-Calibration Studies.
To better emphasize the difference between state of the art and our work, we recall that we focus on healthy seniors and our method implies repeated sets of different PRO assessments in longitudinal daily life TechRO assessment settings, based on consumer wearables. All studies presented in Table 1 have at least one feature (marked in violet) that excludes them from co-calibrating PRO questionnaires with TechRO consumer wearables in healthy seniors in the wild over long periods (above the typical 7–14 days found in the literature).
Table 1 does not include studies on nutrition, since, to our best knowledge, the co-calibration of the diet with distant measures such as steps or sleep using questionnaire PROs and consumer wearables (or, at the very least, accelerometers) does not exist in the literature. However, there are numerous articles on energy expenditure estimates measured by consumer wearables that guide the energy intake (food types and qualities) for individuals following dietary recommendations [17,18,19].
As can be seen from Table 1, most studies focus on specific PROs suitable for the study aim; some of the PROs are disease-specific, which also relate to the user groups in the study (e.g., students, patients with a given condition). As for the TechROs, we observe few research-grade wearables, and many consumer-grade ones (Fitbit); mostly worn as wearable bracelets. The study design is characterized by diverse sample sizes (20–70, with very few examples of 500+ participants) and usually very short duration (7 days or less, very few beyond three weeks). We can call these co-calibration efforts momentary, as valid in these specific periods, for which the data was collected. The co-calibration method themselves used usually leverage descriptive statistical methods and correlations. The results of these co-calibrations rarely report values ≥0.5. In summary, little research focused on assessing the relationships between sets of different outcomes assessed via PROs and consumer wearable TechROs in healthy seniors, in the wild, for extended periods (beyond the typical study duration of 7–14 days).
Our paper is the result of research conducted as part of the EU AAL Caregiver and ME (CoME, No. 14-7, 2017–2020) research project and software application. CoME aimed at self-management of health for individuals of old age at risk of mild cognitive impairments and their informal caregivers [20]. The project used numerous PROs to obtain a holistic view of the participants’ health and wellbeing, by covering constructs that are both reflective (physical activity, anxiety, depression, memory, sleep) and formative (nutrition and social support) for the individual’s Quality of Life (QoL) [21]. These constructs assess participants’ health state and correspond to behavioural risk factors of dementia, as guided by the goals of the project [22,23,24,25].
Our study involved 42 seniors from Hungary and Spain. The seniors provided PROs on questionnaires chosen by the consortium of the CoME project partners along [22]. The measured outcomes included physical activity (using the International Physical Activity Questionnaire Long, or IPAQ [26]), social support (Multidimensional Scale of Social Support, MSPSS [27]), anxiety and depression (Goldberg Anxiety and Depression Scale, GADS [28]), nutrition (Prevention with Mediterranean Diet, PREDIMED [29,30] and Self-Reported Mini Nutritional Assessment, SelfMNA [31]), memory (Memory Failures of Everyday, MFE [32]), sleep (Pittsburgh Sleep Quality Index, PSQI [33]), and health-related Quality of Life (EuroQoL with five dimensions and three levels, EQ-5D-3L [34]) (Appendix B.1.1 describes the questionnaires and their validated scales in depth). Participants also provided TechROs of physical activity, sleep, and heart rate (Fitbit Charge 2 consumer wearable, [35]) during the study, for up to two years.
Our paper has three objectives. First, we aim at demonstrating the feasibility of our co-calibration method, coQoL, by quantifying relationships between PROs and TechROs for our sample. Second, we aim at assessing the quality of the data collected while daily life unfolded for our participants. Third, we aim at informing the design of observational (and potentially interventional) personalized behavioural studies by leveraging the results from the first two objectives.
2. Materials and Methods
In this section, we describe the coQoL method applied within our study context (Section 2.1), participants (Section 2.2), protocol (Section 2.3), measured outcomes (Section 2.4), and data analysis (Section 2.5).
2.1. Study Context
We conducted this research as part of the EU AAL Caregiver and ME (CoME, No. 14-7), a research project and software application (2017–2020) aimed at self-management of health for individuals of old age at risk of mild cognitive impairments and their informal caregivers [20]. The goals of the CoME project were (1) to relieve the caregiver pressure through monitoring of physical, intellectual, emotional, and social wellbeing of the persons in need of care and (2) to increase seniors’ wellbeing and autonomy in their environment and lower the risk of dementia [62] and healthcare costs in the long term. We achieved the goals by monitoring the seniors’ state, behaviours (including physical activity and sleep), and other factors that influence the risk of dementia [22]. The study was purely observational; it did not include any behaviour intervention elements.
2.2. Study Participants
Individuals of older age, owning a smartphone or willing to use a smartphone provided to them, were invited to the care centre in their city (Spain and Hungary) to participate in the study. Forty-two individuals (mean age 69.8 ± 7.4) agreed to join CoME from January 2017 to December 2019.
2.3. Study Protocol
All individuals were informed about the study goals and gave their written informed consent for inclusion before the start of the study. We conducted the study under the Declaration of Helsinki. The institutional review board at the University of Geneva (Switzerland) approved the protocol (CoME, No. 14-7) on April 28, 2016. The study protocol pseudonymized all participant identities.
Upon the first visit at the care centre, the participants attended an informational workshop about the project aims. They received Fitbit Charge 2 wearable devices as their own (for the study duration and beyond). Furthermore, they filled a profile questionnaire and registered personal accounts in the CoME software application. Then they associated the Fitbit wearables to their accounts.
In the first and subsequent visits spread through a few months to a year from January 2017 to December 2019, the participants answered several questionnaires (PROs). Whenever needed, they were assisted by caregivers through this process. However, the participants were not explicitly informed about when they will have filled which of the questionnaires to avoid any activity pattern change before the visit.
2.4. Measured Outcomes
The study collected PROs from questionnaires with validated scales and TechROs from Fitbit Charge 2 consumer wearables. The PROs and TechROs were then co-calibrated by using the coQoL method illustrated in Figure 1.
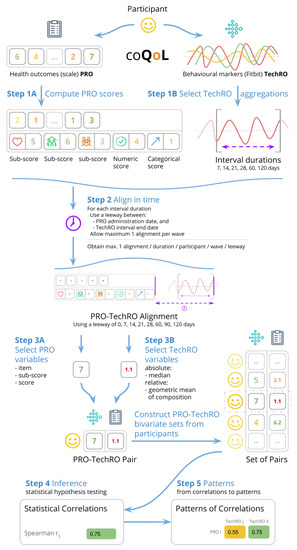
Figure 1.
coQoL: a method for PRO and TechRO co-calibration (example for MSPSS PRO).
2.4.1. Patient-Reported Outcomes (Profile)
At the first visit, in the profile, participants provided their age, gender, ethnicity, profession, education, cohabitants status, height, weight, blood pressure, cholesterol, smoking, alcohol, medication (hypertension), history of personal health issues (diabetes, apnea, insomnia, hyperglycemia, stroke, infarct, depression), and history of family health issues (hypertension, diabetes, stroke, heart attack, dementia).
We included in the analysis participants who self-reported mild disease. We selected participants into three health groups: (1) all participants (denoted as the all health group), (2) only the healthy participants (healthy), and (3) only those with mild disease (diseased).
2.4.2. Patient-Reported Outcomes (PROs)
During several study visits, the participants provided answers to questionnaires for eight PROs: physical activity (IPAQ), social support (MSPSS), anxiety and depression (GADS), nutritional adherence to the Mediterranean diet (PREDIMED), nutrition (SelfMNA), memory (MFE), sleep (PSQI), and health-related QoL (EQ-5D-3L). Appendix B.1.1 describes the questionnaires in depth.
We administered the questionnaires in the languages of the respondents (Spanish or Hungarian). Appendix B.1.2 elaborates on the administration of the questionnaires.
The days of administration resulted in distinct periods of answers separated by a few months to one year. We denote these periods as waves of participation.
We coded the answers and computed the scores (and sub-scores, where available) according to the validated scale of each questionnaire. This procedure is depicted as Step 1A in Figure 1. Appendix B.1.3 provides details on the scoring.
We derived for the analysis the following PRO-based variables: (1) the individual questions in the questionnaire (denoted items), the sub-scores (where available), and the scores (where available). Most scales have a numeric score and a categorical score. Most sub-scores are numeric.
This procedure corresponds to Step 3A in Figure 1. All variables can be seen in Table 2. Appendix B.1.4 details the variable derivation for PROs.
Table 2.
Variables derived from the PROs.
2.4.3. Technology-Reported Outcomes (TechROs)
We collected the behavioural wearable markers from the daily aggregates provided by the Fitbit daily activity summary application programmable interface (API) [63]. Appendix B.2.1 motivates our choice for Fitbit as a personal wearable activity monitor in the context of our study.
We processed the wearable data by aggregating it over consecutive days in aggregate intervals spanning from 7 to 120 days. We included in the analysis only days with at least 21 hours of Fitbit measurement as valid days. Then we required each aggregate interval to have at least valid days. This procedure corresponds to Step 1B in Figure 1. Appendix B.2.2 details the data processing.
The Fitbit consumer wearables provided TechROs as raw (energy expenditure, steps, heart rate) and processed according to Fitbit’s internal activity recognition algorithms (sedentary duration, durations of physical activity at the light, fair, and vigorous intensities, and sleep) [35].
We derived TechRO-based variables in two amounts. The absolute amount refers to the TechROs enumerated above. For this amount, we computed for each interval the median of daily measurements.
We derived the relative amount variables from the total daily durations of physical activity (and, separately, physical activity and sleep for all 24 h [64]), transformed into compositions [65], and expressed as centred log-ratios (CLR). For this amount, we computed for each interval the geometric mean of the daily compositions.
Each amount has two families. The absolute amount has the (absolute) raw family (for energy expenditure, steps, and heart rate) and the (absolute) processed family (for the durations of sleep and physical activity at the four intensities reported by Fitbit: sedentary, light, fair, and vigorous). As Fitbit had not provided thresholds for the reported physical activity intensities (see [66,67,68]), we also included cumulative variables of adjacent pairs of intensities, e.g., light+fair. Furthermore, we included a total daily active duration that added all non-sedentary intensity durations.
The relative amount has the (relative) centred log-ratio for physical activity family (CLR PA) that adds for each day the durations of physical activity at the four intensities above, and the (relative) centred log-ratio for physical activity and sleep family (CLR PA+S) that adds for each day the durations of physical activity (four intensities) and sleep.
This procedure corresponds to Step 3B in Figure 1. All variables can be seen in Table 3. Appendix B.2.3 provides details on the variable derivation for TechROs.
Table 3.
Variables derived from the TechROs.
2.4.4. Co-Calibration (PROs vs. TechROs)
We co-calibrated PROs with TechROs by alignment. Concretely, for a PRO variable to align to a TechRO variable, the administration date of the former must have been within a set duration (0–120 days) from the end date of the latter.
To account for small samples, we allowed a leeway (0–120 days) between the end of the TechRO monitoring interval and the PRO scale administration date.
For each participant, we included only the last alignment in a wave, to discard repeated answers within a few minutes and reduce bias towards overly diligent responders.
When we aligned PROs with TechROs of increasing durations, the number of paired observations decreased; we thus required a minimum of 10 observations to have a nontrivial size [69].
For each PRO-TechRO pair, we reported the highest correlation among all aggregation intervals of TechRO (7–120 days) aligned to match the PRO administration date. We included only significant correlations, i.e., those correlation coefficients whose 95% confidence interval maintained sign. This procedure corresponds to Step 2 in Figure 1. Appendix B.3 elaborates on the details of the PRO-TechRO variable alignment.
2.5. Data Analysis
We conducted descriptive and inferential analyses of the PROs and TechROs. We then analyzed patterns from the analyses.
2.5.1. Descriptive Analysis (PROs and TechROs)
The descriptive analysis consisted of summary statistics (median, mean, and standard deviation, or SD) based on groups of participant-wave characteristics. In our study, we analyzed the participants by their health, country, and gender self-reported groups. For PROs, we observed the statistics across waves. Appendix B.1 elaborates on the analysis of the PRO variables. For TechROs, we observed the statistics across the entire study period and by counting valid days, described in depth in Appendix B.2. Appendix B.3.1 details the descriptive analysis procedure.
2.5.2. Inferential Analysis (PROs vs. TechROs)
We co-calibrated PRO variables with TechRO variables by applying the Spearman [70] statistical test on each pair of PRO-TechRO variables resulting from the alignments. The Spearman statistical correlation coefficient measures the direction and strength of the association between two variables. We used the SciPy library [71] to implement the Spearman correlations. Appendix B.3.2 elaborates on the motivation and assumptions for the inferential analysis. This procedure corresponds to Step 4 in Figure 1.
2.5.3. Pattern Analysis (PROs vs. TechROs)
We used the results from the inferential analysis to highlight informative PRO variables and pairs of PRO-TechRO. This procedure corresponds to Step 5 in Figure 1. We employed two metrics that focus on the number of correlations (a high number of significant correlations with TechRO variables indicates that the PRO variable is informative) and the quality of the correlations (where possible, a strong significant correlation with other significant correlations in its vicinity indicates that the PRO-TechRO correlation is informative).
The first metric, denoted total, counts all strong correlations ( ≥ 0.5) for a given PRO variable and highlights those PRO variables that correlate with the most TechRO variables. We applied this metric to all PRO variables.
The second metric, denoted contour, can only apply for variables that can be ordered by a criterion. For our study, we ordered TechRO physical activity variables by their intensities (from sedentary to vigorous). We applied this metric on strong and significant correlations ( ≥ 0.8) between a PRO and a TechRO physical activity intensity variable. The metric counted the maximum number of adjacent significant correlations of the same PRO variable (at lower and, separately, higher intensities) such that they would form a contiguous sequence of significant correlations that maintained the sign. Appendix B.3.3 further explains and exemplifies this metric.
3. Results
In this section, we report the results from the study participants (Section 3.1) and analyses (descriptive in Section 3.2, inferential in Section 3.3, and patterns in Section 3.4) as well as two use case examples for coQoL (Section 3.5).
3.1. Study Participants
Forty-two seniors (mean age 69.8 ± 7.4) signed up for the study. From these, 39 participants (mean age 70.0 ± 7.2, 22 women, 26 from Spain 26 and 13 from Hungary) provided at least one PRO; three participants were disqualified. Out of the qualified participants, 28 reported no health condition (thus being in the healthy health group) and 11 reported a mild health condition (forming the diseased health group). Participant characteristics are available in Table 4.
Table 4.
Characteristics of Study Participants.
3.2. Descriptive Analysis (PROs and TechROs)
3.2.1. Patient-Reported Outcomes (Questionnaires)
Three waves of PRO participation resulted from January 2017 to December 2019: wave 1 (mid-2018), wave 2 (end-2018 and start-2019), and wave 3 (mid-2019). Table 5 illustrates the waves of participation for each participant and questionnaire.
Table 5.
PRO count answers by wave and questionnaire ( participants).
Figure 2 and Figure 3 depict the numeric scores for all patient-reported outcome scales. Appendix B.1 details the results in-depth for each PRO variable.
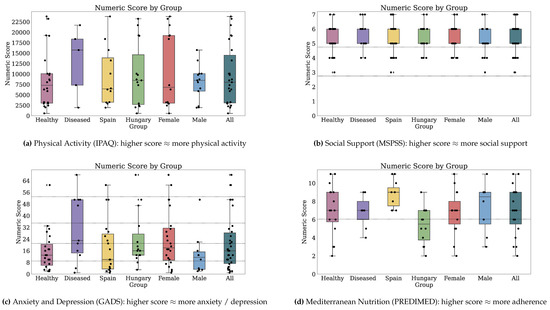
Figure 2.
Numeric scores for Physical Activity, Social Support, Anxiety and Depression, and Mediterranean Nutrition. Dotted markings delimit levels of the categorical score, where available (1 of 2).
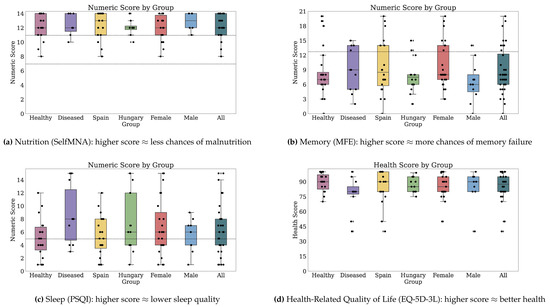
Figure 3.
Numeric scores for Nutrition, Memory, Sleep, and Health-Related Quality of Life. Dotted markings delimit levels of the categorical score, where available (2 of 2).
3.2.2. Technology-Reported Outcomes (Fitbit)
Thirty-two participants provided both PROs and TechROs. Figure 4 and Figure 5 depict the counts of participants by monitored and valid Fitbit days, respectively. Figure 6 and Figure 7 depict the distribution of monitored and valid Fitbit days, respectively. Figure 8 and Figure 9 depict the medians of TechROs across the entire monitoring period for the participants. Appendix B.2 provides additional details on compliance and analyses each TechRO in-depth.
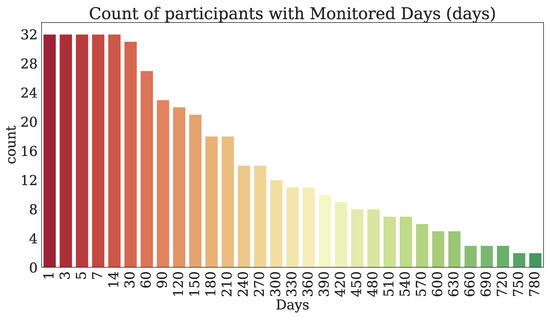
Figure 4.
Count of seniors with at least the given monitored days of Fitbit (TechRO).

Figure 5.
Count of seniors with at least the given valid days of Fitbit (TechRO).
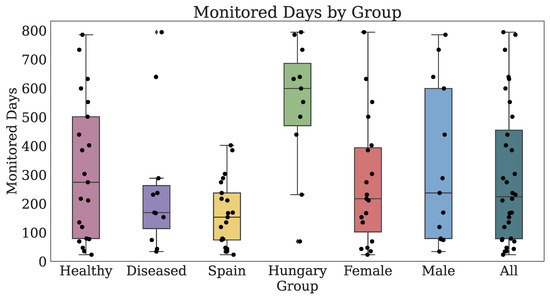
Figure 6.
Days of Fitbit (TechRO) monitored days for seniors with at least one PRO.
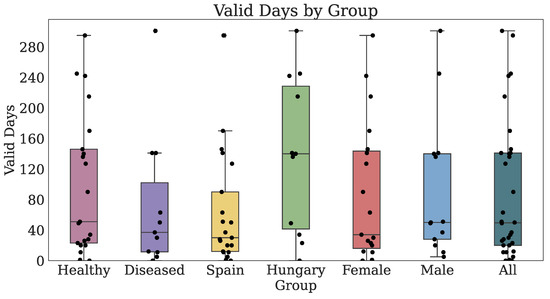
Figure 7.
Days of Fitbit (TechRO) valid days data for seniors with at least one PRO.
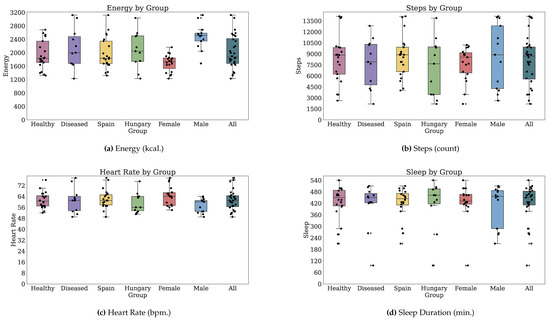
Figure 8.
Median values of TechROs (Fitbit) across the entire monitoring period: energy, steps, heart rate, and sleep (1 of 2).
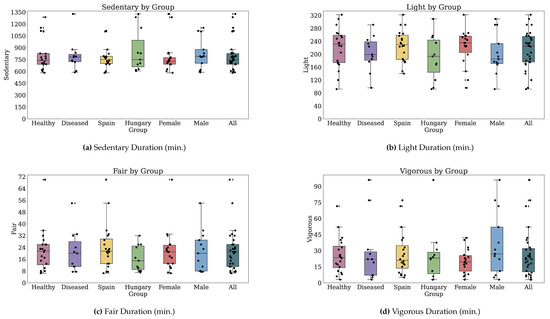
Figure 9.
Median values of TechROs (Fitbit) across the entire monitoring period: physical activity (2 of 2).
3.3. Inferential Analysis (PROs vs. TechROs)
Appendix C.2 elaborates on the Spearman rank correlations resulted from the inferential analysis on each questionnaire and PRO-TechRO variable pair.
3.4. Pattern Analysis (PROs vs. TechROs)
We report further the results of the pattern analysis for each questionnaire: physical activity (Section 3.4.1), social support (Section 3.4.2), anxiety and depression (Section 3.4.3), Mediterranean nutrition (Section 3.4.4), nutrition (Section 3.4.5), memory (Section 3.4.6), sleep (Section 3.4.7), and health-related Quality of Life (Section 3.4.8).
3.4.1. coQoL for Physical Activity (IPAQ vs. Fitbit)
We report the correlations of PRO physical activity variables (IPAQ) with TechRO variables (Fitbit) by using the total and contour metrics.
Physical Activity Outcomes by Total Numbers of Correlations
Table 6 highlights the PROs that correlated with the most TechROs ( ≥ 0.5) across all TechRO families by health group.
Table 6.
PROs with high total count of significant Spearman correlations ( ≥ 0.5) with TechROs.
In the health group with all participants, when assessing totals of correlations, PRO moderate activity in the domestic, garden, and leisure domains correlated with the most TechROs (Table 6).
In the group with healthy participants, PRO moderate activity in the domestic and garden domains had the most correlations with TechROs as well. The domestic moderate and garden moderate activity were also the only two PROs highlighted by the total metric in the groups with all and healthy participants.
In the group with diseased participants, PRO vigorous in the garden and leisure domains correlated with the most TechROs, followed by the PRO moderate and vigorous activities in the work domain (Table 6).
Physical Activity Outcomes by Contours of Correlations
We report the strong correlations ( ≥ 0.8) and their contours between PRO variables (IPAQ) and TechRO variables (Fitbit) in Table 7.
Table 7.
Summary of strong and significant Spearman rank correlations ( ≥ 0.8) between PROs of physical activity (IPAQ scale) and TechROs (Fitbit wearable).
In the health group with all participants, when assessing strong correlations, the PRO domestic moderate activity had a small contour of correlations with the TechRO light+fair physical activity. Also, the PRO work vigorous activity may explain the TechRO active duration without a contour (Table 7, rows with Health: All).
In the group with healthy participants, only two strong correlations emerged without contours. PRO work moderate and total activity correlated with the TechRO fair activity duration (Table 7, rows with Health: Healthy).
In the group with diseased participants, we found numerous correlations with and without contours in the work domain. A positive relationship with a broad contour occurred between PRO work moderate activity and TechRO fair activity duration. Furthermore, PRO work moderate activity correlated negatively with TechRO sedentary duration. However, work activity at the two extreme intensities (walking and vigorous) also correlated negatively with relative light activity (Table 7, rows with Health: Diseased and PRO Domain: Work).
For the PRO garden domain, PRO vigorous activity correlated negatively with contours with TechRO relative sedentary and light activity, indicating that it may redistribute physical activity across the other intensities over the day (Table 7, rows with Health: Diseased and PRO Domain: Garden).
For the PRO leisure domain, walking activity correlated without contours with energy and steps. PRO leisure vigorous activity correlated positively with TechRO fair+vigorous activity durations and negatively with TechRO absolute sedentary and relative light durations. The PRO leisure total activity had a correlation with contour consistent with the previous correlation: negative relationship with TechRO sedentary+light activity (Table 7, rows with Health: Diseased and PRO Domain: Leisure).
The PRO vigorous activity in the work domain appeared in both groups with all and diseased participants. However, its correlations were divergent: for all participants, the work vigorous associated with the total daily activity, while for the mildly diseased, it may replace light activity. The moderate activity at work had inverse relations with fair activity for diseased (positive) and healthy (negative) participants. However, for the diseased, the correlation had a broad contour, while for the healthy it had none. In this case, the latter relation may have been a false positive (Table 7, rows with PRO Domain: Work).
Across numerous PROs, the TechRO of sedentary activity correlated strongly only for diseased participants and mostly in relative families. PRO moderate to vigorous activity at work, in the garden, and for leisure all negatively correlated with TechRO daily sedentary duration. These results indicate that moderate activity may contribute to lower measured TechRO sedentary duration, but the redistributions of daily time to other TechRO intensities may vary between TechRO fair and vigorous intensities. (Table 7, rows with Health: Diseased and TechRO Variable: Sedentary).
Physical Activity Outcomes Highlighted by Both Metrics
Physical Activity Outcomes Interpretation
In the health group with all participants, we observed several “expected” correlations. The PRO domestic moderate activity associated with the TechRO absolute light+fair activity duration. This effect is only visible for the total metric, indicating that PRO domestic and garden moderate activity may redistribute physical activity across numerous TechRO intensities.
In the group with diseased participants, PRO work moderate associated with the TechRO absolute fair activity duration. For the same health group, leisure walking activity correlated with both energy and steps, while PRO vigorous activity correlated with both absolute fair+vigorous activity and relative vigorous activity (when including sleep).
In this group, we also found “expected” correlations between PROs and TechRO sedentary duration. PRO moderate activity at work, vigorous activity in the garden, and vigorous activity for leisure associated negatively with TechRO sedentary duration. The TechRO sedentary+light duration associated negatively with the PRO total active effort as well.
Other associations indicate potential activity replacements (within TechRO) for the same health group (diseased). Walking at work associated negatively with the relative duration of activity at the light intensity, indicating that, when they walk at work, they tend to perform less light activity elsewhere. Also, the vigorous activity effort may replace light activity duration during the day, indicating that the participants tend to limit their physical activity to a narrow spectrum of intensities.
The distribution of results per families of TechROs indicates that for the groups with all participants and the healthy, the absolute families may provide most, if not all, strong correlations. However, for the diseased group, measuring the entire physical activity duration and including sleep uncovered associations weaker or non-significant otherwise. For this group, measuring only raw energy or steps TechROs may be indicative of their leisure walking efforts, potentially useful for more sedentary participants who do not work.
Both metrics highlighted all IPAQ domains except transport. The PRO transport physical activity was not indicative of TechRO physical activity measures, potentially due to the lower and fewer correlations with transport. However, the raw responses indicate that transport walking activity may associate with the numeric score of physical activity.
3.4.2. coQoL for Social Support (MSPSS vs. Fitbit)
We report the correlations of PRO social support variables (MSPSS) with TechRO variables (Fitbit) by using the total and contour metrics.
Social Support Outcomes by Total Numbers of Correlations
Table 6, rows with Outcome: Social Support, enumerates the PROs that correlated with the most TechROs ( ≥ 0.5) across all families by health group.
In the health group with all participants, PRO family items Q8 (talks about problems) and Q11 (willing to help make decisions) correlated with the most TechROs.
In the group with healthy participants, PRO friends items, Q6 (friends try to help), Q9 (friends share joys and sorrows), and Q12 (friends talk about problems), had relatively more correlations with TechRos than PRO significant other or family items. Furthermore, the PRO friends numeric score had many correlations with TechROs.
In the group with diseased participants, PRO family Q4 (family gives emotional help and support) correlated negatively with TechRO absolute sedentary duration and Q12 (friends talk about problems) positively with the TechRO steps (Table 8, rows with Health: Diseased).
Table 8.
Summary of found strong and significant Spearman rank correlations ( ≥ 0.8) between PROs of social support (MSPSS scale) and TechROs (Fitbit wearable).
Social Support Outcomes by Contours of Correlations
We report the strong correlations ( ≥ 0.8) and their contours between PRO variables (MSPSS) and TechRO variables (Fitbit) in Table 8.
In the health group with all participants, several PRO items related to the significant other social support, Q2 (a special person shares joys and sorrows), Q5 (a special person is a real source of comfort), and Q10 (a special person cares about my feelings) correlated strongly and with a broad contour with TechRO relative vigorous activity durations when including sleep (Table 8, rows with Health: All and PRO Source: Significant other). Also, several PRO family items, Q3 (family tries to help) and Q8 (family talks about problems) as well as the family numeric sub-score correlated strongly and with a broad contour with TechRO relative fair and vigorous activity durations when including sleep. These two strong co-calibrations only appeared as highlighted in the CLR PA+S family (Table 8, rows with Health: All and PRO Source: Family).
In the group with healthy participants, we observed numerous strong negative correlations with broad contours between numerous PRO items. Several are related to the significant other source: Q1 (a special person is around when in need), Q2 (a special person shares joys and sorrows), Q5 (a special person is a real source of comfort), and Q10 (a special person cares about my feelings) as well as the significant other numeric sub-score and the TechRO fair physical activity duration. However, we also observed a strong, positive correlation with a similarly sized contour with PRO item Q5 (a special person is a real source of comfort) and TechRO fair activity duration in the relative CLR PA+S family. These results indicate that measuring daily sleep is necessary to co-calibrate this PRO source and TechRO physical activity intensity (Table 8, rows with Health: Healthy and PRO Source: Significant other).
Also, several PRO family items, Q3 (family tries to help), Q8 (family talks about problems), and Q11 (family is willing to help make decisions) correlated negatively with TechRO absolute fair activity, but positively with the relative duration at the same physical activity intensity (Table 8, rows with Health: Healthy and PRO Source: Family), yielding a similar interpretation.
Few PRO friends items such as Q9 (friends share joys and sorrows) and Q12 (friends talk about problems) correlated with broad contours with the TechRO absolute light physical activity duration (Table 8, rows with Health: Healthy and PRO Source: Friends).
Also, the PRO categorical score strongly correlated without contour with the TechRO absolute daily duration of physical activity (active) and the relative CLR PA light activity. The PRO numeric score also correlated with the TechRO absolute light+fair activity and relative CLR PA+S fair activity, indicating a positive relationship between social support and light to fair activity (Table 8, rows with Health: Healthy and PRO Source: All).
In the group with diseased participants, we only observed two isolated strong correlations. PRO family item Q4 (gives emotional help and support) correlated negatively with TechRO sedentary duration. PRO friends item Q12 (talk about problems) correlated positively with daily steps (Table 8, rows with Health: Diseased).
PRO items Q2, Q3, Q5, Q8, Q10, and the numeric score appeared in both groups of all and healthy participants. However, only Q8 maintained the correlation with TechRO fair physical activity across health groups. Q12 had strong correlations in both groups of healthy and diseased participants. However, the relationship was expressed through separate outcomes: light activity and steps, respectively (Table 8).
Social Support Outcomes Highlighted by Both Metrics
In the health group with all participants, PRO friends Q9 (friends share joys and sorrows) and Q12 (friends talk about problems) were highlighted as strongly correlated by both contour and total metrics, and thus informative for co-calibration with TechROs (Table 6 and Table 8, rows with Health: All).
Social Support Outcomes Interpretation
In the health group with all participants, several PRO items related to the significant other and family social support. They alternatively correlated with TechRO relative fair and vigorous activity: family items to the fair activity, and significant other items to the vigorous activity. All correlations resulted from relative TechROs including sleep. For this reason, the assessment of social support may benefit from the inclusion of sleep in the analysis.
In the group with healthy participants, the PRO social support from the significant other had negative correlations with TechRO fair activity in the absolute amount and positive correlations with fair activity in the relative amount (including sleep). This pattern was also pronounced for the items related to family social support. Sleep changed the ordering of durations throughout the day across the healthy participants. We argue for including sleep in the analysis of significant other and family social support for healthy seniors. Having friends who share joys and sorrows and, in general, talk about problems, associated with more light activity.
In the group with diseased participants, emotional help and support from the family associated with less sedentary time throughout the day. Also, having friends who talk about problems associated with more steps.
In general, the significant other being a real source of comfort appeared in most instances, followed by having someone who cares about feelings, then having someone who shares joys and sorrows, and then (at a distance) having a special person around when in need. Having a significant other who is a source of comfort may serve as a proxy item for more frequent assessments of the relationships between significant other social support and physical activity at the fair to vigorous intensities.
Having a family that tries to help, talks about problems, and wishes to help make decisions appeared in three groups across metrics. However, getting emotional help and support from the family only appeared once. Frequent administrations of the MSPSS may choose to assess the relationships between family social support and fair physical activity by using only the first three items.
Having friends with whom to talk about problems appeared in three groups across metrics. Having friends who try to help and share joys and sorrows appeared less often with strong correlations and contours but had numerous correlations in total. We argue that counting on friends when things go wrong is a less prominent item in assessing relationships between friends social support and physical activity.
3.4.3. coQoL for Anxiety and Depression (GADS vs. Fitbit)
We report the correlations of PRO anxiety and depression (GADS) with TechRO variables (Fitbit) by using the total and contour metrics.
Anxiety and Depression Outcomes by Total Numbers of Correlations
Table 6, rows with Outcome: Anxiety and depression, enumerates the PROs that correlated with the most TechROs ( ≥ 0.5) across all families by health group.
In the health group with all participants, PRO anxiety item Q8A (worried about own health), as well as PRO depression items Q1D (lacking energy) and Q6D (lost weight due to poor appetite), recorded the most correlations with TechROs (Table 6, row with Outcome: Anxiety and depression, Health: All).
In the group with healthy participants, PRO item Q2D (lost interest in things) had the most correlations (Table 6, row with Outcome: Anxiety and depression, Health: Healthy).
In the group with diseased participants, PRO item Q2A (worrying a lot) had the most correlations with TechROs (Table 6, row with Outcome: Anxiety and depression, Health: Diseased).
Anxiety and Depression Outcomes by Contours of Correlations
We report the strong correlations ( ≥ 0.8) and their contours between PRO variables (GADS) and TechRO variables (Fitbit) in Table 9.
Table 9.
Summary of found strong and significant Spearman rank correlations ( ≥ 0.8) between PROs of anxiety and depression (GADS scale) and TechROs (Fitbit wearable).
In the health group with all participants, PRO anxiety item Q5A (sleeping poorly) correlated strongly with a broad contour with TechRO relative CLR PA+S light physical activity. We found other isolated correlations for anxiety. PRO item Q3A (irritable) correlated with the TechRO relative vigorous activity. PRO item Q7A (trembling [...]) negatively correlated with the TechRO daily active duration. PRO depression items Q1D (lacking energy) and Q6D (lost weight due to poor appetite) had isolated correlations. The PRO numeric score had a strong correlation with the TechRO relative sleep duration (Table 9, rows with Health: All).
In the group with healthy participants, PRO anxiety item Q7A (trembling [...]) correlated positively with TechRO vigorous activity and negatively with TechRO light and light+fair activity durations (the last with a broad contour) in both absolute and relative families. PRO item Q7A correlated negatively with the total daily active duration. PRO item Q3A (irritable) correlated negatively with total daily active duration. PRO depression items Q2D (lost interest in things) and Q9D (worse in the morning) had isolated correlations, the first negative with TechRO relative CLR PA light activity duration, and the second with TechRO relative CLR PA+S sedentary duration. PRO item Q6D (lost weight due to poor appetite) recorded a positive correlation as well, with TechRO relative sleep duration (Table 9, rows with Health: Healthy).
In the group with diseased participants, we did not observe strong correlations ( ≥ 0.8) by using the contour metric (Table 9, rows with Health: Diseased).
PRO items Q3A, Q7A, and Q6D appeared in both groups with all and healthy participants. However, only Q7A kept the same strong correlation against total daily active duration in the two groups (Table 9).
Anxiety and Depression Outcomes Highlighted by Both Metrics
Anxiety and Depression Outcomes Interpretation
In the health groups with all and healthy participants, irritability and trembling may expediently assess anxiety while having lost interest in things and losing weight due to poor appetite may assess depression. Follow-up investigations may establish whether the health state is momentary or deteriorating over time.
PRO Trembling, tingling, dizziness, sweating, diarrhoea, or passing urine yielded numerous correlations for healthy participants: negative correlations with TechRO light, light+fair, and total daily active duration as well as a positive correlation with vigorous physical activity duration. When a daily life monitor observed a gradual replacement of light to fair activity with vigorous activity (as reported by the wearable), it may be worth investigating whether an otherwise healthy participant also becomes gradually more anxious (by using items).
In the group with healthy participants, a decrease in light physical activity may indicate that the participants experience an increase in depression. Researchers can then assess this hypothesis by administering, e.g., the corresponding item in the EQ-5D-3L scale. A similar process could be employed for all seniors by longitudinally monitoring the sleep duration relative to the 24 h of the day, based on the corresponding strong correlations between the numeric score and the relative sleep duration. In the case of increasingly longer sleep, the participant may enter a state of anxiety or depression.
In general, depression and anxiety positively associated with the sedentary duration, in both absolute and relative TechRO families, especially for participants who self-report disease. The two items in the scale referring to sleep may provide additional insights towards not only the anxiety and depression status of the participant, but also sleep quality.
3.4.4. coQoL for Mediterranean Nutrition (PREDIMED vs. Fitbit)
We report the correlations of PRO Mediterranean nutrition variables (PREDIMED) with TechRO variables (Fitbit) by using the total and contour metrics.
Mediterranean Nutrition Outcomes by Total Numbers of Correlations
Table 6, rows with Outcome: Mediterranean nutrition, enumerates the PROs that correlated with the most TechROs ( ≥ 0.5) across all families by health group.
In the health group with all participants, the PRO categorical score, numeric score and items Q12 (nuts use) and Q14 (sofrito use) had the most correlations with TechROs (Table 6, rows with Outcome: Mediterranean nutrition, Health: All).
In the group with healthy participants, PRO item Q4 (fruit use) and the categorical score had the most correlations with TechROs (Table 6, rows with Outcome: Mediterranean nutrition, Health: Healthy).
In the group with diseased participants, we only observed PROs with reduced numbers of correlations with TechROs across families (Table 6, rows with Outcome: Mediterranean nutrition, Health: Diseased).
The categorical score is the only PRO that appeared with numerous correlations in the two groups with all and healthy participants (Table 6).
Mediterranean Nutrition Outcomes by Contours of Correlations
We report the strong correlations ( ≥ 0.8) and their contours between PRO variables (PREDIMED) and TechRO variables (Fitbit) in Table 10.
Table 10.
Summary of found strong and significant Spearman rank correlations ( ≥ 0.8) between PROs of Mediterranean nutrition (PREDIMED scale) and TechROs (Fitbit wearable).
In the health group with all participants, PRO item Q12 (nuts use) had an isolated negative correlation with the TechRO absolute fair activity, but a positive correlation (with a contour) with the TechRO relative CLR PA+S light activity. The PRO numeric score also registered two correlations with contours: negative with TechRO absolute vigorous activity duration and positive with TechRO relative CLR PA+S light activity duration (Table 10, rows with Health: All).
In the group with healthy participants, PRO item Q3 (vegetables use) correlated negatively with the TechRO relative fair activity in both CLR PA and CLR PA+S families (Table 10, rows with Health: Healthy). While the two correlations had no contour, their presence in both families highlights an effect.
In the group with diseased participants, PRO item Q5 (red meat, hamburger, or meat use) correlated positively with TechRO energy expenditure. For the same group, PRO item Q11 (commercial sweets or pastries use) correlated positively with TechRO heart rate (Table 10, rows with Health: Diseased).
Mediterranean Nutrition Outcomes Highlighted by Both Metrics
Mediterranean Nutrition Outcomes Interpretation
In the health group with all participants, the nutrition numeric score associated with the relative sleep duration, and using nuts had a similar correlation (both correlations with contours). Further studies may assess whether this item can be administered independently of the full scale (for the numeric score) to assess the relationship between (mal)nutrition and light physical activity in seniors.
With regards to poor nutrition choices and their potentially magnified effects on people with mild disease, the consumption of red meat and hamburgers by participants with mild disease correlated with higher energy expenditure. The consumption of commercial sweets or pastries also associated with an increased heart rate.
The PRO numeric and categorical scores correlated with numerous TechROs, indicating a replacement of fair to vigorous activity with the light activity.
Participants from Spain had on average more adherence than those from Hungary (Appendix C.1.1), making the country of residence a potential confounder for the relationships above.
3.4.5. coQoL for Nutrition (SelfMNA vs. Fitbit)
We report the correlations of PRO nutrition variables (SelfMNA) with TechRO variables (Fitbit) by using the total and contour metrics.
Nutrition Outcomes by Total Numbers of Correlations
Table 6, rows with Outcome: Nutrition, enumerates the PROs that correlated with the most TechROs ( ≥ 0.5) across all families by health group.
For all health groups, we found PROs correlated with few TechROs when compared to other outcomes (Table 6, row with Outcome: Nutrition, Health: All).
In the groups with all participants and the healthy, the PRO categorical score had the most correlations (Table 6, row with Outcome: Nutrition, Health: Healthy).
In the group with diseased participants, PRO items Q1 (food intake declined) and Q2 (weight lost) recorded the most correlations with TechROs (Table 6, row with Outcome: Nutrition, Health: Diseased).
The categorical score is the only PRO that appeared in two health groups: the group with all participants and the group with healthy participants (Table 6).
Nutrition Outcomes by Contours of Correlations
We report the strong correlations ( ≥ 0.8) and their contours between PRO variables (SelfMNA) and TechRO variables (Fitbit) in Table 11.
Table 11.
Summary of found strong and significant Spearman rank correlations ( ≥ 0.8) between PROs of nutrition (SelfMNA scale) and TechROs (Fitbit wearable).
We only found strong correlations ( ≥ 0.8) in the group with diseased participants. PRO items Q1 (food intake declined) and Q2 (weight lost) correlated negatively with the TechRO relative sleep duration. PRO item Q4 (stressed or severely ill) correlated negatively with the TechRO absolute sedentary duration (Table 11).
Nutrition Outcomes Highlighted by Both Metrics
Nutrition Outcomes Interpretation
In the health group with all participants, the PRO categorical score correlated with numerous TechROs. In general, better nutrition coincided with less sedentary and light physical activity and more fair and vigorous physical activity. In the group with healthy participants, both numeric and categorical scores exhibited this pattern (Appendix C.2).
In the group with diseased participants, a long-term decrease in sleep duration may indicate a decline in food intake or a loss of weight—two outcomes that appeared in both metrics and may lead to malnutrition.
3.4.6. coQoL for Memory (MFE vs. Fitbit)
We report the correlations of PRO memory variables (MFE) with TechRO variables (Fitbit) by using the total and contour metrics.
Memory Outcomes by Total Numbers of Correlations
Table 6, rows with Outcome: Memory, enumerates the PROs that correlated with the most TechROs ( ≥ 0.5) across all families by health group.
In the health group with all participants, the PRO items that correlated with the most TechROs were Q12 (having difficulty picking up a new skill), Q14 (forgetting to do planned things), and Q6 (forgetting the time of events) (Table 6, rows with Outcome: Memory and Health: All).
In the group with healthy participants, PRO items Q6 (forgetting the time of events), Q15 (forgetting details of done things), Q12 (having difficulty picking up a new skill), and Q14 (forgetting to do planned things) correlated with the most TechROs (Table 6, rows with Outcome: Memory and Health: Healthy).
In the group with diseased participants, PRO items Q13 (having a word on the tip of the tongue) and Q25 (getting lost in often visited place) had the most correlations (Table 6, rows with Outcome: Memory and Health: Diseased).
PRO items Q12 (having difficulty picking up a new skill) and Q14 (forgetting to do planned things) were the only outcomes that had numerous correlations with TechROs across two groups: all and healthy (Table 6).
Memory Outcomes by Contours of Correlations
We report the strong correlations ( ≥ 0.8) and their contours between PRO variables (MFE) and TechRO variables (Fitbit) in Table 12.
Table 12.
Summary of found strong and significant Spearman rank correlations ( ≥ 0.8) between PROs of memory (MFE scale) and TechROs (Fitbit wearable).
In the health group with all participants, there was only one strong correlation with contour between PRO item Q24 (forgetting where things are normally kept) and PRO fair activity in the CLR PA family. The PRO numeric score had a negative correlation with the TechRO total daily active duration. PRO item Q7 (completely forgetting to take things) had a strong correlation with TechRO relative sleep duration. PRO items Q12 (having difficulty picking up a new skill) and Q13 (finding a word on the tip of the tongue) had negative and positive relations with TechRO relative light and fair CLR PA+S activity durations, respectively (Table 12, rows with Health: All).
In the group with healthy participants, PRO item Q14 (forgetting to do planned things) had a contour of two strong correlations with TechRO fair+vigorous and vigorous activity. PRO item Q16 (forgetting the topic of an ongoing conversation) had a strong correlation with contour TechRO absolute fair activity duration. PRO items Q10 (letting ramble about unimportant things) and Q24 (forgetting where things are normally kept) had isolated negative correlations with TechRO fair activity duration. PRO item Q7 (completely forgetting to take things) recurred in correlating strongly with sleep. The numeric score also correlated negatively with TechRO relative CLR PA fair activity duration (Table 12, rows with Health: Healthy).
In the group with diseased participants, PRO item Q18 (forgetting to tell somebody something important) had a broad contour with the TechRO fair, fair+vigorous, and vigorous physical activity duration. PRO item Q6 (forgetting the time of events) had a positive correlation with the TechRO heart rate, a positive correlation (having a contour) with the light activity, and a negative correlation with the sleep duration. PRO item Q1 (forgetting objects put) had a negative correlation (contour) with the TechRO relative vigorous activity in the PA+S family. Q13 (finding a word on the tip of the tongue) correlated negatively with TechRO daily active duration and positively with relative sedentary duration in the CLR PA+S family. Q8 (being reminded about things) had a positive correlation with the TechRO light+fair activity duration. The PRO numeric score correlated negatively with the TechRO total active duration (Table 12, rows with Health: Diseased).
PRO items Q7 (completely forgetting to take things) and Q24 (forgetting where things are normally kept), as well as the numeric score, appeared in both groups with all and healthy participants. Items Q7 and Q24 maintained the strong correlations between groups: positive with sleep duration and negative with relative fair activity. The numeric score expressed the inverse relation with physical activity in different ways depending on the health status. For all participants and the mildly diseased, it had a negative correlation with the total daily active duration. For the healthy participants, it had a negative correlation with the relative fair activity duration (Table 12).
Memory Outcomes Highlighted by Both Metrics
In the health group with all participants, Q12 (having difficulty picking up a new skill) was highlighted by both metrics as an informative PRO for memory (Table 6 and Table 12, rows with Health: All).
Memory Outcomes Interpretation
In the health group with all participants, the memory numeric score strongly associated with shorter durations of any physical activity during the day. A negative correlation with relative fair physical activity also reflected this pattern in the group with healthy participants. A decrease in active duration may provide an opportunity for a long-term monitoring system to assess whether an otherwise healthy senior is experiencing a gradual increase in memory failures.
In the groups with all participants and the healthy, forgetting where things are normally kept associated positively with fair physical activity; however, only when accounting for sleep as well.
In the group with diseased participants, forgetting to tell somebody something important associated with numerous TechROs, suggesting a replacement of fair and vigorous activity durations with sedentary and light duration throughout the day. By observing this TechRO pattern longitudinally in time, a study may administer this item towards assessing memory failures. Finding a word is on the tip of the tongue is another PRO item that also correlated with TechRO sedentary duration and negatively correlated with daily active duration. Further research may investigate the reliability of a more frequent assessment than the MFE scale consisting of the items above for seniors with mild disease.
3.4.7. coQoL for Sleep (PSQI vs. Fitbit)
We report the correlations of PRO sleep variables (PSQI) with TechRO variables (Fitbit) by using the total and contour metrics.
Sleep Outcomes by Total Numbers of Correlations
Table 6, rows with Outcome: Sleep, enumerates the PROs that correlated with the most TechROs ( ≥ 0.5) across all families by health group.
In the health group with all participants, PRO items Q7 (trouble staying awake driving, eating, socialising) and Q4 (duration of actual sleep), followed by the daily dysfunction numeric sub-score, had the most correlations with TechROs across families (Table 6, rows with Outcome: Sleep and Health: All).
In the group with healthy participants, PRO items Q4 (duration of actual sleep), Q5C (trouble sleeping due to using the bathroom), Q7 (trouble staying awake driving, eating, socialising) had the most correlations with TechROs, followed by the daily dysfunction numeric sub-score (Table 6, rows with Outcome: Sleep and Health: Healthy).
In the group with diseased participants, the PROs that correlated with the most TechROs had relatively fewer correlations. The daily dysfunction numeric sub-score and Q6 (duration of actual sleep) registered the most correlations (Table 6, rows with Outcome: Sleep and Health: Diseased).
The PRO daily dysfunction numeric sub-score had numerous correlations in all three health groups. The PRO item Q4 (duration of actual sleep) appeared in the groups with all participants and the healthy (Table 6).
Sleep Outcomes by Contours of Correlations
We report the strong correlations ( ≥ 0.8) and their contours between PRO variables (PSQI) and TechRO variables (Fitbit) in Table 13.
Table 13.
Summary of found strong and significant Spearman rank correlations ( ≥ 0.8) between PROs of sleep (PSQI scale) and TechROs (Fitbit wearable).
In the health group with all participants, PRO sleep disturbance item Q5A (trouble sleeping due to not getting to sleep) correlated positively with TechRO relative sleep duration. PRO items Q5E (trouble sleeping due to coughing or snoring loudly) and Q5F (trouble sleeping due to feeling too cold) correlated with TechRO relative vigorous activity duration (negative, CLR PA family) and light activity duration (positive, CLR PA+S family), respectively. PRO item Q7 (trouble staying awake while driving, eating, socialising) correlated negatively with TechRO relative sleep duration and light activity durations. Two numeric sub-scores yielded correlations with relative sleep: latency (positive) and daily dysfunction (negative). The daily dysfunction numeric sub-score also correlated with TechRO vigorous activity (broad contour) and the relative light activity (contour). The efficiency numeric sub-score had an isolated correlation with TechRO fair activity (Table 13, rows with Health: All).
In the group with healthy participants, numerous PROs correlated with TechRO sleep: Q2 (duration to fall asleep), Q5A (trouble sleeping due to not getting to sleep), Q11 (duration stayed in bed), and the latency numeric sub-score. Among the sleep disturbance items, Q5C (trouble sleeping due to using the bathroom) had two contoured correlations: negative with light+fair and light activity (the latter with a broad contour) in absolute and relative CLR PA families, respectively. The PRO efficiency numeric sub-score correlated again with TechRO fair activity. The numeric score correlated positively (and having a contour) with fair+vigorous activity (Table 13, rows with Health: Healthy).
In the group with diseased participants, PRO item Q4 (duration of actual sleep) registered a broad contour of 3 strong correlations (including = 0.9) with fair, fair+vigorous, and vigorous TechRO absolute durations. PRO item Q1 (time gone to bed at night) correlated inversely with the TechRO absolute sleep duration. Sleep disturbance items Q5B (trouble sleeping due to waking up in the middle of the night) and Q5C (trouble sleeping due to using the bathroom) correlated negatively with energy expenditure (Table 13, rows with Health: Diseased).
PRO items Q5A (trouble sleeping due to not getting to sleep) and Q5E (trouble sleeping due to coughing or snoring loudly), and the latency and efficiency numeric sub-scores appeared for the groups with all participants and the healthy. Q5A and the latency numeric sub-score maintained a strong correlation with the TechRO sleep duration. The efficiency numeric sub-score maintained the strong correlation with the fair activity. Q5E had an inverse relation with TechRO physical activity across these two groups, but expressed through negative correlations with the relative vigorous duration and the relative light duration, respectively. Q5C (trouble sleeping due to using the bathroom) was highlighted in both healthy and diseased groups, but expressed an inverse relation with physical activity through different outcomes: light-fair activity duration and energy expenditure, respectively (Table 13).
Sleep Outcomes Highlighted by Both Metrics
Sleep Outcomes Interpretation
Several PRO items strongly correlated with sleep-specific TechROs. In the health group with all participants, having trouble sleeping due to not being able to get to sleep as well as the sleep latency numeric sub-score correlated with relative sleep duration while having trouble staying awake while driving, eating, or socialising as well as the daily dysfunction numeric sub-score correlated negatively with relative sleep duration. In the group with healthy participants, the duration to fall asleep, having trouble sleeping due to not getting to sleep, the duration to stay in bed, and the latency numeric sub-score correlated with longer relative sleep during the day. In the group with diseased participants, only the time gone to bed at night correlated negatively with absolute sleep duration. Studies assessing sleep in healthy adults may benefit from the monitoring of the entire day, not only the sleep duration, to find a higher amount of significant outcomes.
In the health group with all participants, PRO decreased sleep quality correlated negatively with TechRO relative light and vigorous activity. In the group with healthy participants, the sleep efficiency numeric sub-score correlated with the relative fair activity, and using the bathroom correlated negatively with relative light physical activity (with a broad contour). In the group with diseased participants, the duration of actual sleep correlated with absolute fair, fair+vigorous, and vigorous durations. Having trouble sleeping due to waking up in the middle of the night may be an indicator of already low sleep quality in participants with mild disease.
3.4.8. coQoL for Health-Related Quality of Life (EQ-5D-3L vs. Fitbit)
We report the correlations of PRO health-related Quality of Life variables (EQ-5D-3L) with TechRO variables (Fitbit) by using the total and contour metrics.
Health-Related Quality of Life Outcomes by Total Numbers of Correlations
Table 6, rows with Outcome: Quality of Life, enumerates the PROs that correlated with the most TechROs ( ≥ 0.5) across all families by health group.
In the health group with all participants, the PRO items with the most correlations were the health score and Q4 (pain/discomfort). The items in this scale had relatively fewer correlations than the other scales such as social support (MSPSS) or memory (MFE) (Table 6, rows with Outcome: Quality of Life and Health: All).
In the group with healthy participants, PRO item Q4 (pain/discomfort) had the most correlations with TechROs (Table 6, row with Outcome: Quality of Life and Health: Healthy).
In the group with diseased participants, PRO item Q5 (anxiety/depression) had the most correlations with TechROs (Table 6, row with Outcome: Quality of Life and Health: Diseased).
Q4 (pain/discomfort) was the only PRO item that appeared in two groups: the group with all participants and the group with the healthy (Table 6).
Health-Related Quality of Life Outcomes by Contours of Correlations
We report the strong correlations ( ≥ 0.8) and their contours between PRO variables (EQ-5D-3L) and TechRO variables (Fitbit) in Table 14.
Table 14.
Summary of found strong and significant Spearman rank correlations ( ≥ 0.8) between PROs of health-related Quality of Life (EQ-5D-3L scale) and TechROs (Fitbit wearable).
We only found one strong correlation in the group of participants with mild disease, between the PRO depression and anxiety item (Q5) and the TechRO absolute sedentary duration (Table 14).
Health-Related Quality of Life Outcomes Highlighted by Both Metrics
Health-Related Quality of Life Outcomes Interpretation
The PRO health state today correlated with numerous TechROs, in particular with a replacement of vigorous physical activity duration with sleep, sedentary, and fair durations across all participants, with a replacement of fair and vigorous durations with light activity for the healthy, and with a decrease in fair and vigorous activity among the diseased (Appendix C.2).
Pain and discomfort also had numerous correlations with TechROs, but only for the groups with all participants and the healthy. In participants with mild disease, having anxiety/depression correlated with sedentary physical activity. An increase in sedentary duration for participants with already existing mild disease may be an indication of decreased quality of life on the anxiety/depression domains which, in the affirmative, could be further assessed by administering specialized scales.
3.5. Use Case Examples for coQoL
The coQoL method allows for the in-depth analysis of the results both in terms of measured outcomes and individual participants. We provide two examples below, pertaining to longitudinal data (Section 3.5.1) and the story of a participant (Section 3.5.2).
3.5.1. Longitudinal Data Example
We exemplify a very strong correlation ( = 0.9) between PROs and TechROs, to report how the interval and leeway durations influenced the correlations. In healthy participants, the MSPSS item Q3 (family is trying to help, PRO) correlated the strongest with the Fitbit fair physical activity duration in the CLR PA+S family, TechRO) for the TechRO aggregation interval of 28 days with a decreasing pattern as the leeway increases. Table 15 presents the resulting gradients of correlations for all combinations of TechRO aggregation interval-leeway durations and the TechRO raw data that yielded the strongest correlation. Table 16 depicts the raw results. In this table, the relative fair column is a centred log-ratio that has both negative (for less relative fair activity) and positive quantities (for more relative fair activity).
Table 15.
Gradient of correlations by interval durations (columns) and leeways (rows) in days.
Table 16.
Raw data for a 28-day interval and a 21-day leeway that yielded the highest correlation (0.92).
3.5.2. Participant Story Example
Participant 169 is a 69-year-old female from Hungary who self-reported mild disease. She has a university degree, lives with her partner (no children), does not smoke, and drinks alcohol daily. She is a diligent responder who answered in all three waves of our study, wore the Fitbit for 794 days from which 141 were valid.
When aligning the numeric scores from the PRO scales and the TechROs (Table 17), Wave 1 (mid-2018) had the worst PRO depression and anxiety, (close to the worst) memory, and sleep as well as (close to) the worst TechRO sedentary duration, light activity duration, (close) fair activity, and vigorous activity duration. Wave 2 (end-2018 and start-2019) had the least adequate PRO physical activity, adherence to the Mediterranean diet, memory, sleep, and quality of life, reflected in the least adequate TechRO energy expenditure, steps, heart rate, sedentary duration, fair activity duration, and total active duration per day. In Wave 3 (mid-2019), Participant 169 registered better PRO for physical activity, depression and anxiety, memory, and sleep as well as more steps, a shorter sedentary duration, and longer light, fair, and vigorous durations. Social support was always high but never optimal. Nutrition and Quality of Life maintained high, but not optimal for waves 1 and 3. During the winter, the sleep duration was higher than during the summer. This real user example illustrates and emphasizes the importance of longitudinal state and behaviour assessments; we observed the change of state in participant 169 as a change in the TechRO variables that indeed associated with worse PRO-based self-reported states.
Table 17.
Summary of Characteristics of PRO (IPAQ, MSPSS, GADS, PREDIMED, SelfMNA, MFE, PSQI, EQ-5D-3L) and median TechRO (Fitbit) over the measurement period corresponding to each wave for Participant 169.
4. Discussion
In this section we discuss our methodological approach (Section 4.1), the coQoL method in the perspective of past evidence (Section 4.2), observations on data quality (Section 4.3), and pathways towards personalized medicine (Section 4.4). We then review several limitations of our study (Section 4.5) and envision future work (Section 4.6).
4.1. Overall Methodological Approach in PROomics
The coQoL method explored patterns of correlations between PROs and TechROs towards their co-calibration. Consequently, we focused on identifying groups of strong correlations between PROs with a given recall period and TechROs, aggregating weeks to months of wearables data available before the administration day of the PRO. We considered correlations between similar latent constructs, e.g., PRO and TechRO physical activity or sleep, as high from 0.8 and above. However, for different latent constructs, such as PRO social support and TechRO sleep, where the probability of random correlation is low, correlations of even 0.5 are high. Hence, we presented in here correlations of 0.5 and above as of importance.
Due to the exploratory nature of our method, we deliberately omitted adjustments for multiple comparisons. The results of our method can guide future observational studies, as well as personalized, adaptive interventional studies, where the observational component will inform the intervention design as we go. Researchers can power such studies for enough confidence to exclude trivial effects.
4.2. coQoL in Perspective of Past Evidence
We recall that little prior research focused on assessing the relationships between sets of different outcomes assessed via PROs and consumer wearable TechROs in healthy seniors, in the wild, for extended periods (beyond the typical study duration of 7–14 days). On the one hand, past studies may have had similar to larger sample size, yet they have not yielded stronger statistical results; these co-calibrations rarely report values ≥ 0.5, as we do. On the other hand, we report a more prolonged study duration (up to 2 years). The study duration of over a few weeks is essential to overcome the “novelty” effect of the technology (TechRO) on the state and behaviour of the user. Namely, the user, motivated by the feedback provided by the device while the study is being conducted, may move more or sleep differently, which then would be erroneously co-calibrated with the self-reports (PROs). The coQoL method leads to more accurate, real-world PRO- and TechRO-based datasets representing the real states and behaviours of the users. We define the past evidence in the context of momentary co-calibration efforts, where the PRO-TechRO co-calibrations may have been valid only for the short interval of data collection. Our proposed method coQoL expands the state of the art.
4.3. Observations on Data Quality
The wearable monitored some TechROs for more days than others. For example, the energy expenditure and steps appeared in most days. However, some days did not include durations of physical activity at increasing intensities, due to some seniors not wearing the wearable for enough hours that Fitbit recognized the activity or they did not reach the increased intensity physical activity on those days. Also, the TechROs that combine other TechROs, e.g., fair+vigorous, appeared in at most the minimum of the numbers of days when their constituent TechROs appeared. We acknowledge errors of a few days in long-term monitoring stemming from conditions beyond our control, such as errors at the device setup, at the recruitment site which took days to correct, or when running the automated data collectors from the seniors that were beyond our control in the project. These technological and human factors influenced the quality of the available data.
The wearable monitoring period may depend on the measured outcome, frequency of answers, and human factors. While the recall period of many scales is short (e.g., one week), collecting wearable data only for that duration may prove too strict. If the design is too strict, numerous participants will disqualify, and the results may bias in favour of diligent or adherent responders, who may also exhibit positive behaviours, e.g., exercising more diligently as well. Although some results indicate that 14–28 days of data could be enough for significant co-calibrations, the observations used in the co-calibration depend on the PRO answers and the TechRO data alike. If the participants are adherent to data collection for four weeks, but do not answer the questionnaire, the quality of the data may be insufficient to derive correlations. For some questionnaires, coQoL may relax the alignment (leeway) to account for human factors that contributed to data loss. On the other hand, a monitoring window of 120 days (4 months) may prove too wide to collect data reflecting the same behaviour as the reported one (the recall period), also because of the potential influence of seasonal effects. These seasonal, as well as other context dependencies, are illustrated when applying the coQoL to the MSPSS social support PRO. Our results indicate that having approximately one month of data before the administration of the MSPSS is sufficient to obtain significant correlations between family trying to help social support and fair activity even within a small sample of 39 participants. We observe that the MSPSS is time context-specific. Overall, across all questionnaires, we argue for an intermediary period of aggregation interval for TechRO not extending beyond 60–90 days.
4.4. Pathways towards Personalized Medicine
There is growing evidence within the medical domain that personal data paves a path towards personalized medicine, including genetics data and population-specific data, as well as, on a growing scale, data originating in the individuals’ daily life environments and representing their natural, objective behaviours unfolding in different contexts of daily life. Daily life datasets are, in turn, collected via consumer wearables and smartphones with sensing capabilities.
From our study, we learn that an ideal wearable in the context of personalized medicine study would be comfortable to wear; should have a long battery life (at least a few days); should be accepted by individuals to use as their own, such that they forget they are in the study (implying minimal reactivity); and should provide relevant TechRO related to behavioural patterns (e.g., activity status, steps, as opposed to only heart rate, which would be hard to co-calibrate by itself).
Given our results, we also observe that for some PROs, different self-reported health status of the individuals yield different co-calibration results, even though our definition of disease refers only to mild self-reported cases. When the participants have a disease, other TechROs become correlated more strongly with other PROs than for the healthy ones. An observational study involving healthy individuals can leverage the coQoL method by monitoring a relevant subset of PRO/TechROs longitudinally, and occasionally co-calibrating the PROs with TechROs assuming the sensitivity of the coQoL method for when long-term, significant changes in TechRO occur. Based on the occasionally collected PRO answers, further in-depth examination of the individual’s state may seek to understand if the TechRO change signals coincide with a significant and relevant PRO change, potentially implying a real change of the individual’s health state. Once diagnosed, the individual’s health state may be followed up, assuming another set of PRO/TechRO outcomes co-calibrated in time, to assess the change in the state of the disease accurately.
For example, in the case of diseased Participant 169, we observed that improvements or deteriorations in the state (as self-reported via the PROs for physical activity, Mediterranean diet, memory, and Quality of Life) coincided with TechROs (of physical activity in the sedentary, and light-vigorous spectrum, as well as the total physically active duration). Such trends are likely to differ between persons. As observed with Participant 169, administering the PROs only three times in two years and monitoring the TechRO behaviours using the wearable (minimally obtrusively, continuously, during daily life) yielded numerous trends across not only pairs of PROs and TechROs, but also across different PROs and TechROs.
The coQoL can provide a frontline approach to further triage the individual state assessment, for the healthy or diseased, without burdening the individuals with self-assessments, and at the same time without excluding participants who develop diseases and need to be monitored for long periods. In the context of the latter, the coQoL may be very suitable to assess changes of behaviour and health state in chronically ill patients.
We envision the following coQoL use case. The coQoL results can inform the design of longitudinal observations for selected individual PRO/TechRO outcomes, leveraged in personalized medicine solutions. The procedure consists of the observation for several consecutive days (for more TechRO-adherent participants, four weeks; for the less adherent participants, up to 3 months, from which one can derive around four weeks of quality data) followed by the co-calibration of TechROs with PROs. While monitoring, a potential gradual change in a subset of TechROs of interest can lead to contacting the individual for further health outcome assessments, via PRO or even clinical examination.
In new study designs, we suggest the study participation period of 60–90 days at most, and leverage behavioural techniques for participant wearable-adherence, to maximize the validity of the results acquired. The study design may imply repeated measures longitudinally over the years, e.g., PRO/TechRO co-calibration efforts over 60–90 consecutive days, repeated every few months up to a year (assuming same season every year).
4.5. Study Limitations
Several limitations characterize the presented here preliminary coQoL study. The first limitation is the small sample size, specific to an exploratory feasibility study. A second limitation is the resulting lack of power that reduced the complexity of the analysis method (i.e., statistical hypothesis tests). A third limitation is the presence of multiple PRO answers per individual for the same wave, albeit with high variability. However, we only included one answer per participant-wave to reduce bias towards diligent responders. In case of multiple answers per participant-wave, we chose the latest answer in time, to account for any form submission issues in the CoME software application or the participant changing their mind after submitting the answers once. A fourth limitation is a significant decrease in the number of participants data leveraged for the co-calibrations; we allowed for a leeway to allow PRO and TechRO alignments that are both (1) short-term, but accurate (e.g., 7–14 days, close to the recall period), and (2) longitudinal, but permissive (e.g., 60–120 days, sufficient for the long-term behaviours to unfold). The study highlights the challenge of retaining individuals (shared by many health studies) that can provide outcomes through both self-report and a wearable that must be worn daily, over long periods.
4.6. Future Work
In the ongoing and future work, we expect to involve more participants for shorter periods (60–90 days), repeated every few months to a year, and focus on the PROs and TechROs delineated in this paper to deepen our knowledge about these specific co-calibration efforts and results. We plan to employ more advanced techniques and obtain more results within statistical significance as we increase the sample size in further studies aimed at calibrating PROs and TechROs for health outcomes and longitudinal behaviours such as physical activity and sleep in seniors. We aim to derive individual co-calibration trajectories models, as well as population models, e.g., similar groups of healthy or diseased individuals.
5. Conclusions
In this study, we present the coQoL method for co-calibrating the relationships between PROs and TechRO for eight PRO outcomes and TechRO behavioural markers of physical activity, sleep, and heart rate in a cohort of 42 seniors contributing data for two years. We reported human factors and quality properties from the data collected while their daily life unfolded. Our results can inform the design of personalized observational that assess daily life behaviours continuously and longitudinally, and that enable interventional studies towards reducing the risk of chronic disease and improve health and Quality of Life in the long term.
Author Contributions
Conceptualization, V.M. and K.W.; methodology, V.M. and K.W.; software, V.M.; validation, K.W.; formal analysis, V.M.; investigation, V.M. and K.W.; resources, K.W.; data curation, V.M. and K.W.; writing–original draft, V.M. and K.W.; writing–review and editing, V.M. and K.W.; visualization, V.M.; supervision, K.W.; project administration, K.W.; funding acquisition, K.W. All authors have read and agreed to the published version of the manuscript.
Funding
This research was funded by the H2020 Societal Challenges: 769765 (Wellbeing and Health Virtual Coach, WellCo), Active and Assisted Living programme: AAL-2014-7-127 (Caregivers and Me, CoME), and Active and Assisted Living programme: AAL-2019-6-120-CP (Social Robot Companion to Support Homecare Nurses, Guardian).
Acknowledgments
The authors thank Kedar K. V. Mate, Nancy E. Mayo, Kirke Kjellberg, Allan Berrocal Rojas, Robyn M. Stuart, Bo Markussen, Sofia Laghouila, Alexandre De Masi, and Matteo Ciman.
Conflicts of Interest
The authors declare no conflict of interest. The funder had no role in the design of the study; in the collection, analyses, or interpretation of data; in the writing of the manuscript, or in the decision to publish the results.
Abbreviations
The following abbreviations are used in this manuscript:
| API | Application Programmable Interface |
| CLR | Centered Log Ratio |
| CLR PA | Centered Log Ratios of Physical Activity |
| CLR PA+S | Centered Log Ratios of Physical Activity and Sleep |
| CoME | Caregiver and Me |
| EQ-5D-3L | EuroQoL with 5 Domains and 3 Levels |
| GADS | Goldberg Anxiety and Depression Scale |
| IPAQ | International Physical Activity Questionnaire |
| MFE | Memory Failures of Everyday |
| MSPSS | Multidimensional Scale of Perceived Social Support |
| PREDIMED | Prevention with Mediterranean Diet |
| PRO | Patient-Reported Outcome |
| PSQI | Pittsburgh Sleep Quality Index |
| QoL | Quality of Life |
| SD | Standard Deviation |
| SelfMNA | Mini Nutritional Assessment |
| TechRO | Technology-Reported Outcome |
Appendix A. Literature Review
This section describes our procedure for literature review (Appendix A.1).
Appendix A.1. Literature Review Procedure
We searched for previous work by following a semi-structured approach, to prune papers distant from our research area from a vast body of literature. We agreed upon a hierarchy with properties divided into positive, neutral, and negative by their relative relevance to our research area (Figure A1).

Figure A1.
Related Work selection procedure (example on social support). Colors: green (positive towards inclusion), yellow (neutral), red (negative towards exclusion).
We began by including papers related to the PRO and using TechROs to the first level. We then followed a depth-first procedure of paper inclusion and exclusion. At each level, we included papers from the parent level and excluded all papers without positive properties for that level.
We then prioritized the papers by their deepest level of inclusion. We set the exclusion threshold at studies where the two outcomes, one PRO, and one TechRO, are used for co-calibration. We allowed only the PROs assessed in this paper (with a preference for the same questionnaires) and for TechROs provided by consumer wearables or accelerometers (with a preference for consumer wearables).
Numerous research directions and studies were excluded from our literature review reporting. We exclude papers that do not use PROs (or compare PROs) [72], do not use TechROs (or compare TechROs) [73], use other TechROs than wearables (e.g., smart phones [74], smart home [75], internet of things [76], medical imaging such as computer tomography or magnetic resonance [77]), focus on recognizing activities of daily life [78], or report only results following interventions [79].
Appendix B. Materials and Methods
In this section, we append notes on our materials and methods regarding patient-reported outcomes (Appendix B.1), technology-reported outcomes (Appendix B.2), and the co-calibration using coQoL (Appendix B.3).
Appendix B.1. Patient-Reported Outcomes (Questionnaires)
This part elaborates on our materials and methods for assessing the patient-reported outcomes: the used questionnaires (Appendix B.1.1), the administration of the questionnaires (Appendix B.1.2), the scoring of the answers (Appendix B.1.3), and the derivation of PRO variables (Appendix B.1.4).
Appendix B.1.1. Questionnaires
The participants provided PRO answers on questionnaires for physical activity (IPAQ [26]), social support (MSPSS [27]), anxiety and depression (GADS [28]), Mediterranean nutrition (PREDIMED [29,30]), nutrition (SelfMNA [31]), memory (MFE [32]), sleep (PSQI [33]), and health-related quality of life (EQ-5D-3L [34]). Table A1 illustrates the PRO questionnaires.
Table A1.
Questionnaires with validated scales for PROs.
Table A1.
Questionnaires with validated scales for PROs.
| Outcome | Scale | Administration | Scoring |
|---|---|---|---|
| Profile | - | 27 items assessing: age, gender, ethnicity, profession, education, cohabitants, height, weight, blood pressure, cholesterol, smoking, alcohol, medication (hypertension), personal health history (diabetes, apnea, insomnia, hyperglycemia, stroke, infarct, depression), and family health history (hypertension, diabetes, stroke, infarct, dementia) | - |
| Physical Activity | International Physical Activity Questionnaire (IPAQ) [26] | 27 items of mixed types: yes/no, counts of days of physical activity per week, durations of physical activity per day. Recall: 2 weeks | Numeric score (estimated effort in metabolic equivalent of task). Categorical score with 3 levels: 0 low, 1 moderate, and 2 high. Numeric sub-scores for domains (work, leisure, transport, domestic and garden) and intensities of physical activity (sedentary, low, moderate, and vigorous). |
| Social Support | Multi-Dimensional Scale Perceived Social Support (MSPSS) [27] | 12 items on a 7-level Likert scale (Q1–Q12). Recall: indefinite | Numeric score increasing with social support (1–2.9: low, 3–5: moderate, 5.1–7: high). Categorical score with 3 levels: 0 low, 1 moderate, and 2 high. Numeric sub-scores (1–7) for three sources of social support: significant other, family, and friends. |
| Anxiety and Depression | Goldberg depression and anxiety scale (GADS) [28] | 18 items: 9 for Anxiety (denoted Q1A–Q9A), 9 for Depression (Q1D-Q9D), all on a 6-level Likert scale. The original answers were on a 2-level Likert scale. The collected answers are on a 6-level Likert scale. Recall: 1 month | Numeric score increasing with depression and anxiety: 0–9 no depression, 10–21 possible depression, 22–35 mild depression, 36–53 moderate depression, and 54–90 severe depression. Categorical score with 5 levels: 0 absent, 1 possible, 2 mild, 3 moderate, 4 severe. |
| Nutrition Mediterranean | Prevention with Mediterranean Diet (PREDIMED) [29,30] | 14 binary items: 2 items yes/no, 12 items with thresholds for ingested food quantity (Q1–Q14). Recall: indefinite | Numeric score from 0–6 for no adherence to 7–12 for medium adherence to 13–14 for high adherence. Categorical score with 3 levels: 0 absent, 1 medium, 2 high. |
| Nutrition | Self-Reported Mini Nutritional Assessment (SelfMNA) [31] | 6 items: 5 on various levels Likert scales, 1 binary (Q1–Q6). Recall: 3 months, same day | Numeric score from 0–7 for malnourished to 8–11 for risk of malnutrition to 12–14 for normal nutrition. Categorical score with 3 levels: 0 for malnutrition, 1 for risk, and 2 for normal nutrition. |
| Memory | Memory Failures of Everyday (MFE) [32] | 28 items on a 3-level Likert scale (Q1–Q28). Recall: indefinite | Numeric score from 0 for no memory failures to 56 for potential memory failures. Categorical score separating 0 for no memory failures and 1 for potential memory failures, by comparing with deviations from the mean. |
| Sleep | Pittsburgh Sleep Quality Index (PSQI) [33] | 25 items of mixed types: durations, yes/no, Likert scales (Q1, ..., Q4, Q5A, ..., Q5J, Q6, ..., Q9). Recall: 1 month | Numeric score increasing as sleep quality decreases on a 0-21 scale. Categorical score of 1 for good sleep quality (0–4) and 0 for poor sleep quality (5–21). Numeric sub-scores (0–7) for: quality, latency, duration, efficiency, disturbance, medication, and daytime dysfunction. |
| Health-Related Quality of Life | EuroQoL health questionnaire (EQ-5D-3L) [34] | 6 items: 5 on a 3-level Likert scale (denoted by their measured outcomes), 1 on a visual analog scale (Q1–Q6). Recall: same day | Numeric scores for five domains: mobility, self-care, usual activities, pain/discomfort, and anxiety/depression, for the Likert items, increasing from 1 to 3 as life quality decreases. Visual analog scale of health state on the day of administration (giving a health score of 0–100), where higher numbers indicate better health. |
Appendix B.1.2. Questionnaire Administration
For the participants in Spain, the partners used already available versions of the questionnaires in Spanish [80,81,82,83,84,85,86,87]. For the participants in Hungary, only some questionnaires had variants in Hungarian [88]. The local partners in the project translated the missing questionnaires from English to Hungarian (and assured the translation accuracy) to allow all participants to fill the PROs in their respective languages.
Appendix B.1.3. Answers Scoring
For the PRO questionnaires, we followed the scoring procedures set forth by the authors of the validated scales associated with each questionnaire. Only one questionnaire necessitated an additional assumption. For the physical activity questionnaire (IPAQ), we processed the individuals’ physical activity answers by adhering to the data cleaning, maximum values for excluding outliers as described in the guide [89]. However, the guide does not provide a threshold for converting the duration reported as weekly (not daily) to daily into an average daily time. For example, if a senior reported seven hours of vigorous physical activity per day, the duration would likely reflect one hour per day. In this case, we allowed at most 7 h of physical activity per day at any intensity by dividing all excessive durations by 7 days.
Appendix B.1.4. Variables Derivation
We derived variables from both individual items, sub-scores, and scores of PRO scales. While the analysis of the scores exclusively would have been motivated by existing Rasch models providing calibrated positions of individual items and their sub-scores and scores [90], to our knowledge, there are no Rasch models for the PRO scales. Table 2 presents the derived PRO variables.
Appendix B.2. Technology-Reported Outcomes (Fitbit)
This part elaborates on our materials and methods for assessing the technology-reported outcomes: motivation and considerations for the Fitbit Charge 2 wearable (Appendix B.2.1), the processing of the wearable data (Appendix B.2.2), and the derivation of TechRO variables (Appendix B.2.3).
Appendix B.2.1. Fitbit Consumer Wearable
The space of consumer wearable manufacturers and devices is diverse, recording over 200 models [91], and the trend of adoption is increasing [13]. From all devices that provide physical activity and sleep TechROs, we chose Fitbit. Fitbit (1) monitors daily life behaviours accurately and continuously, (2) operationalizes the critical human factors for prolonged wear by senior end-users, and (3) facilitates reliable behavioural data collection.
First, Fitbit aims at motivating consumers to “reach health and fitness goals by tracking activity, exercise, sleep, weight, and more” [35]. It was selected for Digital Health software pre-certification by the US FDA [92]. Previous studies measured the accuracy of Fitbit consumer-friendly devices in reporting daily life behaviours of physical activity and sleep. For physical activity, Fitbit One and Zip had strong validity for step count and sleep duration, moderate for energy expenditure, and were weaker for fair and vigorous activity [12]. Fitbit Flex and Zip had adequate reliability and validity in measuring step count [93]. Fitbit Charge HR, Charge, Flex, Surge, Zip, and Alta agree with the ActiWatch GT3X+ research-grade accelerometer in assessing active minutes [37]. For sleep, Fitbit Charge HR can measure total sleep time [94] and time spent in bed [95] reliably, as compared with a sleep diary in a free-living setting or a research-grade accelerometer. For senior populations, Fitbit Charge 2 had better results in step count, energy expenditure, and sleep duration than the Garmin Vivosmart HR+ accelerometer in free-living environments [96]. Also, Fitbit One and Flex measure steps accurately in seniors [97].
Second, the positive senior user experience with the wearable is an essential factor that prolongs monitoring durations. For Fitbit, human factors studies found that over 90% of seniors agree that Fitbit was “easy to use, useful, and acceptable” over 8 months of wear [15] and seniors also place Fitbit the highest in usability (using the System Usability Scale [98]) among numerous other wearables [99]. Furthermore, the presence of a data display on the wristband leads to higher operation ratings [99].
Third, Fitbit provides a well-documented and developer-friendly application programming interface (API) which exposes a rich set of behavioural markers along [22] addressing goals of the project.
For our study, we selected the Fitbit Charge 2 wearable, a small wrist-worn watch which can monitor physical activity and sleep by using the same sensors such as those used in the validations, and displays steps, heart rate, and time, previously used in studies involving seniors (e.g., [96]).
Appendix B.2.2. Wearable Data Processing
To maintain high data quality, we considered valid days for the analysis only those days where the total duration of Fitbit monitoring was at least 21 h. We allowed at most three hours of missing data for device battery charging and handling (15–20 min to 2 h). Our choice reduced the impact of missing measurements and improved not only the measurement accuracy of TechRO behavioural markers in absolute daily durations but also enabled the assessment of TechRO behavioural markers relative to each other in the 24-h model of a day [64].
We constructed aggregate intervals with fixed durations of 7, 14, 21, 28, 60, 90, and 120 valid days to balance the number of included days in the analysis with the available intraday monitoring quality. The choice of 7 days for the lower bound was motivated by the need to acquire enough representative data for daily life, the 7 days as a common denominator of the PRO recall periods (where present), and the significant improvements in Fitbit accuracy for active minutes from 7 days onwards [37]. The choice of increasing intervals to the upper bound of 120 days reflected the duration of a wave, a large number of valid days per person (e.g., median 153 days for Spanish participants, Table A11), but also the high variance (a standard deviation of 113 days in Spain, Table A11).
We only included in the analysis intervals with at least 70% of their days valid, such that both weekdays and weekends were expected present in a week; the limit is compatible with previously reported consumer wearable use in seniors [100].
Appendix B.2.3. Variables Derivation
We split the TechROs into two amounts, absolute (behaviours in isolation, expressed in absolute amounts) and relative (behaviours relative to each other reflects the interdependences between behaviours during the 24 h of the day [64], expressed in relative amounts by the centred log ratios (CLR) of their compositions [65]).
In the absolute amount, we derived the variables into two families: raw and processed. We derived the raw daily energy expenditure (energy), step count (steps), and resting heart rate (heart rate) towards a total of 3 raw TechROs. We then derived the processed sedentary duration (sedentary), and the duration at three intensities (light, moderate, and vigorous) as processed by the Fitbit internal activity recognition algorithms. Since Fitbit had not published intensity thresholds, we also derived the cumulative durations in processed sedentary and light (sedentary+light), light and fair (light+fair), and fair and vigorous (fair+vigorous) intensities. We also calculated the total daily active duration (active) cumulating the light, fair, and vigorous processed durations. For sleep, we included the entire sleep duration of the day as a processed TechRO towards a total of 9 processed TechROs. We derived a total of 12 TechROs in the absolute amount.
For each aggregate interval duration and absolute TechRO, we used in the analysis as the aggregate the median from the absolute daily amounts as a variable. The 84 resulting variables are visible in the upper half of Table 3.
In the relative amount, we derived variables denoting compositional components of physical activity intensities and sleep throughout the day. We derived TechROs for each component of the centred log-ratio (CLR, [65]) transformation. The CLR is a symmetric transformation that does not require a reference component behaviour. We computed the CLRs of two families denoting distinct compositions: (1) from all physical activity durations (CLR PA) and (2) from all physical activity durations and the sleep duration (CLR PA+S), having 4 and 5 TechROs, respectively. We derived two relative families, as the CLRs of a composition do not translate to sub-compositions [65], but some studies may not be able to monitor sleep. We obtained a total of 9 TechROs in the relative amount.
For each aggregateinterval duration and relative TechRO, we used in the analysis as the aggregate the geometric mean from the relative daily amounts. The 63 resulting variables are visible in the lower half of Table 3.
The 147 derived TechRO variables can be seen in Table 3 (TechRO).
Appendix B.3. Co-Calibration Using coQoL
This part elaborates on our method coQoL to co-calibrate PROs and TechROs. The part covers the three types of analysis: descriptive (Appendix B.3.1), inferential (Appendix B.3.2), and pattern (Appendix B.3.3).
Appendix B.3.1. Descriptive Analysis (PROs and TechROs)
We describe the PROs and TechROs from two perspectives. The first perspective refers to the values in the data. The second perspective refers to the amount of data.
Within the first perspective, we describe the PROs by observing three summary statistics (median, mean, and standard deviation) of the participants-waves when grouped by health status (healthy vs. (mildly) diseased), country (Spain vs. Hungary), and gender (male vs. female) (Table A3, Table A4, Table A5, Table A6, Table A7, Table A8, Table A9, Table A10).
Within the same perspective, we describe the TechROs by observing medians across the entire monitoring period (Table A12) in the first perspective.
Within the second perspective, we observe the counts of total and valid days (Table A11) within the same groups as for the first perspective.
Appendix B.3.2. Inferential Analysis (PROs vs. TechROs)
We set the leeway between PRO administration date and TechRO aggregate interval end date at (successively) 0, 7, 14, 21, 28, 60, 90, 120 days due to scarce exact matches. Pairs of variables with nearer such dates took precedence. We then analyzed lists of these pairs by using Spearman rank correlations. We chose this test as the best statistic to represent co-calibration motivated by the following assumptions. First, the PRO and TechRO variables were not independent (as they referred to the same participant). Second, the Spearman test is a nonparametric test that does not require an underlying distribution for the variables (some variables did not distribute normally, Shapiro Wilk normality test yielded -and some variables measured different metrics). Third, our aim was holistic in observing groups of significant correlations (and not individual correlations).
We only report the strongest correlation per TechRO interval duration. We consider correlations between distinct constructs (e.g., PRO social support and TechRO sleep duration) to be strong at ≥ 0.5 and associations between similar constructs (e.g., PRO and TechRO physical activity) to be strong at ≥ 0.8.
We consider a correlation coefficient significant when the extremities of its 95% confidence interval have the same sign. We avoided effect omissions at the expense of potential effects due to chance by not using adjustments for multiple tests [101] as our focus is on observing groups of correlations rather than individual correlations.
Appendix B.3.3. Pattern Analysis (PROs vs. TechROs)
For the pattern analysis, the contour metric separately counts for a significant and strong target correlation for a physical activity intensity ( 0.8 or above) the other significant correlations of the same sign at the lower and higher intensities. In case the intensity of the target correlation is at the extremity, the metric is undefined. In case the target correlation is adjacent to a correlation that has the opposite sign or is non-significant, the count on that side is 0. In case the correlation is unrelated to a physical activity intensity, this metric is undefined.
For example, the fair physical activity correlation 0.8 and the sequence of correlations [sedentary: 0.4*, sedentary+light: 0.5, light: 0.6*, light+fair: 0.6*, fair: 0.8*, fair+vigorous: 0.3*, and vigorous: *], where * denote significant correlations, has two correlations of lower intensities (0.6*, 0.6*) and one of higher intensity (0.3*). Figure A2 illustrates this case as Example (a). The figure contains three more examples.

Figure A2.
Examples of contours of correlations interrupted by non-significant or opposite-sign correlations. marks the target correlation. × marks an interruption. Arrows mark the width of the contour. Only significant correlations are colored from red (weak) to green (strong). In example (a), the contour is interrupted by a non-significant correlation (at a lower intensity) and an opposite-sign correlation (at a higher intensity). Example (b) interrupts the entire right side of the contour by an opposite-sign correlation, represented with ×. Example (c) depicts a singleton contour, marked with × on both sides. Example (d) illustrates the rare case of a higher correlation than the target correlation, both in the same contour.
Appendix C. Results
This section includes results from our descriptive (Appendix C.1) and inferential analysis (Appendix C.2) analyses.
Appendix C.1. Descriptive Analysis (PROs and TechROs)
This part includes results from our descriptive analysis from patient-reported outcomes (Appendix C.1.1) and technology-reported outcomes (Appendix C.1.2).
Appendix C.1.1. Patient-Reported Outcomes (Questionnaires)
The 39 participants provided 289 answers (7.4 ± 4.4) on the 8 scales along the 3 waves. Table A2 depicts the numeric scores across waves.
Table A2.
PRO numeric scores from answers by questionnaire ( participants).
Table A2.
PRO numeric scores from answers by questionnaire ( participants).
| Physical Activity (IPAQ) | Social Support (MSPSS) | Anxiety and Depression (GADS) | Mediterranean Nutrition (PREDIMED) | Nutrition (SelfMNA) | Memory (MFE) | Sleep (PSQI) | Quality of Life (IPAQ) | |||||||||||||||||||||||||||||
|---|---|---|---|---|---|---|---|---|---|---|---|---|---|---|---|---|---|---|---|---|---|---|---|---|---|---|---|---|---|---|---|---|---|---|---|---|
| PID | Health | Country | Gender | Age | Wave 1 | Wave 2 | Wave 3 | Wave 1 | Wave 2 | Wave 3 | Wave 1 | Wave 2 | Wave 3 | Wave 1 | Wave 2 | Wave 3 | Wave 1 | Wave 2 | Wave 3 | Wave 1 | Wave 2 | Wave 3 | Wave 1 | Wave 2 | Wave 3 | Wave 1 | Wave 2 | Wave 3 | ||||||||
| 575 | Healthy | Hungary | Female | 65 | 5.0 | 8.0 | 5.0 | 7.0 | 3.0 | 85.0 | ||||||||||||||||||||||||||
| 569 | Healthy | Hungary | Female | 67 | 23,238.0 | 7.0 | 6.0 | 6.0 | 19.0 | 11.0 | 7.0 | 11.0 | 8.0 | 6.0 | 4.0 | 80.0 | 80.0 | 95.0 | ||||||||||||||||||
| 133 | Healthy | Hungary | Female | 71 | 19,164.0 | 19,262.9 | 6.0 | 6.0 | 6.0 | 17.0 | 13.0 | 6.0 | 14.0 | 8.0 | 7.0 | 6.0 | 4.0 | 95.0 | 95.0 | 99.0 | ||||||||||||||||
| 420 | Healthy | Hungary | Female | 71 | 576.0 | 2958.0 | 5.0 | 4.0 | 16.0 | 2.0 | 13.0 | 8.0 | 7.0 | 80.0 | 80.0 | |||||||||||||||||||||
| 215 | Healthy | Hungary | Female | 87 | 2446.0 | 5.0 | 33.0 | 3.0 | 10.0 | 8.0 | 12.0 | 80.0 | ||||||||||||||||||||||||
| 576 | Healthy | Hungary | Male | 60 | 2268.0 | 5.0 | 95.0 | |||||||||||||||||||||||||||||
| 535 | Healthy | Hungary | Male | 69 | 8712.0 | 6.0 | 3.0 | 9.0 | 12.0 | 6.0 | 1.0 | 95.0 | ||||||||||||||||||||||||
| 170 | Healthy | Hungary | Male | 70 | 8038.5 | 10,088.0 | 5.0 | 5.0 | 22.0 | 3.0 | 6.0 | 6.0 | 90.0 | 85.0 | ||||||||||||||||||||||
| 212 | Healthy | Hungary | Male | 72 | 8478.0 | 9793.5 | 5.0 | 4.0 | 5.0 | 90.0 | 90.0 | 90.0 | ||||||||||||||||||||||||
| 419 | Healthy | Hungary | Male | 95 | 2016.0 | 5.0 | 4.0 | 13.0 | 6.0 | 12.0 | 12.0 | 7.0 | 90.0 | 95.0 | ||||||||||||||||||||||
| 643 | Healthy | Spain | Female | 67 | 23,793.0 | 7.0 | 6.0 | 2.0 | 7.0 | 9.0 | 14.0 | 8.0 | 3.0 | 1.0 | 4.0 | 100.0 | 90.0 | |||||||||||||||||||
| 798 | Healthy | Spain | Female | 67 | 6.0 | 90.0 | ||||||||||||||||||||||||||||||
| 803 | Healthy | Spain | Female | 67 | 5.0 | 80.0 | ||||||||||||||||||||||||||||||
| 617 | Healthy | Spain | Female | 69 | 3186.0 | 4.0 | 4.0 | 61.0 | 7.0 | 13.0 | 19.0 | 10.0 | 100.0 | 90.0 | ||||||||||||||||||||||
| 620 | Healthy | Spain | Female | 69 | 3264.4 | 6.0 | 29.0 | 10.0 | 9.0 | 20.0 | 2.0 | 90.0 | ||||||||||||||||||||||||
| 640 | Healthy | Spain | Female | 69 | 5.0 | 26.0 | 14.0 | 10.0 | 6.0 | 70.0 | ||||||||||||||||||||||||||
| 628 | Healthy | Spain | Female | 70 | 7.0 | 3.0 | 11.0 | 5.0 | 1.0 | 100.0 | ||||||||||||||||||||||||||
| 638 | Healthy | Spain | Female | 71 | 6303.0 | 6.0 | 6.0 | 10.0 | 12.0 | 7.0 | 5.0 | 100.0 | 100.0 | |||||||||||||||||||||||
| 648 | Healthy | Spain | Female | 72 | 6.0 | 5.0 | 11.0 | 13.0 | 3.0 | 1.0 | 80.0 | |||||||||||||||||||||||||
| 649 | Healthy | Spain | Female | 72 | 14.0 | 80.0 | ||||||||||||||||||||||||||||||
| 795 | Healthy | Spain | Female | 72 | 2910.0 | 6.0 | 17.0 | 7.0 | 8.0 | 6.0 | 6.0 | 90.0 | ||||||||||||||||||||||||
| 630 | Healthy | Spain | Female | 74 | 5.0 | 31.0 | 12.0 | 18.0 | 12.0 | 75.0 | ||||||||||||||||||||||||||
| 411 | Healthy | Spain | Male | 45 | 5.0 | 80.0 | ||||||||||||||||||||||||||||||
| 790 | Healthy | Spain | Male | 66 | 10,101.0 | 6.0 | 3.0 | 11.0 | 14.0 | 7.0 | 4.0 | 100.0 | ||||||||||||||||||||||||
| 700 | Healthy | Spain | Male | 67 | 3.0 | 10.0 | 8.0 | 7.0 | 9.0 | 40.0 | ||||||||||||||||||||||||||
| 636 | Healthy | Spain | Male | 68 | 13,258.0 | 5.0 | 5.0 | 40.0 | 40.0 | |||||||||||||||||||||||||||
| 793 | Healthy | Spain | Male | 68 | 6560.0 | 5.0 | 100.0 | |||||||||||||||||||||||||||||
| 796 | Healthy | Spain | Male | 74 | 5907.0 | 4.0 | 2.0 | 9.0 | 14.0 | 0.0 | 80.0 | |||||||||||||||||||||||||
| 502 | Diseased | Hungary | Female | 63 | 80.0 | |||||||||||||||||||||||||||||||
| 169 | Diseased | Hungary | Female | 69 | 7338.0 | 21,702.0 | 5.0 | 5.0 | 5.0 | 68.0 | 51.0 | 47.0 | 7.0 | 5.0 | 7.0 | 12.0 | 12.0 | 13.0 | 15.0 | 8.0 | 15.0 | 15.0 | 14.0 | 80.0 | 75.0 | 80.0 | ||||||||||
| 132 | Diseased | Hungary | Male | 71 | 6.0 | 6.0 | 7.0 | 16.0 | 13.0 | 4.0 | 2.0 | 5.0 | 4.0 | 4.0 | 80.0 | 80.0 | 90.0 | |||||||||||||||||||
| 800 | Diseased | Spain | Female | 65 | 4.0 | 1.0 | 7.0 | 14.0 | 9.0 | 4.0 | 100.0 | |||||||||||||||||||||||||
| 641 | Diseased | Spain | Female | 71 | 18,390.0 | 5.0 | 6.0 | 51.0 | 23.0 | 9.0 | 10.0 | 15.0 | 14.0 | 8.0 | 50.0 | 80.0 | ||||||||||||||||||||
| 624 | Diseased | Spain | Female | 72 | 6.0 | 21.0 | 14.0 | 5.0 | 8.0 | 80.0 | ||||||||||||||||||||||||||
| 644 | Diseased | Spain | Male | 70 | 7.0 | 40.0 | ||||||||||||||||||||||||||||||
| 625 | Diseased | Spain | Male | 72 | 5.0 | 51.0 | 11.0 | 14.0 | 8.0 | 40.0 | ||||||||||||||||||||||||||
| 634 | Diseased | Spain | Male | 72 | 15,748.5 | 5.0 | 5.0 | 3.0 | 40.0 | 40.0 | ||||||||||||||||||||||||||
| 791 | Diseased | Spain | Male | 72 | 1953.0 | 7.0 | 100.0 | |||||||||||||||||||||||||||||
| 799 | Diseased | Spain | Male | 79 | 4.0 | 4.0 | 9.0 | 14.0 | 9.0 | 7.0 | 95.0 | |||||||||||||||||||||||||
Color coding: from orange (worse score) to yellow to green (better).
Physical Activity (IPAQ)
We recorded 27 answers about physical activity on the IPAQ scale [26] that partitions physical activity into low, moderate, and high levels. The scale is described in depth in Appendix B.1.1. All participants recorded a median (mean ± SD) numeric score of 8038 (9535 ± 7106). There were 14 answers with a low categorical level of physical activity, one answer with a moderate level, and 12 answers with a high level. Table A3 enumerates the answers and Figure A3 depicts the sub-scores and scores by participant group.
Participant physical activity separated into two groups at the extremes of low and high physical activity. The levels only approximated the numeric scores, as the low categorical scores concentrated in the lower third of numeric scores and the high categorical scores concentrated in the upper third of numeric scores; the middle third included low and high levels of physical activity alike.
The participants from Hungary self-reported increased physical activity as compared to those from Spain, registering a median (mean ± SD) numeric score of 8478 (9738 ± 7370) compared to 6431 (9281 ± 6752) and a median categorical level of high physical activity compared to low physical activity.
Male participants reported increased levels of physical activity, registering a higher median numeric score of 8478 compared to 6820; however, the most active 5 participants contributed to a lower mean (SD) numeric score of 7916 (4038) compared to 11037 (8806) for the females. Woman participants registered higher variability in their self-reported physical activity than men.
Less than half (12/27) of the answers reported physical activity related to the work domain. Only a few (7/27) answers reported cycling as a means of transportation, and they associated with the upper half of numeric scores. The participants from Hungary reported increased physical activity as compared to those from Spain. Male participants reported increased median physical activity, and female participants reported increased mean physical activity.
Table A3.
Characteristics of PRO Physical Activity (IPAQ).
Table A3.
Characteristics of PRO Physical Activity (IPAQ).
| ID | Health | Wave | Country | Gender | Age | Work Domain Walking Minutes | Work Domain Moderate Minutes | Work Domain Vigorous Minutes | Work Domain Total | Active Transport Domain Walking Minutes | Active Transport Domain Cycling Minutes | Active Transport Domain Total | Domestic Home Domain Moderate Minutes | Domestic Garden Domain Moderate Minutes | Domestic Garden Domain Vigorous Minutes | Domestic Garden Domain Total | Leisure Domain Walking Minutes | Leisure Domain Moderate Minutes | Leisure Domain Vigorous Minutes | Leisure Domain Total | Work Domain Numeric Sub-Score | Leisure Domain Numeric Sub-Score | Active Transport Domain Numeric Sub-Score | Domestic Garden Domain Numeric Sub-Score | Numeric Score | Categorical Score |
|---|---|---|---|---|---|---|---|---|---|---|---|---|---|---|---|---|---|---|---|---|---|---|---|---|---|---|
| 420 | Healthy | 1 | Hungary | Female | 71 | 0 | 0 | 0 | 0 | 90 | 0 | 90 | 60 | 0 | 0 | 60 | 30 | 0 | 0 | 30 | 0 | 99 | 297 | 180 | 576 | 0 |
| 791 | Diseased | 3 | Spain | Male | 72 | 0 | 0 | 0 | 0 | 210 | 0 | 210 | 420 | 0 | 0 | 420 | 0 | 0 | 0 | 0 | 0 | 0 | 693 | 1260 | 1953 | 0 |
| 419 | Healthy | 2 | Hungary | Male | 95 | 0 | 0 | 0 | 0 | 90 | 0 | 90 | 70 | 105 | 150 | 325 | 80 | 0 | 0 | 80 | 0 | 264 | 297 | 1455 | 2016 | 0 |
| 576 | Healthy | 2 | Hungary | Male | 60 | 20 | 360 | 70 | 450 | 20 | 0 | 20 | 10 | 10 | 0 | 20 | 20 | 0 | 0 | 20 | 2066 | 66 | 66 | 70 | 2268 | 1 |
| 215 | Healthy | 1 | Hungary | Female | 87 | 0 | 0 | 0 | 0 | 360 | 0 | 360 | 10 | 10 | 0 | 20 | 360 | 0 | 0 | 360 | 0 | 1188 | 1188 | 70 | 2446 | 0 |
| 795 | Healthy | 3 | Spain | Female | 72 | 0 | 0 | 0 | 0 | 140 | 0 | 140 | 420 | 0 | 0 | 420 | 360 | 0 | 0 | 360 | 0 | 1188 | 462 | 1260 | 2910 | 0 |
| 420 | Healthy | 2 | Hungary | Female | 71 | 0 | 0 | 0 | 0 | 30 | 0 | 30 | 920 | 0 | 0 | 920 | 30 | 0 | 0 | 30 | 0 | 99 | 99 | 2760 | 2958 | 0 |
| 617 | Healthy | 2 | Spain | Female | 69 | 0 | 0 | 0 | 0 | 280 | 0 | 280 | 210 | 210 | 0 | 420 | 240 | 0 | 0 | 240 | 0 | 792 | 924 | 1470 | 3186 | 0 |
| 620 | Healthy | 2 | Spain | Female | 69 | 0 | 0 | 0 | 0 | 273 | 0 | 273 | 360 | 61 | 0 | 421 | 315 | 0 | 0 | 315 | 0 | 1039 | 900 | 1324 | 3264 | 0 |
| 796 | Healthy | 3 | Spain | Male | 74 | 0 | 0 | 0 | 0 | 210 | 0 | 210 | 210 | 210 | 150 | 570 | 630 | 210 | 0 | 840 | 0 | 2919 | 693 | 2295 | 5907 | 0 |
| 638 | Healthy | 2 | Spain | Female | 71 | 0 | 0 | 0 | 0 | 210 | 0 | 210 | 420 | 840 | 0 | 1260 | 300 | 0 | 0 | 300 | 0 | 990 | 693 | 4620 | 6303 | 0 |
| 793 | Healthy | 3 | Spain | Male | 68 | 140 | 70 | 65 | 275 | 210 | 0 | 210 | 105 | 420 | 300 | 825 | 0 | 0 | 120 | 120 | 1262 | 960 | 693 | 3645 | 6560 | 2 |
| 169 | Diseased | 2 | Hungary | Female | 69 | 0 | 0 | 0 | 0 | 30 | 0 | 30 | 60 | 1680 | 0 | 1740 | 30 | 0 | 30 | 60 | 0 | 339 | 99 | 6900 | 7338 | 2 |
| 170 | Healthy | 2 | Hungary | Male | 70 | 540 | 350 | 210 | 1100 | 280 | 60 | 340 | 80 | 40 | 150 | 270 | 75 | 105 | 0 | 180 | 4862 | 667 | 1284 | 1225 | 8038 | 2 |
| 212 | Healthy | 1 | Hungary | Male | 72 | 0 | 0 | 0 | 0 | 360 | 360 | 720 | 180 | 180 | 0 | 360 | 300 | 240 | 240 | 780 | 0 | 3870 | 3348 | 1260 | 8478 | 0 |
| 535 | Healthy | 3 | Hungary | Male | 69 | 180 | 0 | 0 | 180 | 630 | 0 | 630 | 0 | 360 | 0 | 360 | 630 | 630 | 0 | 1260 | 594 | 4599 | 2079 | 1440 | 8712 | 2 |
| 212 | Healthy | 2 | Hungary | Male | 72 | 0 | 0 | 0 | 0 | 375 | 720 | 1095 | 0 | 60 | 0 | 60 | 120 | 0 | 450 | 570 | 0 | 3996 | 5557 | 240 | 9793 | 0 |
| 170 | Healthy | 3 | Hungary | Male | 70 | 210 | 420 | 300 | 930 | 350 | 200 | 550 | 140 | 140 | 300 | 580 | 100 | 0 | 0 | 100 | 4773 | 330 | 2355 | 2630 | 10,088 | 2 |
| 790 | Healthy | 3 | Spain | Male | 66 | 0 | 0 | 0 | 0 | 840 | 0 | 840 | 630 | 0 | 0 | 630 | 630 | 840 | 0 | 1470 | 0 | 5439 | 2772 | 1890 | 10,101 | 0 |
| 636 | Healthy | 2 | Spain | Male | 68 | 240 | 40 | 180 | 460 | 840 | 0 | 840 | 360 | 1440 | 60 | 1860 | 280 | 0 | 0 | 280 | 2392 | 924 | 2772 | 7170 | 13,258 | 2 |
| 634 | Diseased | 2 | Spain | Male | 72 | 840 | 840 | 105 | 1785 | 840 | 450 | 1290 | 120 | 180 | 30 | 330 | 315 | 225 | 15 | 555 | 6972 | 2059 | 5472 | 1245 | 15,748 | 2 |
| 641 | Diseased | 2 | Spain | Female | 71 | 2940 | 0 | 0 | 2940 | 280 | 0 | 280 | 840 | 840 | 0 | 1680 | 280 | 240 | 0 | 520 | 9702 | 1884 | 924 | 5880 | 18,390 | 2 |
| 133 | Healthy | 2 | Hungary | Female | 71 | 630 | 840 | 450 | 1920 | 630 | 240 | 870 | 420 | 420 | 240 | 1080 | 420 | 240 | 0 | 660 | 9039 | 2346 | 3519 | 4260 | 19,164 | 2 |
| 133 | Healthy | 3 | Hungary | Female | 71 | 540 | 1050 | 520 | 2110 | 840 | 0 | 840 | 420 | 360 | 171 | 951 | 420 | 150 | 90 | 660 | 10,142 | 2706 | 2772 | 3642 | 19,262 | 2 |
| 169 | Diseased | 3 | Hungary | Female | 69 | 420 | 420 | 840 | 1680 | 120 | 120 | 240 | 1260 | 1260 | 360 | 2880 | 0 | 0 | 0 | 0 | 9786 | 0 | 1116 | 10,800 | 21,702 | 2 |
| 569 | Healthy | 2 | Hungary | Female | 67 | 630 | 360 | 0 | 990 | 770 | 0 | 770 | 490 | 770 | 550 | 1810 | 910 | 550 | 550 | 2010 | 3519 | 9603 | 2541 | 7575 | 23,238 | 2 |
| 643 | Healthy | 2 | Spain | Female | 67 | 0 | 0 | 0 | 0 | 840 | 0 | 840 | 1470 | 1470 | 0 | 2940 | 1470 | 1470 | 0 | 2940 | 0 | 10,731 | 2772 | 10,290 | 23,793 | 0 |
| Median: Healthy | 0.0 | 0.0 | 0.0 | 0.0 | 315.0 | 0.0 | 350.0 | 210.0 | 160.0 | 0.0 | 495.5 | 300.0 | 0.0 | 0.0 | 337.5 | 0.0 | 1113.5 | 1236.0 | 1680.0 | 7299.0 | 0.0 | |||||
| Median: Diseased | 420.0 | 0.0 | 0.0 | 1680.0 | 210.0 | 0.0 | 240.0 | 420.0 | 840.0 | 0.0 | 1680.0 | 30.0 | 0.0 | 0.0 | 60.0 | 6972.0 | 339.0 | 924.0 | 5880.0 | 15,748.0 | 2.0 | |||||
| Median: Spain | 0.0 | 0.0 | 0.0 | 0.0 | 276.5 | 0.0 | 276.5 | 390.0 | 210.0 | 0.0 | 600.0 | 307.5 | 0.0 | 0.0 | 337.5 | 0.0 | 1113.5 | 912.0 | 2092.5 | 6431.5 | 0.0 | |||||
| Median: Hungary | 20.0 | 0.0 | 0.0 | 180.0 | 350.0 | 0.0 | 360.0 | 80.0 | 140.0 | 0.0 | 360.0 | 100.0 | 0.0 | 0.0 | 180.0 | 594.0 | 667.0 | 1284.0 | 1455.0 | 8478.0 | 2.0 | |||||
| Median: Female | 0.0 | 0.0 | 0.0 | 0.0 | 276.5 | 0.0 | 276.5 | 420.0 | 390.0 | 0.0 | 1015.5 | 307.5 | 0.0 | 0.0 | 337.5 | 0.0 | 1113.5 | 924.0 | 3951.0 | 6820.5 | 0.0 | |||||
| Median: Male | 20.0 | 0.0 | 0.0 | 180.0 | 350.0 | 0.0 | 550.0 | 120.0 | 140.0 | 30.0 | 360.0 | 120.0 | 0.0 | 0.0 | 280.0 | 594.0 | 960.0 | 2079.0 | 1440.0 | 8478.0 | 1.0 | |||||
| Median: All | 0.0 | 0.0 | 0.0 | 0.0 | 280.0 | 0.0 | 280.0 | 210.0 | 180.0 | 0.0 | 570.0 | 280.0 | 0.0 | 0.0 | 315.0 | 0.0 | 1039.0 | 1116.0 | 1890.0 | 8038.0 | 0.0 | |||||
| Mean: Healthy | 142.2 | 158.6 | 81.5 | 382.5 | 394.0 | 71.8 | 465.8 | 317.5 | 323.0 | 94.1 | 734.6 | 350.9 | 201.5 | 65.9 | 618.4 | 1756.7 | 2491.5 | 1731.0 | 2762.3 | 8741.7 | 0.7 | |||||
| Mean: Diseased | 840.0 | 252.0 | 189.0 | 1281.0 | 296.0 | 114.0 | 410.0 | 540.0 | 792.0 | 78.0 | 1410.0 | 125.0 | 93.0 | 9.0 | 227.0 | 5292.0 | 856.4 | 1660.8 | 5217.0 | 13,026.2 | 1.6 | |||||
| Mean: Spain | 346.6 | 79.1 | 29.1 | 455.0 | 431.0 | 37.5 | 468.5 | 463.7 | 472.5 | 45.0 | 981.3 | 401.6 | 248.7 | 11.2 | 661.6 | 1694.0 | 2410.4 | 1647.5 | 3529.0 | 9281.0 | 0.6 | |||||
| Mean: Hungary | 211.3 | 253.3 | 159.3 | 624.0 | 331.6 | 113.3 | 445.0 | 274.6 | 359.6 | 128.0 | 762.4 | 235.0 | 127.6 | 90.6 | 453.3 | 2985.4 | 2011.4 | 1774.4 | 2967.1 | 9738.4 | 1.1 | |||||
| Mean: Female | 368.5 | 190.7 | 129.2 | 688.5 | 349.5 | 25.7 | 375.2 | 525.7 | 565.7 | 94.3 | 1185.8 | 368.9 | 189.2 | 47.8 | 606.0 | 3013.4 | 2357.4 | 1307.5 | 4359.3 | 11,037.8 | 0.8 | |||||
| Mean: Male | 166.9 | 160.0 | 71.5 | 398.4 | 404.2 | 137.6 | 541.9 | 178.8 | 241.9 | 87.6 | 508.4 | 244.6 | 173.0 | 63.4 | 481.1 | 1763.1 | 2007.1 | 2160.0 | 1986.5 | 7916.9 | 1.0 | |||||
| Mean: All | 271.4 | 175.9 | 101.4 | 548.8 | 375.8 | 79.6 | 455.4 | 358.7 | 409.8 | 91.1 | 859.7 | 309.0 | 181.4 | 55.3 | 545.9 | 2411.4 | 2188.7 | 1718.0 | 3216.8 | 9535.1 | 0.9 | |||||
| SD: Healthy | 222.1 | 287.5 | 151.0 | 621.4 | 279.3 | 169.9 | 329.1 | 340.9 | 426.9 | 142.3 | 698.2 | 339.5 | 360.8 | 149.1 | 712.8 | 2918.6 | 2874.2 | 1384.6 | 2603.3 | 6816.5 | 0.9 | |||||
| SD: Diseased | 1095.2 | 336.0 | 328.0 | 1135.5 | 284.7 | 174.3 | 448.2 | 453.7 | 634.2 | 141.4 | 947.5 | 141.7 | 114.0 | 12.0 | 254.7 | 4437.9 | 920.5 | 1936.0 | 3629.7 | 7299.5 | 0.8 | |||||
| SD: Spain | 815.6 | 230.3 | 55.8 | 895.9 | 291.5 | 124.3 | 362.0 | 363.3 | 521.7 | 87.8 | 773.2 | 370.9 | 435.5 | 33.0 | 780.1 | 3103.9 | 2846.0 | 1445.5 | 2806.5 | 6752.6 | 0.9 | |||||
| SD: Hungary | 253.0 | 324.5 | 249.8 | 748.7 | 267.8 | 195.0 | 348.6 | 362.0 | 487.6 | 164.9 | 799.1 | 259.3 | 200.6 | 172.8 | 549.7 | 3742.2 | 2564.1 | 1543.9 | 3086.5 | 7370.5 | 0.9 | |||||
| SD: Female | 756.0 | 338.5 | 259.7 | 998.0 | 285.3 | 66.9 | 302.6 | 427.4 | 563.6 | 167.8 | 902.9 | 380.1 | 387.2 | 141.2 | 810.3 | 4307.0 | 3290.5 | 1077.2 | 3401.1 | 8806.6 | 0.9 | |||||
| SD: Male | 246.3 | 249.2 | 96.1 | 534.8 | 277.5 | 223.1 | 385.3 | 179.7 | 368.3 | 108.1 | 444.1 | 234.8 | 259.6 | 130.7 | 466.3 | 2262.5 | 1849.5 | 1749.5 | 1745.9 | 4038.2 | 0.9 | |||||
| SD: All | 579.4 | 299.3 | 200.6 | 821.7 | 282.9 | 171.5 | 354.8 | 374.6 | 506.1 | 142.2 | 795.1 | 324.5 | 332.0 | 136.5 | 670.1 | 3531.8 | 2700.3 | 1502.3 | 2978.4 | 7106.2 | 0.9 | |||||
Color coding: from orange (worse outcome relative to others) to yellow to green (better outcome).

Figure A3.
Sub-scores and Scores for Physical Activity (IPAQ).
Social Support (MSPSS)
Participants provided 55 answers on the MSPSS scale [27]. Their levels of social support were on a numeric scale from 1.0 to 7.0 corresponding to the categorical low, moderate, or high levels of social support. We describe this scale in Appendix B.1.1. All participants had a median (mean ± SD) numeric score of 5.0 (5.4 ± 0.9). Most answers corresponded to high social support. The levels of social support from separate sources (significant other, family, and friends) were also generally high. No answers reported low social support. Health status, country, and gender did not appear to change the level of social support fundamentally, neither by source nor in general. Table A4 enumerates the answers and Figure A4 depicts the sub-scores and scores by participant group.
Both healthy and diseased participants reported only slightly different levels of social support, as observed from the median (mean ± SD) of 5.0 (5.3 ± 0.9) healthy and 5.0 (5.5 ± 0.9) diseased. Participants with disease reported slightly higher significant other social support, registering mean numeric sub-scores of 5.8 compared to 5.5 for the significant other social support, 5.6 compared to 5.5 for the family social support, and 5.6 compared to 5.4 for the friends social support. Also, the answers had similar variations when comparing groups by health status. We observed no specific questions where the levels of social support differed by health.
Participants from Spain and Hungary self-reported similar levels of social support, registering similar medians (means) of 5.0 (5.4). Participants from Hungary self-reported more stable answers with SD 0.8 vs. 1.0.
Table A4.
Characteristics of PRO Social Support (MSPSS).
Table A4.
Characteristics of PRO Social Support (MSPSS).
| ID | Health | Wave | Country | Gender | Age | Q1: Special Person: Around When in Need | Q2: Special Person: Share Joys and Sorrows | Q3: Family: Tries to Help | Q4: Family: Gives Emotional Help and Support | Q5: Special Person: Real Source of Comfort | Q6: Friends: Try to Help | Q7: Friends: counted on when things go wrong | Q8: Family: Talk About Problems | Q9: Friends: Share My Joys and Sorrows | Q10: Special Person: Cares about Feelings | Q11: Family: Willing to Help Make Decisions | Q12: Friends: talk about problems | Significant Other Numeric Sub-Score | Family Numeric Sub-Score | Friends Numeric Sub-Score | Numeric Score | Categorical Score |
|---|---|---|---|---|---|---|---|---|---|---|---|---|---|---|---|---|---|---|---|---|---|---|
| 700 | Healthy | 2 | Spain | Male | 67 | 5 | 5 | 4 | 2 | 2 | 3 | 4 | 2 | 6 | 4 | 4 | 5 | 4 | 3 | 4 | 3 | 1 |
| 420 | Healthy | 2 | Hungary | Female | 71 | 6 | 6 | 5 | 5 | 5 | 4 | 4 | 5 | 4 | 5 | 4 | 5 | 5 | 4 | 4 | 4 | 1 |
| 212 | Healthy | 2 | Hungary | Male | 72 | 3 | 5 | 5 | 6 | 5 | 5 | 5 | 5 | 5 | 5 | 5 | 5 | 4 | 5 | 5 | 4 | 1 |
| 419 | Healthy | 2 | Hungary | Male | 95 | 5 | 6 | 5 | 6 | 6 | 4 | 4 | 5 | 1 | 6 | 6 | 1 | 5 | 5 | 2 | 4 | 1 |
| 800 | Diseased | 3 | Spain | Female | 65 | 5 | 6 | 5 | 4 | 5 | 4 | 5 | 4 | 5 | 6 | 4 | 5 | 5 | 4 | 4 | 4 | 1 |
| 617 | Healthy | 1 | Spain | Female | 69 | 5 | 2 | 5 | 4 | 4 | 5 | 5 | 3 | 4 | 5 | 3 | 5 | 4 | 3 | 4 | 4 | 1 |
| 617 | Healthy | 2 | Spain | Female | 69 | 4 | 4 | 4 | 4 | 4 | 4 | 4 | 4 | 5 | 4 | 5 | 5 | 4 | 4 | 4 | 4 | 1 |
| 796 | Healthy | 3 | Spain | Male | 74 | 4 | 4 | 4 | 4 | 4 | 6 | 6 | 4 | 6 | 4 | 4 | 6 | 4 | 4 | 6 | 4 | 1 |
| 799 | Diseased | 3 | Spain | Male | 79 | 4 | 4 | 4 | 4 | 4 | 4 | 4 | 4 | 4 | 4 | 4 | 4 | 4 | 4 | 4 | 4 | 1 |
| 575 | Healthy | 2 | Hungary | Female | 65 | 5 | 6 | 7 | 7 | 3 | 5 | 5 | 6 | 6 | 5 | 3 | 5 | 4 | 5 | 5 | 5 | 1 |
| 169 | Diseased | 1 | Hungary | Female | 69 | 6 | 7 | 5 | 3 | 6 | 7 | 7 | 3 | 7 | 6 | 5 | 7 | 6 | 4 | 7 | 5 | 1 |
| 169 | Diseased | 2 | Hungary | Female | 69 | 5 | 5 | 6 | 5 | 5 | 6 | 7 | 5 | 7 | 6 | 6 | 7 | 5 | 5 | 6 | 5 | 1 |
| 169 | Diseased | 3 | Hungary | Female | 69 | 6 | 7 | 5 | 5 | 4 | 7 | 7 | 3 | 7 | 6 | 4 | 7 | 5 | 4 | 7 | 5 | 1 |
| 420 | Healthy | 1 | Hungary | Female | 71 | 6 | 6 | 6 | 5 | 6 | 1 | 5 | 5 | 5 | 6 | 4 | 5 | 6 | 5 | 4 | 5 | 1 |
| 215 | Healthy | 1 | Hungary | Female | 87 | 6 | 6 | 6 | 6 | 5 | 5 | 5 | 5 | 5 | 6 | 6 | 5 | 5 | 5 | 5 | 5 | 1 |
| 576 | Healthy | 2 | Hungary | Male | 60 | 5 | 5 | 5 | 5 | 5 | 5 | 5 | 5 | 5 | 5 | 5 | 5 | 5 | 5 | 5 | 5 | 1 |
| 170 | Healthy | 2 | Hungary | Male | 70 | 5 | 5 | 6 | 5 | 5 | 6 | 6 | 5 | 7 | 5 | 7 | 7 | 5 | 5 | 6 | 5 | 1 |
| 170 | Healthy | 3 | Hungary | Male | 70 | 5 | 5 | 6 | 4 | 6 | 6 | 6 | 5 | 6 | 5 | 5 | 6 | 5 | 5 | 6 | 5 | 1 |
| 212 | Healthy | 1 | Hungary | Male | 72 | 6 | 6 | 5 | 6 | 5 | 5 | 5 | 6 | 5 | 6 | 5 | 5 | 5 | 5 | 5 | 5 | 1 |
| 212 | Healthy | 3 | Hungary | Male | 72 | 5 | 5 | 5 | 5 | 5 | 5 | 5 | 5 | 5 | 5 | 5 | 5 | 5 | 5 | 5 | 5 | 1 |
| 419 | Healthy | 1 | Hungary | Male | 95 | 6 | 6 | 5 | 5 | 6 | 5 | 5 | 5 | 5 | 6 | 5 | 5 | 6 | 5 | 5 | 5 | 1 |
| 640 | Healthy | 1 | Spain | Female | 69 | 1 | 6 | 5 | 5 | 6 | 5 | 6 | 6 | 6 | 6 | 6 | 6 | 4 | 5 | 5 | 5 | 1 |
| 641 | Diseased | 1 | Spain | Female | 71 | 3 | 6 | 6 | 5 | 6 | 6 | 6 | 5 | 6 | 3 | 6 | 6 | 4 | 5 | 6 | 5 | 1 |
| 630 | Healthy | 1 | Spain | Female | 74 | 4 | 6 | 5 | 3 | 5 | 6 | 6 | 6 | 6 | 6 | 4 | 6 | 5 | 4 | 6 | 5 | 1 |
| 411 | Healthy | 1 | Spain | Male | 45 | 1 | 7 | 6 | 6 | 6 | 5 | 6 | 6 | 6 | 7 | 6 | 7 | 5 | 6 | 6 | 5 | 1 |
| 636 | Healthy | 1 | Spain | Male | 68 | 7 | 5 | 6 | 6 | 7 | 5 | 5 | 6 | 5 | 7 | 5 | 5 | 6 | 5 | 5 | 5 | 1 |
| 636 | Healthy | 2 | Spain | Male | 68 | 5 | 7 | 5 | 6 | 5 | 5 | 5 | 5 | 5 | 6 | 5 | 5 | 5 | 5 | 5 | 5 | 1 |
| 793 | Healthy | 3 | Spain | Male | 68 | 6 | 6 | 6 | 6 | 6 | 5 | 5 | 6 | 6 | 6 | 6 | 6 | 6 | 6 | 5 | 5 | 1 |
| 625 | Diseased | 1 | Spain | Male | 72 | 7 | 7 | 7 | 7 | 7 | 5 | 2 | 7 | 3 | 7 | 7 | 5 | 7 | 7 | 3 | 5 | 1 |
| 634 | Diseased | 1 | Spain | Male | 72 | 3 | 6 | 6 | 6 | 5 | 5 | 5 | 6 | 5 | 6 | 7 | 5 | 5 | 6 | 5 | 5 | 1 |
| 634 | Diseased | 2 | Spain | Male | 72 | 6 | 5 | 6 | 5 | 5 | 5 | 5 | 5 | 5 | 5 | 5 | 5 | 5 | 5 | 5 | 5 | 1 |
| 569 | Healthy | 2 | Hungary | Female | 67 | 6 | 7 | 7 | 7 | 7 | 5 | 5 | 7 | 5 | 7 | 7 | 5 | 6 | 7 | 5 | 6 | 2 |
| 569 | Healthy | 3 | Hungary | Female | 67 | 7 | 7 | 7 | 7 | 7 | 6 | 6 | 7 | 6 | 7 | 6 | 6 | 7 | 6 | 6 | 6 | 2 |
| 133 | Healthy | 1 | Hungary | Female | 71 | 7 | 7 | 7 | 7 | 7 | 6 | 6 | 7 | 6 | 7 | 6 | 7 | 7 | 6 | 6 | 6 | 2 |
| 133 | Healthy | 2 | Hungary | Female | 71 | 7 | 7 | 7 | 6 | 7 | 6 | 7 | 7 | 6 | 7 | 7 | 7 | 7 | 6 | 6 | 6 | 2 |
| 133 | Healthy | 3 | Hungary | Female | 71 | 6 | 7 | 7 | 7 | 7 | 6 | 6 | 7 | 6 | 7 | 6 | 6 | 6 | 6 | 6 | 6 | 2 |
| 535 | Healthy | 3 | Hungary | Male | 69 | 7 | 7 | 7 | 7 | 7 | 6 | 6 | 7 | 6 | 6 | 7 | 6 | 6 | 7 | 6 | 6 | 2 |
| 132 | Diseased | 1 | Hungary | Male | 71 | 7 | 7 | 7 | 7 | 7 | 6 | 6 | 6 | 5 | 7 | 6 | 5 | 7 | 6 | 5 | 6 | 2 |
| 132 | Diseased | 2 | Hungary | Male | 71 | 7 | 7 | 7 | 7 | 7 | 6 | 6 | 6 | 5 | 7 | 7 | 5 | 7 | 6 | 5 | 6 | 2 |
| 643 | Healthy | 2 | Spain | Female | 67 | 6 | 6 | 6 | 6 | 6 | 6 | 6 | 6 | 6 | 6 | 6 | 6 | 6 | 6 | 6 | 6 | 2 |
| 798 | Healthy | 3 | Spain | Female | 67 | 6 | 6 | 6 | 6 | 6 | 6 | 6 | 6 | 6 | 6 | 6 | 6 | 6 | 6 | 6 | 6 | 2 |
| 620 | Healthy | 2 | Spain | Female | 69 | 6 | 6 | 6 | 6 | 6 | 6 | 6 | 6 | 6 | 6 | 6 | 6 | 6 | 6 | 6 | 6 | 2 |
| 638 | Healthy | 1 | Spain | Female | 71 | 7 | 7 | 7 | 7 | 7 | 6 | 6 | 7 | 6 | 6 | 6 | 6 | 6 | 6 | 6 | 6 | 2 |
| 638 | Healthy | 2 | Spain | Female | 71 | 6 | 6 | 7 | 6 | 6 | 5 | 5 | 7 | 6 | 7 | 6 | 6 | 6 | 6 | 5 | 6 | 2 |
| 641 | Diseased | 2 | Spain | Female | 71 | 5 | 6 | 7 | 7 | 6 | 6 | 6 | 6 | 6 | 4 | 7 | 6 | 5 | 6 | 6 | 6 | 2 |
| 624 | Diseased | 1 | Spain | Female | 72 | 7 | 6 | 7 | 7 | 7 | 6 | 7 | 7 | 7 | 7 | 7 | 7 | 6 | 7 | 6 | 6 | 2 |
| 648 | Healthy | 1 | Spain | Female | 72 | 6 | 6 | 6 | 6 | 6 | 6 | 6 | 6 | 6 | 6 | 6 | 6 | 6 | 6 | 6 | 6 | 2 |
| 795 | Healthy | 3 | Spain | Female | 72 | 6 | 6 | 7 | 7 | 6 | 7 | 7 | 7 | 7 | 7 | 7 | 6 | 6 | 7 | 6 | 6 | 2 |
| 790 | Healthy | 3 | Spain | Male | 66 | 7 | 6 | 7 | 7 | 7 | 6 | 6 | 7 | 6 | 5 | 7 | 6 | 6 | 7 | 6 | 6 | 2 |
| 569 | Healthy | 1 | Hungary | Female | 67 | 7 | 7 | 7 | 7 | 7 | 7 | 7 | 7 | 7 | 7 | 7 | 7 | 7 | 7 | 7 | 7 | 2 |
| 132 | Diseased | 3 | Hungary | Male | 71 | 7 | 7 | 7 | 7 | 7 | 7 | 7 | 7 | 7 | 7 | 7 | 7 | 7 | 7 | 7 | 7 | 2 |
| 643 | Healthy | 1 | Spain | Female | 67 | 7 | 7 | 7 | 7 | 7 | 7 | 7 | 7 | 7 | 7 | 7 | 7 | 7 | 7 | 7 | 7 | 2 |
| 628 | Healthy | 1 | Spain | Female | 70 | 7 | 7 | 7 | 7 | 7 | 7 | 7 | 7 | 7 | 7 | 7 | 7 | 7 | 7 | 7 | 7 | 2 |
| 644 | Diseased | 1 | Spain | Male | 70 | 7 | 7 | 7 | 7 | 7 | 7 | 7 | 7 | 7 | 7 | 7 | 7 | 7 | 7 | 7 | 7 | 2 |
| 791 | Diseased | 3 | Spain | Male | 72 | 7 | 7 | 7 | 7 | 7 | 7 | 7 | 7 | 7 | 7 | 7 | 7 | 7 | 7 | 7 | 7 | 2 |
| Median: Healthy | 6.0 | 6.0 | 6.0 | 6.0 | 6.0 | 5.0 | 6.0 | 6.0 | 6.0 | 6.0 | 6.0 | 6.0 | 6.0 | 5.0 | 6.0 | 5.0 | 1.0 | |||||
| Median: Diseased | 6.0 | 6.5 | 6.5 | 6.5 | 6.0 | 6.0 | 6.0 | 6.0 | 6.0 | 6.0 | 6.5 | 6.0 | 5.5 | 6.0 | 6.0 | 5.0 | 1.0 | |||||
| Median: Spain | 6.0 | 6.0 | 6.0 | 6.0 | 6.0 | 6.0 | 6.0 | 6.0 | 6.0 | 6.0 | 6.0 | 6.0 | 6.0 | 6.0 | 6.0 | 5.0 | 1.0 | |||||
| Median: Hungary | 6.0 | 6.0 | 6.0 | 6.0 | 6.0 | 6.0 | 6.0 | 5.0 | 6.0 | 6.0 | 6.0 | 5.0 | 6.0 | 5.0 | 5.0 | 5.0 | 1.0 | |||||
| Median: Female | 6.0 | 6.0 | 6.0 | 6.0 | 6.0 | 6.0 | 6.0 | 6.0 | 6.0 | 6.0 | 6.0 | 6.0 | 6.0 | 6.0 | 6.0 | 6.0 | 2.0 | |||||
| Median: Male | 6.0 | 6.0 | 6.0 | 6.0 | 6.0 | 5.0 | 5.0 | 6.0 | 5.0 | 6.0 | 6.0 | 5.0 | 5.0 | 5.0 | 5.0 | 5.0 | 1.0 | |||||
| Median: All | 6.0 | 6.0 | 6.0 | 6.0 | 6.0 | 6.0 | 6.0 | 6.0 | 6.0 | 6.0 | 6.0 | 6.0 | 6.0 | 6.0 | 6.0 | 5.0 | 1.0 | |||||
| Mean: Healthy | 5.5 | 5.9 | 5.9 | 5.7 | 5.7 | 5.3 | 5.5 | 5.7 | 5.6 | 5.9 | 5.5 | 5.6 | 5.5 | 5.4 | 5.3 | 5.3 | 1.4 | |||||
| Mean: Diseased | 5.7 | 6.2 | 6.1 | 5.8 | 5.9 | 5.8 | 5.8 | 5.5 | 5.8 | 5.9 | 6.0 | 5.9 | 5.7 | 5.6 | 5.6 | 5.5 | 1.4 | |||||
| Mean: Spain | 5.3 | 5.8 | 5.9 | 5.6 | 5.7 | 5.5 | 5.6 | 5.7 | 5.7 | 5.8 | 5.7 | 5.8 | 5.4 | 5.5 | 5.4 | 5.3 | 1.4 | |||||
| Mean: Hungary | 5.9 | 6.2 | 6.0 | 5.8 | 5.8 | 5.4 | 5.7 | 5.6 | 5.5 | 6.0 | 5.6 | 5.6 | 5.7 | 5.4 | 5.4 | 5.3 | 1.4 | |||||
| Mean: Female | 5.7 | 6.1 | 6.1 | 5.8 | 5.8 | 5.6 | 5.9 | 5.8 | 5.9 | 6.0 | 5.6 | 6.0 | 5.6 | 5.5 | 5.6 | 5.5 | 1.5 | |||||
| Mean: Male | 5.4 | 5.8 | 5.8 | 5.7 | 5.7 | 5.3 | 5.3 | 5.5 | 5.3 | 5.8 | 5.7 | 5.4 | 5.5 | 5.5 | 5.2 | 5.1 | 1.2 | |||||
| Mean: All | 5.6 | 6.0 | 6.0 | 5.7 | 5.8 | 5.5 | 5.6 | 5.6 | 5.6 | 5.9 | 5.7 | 5.7 | 5.5 | 5.5 | 5.4 | 5.3 | 1.4 | |||||
| SD: Healthy | 1.4 | 1.0 | 0.9 | 1.2 | 1.1 | 1.1 | 0.8 | 1.1 | 1.0 | 0.9 | 1.1 | 1.0 | 0.9 | 1.0 | 0.9 | 0.9 | 0.4 | |||||
| SD: Diseased | 1.3 | 0.9 | 0.9 | 1.3 | 1.0 | 0.9 | 1.3 | 1.3 | 1.2 | 1.2 | 1.1 | 1.0 | 1.0 | 1.1 | 1.2 | 0.9 | 0.4 | |||||
| SD: Spain | 1.6 | 1.1 | 1.0 | 1.3 | 1.2 | 0.9 | 1.1 | 1.3 | 0.9 | 1.1 | 1.1 | 0.7 | 1.0 | 1.2 | 1.0 | 1.0 | 0.4 | |||||
| SD: Hungary | 0.9 | 0.8 | 0.8 | 1.1 | 1.1 | 1.2 | 0.9 | 1.1 | 1.2 | 0.7 | 1.1 | 1.2 | 0.9 | 0.8 | 1.0 | 0.7 | 0.4 | |||||
| SD: Female | 1.3 | 1.0 | 0.8 | 1.2 | 1.0 | 1.2 | 0.8 | 1.3 | 0.8 | 1.0 | 1.2 | 0.7 | 0.9 | 1.1 | 0.9 | 0.8 | 0.4 | |||||
| SD: Male | 1.5 | 0.9 | 1.0 | 1.2 | 1.2 | 0.9 | 1.0 | 1.1 | 1.2 | 1.0 | 1.0 | 1.2 | 1.0 | 1.0 | 1.1 | 0.9 | 0.4 | |||||
| SD: All | 1.4 | 1.0 | 0.9 | 1.2 | 1.1 | 1.1 | 1.0 | 1.2 | 1.1 | 1.0 | 1.1 | 1.0 | 1.0 | 1.0 | 1.0 | 0.9 | 0.4 | |||||
Color coding: from orange (worse outcome relative to others) to yellow to green (better outcome).
Men self-reported lower social support than women, as observed in the median (mean ± std) numeric scores of 5.0 (5.2 ± 1.0) vs. 6.0 (5.5 ± 0.8) as well as median categorical score drop from high to moderate. Males self-reported less social support from the friends at means 5.2 vs. 5.6, less social support from the significant other at means 5.5 vs. 5.6, and similar social support from the family at mean 5.5.

Figure A4.
Sub-scores and Scores for Social Support (MSPSS). Dotted markings delimit levels of the categorical score.
Anxiety and Depression (GADS)
We measured anxiety and depression through 34 answers on the GADS scale [28]. The scale assesses whether the anxiety and depression are categorized as absent, possible, mild, moderate, or severe through a numeric score from 0 to 90. It can be consulted in Appendix B.1.1. Participant mean ± SD numeric score was 20.8 ± 18.1. Participants self-reported absent anxiety and depression in 10 answers, possible anxiety and depression in 12 answers, mild in 6 answers, moderate in 4 answers, and severe in 2 answers. Table A5 enumerates the answers and Figure A5 illustrates the scores by participant group.
Most answers corresponding to moderate and severe anxiety and depression originated from participants who self-reported as diseased. Across the items and scores, the participants with disease reported more substantial anxiety and depression than the healthy participants, in particular for questions Q3A and Q7D. The median (mean ± SD) value for Q3A was 3.0 (2.0 ± 1.7) vs. 1.0 (0.9 ± 0.9). The median (mean ± SD) value for Q7D was 4.0 (2.8 ± 1.8) vs. 1.0 (1.3 ± 1.3), different by 2 and 3 levels, respectively. The median categorical scores were also different by one level, from possible to mild anxiety and depression. The answers from healthy participants had less variability than the answers from the participants with disease.
Across multiple items, women reported more anxiety and depression than male participants, yielding numeric scores higher by 8 units, as observed by the median (mean ± SD) scores of 18.0 (23.8 ± 18.8) compared to 11.5 (13.7 ± 13.9). They reported anxiety and depression with higher variability as well.
Table A5.
Characteristics of PRO Anxiety and Depression (GADS).
Table A5.
Characteristics of PRO Anxiety and Depression (GADS).
| ID | Health | Wave | Country | Gender | Age | Q1A: Keyed-up or on Edge | Q2A: Worrying a Lot | Q3A: Irritable | Q4A: Difficulty Relaxing | Q5A: Sleeping Poorly | Q6A: Headaches or Neck Aches | Q7A: Trembling [...] Urine | Q8A: Worried about Your Health | Q9A: Difficulty Falling Asleep | Q1D: Lacking Energy | Q2D: Lost Interest in Things | Q3D: Lost Confidence in Yourself | Q4D: Hopeless | Q5D: Difficulty Concentrating | Q6D: Lost Weight Due to Poor Appetite | Q7D: Waking Early | Q8D: Slowed Down | Q9D: Worse in the Mornings | Numeric Score | Categorical Score |
|---|---|---|---|---|---|---|---|---|---|---|---|---|---|---|---|---|---|---|---|---|---|---|---|---|---|
| 800 | Diseased | 3 | Spain | Female | 65 | 0 | 1 | 0 | 0 | 0 | 0 | 0 | 0 | 0 | 0 | 0 | 0 | 0 | 0 | 0 | 0 | 0 | 0 | 1 | 0 |
| 643 | Healthy | 1 | Spain | Female | 67 | 0 | 0 | 0 | 0 | 0 | 1 | 0 | 0 | 0 | 0 | 0 | 0 | 0 | 0 | 0 | 1 | 0 | 0 | 2 | 0 |
| 796 | Healthy | 3 | Spain | Male | 74 | 0 | 0 | 0 | 0 | 0 | 0 | 0 | 0 | 0 | 0 | 2 | 0 | 0 | 0 | 0 | 0 | 0 | 0 | 2 | 0 |
| 535 | Healthy | 3 | Hungary | Male | 69 | 0 | 0 | 1 | 0 | 0 | 1 | 0 | 0 | 0 | 0 | 0 | 0 | 0 | 0 | 0 | 1 | 0 | 0 | 3 | 0 |
| 628 | Healthy | 1 | Spain | Female | 70 | 0 | 0 | 1 | 0 | 0 | 0 | 0 | 0 | 0 | 1 | 0 | 0 | 0 | 0 | 1 | 0 | 0 | 0 | 3 | 0 |
| 790 | Healthy | 3 | Spain | Male | 66 | 1 | 1 | 0 | 0 | 0 | 0 | 0 | 0 | 0 | 0 | 0 | 0 | 0 | 0 | 0 | 1 | 0 | 0 | 3 | 0 |
| 799 | Diseased | 3 | Spain | Male | 79 | 0 | 0 | 0 | 0 | 0 | 0 | 1 | 0 | 0 | 3 | 0 | 0 | 0 | 0 | 0 | 0 | 0 | 0 | 4 | 0 |
| 648 | Healthy | 1 | Spain | Female | 72 | 0 | 0 | 0 | 0 | 1 | 0 | 1 | 1 | 0 | 1 | 0 | 0 | 0 | 0 | 0 | 0 | 1 | 0 | 5 | 0 |
| 643 | Healthy | 2 | Spain | Female | 67 | 2 | 2 | 0 | 0 | 0 | 0 | 0 | 0 | 0 | 0 | 0 | 0 | 0 | 0 | 0 | 3 | 0 | 0 | 7 | 0 |
| 575 | Healthy | 2 | Hungary | Female | 65 | 1 | 0 | 1 | 0 | 1 | 1 | 0 | 1 | 0 | 0 | 1 | 0 | 0 | 0 | 0 | 1 | 1 | 0 | 8 | 0 |
| 638 | Healthy | 1 | Spain | Female | 71 | 0 | 1 | 2 | 2 | 0 | 1 | 0 | 0 | 1 | 0 | 1 | 0 | 0 | 0 | 0 | 1 | 1 | 0 | 10 | 1 |
| 700 | Healthy | 2 | Spain | Male | 67 | 2 | 1 | 1 | 1 | 2 | 0 | 0 | 0 | 2 | 0 | 0 | 0 | 0 | 0 | 0 | 1 | 0 | 0 | 10 | 1 |
| 569 | Healthy | 3 | Hungary | Female | 67 | 1 | 1 | 1 | 0 | 2 | 1 | 1 | 0 | 2 | 0 | 0 | 1 | 0 | 0 | 0 | 0 | 0 | 1 | 11 | 1 |
| 133 | Healthy | 3 | Hungary | Female | 71 | 1 | 1 | 1 | 0 | 2 | 2 | 0 | 0 | 1 | 1 | 0 | 0 | 0 | 1 | 1 | 0 | 1 | 1 | 13 | 1 |
| 132 | Diseased | 3 | Hungary | Male | 71 | 1 | 1 | 1 | 0 | 1 | 1 | 0 | 1 | 0 | 1 | 1 | 1 | 0 | 0 | 0 | 1 | 2 | 1 | 13 | 1 |
| 419 | Healthy | 2 | Hungary | Male | 95 | 0 | 0 | 1 | 0 | 0 | 4 | 4 | 0 | 0 | 1 | 1 | 0 | 0 | 0 | 0 | 0 | 2 | 0 | 13 | 1 |
| 420 | Healthy | 2 | Hungary | Female | 71 | 1 | 1 | 0 | 0 | 1 | 3 | 0 | 0 | 1 | 0 | 1 | 2 | 0 | 1 | 1 | 0 | 4 | 0 | 16 | 1 |
| 132 | Diseased | 1 | Hungary | Male | 71 | 1 | 0 | 0 | 1 | 1 | 1 | 1 | 1 | 1 | 1 | 1 | 1 | 0 | 1 | 1 | 1 | 2 | 1 | 16 | 1 |
| 133 | Healthy | 1 | Hungary | Female | 71 | 1 | 0 | 1 | 2 | 1 | 1 | 1 | 0 | 1 | 1 | 2 | 0 | 0 | 1 | 1 | 2 | 2 | 0 | 17 | 1 |
| 795 | Healthy | 3 | Spain | Female | 72 | 1 | 1 | 0 | 1 | 2 | 0 | 0 | 1 | 2 | 2 | 1 | 0 | 0 | 0 | 4 | 1 | 1 | 0 | 17 | 1 |
| 569 | Healthy | 1 | Hungary | Female | 67 | 1 | 1 | 0 | 2 | 4 | 2 | 1 | 0 | 4 | 1 | 1 | 0 | 0 | 0 | 0 | 1 | 0 | 1 | 19 | 1 |
| 624 | Diseased | 1 | Spain | Female | 72 | 1 | 4 | 3 | 0 | 2 | 0 | 0 | 0 | 2 | 2 | 0 | 0 | 0 | 0 | 0 | 4 | 3 | 0 | 21 | 1 |
| 170 | Healthy | 3 | Hungary | Male | 70 | 1 | 2 | 1 | 1 | 2 | 1 | 1 | 1 | 0 | 1 | 1 | 2 | 1 | 1 | 1 | 3 | 2 | 0 | 22 | 2 |
| 641 | Diseased | 2 | Spain | Female | 71 | 2 | 4 | 3 | 2 | 1 | 2 | 0 | 0 | 0 | 2 | 0 | 0 | 0 | 1 | 0 | 4 | 1 | 1 | 23 | 2 |
| 640 | Healthy | 1 | Spain | Female | 69 | 1 | 1 | 1 | 1 | 1 | 4 | 2 | 3 | 2 | 3 | 0 | 0 | 0 | 4 | 0 | 1 | 2 | 0 | 26 | 2 |
| 620 | Healthy | 2 | Spain | Female | 69 | 2 | 2 | 2 | 1 | 3 | 4 | 0 | 2 | 2 | 1 | 2 | 0 | 0 | 1 | 0 | 3 | 4 | 0 | 29 | 2 |
| 630 | Healthy | 1 | Spain | Female | 74 | 4 | 3 | 2 | 2 | 2 | 2 | 0 | 3 | 1 | 3 | 0 | 0 | 0 | 1 | 2 | 4 | 2 | 0 | 31 | 2 |
| 215 | Healthy | 1 | Hungary | Female | 87 | 1 | 2 | 1 | 2 | 4 | 2 | 2 | 1 | 2 | 2 | 2 | 2 | 1 | 1 | 1 | 2 | 3 | 2 | 33 | 2 |
| 169 | Diseased | 3 | Hungary | Female | 69 | 4 | 1 | 4 | 3 | 4 | 0 | 1 | 1 | 4 | 4 | 4 | 5 | 1 | 1 | 1 | 4 | 4 | 1 | 47 | 3 |
| 169 | Diseased | 2 | Hungary | Female | 69 | 4 | 3 | 3 | 3 | 5 | 0 | 1 | 4 | 5 | 2 | 4 | 3 | 1 | 1 | 1 | 4 | 4 | 3 | 51 | 3 |
| 641 | Diseased | 1 | Spain | Female | 71 | 4 | 4 | 4 | 4 | 4 | 2 | 4 | 4 | 1 | 3 | 3 | 1 | 1 | 1 | 2 | 3 | 2 | 4 | 51 | 3 |
| 625 | Diseased | 1 | Spain | Male | 72 | 4 | 4 | 0 | 0 | 4 | 1 | 3 | 4 | 4 | 2 | 4 | 1 | 2 | 2 | 4 | 5 | 4 | 3 | 51 | 3 |
| 617 | Healthy | 2 | Spain | Female | 69 | 3 | 3 | 4 | 4 | 4 | 4 | 4 | 3 | 4 | 5 | 4 | 4 | 5 | 2 | 0 | 4 | 3 | 1 | 61 | 4 |
| 169 | Diseased | 1 | Hungary | Female | 69 | 4 | 1 | 4 | 4 | 5 | 4 | 3 | 3 | 5 | 4 | 4 | 5 | 4 | 3 | 2 | 5 | 5 | 3 | 68 | 4 |
| Median: Healthy | 1.0 | 1.0 | 1.0 | 0.0 | 1.0 | 1.0 | 0.0 | 0.0 | 1.0 | 1.0 | 1.0 | 0.0 | 0.0 | 0.0 | 0.0 | 1.0 | 1.0 | 0.0 | 13.0 | 1.0 | |||||
| Median: Diseased | 2.0 | 1.0 | 3.0 | 1.0 | 2.0 | 1.0 | 1.0 | 1.0 | 1.0 | 2.0 | 1.0 | 1.0 | 0.0 | 1.0 | 1.0 | 4.0 | 2.0 | 1.0 | 23.0 | 2.0 | |||||
| Median: Spain | 1.0 | 1.0 | 1.0 | 0.0 | 1.0 | 0.0 | 0.0 | 0.0 | 1.0 | 1.0 | 0.0 | 0.0 | 0.0 | 0.0 | 0.0 | 1.0 | 1.0 | 0.0 | 10.0 | 1.0 | |||||
| Median: Hungary | 1.0 | 1.0 | 1.0 | 1.0 | 2.0 | 1.0 | 1.0 | 1.0 | 1.0 | 1.0 | 1.0 | 1.0 | 0.0 | 1.0 | 1.0 | 1.0 | 2.0 | 1.0 | 16.0 | 1.0 | |||||
| Median: Female | 1.0 | 1.0 | 1.0 | 1.0 | 2.0 | 1.0 | 0.0 | 0.5 | 1.0 | 1.0 | 1.0 | 0.0 | 0.0 | 1.0 | 0.0 | 1.5 | 1.5 | 0.0 | 18.0 | 1.0 | |||||
| Median: Male | 1.0 | 0.5 | 0.5 | 0.0 | 0.5 | 1.0 | 0.5 | 0.0 | 0.0 | 1.0 | 1.0 | 0.0 | 0.0 | 0.0 | 0.0 | 1.0 | 1.0 | 0.0 | 11.5 | 1.0 | |||||
| Median: All | 1.0 | 1.0 | 1.0 | 0.5 | 1.0 | 1.0 | 0.0 | 0.0 | 1.0 | 1.0 | 1.0 | 0.0 | 0.0 | 0.0 | 0.0 | 1.0 | 1.5 | 0.0 | 16.0 | 1.0 | |||||
| Mean: Healthy | 1.0 | 1.0 | 0.9 | 0.8 | 1.3 | 1.4 | 0.7 | 0.6 | 1.0 | 1.0 | 0.8 | 0.4 | 0.3 | 0.5 | 0.5 | 1.3 | 1.2 | 0.2 | 15.6 | 1.0 | |||||
| Mean: Diseased | 2.2 | 2.0 | 2.0 | 1.5 | 2.4 | 1.0 | 1.2 | 1.6 | 2.0 | 2.1 | 1.9 | 1.5 | 0.8 | 0.9 | 1.0 | 2.8 | 2.4 | 1.5 | 31.4 | 1.9 | |||||
| Mean: Spain | 1.4 | 1.6 | 1.2 | 0.9 | 1.3 | 1.1 | 0.7 | 1.1 | 1.1 | 1.4 | 0.8 | 0.3 | 0.4 | 0.6 | 0.6 | 1.8 | 1.2 | 0.4 | 18.7 | 1.1 | |||||
| Mean: Hungary | 1.4 | 0.9 | 1.3 | 1.2 | 2.2 | 1.6 | 1.0 | 0.8 | 1.7 | 1.2 | 1.5 | 1.4 | 0.5 | 0.7 | 0.6 | 1.6 | 2.1 | 0.9 | 23.3 | 1.4 | |||||
| Mean: Female | 1.6 | 1.5 | 1.5 | 1.3 | 2.0 | 1.5 | 0.8 | 1.1 | 1.6 | 1.5 | 1.2 | 0.9 | 0.5 | 0.7 | 0.7 | 2.0 | 1.8 | 0.7 | 23.7 | 1.4 | |||||
| Mean: Male | 1.0 | 0.9 | 0.5 | 0.3 | 1.0 | 0.9 | 1.0 | 0.7 | 0.7 | 0.9 | 1.0 | 0.5 | 0.3 | 0.4 | 0.6 | 1.3 | 1.2 | 0.5 | 13.7 | 0.9 | |||||
| Mean: All | 1.4 | 1.3 | 1.2 | 1.0 | 1.7 | 1.3 | 0.9 | 1.0 | 1.3 | 1.3 | 1.1 | 0.8 | 0.4 | 0.6 | 0.6 | 1.7 | 1.6 | 0.6 | 20.7 | 1.2 | |||||
| SD: Healthy | 0.9 | 0.9 | 0.9 | 1.0 | 1.3 | 1.4 | 1.1 | 1.0 | 1.2 | 1.2 | 1.0 | 1.0 | 1.0 | 0.9 | 0.9 | 1.2 | 1.2 | 0.5 | 13.4 | 0.9 | |||||
| SD: Diseased | 1.6 | 1.6 | 1.7 | 1.6 | 1.8 | 1.2 | 1.3 | 1.6 | 2.0 | 1.1 | 1.7 | 1.8 | 1.1 | 0.8 | 1.2 | 1.8 | 1.6 | 1.3 | 21.6 | 1.3 | |||||
| SD: Spain | 1.4 | 1.4 | 1.3 | 1.2 | 1.4 | 1.4 | 1.3 | 1.4 | 1.2 | 1.4 | 1.3 | 0.9 | 1.1 | 1.0 | 1.2 | 1.6 | 1.3 | 1.0 | 18.1 | 1.2 | |||||
| SD: Hungary | 1.3 | 0.8 | 1.2 | 1.3 | 1.6 | 1.2 | 1.1 | 1.1 | 1.8 | 1.2 | 1.3 | 1.6 | 1.0 | 0.7 | 0.5 | 1.5 | 1.5 | 0.9 | 17.7 | 1.0 | |||||
| SD: Female | 1.4 | 1.2 | 1.4 | 1.4 | 1.6 | 1.4 | 1.2 | 1.3 | 1.5 | 1.4 | 1.4 | 1.6 | 1.2 | 0.9 | 0.9 | 1.6 | 1.5 | 1.1 | 18.8 | 1.2 | |||||
| SD: Male | 1.1 | 1.2 | 0.5 | 0.4 | 1.2 | 1.1 | 1.3 | 1.1 | 1.2 | 0.9 | 1.1 | 0.6 | 0.6 | 0.6 | 1.2 | 1.4 | 1.3 | 0.9 | 13.9 | 0.9 | |||||
| SD: All | 1.3 | 1.3 | 1.3 | 1.3 | 1.6 | 1.3 | 1.2 | 1.3 | 1.5 | 1.3 | 1.4 | 1.4 | 1.1 | 0.9 | 1.0 | 1.6 | 1.5 | 1.0 | 18.1 | 1.1 | |||||
Color coding: from orange (worse outcome relative to others) to yellow to green (better outcome).

Figure A5.
Scores for Anxiety and Depression (GADS). Dotted markings delimit levels of the categorical score.
Mediterranean Nutrition (PREDIMED)
Participants self-reported their adherence to the Mediterranean diet by answering the PREDIMED scale [29,30] 23 times. The scale provides categorical scores for absent, medium, and high adherence using a numeric scale from 0 to 14 points, as described in Appendix B.1.1. Participants registered a mean ± SD numeric score of 7.0 ± 2.4. One-third of the answers corresponded to absent adherence to the Mediterranean diet, and two-thirds correspond to a medium adherence. Table A6 enumerates the answers. Figure A6 illustrates the scores by participant group.
A remarkable result is that among the nutrition diets none had high adherence to a Mediterranean diet. The scoring of the PREDIMED scale may explain this fact. It requires at least 13/14 items to be indicative of a Mediterranean diet to categorize the diet as highly adherent, while only 6/14 are necessary for medium adherence. The most adherent two participants only scored 11/14 and were thus categorized with medium adherence.

Figure A6.
Scores for Mediterranean Nutrition (PREDIMED). Dotted markings delimit levels of the categorical score.
One question that associated with the numeric and categorical scores is Q1 referring to olive oil as the primary culinary fat. Conversely, questions Q7 on sweet beverage use and Q13 on the preference for small animal meat had only 1/23 and 2/23 answers in the affirmative.
Participants from the healthy and diseased groups reported similar adherence, but higher variability, with means (SD) of 7.1 (2.7) and 6.9 (1.7), respectively.
The participant country of residence much coincided to the numeric score on the Mediterranean nutrition scale. All participants from Spain reported numeric scores of 7 or higher, corresponding to a medium adherence. Only one outlier person from Hungary had a numeric score of 9, and all other participants from Hungary had numeric scores of 7 or less. All participants categorized as having no adherence to the Mediterranean diet were from Hungary. Participants from Spain reported a median (mean ± SD) numeric score of 9.0 (8.8 ± 1.4) compared to 5.5 (5.3 ± 2.0) for Hungary. In general, the answers from the participants from Hungary had higher variance.
The answers from male participants indicated a higher adherence as depicted by the medians (means ± STD) of 8.5 (7.4 ± 2.6) and 7.0 (6.8 ± 2.3) on the numeric score, but also higher variability. However, there were fewer answers from men than women for this scale.
Table A6.
Characteristics of PRO Mediterranean Nutrition (PREDIMED).
Table A6.
Characteristics of PRO Mediterranean Nutrition (PREDIMED).
| ID | Health | Wave | Country | Gender | Age | Q1: Olive Oil Main Culinary Fat | Q2: Olive Oil Use | Q3: Vegetables Use | Q4: Fruits Use | Q5: Red Meat, Hamburger, or Meat Use | Q6: Butter, Margarine, or Cream Use | Q7: Sweet/Carbonated Beverage Use | Q8: Wine Use | Q9: Legumes Use | Q10: Fish or Shellfish Use | Q11: Commercial Sweets or Pastries | Q12: Nuts Use | Q13: Preference to Small Animal Meat | Q14: Sofrito Use | Numeric Score | Categorical Score |
|---|---|---|---|---|---|---|---|---|---|---|---|---|---|---|---|---|---|---|---|---|---|
| 420 | Healthy | 2 | Hungary | Female | 71 | 0 | 1.0 | 1.0 | 2.0 | 1.0 | 2.0 | 0.0 | 0.0 | 1.0 | 0.0 | 2.0 | 0.0 | 1.0 | 1.0 | 2 | 0 |
| 215 | Healthy | 1 | Hungary | Female | 87 | 0 | 0.0 | 1.0 | 2.0 | 1.0 | 2.0 | 0.0 | 0.0 | 1.0 | 0.0 | 2.0 | 3.0 | 0.0 | 2.0 | 3 | 0 |
| 170 | Healthy | 3 | Hungary | Male | 70 | 0 | 1.0 | 1.0 | 1.0 | 1.0 | 2.0 | 1.0 | 5.0 | 1.0 | 1.0 | 5.0 | 3.0 | 1.0 | 3.0 | 3 | 0 |
| 132 | Diseased | 3 | Hungary | Male | 71 | 0 | 0.0 | 2.1 | 1.1 | 1.0 | 2.0 | 0.0 | 1.0 | 2.1 | 1.0 | 2.0 | 1.2 | 1.0 | 2.0 | 4 | 0 |
| 575 | Healthy | 2 | Hungary | Female | 65 | 0 | 0.0 | 2.0 | 1.0 | 2.0 | 1.0 | 0.0 | 3.0 | 1.0 | 1.0 | 4.0 | 3.0 | 1.0 | 4.0 | 5 | 0 |
| 169 | Diseased | 2 | Hungary | Female | 69 | 0 | 0.0 | 1.0 | 2.0 | 0.3 | 1.0 | 0.0 | 2.0 | 0.5 | 0.5 | 1.0 | 0.3 | 1.0 | 4.0 | 5 | 0 |
| 133 | Healthy | 3 | Hungary | Female | 71 | 1 | 4.0 | 2.0 | 2.0 | 1.0 | 4.0 | 0.0 | 1.0 | 1.0 | 0.0 | 2.0 | 2.0 | 1.0 | 2.0 | 6 | 0 |
| 419 | Healthy | 2 | Hungary | Male | 95 | 1 | 1.0 | 2.0 | 2.0 | 1.0 | 2.0 | 0.0 | 1.0 | 1.0 | 0.0 | 0.0 | 0.0 | 1.0 | 2.0 | 6 | 0 |
| 569 | Healthy | 3 | Hungary | Female | 67 | 1 | 2.0 | 3.0 | 2.0 | 2.0 | 2.0 | 0.0 | 1.0 | 2.0 | 3.0 | 2.0 | 6.0 | 1.0 | 6.0 | 7 | 1 |
| 169 | Diseased | 1 | Hungary | Female | 69 | 1 | 3.0 | 2.0 | 1.0 | 0.2 | 1.0 | 0.0 | 5.0 | 2.0 | 0.2 | 0.0 | 0.0 | 1.0 | 5.0 | 7 | 1 |
| 169 | Diseased | 3 | Hungary | Female | 69 | 1 | 1.0 | 2.0 | 1.0 | 0.3 | 1.0 | 0.0 | 7.0 | 0.5 | 0.2 | 0.0 | 0.5 | 1.0 | 1.0 | 7 | 1 |
| 800 | Diseased | 3 | Spain | Female | 65 | 1 | 1.0 | 1.0 | 3.0 | 0.0 | 0.0 | 0.0 | 3.0 | 1.0 | 2.0 | 4.0 | 7.0 | 1.0 | 0.0 | 7 | 1 |
| 617 | Healthy | 2 | Spain | Female | 69 | 1 | 2.0 | 2.0 | 2.0 | 0.8 | 0.0 | 0.0 | 0.0 | 1.0 | 2.4 | 2.0 | 5.0 | 0.0 | 2.0 | 7 | 1 |
| 795 | Healthy | 3 | Spain | Female | 72 | 1 | 4.0 | 1.0 | 2.0 | 0.5 | 0.0 | 0.0 | 1.0 | 1.0 | 2.0 | 0.0 | 0.7 | 1.0 | 0.0 | 7 | 1 |
| 700 | Healthy | 2 | Spain | Male | 67 | 1 | 2.0 | 1.0 | 2.0 | 0.0 | 0.0 | 0.0 | 6.0 | 4.0 | 2.0 | 0.0 | 2.0 | 1.0 | 3.0 | 8 | 1 |
| 535 | Healthy | 3 | Hungary | Male | 69 | 1 | 2.0 | 2.0 | 5.3 | 0.1 | 0.0 | 0.0 | 3.0 | 2.0 | 1.0 | 3.0 | 3.0 | 1.0 | 3.0 | 9 | 1 |
| 643 | Healthy | 2 | Spain | Female | 67 | 1 | 2.0 | 2.0 | 4.0 | 0.5 | 0.0 | 0.0 | 7.0 | 2.0 | 2.0 | 0.0 | 1.0 | 1.0 | 1.0 | 9 | 1 |
| 641 | Diseased | 2 | Spain | Female | 71 | 1 | 3.0 | 2.0 | 2.0 | 0.0 | 0.0 | 0.0 | 2.0 | 1.0 | 7.0 | 7.0 | 4.0 | 1.0 | 7.0 | 9 | 1 |
| 796 | Healthy | 3 | Spain | Male | 74 | 1 | 3.0 | 2.0 | 3.0 | 0.0 | 0.0 | 0.0 | 1.0 | 2.0 | 2.0 | 0.0 | 2.0 | 1.0 | 3.0 | 9 | 1 |
| 799 | Diseased | 3 | Spain | Male | 79 | 1 | 1.0 | 1.0 | 3.0 | 0.0 | 0.0 | 0.0 | 3.0 | 2.0 | 2.0 | 0.0 | 4.0 | 1.0 | 2.0 | 9 | 1 |
| 620 | Healthy | 2 | Spain | Female | 69 | 1 | 2.0 | 2.0 | 4.0 | 1.0 | 0.0 | 0.0 | 1.0 | 2.0 | 3.0 | 0.0 | 4.0 | 1.0 | 2.0 | 10 | 1 |
| 648 | Healthy | 1 | Spain | Female | 72 | 1 | 2.0 | 2.0 | 3.0 | 0.8 | 0.0 | 0.0 | 2.0 | 6.0 | 3.0 | 7.0 | 5.0 | 1.0 | 5.0 | 11 | 1 |
| 790 | Healthy | 3 | Spain | Male | 66 | 1 | 10.0 | 3.0 | 4.0 | 1.0 | 0.0 | 0.0 | 0.0 | 5.0 | 1.0 | 0.0 | 7.0 | 1.0 | 4.0 | 11 | 1 |
| Median: Healthy | 1.0 | 2.0 | 2.0 | 2.0 | 1.0 | 0.0 | 0.0 | 1.0 | 1.5 | 1.5 | 2.0 | 3.0 | 1.0 | 2.5 | 7.0 | 1.0 | |||||
| Median: Diseased | 1.0 | 1.0 | 2.0 | 2.0 | 0.2 | 1.0 | 0.0 | 3.0 | 1.0 | 1.0 | 1.0 | 1.2 | 1.0 | 2.0 | 7.0 | 1.0 | |||||
| Median: Spain | 1.0 | 2.0 | 2.0 | 3.0 | 0.5 | 0.0 | 0.0 | 2.0 | 2.0 | 2.0 | 0.0 | 4.0 | 1.0 | 2.0 | 9.0 | 1.0 | |||||
| Median: Hungary | 0.5 | 1.0 | 2.0 | 2.0 | 1.0 | 2.0 | 0.0 | 1.5 | 1.0 | 0.3 | 2.0 | 1.6 | 1.0 | 2.5 | 5.5 | 0.0 | |||||
| Median: Female | 1.0 | 2.0 | 2.0 | 2.0 | 0.8 | 1.0 | 0.0 | 2.0 | 1.0 | 2.0 | 2.0 | 3.0 | 1.0 | 2.0 | 7.0 | 1.0 | |||||
| Median: Male | 1.0 | 1.5 | 2.0 | 2.5 | 0.5 | 0.0 | 0.0 | 2.0 | 2.0 | 1.0 | 0.0 | 2.5 | 1.0 | 3.0 | 8.5 | 1.0 | |||||
| Median: All | 1.0 | 2.0 | 2.0 | 2.0 | 0.8 | 0.0 | 0.0 | 2.0 | 1.0 | 1.0 | 2.0 | 3.0 | 1.0 | 2.0 | 7.0 | 1.0 | |||||
| Mean: Healthy | 0.7 | 2.3 | 1.8 | 2.5 | 0.8 | 0.9 | 0.0 | 2.0 | 2.0 | 1.4 | 1.8 | 2.9 | 0.8 | 2.6 | 7.0 | 0.6 | |||||
| Mean: Diseased | 0.7 | 1.2 | 1.5 | 1.8 | 0.2 | 0.7 | 0.0 | 3.2 | 1.3 | 1.8 | 2.0 | 2.4 | 1.0 | 3.0 | 6.8 | 0.7 | |||||
| Mean: Spain | 1.0 | 2.9 | 1.7 | 2.9 | 0.4 | 0.0 | 0.0 | 2.3 | 2.4 | 2.5 | 1.8 | 3.7 | 0.9 | 2.6 | 8.8 | 1.0 | |||||
| Mean: Hungary | 0.5 | 1.2 | 1.7 | 1.8 | 0.9 | 1.6 | 0.0 | 2.4 | 1.2 | 0.6 | 1.9 | 1.8 | 0.9 | 2.9 | 5.3 | 0.3 | |||||
| Mean: Female | 0.7 | 1.8 | 1.7 | 2.2 | 0.7 | 0.9 | 0.0 | 2.3 | 1.5 | 1.7 | 2.2 | 2.7 | 0.8 | 2.8 | 6.8 | 0.6 | |||||
| Mean: Male | 0.7 | 2.5 | 1.7 | 2.6 | 0.5 | 0.7 | 0.1 | 2.5 | 2.3 | 1.2 | 1.2 | 2.7 | 1.0 | 2.7 | 7.3 | 0.6 | |||||
| Mean: All | 0.7 | 2.0 | 1.7 | 2.3 | 0.6 | 0.8 | 0.0 | 2.3 | 1.8 | 1.5 | 1.8 | 2.7 | 0.9 | 2.7 | 7.0 | 0.6 | |||||
| SD: Healthy | 0.4 | 2.2 | 0.6 | 1.1 | 0.5 | 1.1 | 0.2 | 2.1 | 1.5 | 1.0 | 2.0 | 2.0 | 0.3 | 1.4 | 2.7 | 0.4 | |||||
| SD: Diseased | 0.4 | 1.1 | 0.5 | 0.8 | 0.3 | 0.6 | 0.0 | 1.9 | 0.6 | 2.2 | 2.4 | 2.4 | 0.0 | 2.2 | 1.7 | 0.4 | |||||
| SD: Spain | 0.0 | 2.3 | 0.6 | 0.7 | 0.4 | 0.0 | 0.0 | 2.1 | 1.6 | 1.4 | 2.7 | 2.0 | 0.2 | 2.0 | 1.4 | 0.0 | |||||
| SD: Hungary | 0.5 | 1.2 | 0.5 | 1.1 | 0.5 | 0.9 | 0.2 | 2.1 | 0.5 | 0.8 | 1.4 | 1.7 | 0.2 | 1.4 | 1.9 | 0.4 | |||||
| SD: Female | 0.4 | 1.2 | 0.5 | 0.9 | 0.5 | 1.1 | 0.0 | 2.2 | 1.2 | 1.8 | 2.2 | 2.2 | 0.3 | 2.1 | 2.3 | 0.4 | |||||
| SD: Male | 0.4 | 2.9 | 0.6 | 1.3 | 0.4 | 0.9 | 0.3 | 2.0 | 1.3 | 0.6 | 1.7 | 1.9 | 0.0 | 0.6 | 2.5 | 0.4 | |||||
| SD: All | 0.4 | 2.0 | 0.6 | 1.1 | 0.5 | 1.0 | 0.2 | 2.1 | 1.3 | 1.5 | 2.1 | 2.1 | 0.2 | 1.7 | 2.4 | 0.4 | |||||
Color coding: from orange (worse outcome relative to others) to yellow to green (better outcome).
Nutrition (SelfMNA)
We quantified participant nutrition through 24 self-reported answers on the SelfMNA scale [31]. The scale assesses a categorical nutrition status as normal, at risk of malnutrition, or having malnutrition and a numeric score between 0 and 14, as detailed in depth in Appendix B.1.1. Participants are well-nourished. Participants recorded a mean ± SD numeric score of 12.2 ± 1.7. More than two-thirds of the participants self-reported a healthy amount of nutrition, and the remaining answers reflected a risk of malnutrition. One third obtained the maximum possible numeric score. None of the answers categorized the participant as malnourished. Table A7 depicts the answers and Figure A7 illustrates the scores by participant group.
Table A7.
Characteristics of PRO Nutrition (SelfMNA).
Table A7.
Characteristics of PRO Nutrition (SelfMNA).
| ID | Health | Wave | Country | Gender | Age | Q1: Food Intake Declined | Q2: Weight Lost | Q3: Described Current Mobility | Q4: Stressed or Severely Ill | Q5: Dementia and/or Severe Sadness | Numeric Score | Categorical Score |
|---|---|---|---|---|---|---|---|---|---|---|---|---|
| 795 | Healthy | 3 | Spain | Female | 72 | 1 | 0 | 2 | 2 | 2 | 8 | 1 |
| 620 | Healthy | 2 | Spain | Female | 69 | 1 | 0 | 2 | 2 | 2 | 9 | 1 |
| 215 | Healthy | 1 | Hungary | Female | 87 | 2 | 3 | 1 | 0 | 1 | 10 | 1 |
| 641 | Diseased | 1 | Spain | Female | 71 | 2 | 3 | 2 | 0 | 2 | 10 | 1 |
| 569 | Healthy | 3 | Hungary | Female | 67 | 2 | 0 | 2 | 2 | 2 | 11 | 1 |
| 628 | Healthy | 1 | Spain | Female | 70 | 1 | 3 | 2 | 2 | 2 | 11 | 1 |
| 625 | Diseased | 1 | Spain | Male | 72 | 1 | 2 | 2 | 2 | 2 | 11 | 1 |
| 169 | Diseased | 1 | Hungary | Female | 69 | 2 | 3 | 2 | 0 | 2 | 12 | 2 |
| 169 | Diseased | 3 | Hungary | Female | 69 | 2 | 3 | 2 | 0 | 2 | 12 | 2 |
| 535 | Healthy | 3 | Hungary | Male | 69 | 1 | 2 | 2 | 2 | 2 | 12 | 2 |
| 419 | Healthy | 2 | Hungary | Male | 95 | 2 | 1 | 2 | 2 | 2 | 12 | 2 |
| 638 | Healthy | 1 | Spain | Female | 71 | 2 | 3 | 2 | 2 | 2 | 12 | 2 |
| 630 | Healthy | 1 | Spain | Female | 74 | 1 | 2 | 2 | 2 | 2 | 12 | 2 |
| 420 | Healthy | 2 | Hungary | Female | 71 | 1 | 3 | 2 | 2 | 2 | 13 | 2 |
| 617 | Healthy | 2 | Spain | Female | 69 | 1 | 3 | 2 | 2 | 2 | 13 | 2 |
| 648 | Healthy | 1 | Spain | Female | 72 | 1 | 3 | 2 | 2 | 2 | 13 | 2 |
| 133 | Healthy | 1 | Hungary | Female | 71 | 2 | 3 | 2 | 2 | 2 | 14 | 2 |
| 800 | Diseased | 3 | Spain | Female | 65 | 2 | 3 | 2 | 2 | 2 | 14 | 2 |
| 643 | Healthy | 1 | Spain | Female | 67 | 2 | 3 | 2 | 2 | 2 | 14 | 2 |
| 640 | Healthy | 1 | Spain | Female | 69 | 2 | 3 | 2 | 2 | 2 | 14 | 2 |
| 624 | Diseased | 1 | Spain | Female | 72 | 2 | 3 | 2 | 2 | 2 | 14 | 2 |
| 790 | Healthy | 3 | Spain | Male | 66 | 2 | 3 | 2 | 2 | 2 | 14 | 2 |
| 796 | Healthy | 3 | Spain | Male | 74 | 2 | 3 | 2 | 2 | 2 | 14 | 2 |
| 799 | Diseased | 3 | Spain | Male | 79 | 2 | 3 | 2 | 2 | 2 | 14 | 2 |
| Median: Healthy | 2.0 | 3.0 | 2.0 | 2.0 | 2.0 | 12.0 | 2.0 | |||||
| Median: Diseased | 2.0 | 3.0 | 2.0 | 2.0 | 2.0 | 12.0 | 2.0 | |||||
| Median: Spain | 2.0 | 3.0 | 2.0 | 2.0 | 2.0 | 13.0 | 2.0 | |||||
| Median: Hungary | 2.0 | 3.0 | 2.0 | 2.0 | 2.0 | 12.0 | 2.0 | |||||
| Median: Female | 2.0 | 3.0 | 2.0 | 2.0 | 2.0 | 12.0 | 2.0 | |||||
| Median: Male | 2.0 | 2.5 | 2.0 | 2.0 | 2.0 | 13.0 | 2.0 | |||||
| Median: All | 2.0 | 3.0 | 2.0 | 2.0 | 2.0 | 12.0 | 2.0 | |||||
| Mean: Healthy | 1.5 | 2.2 | 1.9 | 1.8 | 1.9 | 12.1 | 1.7 | |||||
| Mean: Diseased | 1.8 | 2.8 | 2.0 | 1.1 | 2.0 | 12.4 | 1.7 | |||||
| Mean: Spain | 1.5 | 2.5 | 2.0 | 1.8 | 2.0 | 12.3 | 1.6 | |||||
| Mean: Hungary | 1.7 | 2.2 | 1.8 | 1.2 | 1.8 | 12.0 | 1.7 | |||||
| Mean: Female | 1.6 | 2.4 | 1.9 | 1.5 | 1.9 | 12.0 | 1.6 | |||||
| Mean: Male | 1.6 | 2.3 | 2.0 | 2.0 | 2.0 | 12.8 | 1.8 | |||||
| Mean: All | 1.6 | 2.4 | 1.9 | 1.6 | 1.9 | 12.2 | 1.7 | |||||
| SD: Healthy | 0.4 | 1.1 | 0.2 | 0.4 | 0.2 | 1.7 | 0.4 | |||||
| SD: Diseased | 0.3 | 0.3 | 0.0 | 0.9 | 0.0 | 1.4 | 0.4 | |||||
| SD: Spain | 0.4 | 1.0 | 0.0 | 0.4 | 0.0 | 1.9 | 0.4 | |||||
| SD: Hungary | 0.4 | 1.0 | 0.3 | 0.9 | 0.3 | 1.1 | 0.4 | |||||
| SD: Female | 0.4 | 1.1 | 0.2 | 0.8 | 0.2 | 1.7 | 0.4 | |||||
| SD: Male | 0.4 | 0.7 | 0.0 | 0.0 | 0.0 | 1.2 | 0.3 | |||||
| SD: All | 0.4 | 1.0 | 0.1 | 0.7 | 0.1 | 1.7 | 0.4 | |||||
Color coding: from orange (worse outcome relative to others) to yellow, to green (better outcome).
The groups of healthy and diseased participants were characterized by similar medians (12.0) and means (12.1 and 12.4), and only slight differences in the standard deviations (1.8 vs. 1.5). Healthy participants self-reported a decline in food intake for question Q1 while participants with disease reported being more stressed and severely ill in question Q4. Participants with disease reported less weight loss in Q2 as well as fewer variable answers across all items and scores except for Q4.
The participants from Spain reported similar levels of nutrition; however alternating ranks between questions: participants from Spain reported more decline in food intake in Q1, less weight loss in Q2, more mobility in Q3, and less stress, illness, dementia, or sadness in Q4 and Q5. Participants from Hungary reported had a more stable numeric score with a standard deviation of 1.11 for Hungary compared to 1.92 for Spain.
Women and men reported similar levels of nutrition, but provided more stable answers within their group, e.g., male standard deviation of 1.21 compared to female standard deviation of 1.79 for the numeric score.

Figure A7.
Scores for Nutrition (SelfMNA). Dotted markings delimit levels of the categorical score.
Memory (MFE)
Participants reported 36 answers on the MFE scale for memory [32]. The scale classifies memory failures as absent or potential through a numeric score from 0 to 56. See the description of MFE in Appendix B.1.1. Participants had mean ± SD numeric score of 8.7 ± 4.7. The median and mean numeric scores indicate absent memory failures. One-third of the answers indicate the possibility of memory failures, originating predominantly from female participants from Spain. Table A8 enumerates the answers. Figure A8 illustrates the scores by participant group.
One item whose answers may associate with the numeric score is Q15: Forgetting important details of done things.
The participants self-reported as diseased reported a higher probability of memory failures, as seen in the median (mean ± SD) numeric score of 9 (9.41 ± 4.5) compared to 7 (8.45 ± 4.8) for healthy participants. The ranking for the medians and means for individual items between the healthy and diseased alternate. Examples of questions where the diseased fared worse include Q5 (checking whether something was done), Q6 (forgetting time of events), Q14 (forgetting to do planned things), and Q18 (forgetting to tell somebody something important) as seen from the medians different by 1 out of the maximum two levels as well as the slightly different means. Healthy and diseased participants had similar variability in the numeric scores and alternating ranks of variability within individual questions.
The participants from Hungary may have slightly fewer chances of memory failure, as observed from the medians (means) of 7.5 (7.7) and 8.5 (9.7) different by 1 (2) points. Furthermore, the numeric scores from the participants from Hungary are more stable. Questions Q5 (checking whether something was done) and Q6 (forgetting time of events) indicate the potential memory decline within the subjects from Spain. Question Q8 (being reminded about things) indicates the opposite. Other questions that weigh towards an expected increase in memory failures for the participants from Spain are Q7 (being reminded about things), Q21 (telling someone a story or joke repeatedly), and Q24 (forgetting where things are normally kept).
Men self-reported improved memory numeric scores as compared to women, as seen from the medians (means) of 6 (6.54) and 8 (9.76), respectively. Questions that contribute to this difference are Q6, Q8, and Q24 and against this difference Q5. Males self-reported more stable memory failures, as seen from the SD 3.86 and SD 4.76, respectively.
Table A8.
Characteristics of PRO Memory (MFE).
Table A8.
Characteristics of PRO Memory (MFE).
| ID | Health | Wave | Country | Gender | Age | Q1: Forgetting Objects put | Q2: Failing to Recognise Places | Q3: Finding a Television Story Difficult | Q4: Not Remembering a Change in Daily Routine | Q5: Checking Whether Something Was Done | Q6: Forgetting Time of Events | Q7: Completely Forgetting to Take Things | Q8: Being Reminded about Things | Q9: Reading Anew Already Read Something | Q10: Letting Ramble about Unimportant Things | Q11: Failing to Recognise Close Relatives or Friends | Q12: Having Difficulty Picking up a New Skill | Q13: Finding Word Is “on the tip of the Tongue” | Q14: Forgetting Forgetting to do Planned Things | Q15: Forgetting important details of done things | Q16: Forgetting the Topic of an Ongoing Conversation | Q17: Failing to follow a Story in a Newspaper | Q18: Forgetting to tEll Somebody Something Important | Q19: Forgetting Important Details about Oneself | Q20: Getting Told Details Mixed up and Confused | Q21: Telling Someone a Story or Joke Repeatedly | Q22: Forgetting Details of Things You Do Regularly | Q23: Finding Famous Faces Unfamiliar | Q24: Forgetting Where Things Are Normally Kept | Q25: Getting Lost Where You Have OFTEN been before | Q26: Getting Lost Where You Have Been RARELY before | Q27: Doing Some Routine Thing Twice by Mistake | Q28: Repeating to sOmeone What You Have just Told Them | Numeric Score | Categorical Score |
|---|---|---|---|---|---|---|---|---|---|---|---|---|---|---|---|---|---|---|---|---|---|---|---|---|---|---|---|---|---|---|---|---|---|---|---|
| 796 | Healthy | 3 | Spain | Male | 74 | 0 | 0 | 0 | 0 | 0 | 0 | 0 | 0 | 0 | 0 | 0 | 0 | 0 | 0 | 0 | 0 | 0 | 0 | 0 | 0 | 0 | 0 | 0 | 0 | 0 | 0 | 0 | 0 | 0 | 0 |
| 132 | Diseased | 1 | Hungary | Male | 71 | 0 | 0 | 0 | 0 | 0 | 0 | 0 | 0 | 0 | 0 | 0 | 0 | 0 | 0 | 0 | 0 | 0 | 0 | 0 | 0 | 0 | 0 | 0 | 0 | 1 | 1 | 0 | 0 | 2 | 0 |
| 643 | Healthy | 2 | Spain | Female | 67 | 1 | 0 | 0 | 0 | 0 | 0 | 0 | 0 | 0 | 0 | 0 | 0 | 1 | 0 | 0 | 0 | 0 | 0 | 0 | 0 | 0 | 0 | 0 | 1 | 0 | 0 | 0 | 0 | 3 | 0 |
| 648 | Healthy | 1 | Spain | Female | 72 | 0 | 0 | 0 | 0 | 0 | 0 | 0 | 1 | 0 | 0 | 0 | 0 | 1 | 0 | 0 | 0 | 0 | 0 | 0 | 0 | 1 | 0 | 0 | 0 | 0 | 0 | 0 | 0 | 3 | 0 |
| 132 | Diseased | 3 | Hungary | Male | 71 | 0 | 0 | 0 | 0 | 1 | 0 | 0 | 0 | 0 | 0 | 0 | 0 | 0 | 0 | 0 | 0 | 0 | 0 | 0 | 1 | 0 | 0 | 0 | 0 | 1 | 1 | 0 | 0 | 4 | 0 |
| 132 | Diseased | 2 | Hungary | Male | 71 | 0 | 0 | 0 | 0 | 0 | 0 | 0 | 0 | 0 | 0 | 0 | 0 | 0 | 1 | 0 | 1 | 0 | 0 | 0 | 0 | 0 | 0 | 0 | 1 | 1 | 1 | 0 | 0 | 5 | 0 |
| 628 | Healthy | 1 | Spain | Female | 70 | 1 | 0 | 0 | 0 | 0 | 0 | 1 | 0 | 0 | 0 | 0 | 0 | 1 | 0 | 0 | 0 | 0 | 0 | 0 | 0 | 0 | 0 | 0 | 1 | 0 | 1 | 0 | 0 | 5 | 0 |
| 624 | Diseased | 1 | Spain | Female | 72 | 1 | 0 | 0 | 0 | 0 | 1 | 0 | 0 | 0 | 0 | 0 | 0 | 2 | 0 | 0 | 0 | 0 | 0 | 0 | 0 | 0 | 0 | 0 | 0 | 0 | 1 | 0 | 0 | 5 | 0 |
| 569 | Healthy | 3 | Hungary | Female | 67 | 0 | 0 | 0 | 0 | 0 | 0 | 0 | 1 | 0 | 1 | 0 | 1 | 1 | 0 | 0 | 1 | 0 | 0 | 0 | 0 | 0 | 1 | 0 | 0 | 0 | 0 | 0 | 0 | 6 | 0 |
| 535 | Healthy | 3 | Hungary | Male | 69 | 1 | 0 | 0 | 0 | 0 | 1 | 0 | 1 | 0 | 0 | 0 | 1 | 1 | 0 | 0 | 0 | 0 | 0 | 0 | 0 | 0 | 0 | 1 | 0 | 0 | 0 | 0 | 0 | 6 | 0 |
| 170 | Healthy | 3 | Hungary | Male | 70 | 1 | 1 | 0 | 1 | 0 | 0 | 0 | 1 | 0 | 0 | 0 | 1 | 1 | 0 | 0 | 0 | 0 | 0 | 0 | 0 | 0 | 0 | 0 | 0 | 0 | 0 | 0 | 0 | 6 | 0 |
| 795 | Healthy | 3 | Spain | Female | 72 | 1 | 0 | 0 | 0 | 1 | 1 | 1 | 0 | 0 | 0 | 0 | 0 | 1 | 0 | 0 | 0 | 0 | 0 | 0 | 0 | 0 | 0 | 0 | 1 | 0 | 0 | 0 | 0 | 6 | 0 |
| 575 | Healthy | 2 | Hungary | Female | 65 | 2 | 0 | 0 | 0 | 0 | 0 | 0 | 1 | 0 | 0 | 0 | 1 | 0 | 0 | 0 | 0 | 0 | 1 | 0 | 0 | 1 | 0 | 0 | 1 | 0 | 0 | 0 | 0 | 7 | 0 |
| 133 | Healthy | 3 | Hungary | Female | 71 | 0 | 0 | 1 | 0 | 1 | 0 | 1 | 1 | 0 | 0 | 0 | 0 | 1 | 0 | 0 | 0 | 0 | 1 | 0 | 0 | 0 | 0 | 0 | 1 | 0 | 0 | 0 | 0 | 7 | 0 |
| 638 | Healthy | 1 | Spain | Female | 71 | 1 | 0 | 0 | 0 | 1 | 0 | 0 | 0 | 1 | 0 | 0 | 1 | 1 | 0 | 0 | 0 | 0 | 0 | 0 | 0 | 1 | 0 | 0 | 0 | 0 | 0 | 1 | 0 | 7 | 0 |
| 790 | Healthy | 3 | Spain | Male | 66 | 0 | 0 | 0 | 0 | 1 | 0 | 1 | 0 | 0 | 0 | 0 | 0 | 1 | 0 | 0 | 0 | 0 | 0 | 0 | 0 | 1 | 0 | 1 | 0 | 0 | 0 | 1 | 1 | 7 | 0 |
| 700 | Healthy | 2 | Spain | Male | 67 | 1 | 0 | 0 | 0 | 1 | 1 | 0 | 0 | 0 | 0 | 0 | 0 | 1 | 0 | 0 | 0 | 0 | 1 | 0 | 0 | 0 | 0 | 1 | 0 | 0 | 1 | 0 | 0 | 7 | 0 |
| 569 | Healthy | 1 | Hungary | Female | 67 | 0 | 0 | 0 | 0 | 0 | 0 | 1 | 0 | 0 | 1 | 0 | 1 | 0 | 1 | 0 | 1 | 0 | 1 | 0 | 0 | 0 | 1 | 0 | 0 | 0 | 0 | 0 | 1 | 8 | 0 |
| 169 | Diseased | 3 | Hungary | Female | 69 | 1 | 0 | 0 | 0 | 0 | 1 | 0 | 1 | 1 | 0 | 0 | 0 | 1 | 0 | 0 | 1 | 0 | 0 | 0 | 0 | 0 | 0 | 1 | 1 | 0 | 0 | 0 | 0 | 8 | 0 |
| 133 | Healthy | 1 | Hungary | Female | 71 | 0 | 0 | 1 | 0 | 0 | 0 | 1 | 1 | 0 | 0 | 0 | 0 | 1 | 1 | 0 | 0 | 0 | 0 | 0 | 1 | 1 | 0 | 0 | 1 | 0 | 0 | 0 | 0 | 8 | 0 |
| 420 | Healthy | 2 | Hungary | Female | 71 | 1 | 0 | 0 | 0 | 1 | 0 | 0 | 1 | 0 | 0 | 0 | 1 | 1 | 0 | 0 | 0 | 0 | 0 | 0 | 1 | 0 | 0 | 0 | 1 | 0 | 1 | 0 | 0 | 8 | 0 |
| 215 | Healthy | 1 | Hungary | Female | 87 | 0 | 0 | 0 | 0 | 0 | 1 | 0 | 1 | 0 | 0 | 0 | 0 | 1 | 1 | 1 | 0 | 0 | 1 | 0 | 1 | 0 | 0 | 0 | 0 | 0 | 0 | 0 | 1 | 8 | 0 |
| 643 | Healthy | 1 | Spain | Female | 67 | 1 | 0 | 0 | 0 | 1 | 1 | 0 | 0 | 0 | 0 | 0 | 0 | 1 | 0 | 0 | 0 | 0 | 0 | 0 | 1 | 1 | 0 | 1 | 0 | 0 | 0 | 0 | 1 | 8 | 0 |
| 800 | Diseased | 3 | Spain | Female | 65 | 1 | 0 | 0 | 0 | 1 | 1 | 1 | 1 | 0 | 0 | 0 | 0 | 1 | 0 | 0 | 0 | 0 | 1 | 0 | 0 | 0 | 0 | 0 | 1 | 0 | 0 | 1 | 0 | 9 | 0 |
| 799 | Diseased | 3 | Spain | Male | 79 | 0 | 0 | 0 | 0 | 1 | 1 | 1 | 1 | 0 | 0 | 0 | 0 | 1 | 1 | 0 | 0 | 0 | 1 | 0 | 0 | 1 | 0 | 0 | 0 | 0 | 0 | 1 | 0 | 9 | 0 |
| 640 | Healthy | 1 | Spain | Female | 69 | 1 | 0 | 1 | 0 | 0 | 0 | 0 | 1 | 0 | 0 | 0 | 1 | 1 | 0 | 1 | 0 | 0 | 0 | 0 | 1 | 1 | 1 | 0 | 1 | 0 | 0 | 0 | 0 | 10 | 0 |
| 419 | Healthy | 2 | Hungary | Male | 95 | 2 | 0 | 0 | 1 | 1 | 1 | 1 | 1 | 0 | 1 | 0 | 0 | 0 | 1 | 1 | 0 | 0 | 0 | 0 | 0 | 1 | 0 | 0 | 1 | 0 | 0 | 0 | 0 | 12 | 0 |
| 169 | Diseased | 1 | Hungary | Female | 69 | 2 | 0 | 0 | 0 | 0 | 0 | 1 | 1 | 0 | 0 | 1 | 0 | 2 | 1 | 1 | 1 | 0 | 1 | 0 | 0 | 1 | 1 | 0 | 0 | 0 | 0 | 0 | 0 | 13 | 1 |
| 641 | Diseased | 2 | Spain | Female | 71 | 0 | 0 | 2 | 1 | 1 | 1 | 1 | 1 | 1 | 0 | 0 | 1 | 1 | 1 | 1 | 0 | 0 | 1 | 0 | 0 | 0 | 0 | 0 | 1 | 0 | 0 | 0 | 0 | 14 | 1 |
| 649 | Healthy | 1 | Spain | Female | 72 | 1 | 0 | 1 | 0 | 0 | 1 | 0 | 0 | 1 | 1 | 0 | 1 | 1 | 1 | 0 | 0 | 0 | 1 | 0 | 0 | 1 | 0 | 2 | 1 | 0 | 1 | 0 | 0 | 14 | 1 |
| 625 | Diseased | 1 | Spain | Male | 72 | 1 | 0 | 0 | 0 | 1 | 1 | 1 | 1 | 0 | 0 | 0 | 0 | 1 | 1 | 1 | 0 | 0 | 1 | 0 | 0 | 1 | 1 | 1 | 1 | 0 | 0 | 0 | 1 | 14 | 1 |
| 169 | Diseased | 2 | Hungary | Female | 69 | 2 | 0 | 1 | 0 | 1 | 1 | 0 | 1 | 1 | 1 | 0 | 0 | 1 | 1 | 1 | 1 | 0 | 1 | 0 | 0 | 1 | 0 | 0 | 0 | 0 | 1 | 0 | 0 | 15 | 1 |
| 641 | Diseased | 1 | Spain | Female | 71 | 0 | 0 | 0 | 1 | 1 | 1 | 1 | 1 | 1 | 0 | 0 | 1 | 1 | 1 | 1 | 0 | 1 | 1 | 0 | 0 | 0 | 0 | 0 | 1 | 0 | 1 | 1 | 0 | 15 | 1 |
| 630 | Healthy | 1 | Spain | Female | 74 | 1 | 1 | 0 | 0 | 1 | 1 | 2 | 1 | 1 | 0 | 0 | 1 | 1 | 0 | 0 | 0 | 1 | 0 | 0 | 0 | 1 | 1 | 2 | 1 | 0 | 0 | 1 | 1 | 18 | 1 |
| 617 | Healthy | 2 | Spain | Female | 69 | 1 | 0 | 0 | 0 | 1 | 1 | 1 | 1 | 0 | 1 | 0 | 1 | 2 | 1 | 1 | 0 | 0 | 1 | 0 | 1 | 1 | 0 | 1 | 2 | 0 | 0 | 1 | 1 | 19 | 1 |
| 620 | Healthy | 2 | Spain | Female | 69 | 1 | 0 | 0 | 1 | 1 | 1 | 1 | 1 | 1 | 1 | 0 | 1 | 1 | 1 | 0 | 1 | 1 | 1 | 0 | 0 | 0 | 1 | 1 | 1 | 0 | 1 | 1 | 1 | 20 | 1 |
| Median: Healthy | 1.0 | 0.0 | 0.0 | 0.0 | 0.0 | 0.0 | 0.0 | 1.0 | 0.0 | 0.0 | 0.0 | 0.5 | 1.0 | 0.0 | 0.0 | 0.0 | 0.0 | 0.0 | 0.0 | 0.0 | 0.0 | 0.0 | 0.0 | 1.0 | 0.0 | 0.0 | 0.0 | 0.0 | 7.0 | 0.0 | |||||
| Median: Diseased | 0.5 | 0.0 | 0.0 | 0.0 | 1.0 | 1.0 | 0.5 | 1.0 | 0.0 | 0.0 | 0.0 | 0.0 | 1.0 | 1.0 | 0.0 | 0.0 | 0.0 | 1.0 | 0.0 | 0.0 | 0.0 | 0.0 | 0.0 | 0.5 | 0.0 | 0.5 | 0.0 | 0.0 | 9.0 | 0.0 | |||||
| Median: Spain | 1.0 | 0.0 | 0.0 | 0.0 | 1.0 | 1.0 | 1.0 | 0.5 | 0.0 | 0.0 | 0.0 | 0.0 | 1.0 | 0.0 | 0.0 | 0.0 | 0.0 | 0.0 | 0.0 | 0.0 | 0.5 | 0.0 | 0.0 | 1.0 | 0.0 | 0.0 | 0.0 | 0.0 | 8.5 | 0.0 | |||||
| Median: Hungary | 0.5 | 0.0 | 0.0 | 0.0 | 0.0 | 0.0 | 0.0 | 1.0 | 0.0 | 0.0 | 0.0 | 0.0 | 1.0 | 0.0 | 0.0 | 0.0 | 0.0 | 0.0 | 0.0 | 0.0 | 0.0 | 0.0 | 0.0 | 0.0 | 0.0 | 0.0 | 0.0 | 0.0 | 7.5 | 0.0 | |||||
| Median: Female | 1.0 | 0.0 | 0.0 | 0.0 | 0.0 | 1.0 | 0.0 | 1.0 | 0.0 | 0.0 | 0.0 | 0.0 | 1.0 | 0.0 | 0.0 | 0.0 | 0.0 | 0.0 | 0.0 | 0.0 | 0.0 | 0.0 | 0.0 | 1.0 | 0.0 | 0.0 | 0.0 | 0.0 | 8.0 | 0.0 | |||||
| Median: Male | 0.0 | 0.0 | 0.0 | 0.0 | 1.0 | 0.0 | 0.0 | 0.0 | 0.0 | 0.0 | 0.0 | 0.0 | 1.0 | 0.0 | 0.0 | 0.0 | 0.0 | 0.0 | 0.0 | 0.0 | 0.0 | 0.0 | 0.0 | 0.0 | 0.0 | 0.0 | 0.0 | 0.0 | 6.0 | 0.0 | |||||
| Median: All | 1.0 | 0.0 | 0.0 | 0.0 | 0.5 | 0.5 | 0.0 | 1.0 | 0.0 | 0.0 | 0.0 | 0.0 | 1.0 | 0.0 | 0.0 | 0.0 | 0.0 | 0.0 | 0.0 | 0.0 | 0.0 | 0.0 | 0.0 | 1.0 | 0.0 | 0.0 | 0.0 | 0.0 | 8.0 | 0.0 | |||||
| Mean: Healthy | 0.7 | 0.0 | 0.1 | 0.1 | 0.4 | 0.4 | 0.4 | 0.5 | 0.1 | 0.2 | 0.0 | 0.5 | 0.8 | 0.2 | 0.1 | 0.1 | 0.0 | 0.3 | 0.0 | 0.2 | 0.4 | 0.2 | 0.4 | 0.5 | 0.0 | 0.2 | 0.2 | 0.2 | 8.4 | 0.1 | |||||
| Mean: Diseased | 0.6 | 0.0 | 0.2 | 0.1 | 0.5 | 0.6 | 0.5 | 0.6 | 0.3 | 0.0 | 0.0 | 0.1 | 0.9 | 0.5 | 0.4 | 0.3 | 0.0 | 0.5 | 0.0 | 0.0 | 0.3 | 0.1 | 0.1 | 0.5 | 0.2 | 0.5 | 0.2 | 0.0 | 9.4 | 0.4 | |||||
| Mean: Spain | 0.7 | 0.0 | 0.2 | 0.1 | 0.6 | 0.6 | 0.6 | 0.5 | 0.3 | 0.1 | 0.0 | 0.4 | 1.0 | 0.3 | 0.2 | 0.0 | 0.1 | 0.4 | 0.0 | 0.1 | 0.5 | 0.2 | 0.5 | 0.6 | 0.0 | 0.3 | 0.4 | 0.3 | 9.6 | 0.3 | |||||
| Mean: Hungary | 0.7 | 0.0 | 0.1 | 0.1 | 0.3 | 0.3 | 0.3 | 0.7 | 0.1 | 0.2 | 0.0 | 0.3 | 0.6 | 0.4 | 0.2 | 0.3 | 0.0 | 0.3 | 0.0 | 0.2 | 0.3 | 0.1 | 0.1 | 0.4 | 0.1 | 0.3 | 0.0 | 0.1 | 7.6 | 0.1 | |||||
| Mean: Female | 0.8 | 0.0 | 0.2 | 0.1 | 0.4 | 0.5 | 0.5 | 0.6 | 0.3 | 0.2 | 0.0 | 0.4 | 1.0 | 0.4 | 0.2 | 0.2 | 0.1 | 0.4 | 0.0 | 0.2 | 0.4 | 0.2 | 0.3 | 0.6 | 0.0 | 0.2 | 0.2 | 0.2 | 9.7 | 0.3 | |||||
| Mean: Male | 0.5 | 0.0 | 0.0 | 0.1 | 0.5 | 0.4 | 0.3 | 0.4 | 0.0 | 0.0 | 0.0 | 0.1 | 0.5 | 0.3 | 0.1 | 0.0 | 0.0 | 0.2 | 0.0 | 0.0 | 0.3 | 0.0 | 0.3 | 0.2 | 0.2 | 0.3 | 0.1 | 0.1 | 6.5 | 0.0 | |||||
| Mean: All | 0.7 | 0.0 | 0.1 | 0.1 | 0.5 | 0.5 | 0.4 | 0.6 | 0.2 | 0.1 | 0.0 | 0.3 | 0.8 | 0.3 | 0.2 | 0.1 | 0.0 | 0.4 | 0.0 | 0.1 | 0.4 | 0.1 | 0.3 | 0.5 | 0.0 | 0.3 | 0.2 | 0.2 | 8.7 | 0.2 | |||||
| SD: Healthy | 0.5 | 0.2 | 0.3 | 0.3 | 0.4 | 0.4 | 0.5 | 0.4 | 0.3 | 0.4 | 0.0 | 0.5 | 0.4 | 0.4 | 0.3 | 0.3 | 0.2 | 0.4 | 0.0 | 0.4 | 0.4 | 0.4 | 0.6 | 0.5 | 0.0 | 0.4 | 0.4 | 0.4 | 4.8 | 0.3 | |||||
| SD: Diseased | 0.7 | 0.0 | 0.5 | 0.3 | 0.4 | 0.4 | 0.5 | 0.4 | 0.4 | 0.2 | 0.2 | 0.3 | 0.6 | 0.4 | 0.4 | 0.4 | 0.2 | 0.4 | 0.0 | 0.2 | 0.4 | 0.3 | 0.3 | 0.5 | 0.4 | 0.5 | 0.4 | 0.2 | 4.4 | 0.4 | |||||
| SD: Spain | 0.4 | 0.2 | 0.5 | 0.3 | 0.4 | 0.4 | 0.5 | 0.5 | 0.4 | 0.3 | 0.0 | 0.4 | 0.3 | 0.4 | 0.4 | 0.2 | 0.3 | 0.4 | 0.0 | 0.3 | 0.5 | 0.4 | 0.6 | 0.5 | 0.0 | 0.4 | 0.4 | 0.4 | 5.5 | 0.4 | |||||
| SD: Hungary | 0.8 | 0.2 | 0.3 | 0.3 | 0.4 | 0.4 | 0.4 | 0.4 | 0.3 | 0.4 | 0.2 | 0.4 | 0.5 | 0.4 | 0.4 | 0.4 | 0.0 | 0.4 | 0.0 | 0.4 | 0.4 | 0.3 | 0.3 | 0.4 | 0.3 | 0.4 | 0.0 | 0.3 | 3.1 | 0.3 | |||||
| SD: Female | 0.6 | 0.1 | 0.5 | 0.3 | 0.4 | 0.4 | 0.5 | 0.4 | 0.4 | 0.4 | 0.1 | 0.4 | 0.4 | 0.4 | 0.4 | 0.4 | 0.3 | 0.4 | 0.0 | 0.4 | 0.4 | 0.4 | 0.6 | 0.5 | 0.0 | 0.4 | 0.4 | 0.4 | 4.7 | 0.4 | |||||
| SD: Male | 0.6 | 0.2 | 0.0 | 0.3 | 0.4 | 0.4 | 0.4 | 0.4 | 0.0 | 0.2 | 0.0 | 0.3 | 0.4 | 0.4 | 0.3 | 0.2 | 0.0 | 0.4 | 0.0 | 0.2 | 0.4 | 0.2 | 0.4 | 0.4 | 0.4 | 0.4 | 0.3 | 0.3 | 3.8 | 0.2 | |||||
| SD: All | 0.6 | 0.2 | 0.4 | 0.3 | 0.5 | 0.5 | 0.5 | 0.4 | 0.4 | 0.3 | 0.1 | 0.4 | 0.5 | 0.4 | 0.4 | 0.3 | 0.2 | 0.4 | 0.0 | 0.3 | 0.4 | 0.3 | 0.5 | 0.5 | 0.2 | 0.4 | 0.4 | 0.4 | 4.7 | 0.4 | |||||
Color coding: from orange (worse outcome relative to others) to yellow to green (better outcome).

Figure A8.
Scores for Memory (MFE). Dotted markings delimit levels of the categorical score.
Sleep (PSQI)
The seniors self-reported their sleep quality through 32 answers on the PSQI scale [33]. PSQI assesses sleep quality as good or poor based on a numeric score from 0 to 21, as described in Appendix B.1.1. Participants recorded a median (mean ± SD) numeric score of 6.0 (6.3 ± 3.9). The median and mean sleep quality situated at the better extremity of poor sleep quality. Two-fifths of the answers corresponded to poor sleep quality. Table A9 enumerates the answers. Figure A9 illustrates the sub-scores and scores by participant group.
The participants with disease self-reported less adequate sleep, as depicted by the median (mean ± SD) of 8.0 (8.6 ± 3.2) compared to 5.0 (5.3 ± 4.3). Participants with disease self-reported less adequate sleep through questions Q5B (trouble sleeping due to waking up in the middle of the night) with a difference between median (mean) answers of 1.5 (0.53) out of 3. Conversely, healthy participants self-reported decreased sleep quality due to using the bathroom in Q5C with a median (mean) difference of 1.0 (0.55) out of 3. The healthy participants provided more stable PROs with a standard deviation for the numeric score of 3.23 as compared to 4.34.
The participants from Hungary reported worse sleep quality with a median (mean ± SD) of 6.0 (7.5 ± 0.2) in Hungary compared to 5.0 (5.5 ± 0.1) in Spain. The difference between the sleep quality for participants in Hungary and Spain is visible in the numeric sub-scores, e.g., subjective sleep quality, latency, duration, efficiency, and disturbance, but not medication. However, the Spanish participants reported more stable PROs.
Women and men reported similar levels of sleep quality with equal medians and means (0.9 and 0.8). Question Q5A: Trouble sleeping: cannot get to sleep influenced the quality of sleep in women, as observed by a difference of over one unit from a maximum of 3 between means. Males provided more stable results with a standard deviation of 2.45 compared to 4.32 for the numeric score. At the extremity of inadequate sleep, the worst six levels of sleep quality correspond to women from both Spain and Hungary.
Table A9.
Characteristics of PRO Sleep (PSQI).
Table A9.
Characteristics of PRO Sleep (PSQI).
| ID | Health | Wave | Country | Gender | Age | Q1: Time gone to bed at night | Q2: Duration taken to fall asleep | Q3: Time gotten up in the morning | Q4: Duration of actual sleep | Q5A: Trouble sleeping: cannot get to sleep | Q5B: Trouble sleeping: wake up in the middle of the night | Q5C: Trouble sleeping: use the bathroom | Q5D: Trouble sleeping: cannot breathe comfortably | Q5E: Trouble sleeping: cough or snore loudly | Q5F: Trouble sleeping: too cold | Q5G: Trouble sleeping: too hot | Q5H: Trouble sleeping: bad dreams | Q5I: Trouble sleeping: pain | Q5J: Trouble sleeping for other reason(s) | Q6: Frequency of medicine to help you sleep | Q7: Trouble staying awake while driving, eating, or socializing | Q8: Problem with keeping up enthusiasm to get things done | Q9: Sleep quality overall | Subjective Quality Numeric Sub-Score | Latency Numeric Sub-Score | Duration Numeric Sub-Score | Efficiency Numeric Sub-Score | Disturbance Numeric Sub-Score | Medication Numeric Sub-Score | Daytime Dysfunction Numeric Sub-Score | Efficiency Numeric Sub-Score | Numeric Score | Categorical Score |
|---|---|---|---|---|---|---|---|---|---|---|---|---|---|---|---|---|---|---|---|---|---|---|---|---|---|---|---|---|---|---|---|---|---|
| 535 | Healthy | 3 | Hungary | Male | 69 | 1410.0 | 10.0 | 510.0 | 480.0 | 0 | 1 | 0 | 0 | 0 | 0 | 0 | 0 | 0 | 0 | 0 | 0 | 0 | 0 | 0 | 0 | 0 | 0 | 1 | 0 | 0 | 0.9 | 1 | 1 |
| 643 | Healthy | 1 | Spain | Female | 67 | 1410.0 | 5.0 | 420.0 | 420.0 | 0 | 0 | 0 | 0 | 0 | 0 | 0 | 0 | 0 | 0 | 0 | 0 | 0 | 0 | 0 | 0 | 1 | 0 | 0 | 0 | 0 | 0.9 | 1 | 1 |
| 628 | Healthy | 1 | Spain | Female | 70 | 1440.0 | 10.0 | 510.0 | 480.0 | 0 | 1 | 0 | 0 | 0 | 0 | 0 | 0 | 0 | 0 | 0 | 0 | 0 | 0 | 0 | 0 | 0 | 0 | 1 | 0 | 0 | 0.9 | 1 | 1 |
| 648 | Healthy | 1 | Spain | Female | 72 | 1500.0 | 10.0 | 540.0 | 480.0 | 0 | 1 | 2 | 0 | 0 | 0 | 2 | 0 | 1 | 0 | 0 | 0 | 0 | 0 | 0 | 0 | 0 | 0 | 1 | 0 | 0 | 1.0 | 1 | 1 |
| 620 | Healthy | 2 | Spain | Female | 69 | 1435.0 | 0.0 | 480.0 | 480.0 | 0 | 1 | 0 | 0 | 0 | 0 | 0 | 1 | 1 | 1 | 0 | 0 | 0 | 1 | 1 | 0 | 0 | 0 | 1 | 0 | 0 | 1.0 | 2 | 1 |
| 575 | Healthy | 2 | Hungary | Female | 65 | 1395.0 | 5.0 | 420.0 | 420.0 | 0 | 1 | 3 | 0 | 0 | 0 | 0 | 3 | 1 | 0 | 0 | 1 | 0 | 0 | 0 | 0 | 1 | 0 | 1 | 0 | 1 | 0.9 | 3 | 1 |
| 634 | Diseased | 1 | Spain | Male | 72 | 1439.0 | 15.0 | 420.0 | 420.0 | 0 | 0 | 0 | 0 | 0 | 0 | 0 | 0 | 0 | 0 | 0 | 0 | 0 | 1 | 1 | 1 | 1 | 0 | 0 | 0 | 0 | 1.0 | 3 | 1 |
| 569 | Healthy | 3 | Hungary | Female | 67 | 1385.0 | 10.0 | 405.0 | 420.0 | 2 | 2 | 3 | 0 | 2 | 1 | 0 | 1 | 0 | 0 | 0 | 0 | 0 | 1 | 1 | 1 | 1 | 0 | 1 | 0 | 0 | 0.9 | 4 | 1 |
| 133 | Healthy | 3 | Hungary | Female | 71 | 1315.0 | 30.0 | 375.0 | 480.0 | 2 | 0 | 1 | 0 | 2 | 0 | 0 | 1 | 2 | 0 | 0 | 0 | 0 | 1 | 1 | 2 | 0 | 0 | 1 | 0 | 0 | 1.0 | 4 | 1 |
| 132 | Diseased | 3 | Hungary | Male | 71 | 1330.0 | 10.0 | 370.0 | 420.0 | 0 | 2 | 0 | 0 | 0 | 0 | 1 | 1 | 2 | 0 | 0 | 1 | 1 | 1 | 1 | 0 | 1 | 0 | 1 | 0 | 1 | 0.9 | 4 | 1 |
| 800 | Diseased | 3 | Spain | Female | 65 | 1440.0 | 15.0 | 420.0 | 360.0 | 0 | 0 | 0 | 0 | 0 | 0 | 0 | 0 | 0 | 0 | 0 | 0 | 0 | 1 | 1 | 1 | 2 | 0 | 0 | 0 | 0 | 0.9 | 4 | 1 |
| 643 | Healthy | 2 | Spain | Female | 67 | 1380.0 | 1.0 | 435.0 | 420.0 | 1 | 0 | 0 | 0 | 0 | 0 | 0 | 0 | 2 | 0 | 0 | 0 | 0 | 0 | 0 | 1 | 1 | 1 | 1 | 0 | 0 | 0.8 | 4 | 1 |
| 790 | Healthy | 3 | Spain | Male | 66 | 1440.0 | 2.0 | 420.0 | 420.0 | 0 | 0 | 0 | 0 | 0 | 0 | 0 | 1 | 0 | 0 | 0 | 1 | 0 | 1 | 1 | 0 | 1 | 0 | 1 | 0 | 1 | 1.0 | 4 | 1 |
| 803 | Healthy | 3 | Spain | Female | 67 | 1500.0 | 15.0 | 390.0 | 360.0 | 0 | 1 | 1 | 0 | 0 | 0 | 1 | 0 | 0 | 0 | 0 | 1 | 1 | 0 | 0 | 1 | 2 | 0 | 1 | 0 | 1 | 1.0 | 5 | 0 |
| 638 | Healthy | 1 | Spain | Female | 71 | 1470.0 | 24.0 | 480.0 | 420.0 | 1 | 0 | 0 | 0 | 1 | 0 | 1 | 0 | 0 | 0 | 1 | 0 | 0 | 1 | 1 | 1 | 1 | 0 | 1 | 1 | 0 | 0.9 | 5 | 0 |
| 133 | Healthy | 1 | Hungary | Female | 71 | 1375.0 | 30.0 | 353.0 | 420.0 | 2 | 1 | 2 | 0 | 2 | 0 | 2 | 1 | 0 | 0 | 0 | 0 | 1 | 1 | 1 | 2 | 1 | 0 | 1 | 0 | 1 | 1.0 | 6 | 0 |
| 170 | Healthy | 3 | Hungary | Male | 70 | 1380.0 | 5.0 | 360.0 | 360.0 | 1 | 2 | 2 | 0 | 0 | 0 | 1 | 0 | 0 | 1 | 0 | 1 | 1 | 1 | 1 | 1 | 2 | 0 | 1 | 0 | 1 | 0.9 | 6 | 0 |
| 640 | Healthy | 1 | Spain | Female | 69 | 1440.0 | 20.0 | 480.0 | 420.0 | 2 | 2 | 2 | 0 | 2 | 0 | 3 | 0 | 1 | 0 | 0 | 0 | 0 | 1 | 1 | 2 | 1 | 0 | 2 | 0 | 0 | 0.9 | 6 | 0 |
| 795 | Healthy | 3 | Spain | Female | 72 | 1500.0 | 10.0 | 510.0 | 360.0 | 2 | 2 | 0 | 0 | 0 | 0 | 0 | 0 | 0 | 0 | 0 | 0 | 0 | 1 | 1 | 1 | 2 | 1 | 1 | 0 | 0 | 0.8 | 6 | 0 |
| 420 | Healthy | 2 | Hungary | Female | 71 | 1350.0 | 20.0 | 510.0 | 480.0 | 2 | 2 | 3 | 1 | 2 | 0 | 0 | 2 | 0 | 0 | 0 | 0 | 1 | 1 | 1 | 2 | 0 | 1 | 2 | 0 | 1 | 0.8 | 7 | 0 |
| 419 | Healthy | 2 | Hungary | Male | 95 | 1320.0 | 3.0 | 330.0 | 360.0 | 0 | 2 | 3 | 0 | 0 | 0 | 0 | 0 | 2 | 2 | 0 | 2 | 1 | 1 | 1 | 0 | 2 | 1 | 1 | 0 | 2 | 0.8 | 7 | 0 |
| 799 | Diseased | 3 | Spain | Male | 79 | 1440.0 | 30.0 | 600.0 | 360.0 | 0 | 0 | 0 | 0 | 0 | 0 | 0 | 0 | 0 | 0 | 0 | 2 | 0 | 0 | 0 | 1 | 2 | 3 | 0 | 0 | 1 | 0.6 | 7 | 0 |
| 641 | Diseased | 2 | Spain | Female | 71 | 1380.0 | 5.0 | 394.0 | 360.0 | 0 | 1 | 2 | 0 | 0 | 0 | 1 | 0 | 0 | 0 | 3 | 0 | 0 | 1 | 1 | 0 | 2 | 1 | 1 | 3 | 0 | 0.8 | 8 | 0 |
| 624 | Diseased | 1 | Spain | Female | 72 | 1410.0 | 30.0 | 465.0 | 420.0 | 2 | 3 | 3 | 0 | 2 | 0 | 0 | 0 | 2 | 0 | 0 | 1 | 0 | 1 | 1 | 2 | 1 | 1 | 2 | 0 | 1 | 0.8 | 8 | 0 |
| 625 | Diseased | 1 | Spain | Male | 72 | 1380.0 | 15.0 | 360.0 | 360.0 | 0 | 3 | 1 | 0 | 3 | 0 | 0 | 0 | 3 | 0 | 0 | 0 | 0 | 3 | 3 | 1 | 2 | 0 | 2 | 0 | 0 | 0.9 | 8 | 0 |
| 700 | Healthy | 2 | Spain | Male | 67 | 1410.0 | 15.0 | 480.0 | 360.0 | 2 | 3 | 3 | 0 | 0 | 0 | 0 | 0 | 0 | 1 | 0 | 1 | 0 | 1 | 1 | 2 | 2 | 2 | 1 | 0 | 1 | 0.7 | 9 | 0 |
| 617 | Healthy | 2 | Spain | Female | 69 | 1416.0 | 30.0 | 517.0 | 360.0 | 3 | 3 | 2 | 1 | 1 | 1 | 0 | 2 | 1 | 0 | 1 | 0 | 0 | 1 | 1 | 2 | 2 | 2 | 2 | 1 | 0 | 0.7 | 10 | 0 |
| 215 | Healthy | 1 | Hungary | Female | 87 | 1380.0 | 30.0 | 420.0 | 250.0 | 1 | 1 | 3 | 1 | 0 | 0 | 1 | 1 | 1 | 0 | 1 | 0 | 1 | 2 | 2 | 1 | 3 | 3 | 1 | 1 | 1 | 0.5 | 12 | 0 |
| 630 | Healthy | 1 | Spain | Female | 74 | 1380.0 | 60.0 | 390.0 | 300.0 | 3 | 2 | 2 | 0 | 0 | 0 | 3 | 0 | 0 | 2 | 3 | 0 | 0 | 1 | 1 | 3 | 2 | 2 | 1 | 3 | 0 | 0.7 | 12 | 0 |
| 169 | Diseased | 3 | Hungary | Female | 69 | 1380.0 | 100.0 | 210.0 | 150.0 | 3 | 3 | 1 | 0 | 3 | 1 | 2 | 2 | 1 | 0 | 0 | 0 | 1 | 2 | 2 | 3 | 3 | 3 | 2 | 0 | 1 | 0.6 | 14 | 0 |
| 169 | Diseased | 1 | Hungary | Female | 69 | 1404.0 | 60.0 | 245.0 | 150.0 | 3 | 3 | 1 | 0 | 3 | 0 | 2 | 2 | 3 | 3 | 0 | 0 | 1 | 3 | 3 | 3 | 3 | 3 | 2 | 0 | 1 | 0.5 | 15 | 0 |
| 169 | Diseased | 2 | Hungary | Female | 69 | 1320.0 | 120.0 | 300.0 | 161.0 | 3 | 3 | 1 | 1 | 3 | 3 | 1 | 2 | 3 | 3 | 0 | 0 | 1 | 2 | 2 | 3 | 3 | 3 | 3 | 0 | 1 | 0.4 | 15 | 0 |
| Median: Healthy | 1410.0 | 10.0 | 427.5 | 420.0 | 1.0 | 1.0 | 2.0 | 0.0 | 0.0 | 0.0 | 0.0 | 0.0 | 0.0 | 0.0 | 0.0 | 0.0 | 0.0 | 1.0 | 1.0 | 1.0 | 1.0 | 0.0 | 1.0 | 0.0 | 0.0 | 0.8 | 5.0 | 0.0 | |||||
| Median: Diseased | 1392.0 | 22.5 | 382.0 | 360.0 | 0.0 | 2.5 | 1.0 | 0.0 | 1.0 | 0.0 | 0.5 | 0.0 | 1.5 | 0.0 | 0.0 | 0.0 | 0.0 | 1.0 | 1.0 | 1.0 | 2.0 | 1.0 | 1.5 | 0.0 | 1.0 | 0.8 | 8.0 | 0.0 | |||||
| Median: Spain | 1439.0 | 15.0 | 465.0 | 420.0 | 0.0 | 1.0 | 0.0 | 0.0 | 0.0 | 0.0 | 0.0 | 0.0 | 0.0 | 0.0 | 0.0 | 0.0 | 0.0 | 1.0 | 1.0 | 1.0 | 1.0 | 0.0 | 1.0 | 0.0 | 0.0 | 0.8 | 5.0 | 0.0 | |||||
| Median: Hungary | 1380.0 | 20.0 | 370.0 | 420.0 | 2.0 | 2.0 | 2.0 | 0.0 | 2.0 | 0.0 | 1.0 | 1.0 | 1.0 | 0.0 | 0.0 | 0.0 | 1.0 | 1.0 | 1.0 | 1.0 | 1.0 | 0.0 | 1.0 | 0.0 | 1.0 | 0.8 | 6.0 | 0.0 | |||||
| Median: Female | 1404.0 | 20.0 | 420.0 | 420.0 | 2.0 | 1.0 | 1.0 | 0.0 | 0.0 | 0.0 | 0.0 | 0.0 | 1.0 | 0.0 | 0.0 | 0.0 | 0.0 | 1.0 | 1.0 | 1.0 | 1.0 | 0.0 | 1.0 | 0.0 | 0.0 | 0.8 | 6.0 | 0.0 | |||||
| Median: Male | 1410.0 | 10.0 | 420.0 | 360.0 | 0.0 | 2.0 | 0.0 | 0.0 | 0.0 | 0.0 | 0.0 | 0.0 | 0.0 | 0.0 | 0.0 | 1.0 | 0.0 | 1.0 | 1.0 | 1.0 | 2.0 | 0.0 | 1.0 | 0.0 | 1.0 | 0.8 | 6.0 | 0.0 | |||||
| Median: All | 1407.0 | 15.0 | 420.0 | 420.0 | 1.0 | 1.0 | 1.0 | 0.0 | 0.0 | 0.0 | 0.0 | 0.0 | 0.0 | 0.0 | 0.0 | 0.0 | 0.0 | 1.0 | 1.0 | 1.0 | 1.0 | 0.0 | 1.0 | 0.0 | 0.0 | 0.8 | 6.0 | 0.0 | |||||
| Mean: Healthy | 1410.5 | 15.6 | 442.5 | 406.8 | 1.0 | 1.2 | 1.4 | 0.1 | 0.5 | 0.0 | 0.6 | 0.5 | 0.5 | 0.3 | 0.2 | 0.3 | 0.2 | 0.7 | 0.7 | 1.0 | 1.1 | 0.5 | 1.0 | 0.2 | 0.4 | 0.8 | 5.2 | 0.4 | |||||
| Mean: Diseased | 1392.3 | 40.0 | 378.4 | 316.1 | 1.1 | 1.8 | 0.9 | 0.1 | 1.4 | 0.4 | 0.7 | 0.7 | 1.4 | 0.6 | 0.3 | 0.4 | 0.4 | 1.5 | 1.5 | 1.5 | 2.0 | 1.4 | 1.3 | 0.3 | 0.6 | 0.7 | 8.6 | 0.3 | |||||
| Mean: Spain | 1432.1 | 16.4 | 458.4 | 397.8 | 0.8 | 1.2 | 0.9 | 0.0 | 0.4 | 0.0 | 0.5 | 0.2 | 0.5 | 0.2 | 0.4 | 0.3 | 0.0 | 0.7 | 0.7 | 1.0 | 1.3 | 0.6 | 1.0 | 0.4 | 0.2 | 0.8 | 5.4 | 0.4 | |||||
| Mean: Hungary | 1364.9 | 33.3 | 369.8 | 350.0 | 1.4 | 1.7 | 1.7 | 0.2 | 1.3 | 0.3 | 0.7 | 1.2 | 1.1 | 0.6 | 0.0 | 0.3 | 0.6 | 1.2 | 1.2 | 1.3 | 1.5 | 1.0 | 1.3 | 0.0 | 0.8 | 0.7 | 7.5 | 0.3 | |||||
| Mean: Female | 1408.9 | 27.8 | 420.3 | 372.6 | 1.3 | 1.4 | 1.3 | 0.1 | 1.0 | 0.2 | 0.8 | 0.7 | 0.8 | 0.3 | 0.3 | 0.1 | 0.3 | 0.9 | 0.9 | 1.3 | 1.3 | 0.9 | 1.2 | 0.3 | 0.3 | 0.8 | 6.6 | 0.3 | |||||
| Mean: Male | 1394.3 | 11.6 | 427.7 | 393.3 | 0.3 | 1.4 | 1.0 | 0.0 | 0.3 | 0.0 | 0.2 | 0.2 | 0.7 | 0.4 | 0.0 | 0.8 | 0.3 | 1.0 | 1.0 | 0.6 | 1.4 | 0.6 | 0.8 | 0.0 | 0.7 | 0.8 | 5.4 | 0.4 | |||||
| Mean: All | 1404.8 | 23.2 | 422.4 | 378.4 | 1.0 | 1.4 | 1.2 | 0.1 | 0.8 | 0.1 | 0.6 | 0.6 | 0.8 | 0.4 | 0.2 | 0.3 | 0.3 | 0.9 | 0.9 | 1.1 | 1.4 | 0.8 | 1.1 | 0.2 | 0.5 | 0.8 | 6.3 | 0.4 | |||||
| SD: Healthy | 51.1 | 13.8 | 60.2 | 61.3 | 1.0 | 0.9 | 1.2 | 0.3 | 0.8 | 0.2 | 0.9 | 0.8 | 0.7 | 0.6 | 0.6 | 0.5 | 0.4 | 0.5 | 0.5 | 0.9 | 0.8 | 0.8 | 0.4 | 0.6 | 0.5 | 0.1 | 3.2 | 0.4 | |||||
| SD: Diseased | 40.9 | 38.2 | 106.3 | 109.2 | 1.3 | 1.3 | 0.9 | 0.3 | 1.4 | 0.9 | 0.7 | 0.9 | 1.2 | 1.2 | 0.9 | 0.6 | 0.4 | 0.9 | 0.9 | 1.1 | 0.7 | 1.3 | 1.0 | 0.9 | 0.4 | 0.1 | 4.3 | 0.4 | |||||
| SD: Spain | 38.5 | 13.8 | 59.3 | 48.5 | 1.0 | 1.1 | 1.0 | 0.2 | 0.8 | 0.2 | 0.9 | 0.5 | 0.8 | 0.5 | 0.9 | 0.5 | 0.2 | 0.6 | 0.6 | 0.8 | 0.7 | 0.9 | 0.6 | 0.9 | 0.4 | 0.1 | 3.1 | 0.4 | |||||
| SD: Hungary | 32.3 | 36.2 | 84.8 | 122.8 | 1.1 | 0.8 | 1.1 | 0.4 | 1.2 | 0.8 | 0.7 | 0.8 | 1.0 | 1.1 | 0.2 | 0.6 | 0.4 | 0.7 | 0.7 | 1.1 | 1.1 | 1.3 | 0.6 | 0.2 | 0.5 | 0.1 | 4.6 | 0.4 | |||||
| SD: Female | 50.4 | 29.9 | 83.2 | 102.2 | 1.1 | 1.0 | 1.1 | 0.3 | 1.1 | 0.6 | 1.0 | 0.9 | 0.9 | 0.9 | 0.8 | 0.3 | 0.4 | 0.7 | 0.7 | 1.0 | 1.0 | 1.1 | 0.6 | 0.8 | 0.4 | 0.1 | 4.3 | 0.4 | |||||
| SD: Male | 43.1 | 8.0 | 82.5 | 41.0 | 0.6 | 1.1 | 1.2 | 0.0 | 0.9 | 0.0 | 0.4 | 0.4 | 1.1 | 0.6 | 0.0 | 0.7 | 0.4 | 0.8 | 0.8 | 0.6 | 0.6 | 1.0 | 0.5 | 0.0 | 0.6 | 0.1 | 2.4 | 0.4 | |||||
| SD: All | 48.9 | 26.7 | 83.1 | 89.8 | 1.1 | 1.0 | 1.1 | 0.3 | 1.1 | 0.5 | 0.9 | 0.8 | 1.0 | 0.8 | 0.7 | 0.5 | 0.4 | 0.7 | 0.7 | 1.0 | 0.9 | 1.1 | 0.6 | 0.7 | 0.5 | 0.1 | 3.9 | 0.4 | |||||
Color coding: from orange (worse outcome relative to others) to yellow to green (better outcome).

Figure A9.
Sub-scores and Scores for Sleep (PSQI). Dotted markings delimit levels of the categorical score.
Health-Related Quality of Life (EQ-5D-3L)
Participants provided 30 answers about their quality of life on the EQ-5D-3L scale [34]. The scale provides 3 severity levels for five facets of life quality, no problem, some problems, and extreme problems as well as a 0–100 numeric score for the health status on the day of the administration, as detailed in Appendix B.1.1. Half of the answers report a health score of 90 or above. Five answers reported a health score of 75 or below, and five answers reported a health score of 100. Table A10 shows the answers and Figure A10 illustrates the sub-scores and scores by participant group.

Figure A10.
Sub-scores and Scores for Health-Related Quality of Life (EQ-5D-3L).
The mean ± SD perceived health is at 84.96 ± 13.8 across all participants. The means ± SD for the five domains are as follows: 1.2 ± 0.4 for mobility, 1.0 ± 0.0 for self-care, 1.1 ± 0.3 for usual activities, 1.5 ± 0.6 for pain/discomfort, and 1.2 ± 0.4 for depression/anxiety. None of the participants self-reported quality of life issues due to self-care impediments.
The healthy and diseased participants report similar quality of life in the mobility, self-care, and usual activities. However, the participants with disease report worse pain/discomfort and depression/anxiety. Furthermore, the participants with disease report a mean health score of only 77.27 as compared to the 89.42 for the healthy. The participants with disease also self-report less stable answers, e.g., SD for the health score of 16.97 as compared to the SD of 8.95 of the healthy.
Participants from Spain self-reported a slightly improved health than those from Hungary. The participants from Spain reported a median health score of 90 compared to 85 for those from Hungary. However, the mean health scores are similar: 86.84 and 83.52, respectively. The participants from Hungary participants provided more stable health score, but more varied depression/anxiety responses than the participants from Spain.
Female participants report similar health as compared to male participants, with a median health score of 85 compared to 90, but a mean of 85.42 compared to 83.88. Women self-report experiencing slightly less mobility, usual activities, and depression/anxiety.
Table A10.
Characteristics of PRO Health-Related Quality of Life (EQ-5D-3L).
Table A10.
Characteristics of PRO Health-Related Quality of Life (EQ-5D-3L).
| ID | Health | Wave | Country | Gender | Age | Q1: Mobility | Q2: Self-Care | Q3: Usual Activities | Q4: Pain/Discomfort | Q5: Anxiety/Depression | Health Score |
|---|---|---|---|---|---|---|---|---|---|---|---|
| 625 | Diseased | 1 | Spain | Male | 72 | 1 | 1 | 1 | 3 | 1 | 40 |
| 641 | Diseased | 1 | Spain | Female | 71 | 1 | 1 | 1 | 2 | 2 | 50 |
| 640 | Healthy | 1 | Spain | Female | 69 | 1 | 1 | 1 | 2 | 1 | 70 |
| 169 | Diseased | 2 | Hungary | Female | 69 | 1 | 1 | 2 | 2 | 2 | 75 |
| 630 | Healthy | 1 | Spain | Female | 74 | 2 | 1 | 2 | 1 | 2 | 75 |
| 169 | Diseased | 1 | Hungary | Female | 69 | 2 | 1 | 1 | 2 | 2 | 80 |
| 169 | Diseased | 3 | Hungary | Female | 69 | 1 | 1 | 1 | 1 | 2 | 80 |
| 420 | Healthy | 2 | Hungary | Female | 71 | 2 | 1 | 1 | 2 | 2 | 80 |
| 132 | Diseased | 1 | Hungary | Male | 71 | 1 | 1 | 1 | 1 | 1 | 80 |
| 641 | Diseased | 2 | Spain | Female | 71 | 1 | 1 | 1 | 2 | 1 | 80 |
| 624 | Diseased | 1 | Spain | Female | 72 | 2 | 1 | 1 | 2 | 1 | 80 |
| 648 | Healthy | 1 | Spain | Female | 72 | 2 | 1 | 2 | 2 | 1 | 80 |
| 796 | Healthy | 3 | Spain | Male | 74 | 1 | 1 | 1 | 1 | 1 | 80 |
| 575 | Healthy | 2 | Hungary | Female | 65 | 1 | 1 | 1 | 2 | 1 | 85 |
| 170 | Healthy | 3 | Hungary | Male | 70 | 1 | 1 | 1 | 2 | 2 | 85 |
| 132 | Diseased | 3 | Hungary | Male | 71 | 1 | 1 | 1 | 2 | 1 | 90 |
| 212 | Healthy | 1 | Hungary | Male | 72 | 1 | 1 | 2 | 1 | 1 | 90 |
| 643 | Healthy | 2 | Spain | Female | 67 | 1 | 1 | 1 | 1 | 1 | 90 |
| 617 | Healthy | 2 | Spain | Female | 69 | 1 | 1 | 1 | 1 | 1 | 90 |
| 795 | Healthy | 3 | Spain | Female | 72 | 1 | 1 | 1 | 1 | 1 | 90 |
| 569 | Healthy | 3 | Hungary | Female | 67 | 1 | 1 | 1 | 2 | 1 | 95 |
| 133 | Healthy | 1 | Hungary | Female | 71 | 1 | 1 | 1 | 1 | 1 | 95 |
| 419 | Healthy | 2 | Hungary | Male | 95 | 1 | 1 | 1 | 1 | 1 | 95 |
| 799 | Diseased | 3 | Spain | Male | 79 | 1 | 1 | 1 | 1 | 1 | 95 |
| 133 | Healthy | 3 | Hungary | Female | 71 | 1 | 1 | 1 | 1 | 1 | 99 |
| 800 | Diseased | 3 | Spain | Female | 65 | 1 | 1 | 1 | 1 | 1 | 100 |
| 643 | Healthy | 1 | Spain | Female | 67 | 1 | 1 | 1 | 1 | 1 | 100 |
| 628 | Healthy | 1 | Spain | Female | 70 | 1 | 1 | 1 | 1 | 1 | 100 |
| 638 | Healthy | 1 | Spain | Female | 71 | 1 | 1 | 1 | 1 | 1 | 100 |
| 790 | Healthy | 3 | Spain | Male | 66 | 1 | 1 | 1 | 1 | 1 | 100 |
| Median: Healthy | 1.0 | 1.0 | 1.0 | 1.0 | 1.0 | 90.0 | |||||
| Median: Diseased | 1.0 | 1.0 | 1.0 | 2.0 | 1.0 | 80.0 | |||||
| Median: Spain | 1.0 | 1.0 | 1.0 | 1.0 | 1.0 | 90.0 | |||||
| Median: Hungary | 1.0 | 1.0 | 1.0 | 2.0 | 1.0 | 85.0 | |||||
| Median: Female | 1.0 | 1.0 | 1.0 | 1.0 | 1.0 | 85.0 | |||||
| Median: Male | 1.0 | 1.0 | 1.0 | 1.0 | 1.0 | 90.0 | |||||
| Median: All | 1.0 | 1.0 | 1.0 | 1.0 | 1.0 | 87.5 | |||||
| Mean: Healthy | 1.1 | 1.0 | 1.1 | 1.3 | 1.1 | 89.4 | |||||
| Mean: Diseased | 1.1 | 1.0 | 1.0 | 1.7 | 1.3 | 77.2 | |||||
| Mean: Spain | 1.1 | 1.0 | 1.1 | 1.4 | 1.1 | 83.5 | |||||
| Mean: Hungary | 1.1 | 1.0 | 1.1 | 1.5 | 1.3 | 86.8 | |||||
| Mean: Female | 1.2 | 1.0 | 1.1 | 1.4 | 1.2 | 85.4 | |||||
| Mean: Male | 1.0 | 1.0 | 1.1 | 1.4 | 1.1 | 83.8 | |||||
| Mean: All | 1.1 | 1.0 | 1.1 | 1.4 | 1.2 | 84.9 | |||||
| SD: Healthy | 0.3 | 0.0 | 0.3 | 0.4 | 0.3 | 8.9 | |||||
| SD: Diseased | 0.3 | 0.0 | 0.2 | 0.6 | 0.4 | 16.9 | |||||
| SD: Spain | 0.3 | 0.0 | 0.3 | 0.5 | 0.3 | 17.0 | |||||
| SD: Hungary | 0.3 | 0.0 | 0.3 | 0.4 | 0.4 | 7.3 | |||||
| SD: Female | 0.4 | 0.0 | 0.3 | 0.4 | 0.4 | 12.2 | |||||
| SD: Male | 0.0 | 0.0 | 0.3 | 0.6 | 0.3 | 16.7 | |||||
| SD: All | 0.3 | 0.0 | 0.3 | 0.5 | 0.4 | 13.8 | |||||
Color coding: from orange (worse outcome relative to others) to yellow to reen (better outcome).
Appendix C.1.2. Technology-Reported Outcomes (Fitbit)
We overview the TechROs by first assessing the data quality. Table A11 depicts the total compliance (as the number of days including TechROs) as well as the intraday compliance (as the number of valid days). Figure A11 depicts participant compliance in days (all monitored and valid) for each participant group. Figure A12 illustrates participant compliance by outcome. Figure A13, Figure A14, Figure A15 show participant compliance by health, country, and gender groups, respectively.
While participants wore the devices for a median (mean) of 224 (295) days, Fitbit reported TechROs for different durations. Energy expenditure, steps, and heart rate appeared in the majority of days, with their medians (means ± SD) at 224, 204, and 128 (295 ± 238, 276 ± 236, and 230 ± 214) days. The sedentary, light, fair, and vigorous physical activity durations appeared in decreasing durations, with medians (means ± SD) at 136, 136, 91, and 79 days (219 ± 203, 219 ± 202, 165 ± 171, and 160 ± 168 days). Sleep monitoring recorded a median (mean ± SD) of 130 (198 ± 194) days. Cumulative TechROs such as sedentary+light recorded durations corresponding to at most the minimum of their constituents.

Figure A11.
Count of seniors with at least the given valid days of Fitbit (TechRO) by group.

Figure A12.
Count of seniors with at least the given valid days of Fitbit (TechRO) by outcome.

Figure A13.
Count of seniors with at least the given valid days of Fitbit (TechRO) by outcome and health group.

Figure A14.
Count of seniors with at least the given valid days of Fitbit (TechRO) by outcome and country group.

Figure A15.
Count of seniors with at least the given valid days of Fitbit (TechRO) by outcome and gender group.
Table A11.
Days of Fitbit (TechRO) data for seniors with at least one PRO ( participants).
Table A11.
Days of Fitbit (TechRO) data for seniors with at least one PRO ( participants).
| PID | Health | Country | Gender | Age | Monitored Days | Energy | Steps | Heart Rate | Sedentary | Sedentary+Light | Light | Light+Fair | Fair | Fair+Very | Very | Active | Sleep | Valid Days |
|---|---|---|---|---|---|---|---|---|---|---|---|---|---|---|---|---|---|---|
| 502 | Diseased | Hungary | Female | 63 | 231 | 231 | 80 | 73 | 50 | 22 | 49 | 15 | 15 | 9 | 9 | 9 | 8 | 0 |
| 649 | Healthy | Spain | Female | 72 | 135 | 135 | 125 | 0 | 0 | 0 | 0 | 0 | 0 | 0 | 0 | 0 | 0 | 0 |
| 630 | Healthy | Spain | Female | 74 | 23 | 23 | 13 | 7 | 7 | 7 | 7 | 4 | 4 | 4 | 4 | 4 | 7 | 1 |
| 799 | Diseased | Spain | Male | 79 | 34 | 34 | 20 | 15 | 16 | 13 | 15 | 6 | 6 | 6 | 6 | 6 | 13 | 5 |
| 648 | Healthy | Spain | Female | 72 | 35 | 35 | 24 | 21 | 22 | 19 | 22 | 14 | 14 | 12 | 12 | 12 | 18 | 11 |
| 791 | Diseased | Spain | Male | 72 | 74 | 74 | 67 | 64 | 56 | 54 | 56 | 12 | 12 | 12 | 12 | 12 | 54 | 11 |
| 800 | Diseased | Spain | Female | 65 | 43 | 43 | 33 | 22 | 22 | 20 | 22 | 17 | 17 | 17 | 17 | 17 | 19 | 12 |
| 798 | Healthy | Spain | Female | 67 | 47 | 47 | 39 | 35 | 36 | 35 | 36 | 31 | 31 | 31 | 31 | 31 | 34 | 20 |
| 796 | Healthy | Spain | Male | 74 | 77 | 77 | 63 | 46 | 49 | 48 | 49 | 48 | 48 | 48 | 48 | 48 | 25 | 20 |
| 575 | Healthy | Hungary | Female | 65 | 69 | 69 | 61 | 59 | 60 | 58 | 60 | 41 | 41 | 41 | 41 | 41 | 59 | 23 |
| 795 | Healthy | Spain | Female | 72 | 274 | 274 | 261 | 40 | 38 | 38 | 38 | 32 | 32 | 31 | 31 | 31 | 35 | 26 |
| 790 | Healthy | Spain | Male | 66 | 79 | 79 | 70 | 67 | 67 | 65 | 67 | 63 | 63 | 63 | 63 | 63 | 30 | 28 |
| 624 | Diseased | Spain | Female | 72 | 153 | 153 | 143 | 138 | 139 | 130 | 139 | 50 | 50 | 47 | 47 | 47 | 131 | 30 |
| 420 | Healthy | Hungary | Female | 71 | 552 | 552 | 446 | 344 | 420 | 233 | 417 | 138 | 138 | 113 | 114 | 113 | 173 | 34 |
| 644 | Diseased | Spain | Male | 70 | 169 | 169 | 142 | 90 | 61 | 58 | 61 | 53 | 53 | 53 | 53 | 53 | 54 | 37 |
| 576 | Healthy | Hungary | Male | 60 | 439 | 439 | 430 | 430 | 430 | 420 | 430 | 119 | 119 | 94 | 95 | 94 | 429 | 49 |
| 634 | Diseased | Spain | Male | 72 | 237 | 237 | 230 | 75 | 60 | 57 | 60 | 55 | 55 | 55 | 55 | 55 | 56 | 50 |
| 793 | Healthy | Spain | Male | 68 | 119 | 119 | 107 | 52 | 52 | 52 | 52 | 52 | 52 | 52 | 52 | 52 | 51 | 51 |
| 641 | Diseased | Spain | Female | 71 | 167 | 167 | 156 | 118 | 134 | 132 | 134 | 122 | 122 | 120 | 121 | 120 | 129 | 63 |
| 643 | Healthy | Spain | Female | 67 | 217 | 217 | 201 | 186 | 186 | 186 | 186 | 171 | 171 | 159 | 159 | 159 | 185 | 90 |
| 638 | Healthy | Spain | Female | 71 | 211 | 211 | 208 | 208 | 208 | 207 | 208 | 147 | 147 | 129 | 130 | 129 | 206 | 127 |
| 212 | Healthy | Hungary | Male | 72 | 733 | 733 | 698 | 580 | 538 | 465 | 538 | 244 | 244 | 230 | 233 | 230 | 439 | 136 |
| 170 | Healthy | Hungary | Male | 70 | 785 | 785 | 777 | 551 | 369 | 353 | 363 | 303 | 303 | 298 | 299 | 298 | 347 | 140 |
| 169 | Diseased | Hungary | Female | 69 | 794 | 794 | 778 | 561 | 398 | 360 | 398 | 312 | 312 | 302 | 303 | 302 | 293 | 141 |
| 625 | Diseased | Spain | Male | 72 | 288 | 288 | 276 | 254 | 254 | 250 | 254 | 221 | 221 | 217 | 217 | 217 | 250 | 141 |
| 628 | Healthy | Spain | Female | 70 | 303 | 303 | 290 | 286 | 289 | 288 | 289 | 278 | 278 | 273 | 273 | 273 | 276 | 146 |
| 617 | Healthy | Spain | Female | 69 | 402 | 402 | 395 | 391 | 392 | 392 | 392 | 355 | 355 | 342 | 344 | 342 | 392 | 170 |
| 569 | Healthy | Hungary | Female | 67 | 501 | 501 | 498 | 483 | 479 | 475 | 479 | 417 | 417 | 415 | 415 | 415 | 476 | 215 |
| 133 | Healthy | Hungary | Female | 71 | 632 | 632 | 623 | 622 | 623 | 622 | 623 | 521 | 521 | 486 | 487 | 486 | 621 | 242 |
| 419 | Healthy | Hungary | Male | 95 | 599 | 599 | 594 | 561 | 567 | 563 | 566 | 502 | 502 | 493 | 494 | 493 | 553 | 245 |
| 640 | Healthy | Spain | Female | 69 | 385 | 385 | 380 | 376 | 377 | 375 | 377 | 346 | 346 | 344 | 345 | 344 | 371 | 295 |
| 132 | Diseased | Hungary | Male | 71 | 639 | 639 | 623 | 618 | 622 | 619 | 622 | 613 | 613 | 613 | 613 | 613 | 617 | 301 |
| Median: Healthy | 274.0 | 274.0 | 261.0 | 208.0 | 208.0 | 207.0 | 208.0 | 138.0 | 138.0 | 113.0 | 114.0 | 113.0 | 185.0 | 51.0 | ||||
| Median: Diseased | 169.0 | 169.0 | 143.0 | 90.0 | 61.0 | 58.0 | 61.0 | 53.0 | 53.0 | 53.0 | 53.0 | 53.0 | 56.0 | 37.0 | ||||
| Median: Spain | 153.0 | 153.0 | 142.0 | 67.0 | 60.0 | 57.0 | 60.0 | 52.0 | 52.0 | 52.0 | 52.0 | 52.0 | 54.0 | 30.0 | ||||
| Median: Hungary | 599.0 | 599.0 | 594.0 | 551.0 | 430.0 | 420.0 | 430.0 | 303.0 | 303.0 | 298.0 | 299.0 | 298.0 | 429.0 | 140.0 | ||||
| Median: Female | 217.0 | 217.0 | 201.0 | 138.0 | 139.0 | 132.0 | 139.0 | 122.0 | 122.0 | 113.0 | 114.0 | 113.0 | 131.0 | 34.0 | ||||
| Median: Male | 237.0 | 237.0 | 230.0 | 90.0 | 67.0 | 65.0 | 67.0 | 63.0 | 63.0 | 63.0 | 63.0 | 63.0 | 56.0 | 50.0 | ||||
| Median: All | 224.0 | 224.0 | 204.5 | 128.0 | 136.5 | 131.0 | 136.5 | 91.0 | 91.0 | 78.5 | 79.0 | 78.5 | 130.0 | 49.5 | ||||
| Mean: Healthy | 315.0 | 315.0 | 300.1 | 254.5 | 248.0 | 233.3 | 247.5 | 182.1 | 182.1 | 174.1 | 174.7 | 174.1 | 225.0 | 98.5 | ||||
| Mean: Diseased | 257.1 | 257.1 | 231.6 | 184.3 | 164.7 | 155.9 | 164.5 | 134.1 | 134.1 | 131.9 | 132.0 | 131.9 | 147.6 | 71.9 | ||||
| Mean: Spain | 165.3 | 165.3 | 154.4 | 118.6 | 117.3 | 115.5 | 117.3 | 98.9 | 98.9 | 95.9 | 96.1 | 95.9 | 111.2 | 63.5 | ||||
| Mean: Hungary | 543.0 | 543.0 | 509.8 | 443.8 | 414.1 | 380.9 | 413.1 | 293.1 | 293.1 | 281.2 | 282.0 | 281.2 | 365.0 | 138.7 | ||||
| Mean: Female | 272.3 | 272.3 | 250.2 | 208.9 | 204.2 | 189.4 | 204.0 | 158.4 | 158.4 | 151.3 | 151.7 | 151.3 | 180.6 | 86.6 | ||||
| Mean: Male | 328.6 | 328.6 | 315.1 | 261.7 | 241.6 | 232.0 | 241.0 | 176.2 | 176.2 | 171.8 | 172.3 | 171.8 | 224.4 | 93.3 | ||||
| Mean: All | 295.1 | 295.1 | 276.5 | 230.4 | 219.4 | 206.7 | 219.0 | 165.6 | 165.6 | 159.6 | 160.0 | 159.6 | 198.4 | 89.3 | ||||
| SD: Healthy | 238.7 | 238.7 | 234.0 | 216.8 | 207.8 | 198.5 | 207.5 | 164.9 | 164.9 | 160.6 | 161.0 | 160.6 | 199.4 | 89.8 | ||||
| SD: Diseased | 231.9 | 231.9 | 235.4 | 200.9 | 181.4 | 179.0 | 181.6 | 177.8 | 177.8 | 177.2 | 177.3 | 177.2 | 173.8 | 86.6 | ||||
| SD: Spain | 113.4 | 113.4 | 114.1 | 116.9 | 118.2 | 118.2 | 118.2 | 109.5 | 109.5 | 106.7 | 107.1 | 106.7 | 118.9 | 72.5 | ||||
| SD: Hungary | 215.8 | 215.8 | 235.1 | 194.6 | 188.3 | 195.7 | 188.6 | 193.3 | 193.3 | 193.8 | 193.8 | 193.8 | 202.2 | 98.0 | ||||
| SD: Female | 215.0 | 215.0 | 212.8 | 195.0 | 186.9 | 179.3 | 186.8 | 158.9 | 158.9 | 153.8 | 154.2 | 153.8 | 176.5 | 89.2 | ||||
| SD: Male | 264.5 | 264.5 | 263.1 | 235.7 | 222.7 | 214.5 | 222.4 | 186.7 | 186.7 | 185.5 | 185.7 | 185.5 | 215.6 | 90.0 | ||||
| SD: All | 238.0 | 238.0 | 236.7 | 214.1 | 203.0 | 195.5 | 202.8 | 171.0 | 171.0 | 167.7 | 168.0 | 167.7 | 194.5 | 89.6 | ||||
Color coding: from orange (fewer days relative to others) to yellow to green (more days).
Concerning total compliance, Fitbit devices were worn by the participants in 295 ± 238 days on average and 50% of participants wore the Fitbit devices in at least 224 days. Healthy participants wore the devices on average 58 days more than participants with disease. Hungarian participants were also significantly more compliant in wearing the devices, by achieving mean 543 (446 more) days with monitored data. From the top 10 compliant, six were Hungarian. Most days were recorded by three Hungarians, and most valid days were recorded by one Hungarian. Men wore the devices for only slightly more extended periods than women.

Figure A16.
Median values of TechROs (Fitbit) across the entire monitoring period: energy, steps, heart rate, sedentary duration, sedentary+light duration, light duration (1 of 2).
Regarding intraday compliance, participants wore the devices for more than 23 h for a mean ± SD of 89 ± 89 days while 50% of them wore the devices for at least 49 valid days of 21 h. One third had less than 30 valid days, half had less than 60 days, one person had 90 days, and one third had more than 120 days. The participants with disease were more compliant intraday than the healthy participants, keeping 37 valid days as compared to only 51 by the healthy participants, having a relative ratio to the total days of 4. Participants from Hungary were also more compliant intraday, achieving 140 valid days compared to 30 valid days and 13 ratio to total.
We overview the dataset by depicting in Table A12 the medians of the TechRO variables obtained from the participants’ days over the entire period of monitoring and summary statistics by participant group. The following paragraphs describe each TechRO in depth. Figure 8 and Figure 9 depict the median values for each group across the entire monitoring period.
Table A12.
Median values of TechROs (Fitbit) across the entire monitoring period ( participants).
Table A12.
Median values of TechROs (Fitbit) across the entire monitoring period ( participants).
| PID | Health | Country | Gender | Age | Energy (kcal.) | Steps (count) | Heart Rate (bpm) | Sedentary (min.) | Sedentary+Light (min.) | Light (min.) | Light+Fair (min.) | Fair (min.) | Fair+Very (min.) | Very (min.) | Active (min.) | Sleep (h:min.) |
|---|---|---|---|---|---|---|---|---|---|---|---|---|---|---|---|---|
| 575 | Healthy | Hungary | Female | 65 | 1733.0 | 8835.0 | 64.0 | 750.0 | 1005.5 | 252.0 | 266.0 | 7.0 | 29.0 | 23.0 | 289.0 | 6:48 |
| 569 | Healthy | Hungary | Female | 67 | 1753.0 | 10,038.5 | 56.0 | 689.0 | 931.0 | 235.0 | 264.0 | 17.0 | 46.0 | 26.0 | 295.0 | 7:42 |
| 420 | Healthy | Hungary | Female | 71 | 1349.0 | 3462.0 | 66.0 | 1286.0 | 945.0 | 120.0 | 181.5 | 10.0 | 19.0 | 6.0 | 184.0 | 9:00 |
| 133 | Healthy | Hungary | Female | 71 | 2163.0 | 9856.0 | 64.0 | 628.0 | 894.0 | 257.0 | 286.0 | 26.0 | 53.0 | 24.0 | 316.0 | 8:18 |
| 576 | Healthy | Hungary | Male | 60 | 2516.0 | 2624.5 | 63.0 | 829.0 | 996.5 | 171.0 | 194.0 | 8.0 | 12.0 | 3.0 | 197.0 | 7:18 |
| 170 | Healthy | Hungary | Male | 70 | 2585.0 | 13,882.0 | 53.0 | 620.0 | 929.0 | 309.0 | 333.0 | 15.0 | 51.5 | 31.0 | 375.0 | 7:42 |
| 212 | Healthy | Hungary | Male | 72 | 2046.0 | 3445.0 | 56.0 | 1152.5 | 1203.0 | 92.0 | 120.5 | 8.0 | 22.0 | 11.0 | 133.5 | 4:18 |
| 419 | Healthy | Hungary | Male | 95 | 2490.0 | 5239.0 | 52.0 | 704.0 | 885.0 | 168.0 | 206.0 | 26.0 | 68.0 | 37.5 | 250.0 | 8:12 |
| 643 | Healthy | Spain | Female | 67 | 1795.0 | 9281.0 | 57.0 | 603.0 | 935.5 | 322.0 | 362.0 | 32.0 | 49.0 | 15.0 | 384.0 | 7:42 |
| 798 | Healthy | Spain | Female | 67 | 1817.0 | 9911.0 | 76.0 | 691.0 | 971.0 | 263.5 | 309.0 | 23.0 | 75.0 | 42.0 | 351.0 | 6:42 |
| 640 | Healthy | Spain | Female | 69 | 1708.0 | 8892.5 | 59.5 | 705.0 | 934.0 | 225.0 | 248.0 | 18.0 | 38.0 | 20.0 | 273.0 | 7:48 |
| 617 | Healthy | Spain | Female | 69 | 1639.0 | 8545.0 | 70.0 | 691.0 | 873.5 | 180.0 | 207.0 | 22.0 | 56.0 | 33.0 | 239.0 | 8:18 |
| 628 | Healthy | Spain | Female | 70 | 1833.0 | 8876.0 | 57.0 | 583.0 | 821.0 | 235.0 | 310.5 | 70.0 | 126.0 | 40.0 | 362.0 | 8:18 |
| 638 | Healthy | Spain | Female | 71 | 1896.0 | 7907.5 | 67.0 | 728.5 | 976.0 | 248.0 | 274.0 | 21.0 | 47.0 | 18.0 | 284.0 | 7:06 |
| 648 | Healthy | Spain | Female | 72 | 1425.0 | 6235.0 | 66.0 | 778.0 | 992.0 | 226.5 | 244.5 | 13.0 | 24.5 | 8.0 | 251.5 | 7:18 |
| 649 | Healthy | Spain | Female | 72 | 1854.0 | 7520.0 | ||||||||||
| 795 | Healthy | Spain | Female | 72 | 1396.0 | 5664.0 | 58.0 | 764.0 | 1039.0 | 265.5 | 300.0 | 26.0 | 48.0 | 17.0 | 316.0 | 6:18 |
| 630 | Healthy | Spain | Female | 74 | 1320.0 | 6577.0 | 57.0 | 825.0 | 1008.0 | 147.0 | 163.5 | 6.5 | 17.5 | 9.5 | 171.0 | 6:54 |
| 790 | Healthy | Spain | Male | 66 | 2686.0 | 14123.5 | 60.0 | 1106.0 | 1298.0 | 205.0 | 233.0 | 23.0 | 79.0 | 52.0 | 304.0 | 3:30 |
| 793 | Healthy | Spain | Male | 68 | 2536.0 | 8879.0 | 64.0 | 791.5 | 1086.5 | 291.0 | 328.0 | 35.5 | 59.0 | 25.0 | 367.0 | 4:48 |
| 796 | Healthy | Spain | Male | 74 | 2347.0 | 13989.0 | 61.0 | 1113.0 | 1292.5 | 175.0 | 210.5 | 29.0 | 97.0 | 71.5 | 288.5 | 8:06 |
| 502 | Diseased | Hungary | Female | 63 | 1230.0 | 2171.0 | 75.0 | 1327.5 | 1424.5 | 96.0 | 155.0 | 11.0 | 14.0 | 3.0 | 166.0 | 1:36 |
| 169 | Diseased | Hungary | Female | 69 | 2000.5 | 7659.0 | 54.0 | 836.5 | 994.0 | 199.0 | 248.0 | 24.0 | 56.0 | 22.0 | 284.5 | 7:06 |
| 132 | Diseased | Hungary | Male | 71 | 3036.0 | 11136.0 | 51.0 | 605.5 | 807.0 | 193.0 | 231.0 | 32.0 | 127.0 | 96.0 | 335.0 | 8:24 |
| 800 | Diseased | Spain | Female | 65 | 1643.0 | 9030.0 | 77.5 | 739.0 | 989.5 | 244.0 | 284.0 | 21.0 | 43.0 | 19.0 | 308.0 | 7:00 |
| 641 | Diseased | Spain | Female | 71 | 1676.0 | 10216.0 | 65.0 | 718.0 | 965.5 | 223.5 | 274.0 | 33.0 | 69.0 | 31.0 | 308.0 | 7:06 |
| 624 | Diseased | Spain | Female | 72 | 1979.0 | 5292.0 | 63.0 | 730.0 | 970.0 | 257.0 | 279.5 | 13.0 | 21.0 | 7.0 | 287.0 | 7:42 |
| 644 | Diseased | Spain | Male | 70 | 2566.0 | 7903.5 | 61.0 | 781.0 | 952.0 | 177.0 | 197.0 | 11.0 | 40.0 | 27.0 | 231.0 | 7:30 |
| 625 | Diseased | Spain | Male | 72 | 2197.0 | 10394.5 | 53.0 | 589.0 | 876.0 | 291.0 | 320.0 | 20.0 | 45.0 | 22.0 | 351.0 | 8:30 |
| 634 | Diseased | Spain | Male | 72 | 3121.0 | 12832.5 | 61.0 | 794.5 | 1060.0 | 232.5 | 310.0 | 54.0 | 141.0 | 77.0 | 393.0 | 4:24 |
| 791 | Diseased | Spain | Male | 72 | 2397.5 | 4012.0 | 62.0 | 789.0 | 986.0 | 185.0 | 199.0 | 7.5 | 12.5 | 5.0 | 204.5 | 7:36 |
| 799 | Diseased | Spain | Male | 79 | 1682.0 | 4268.0 | 49.0 | 878.0 | 960.0 | 140.0 | 187.5 | 7.5 | 13.0 | 7.0 | 193.0 | 8:00 |
| Median: Healthy | 1833.0 | 8835.0 | 60.5 | 739.2 | 973.5 | 230.7 | 256.0 | 21.5 | 48.5 | 23.5 | 288.7 | 7:30 | ||||
| Median: Diseased | 2000.5 | 7903.5 | 61.0 | 781.0 | 970.0 | 199.0 | 248.0 | 20.0 | 43.0 | 22.0 | 287.0 | 7:24 | ||||
| Median: Spain | 1833.0 | 8876.0 | 61.0 | 751.5 | 973.5 | 229.5 | 274.0 | 21.5 | 47.5 | 21.0 | 296.2 | 7:24 | ||||
| Median: Hungary | 2046.0 | 7659.0 | 56.0 | 750.0 | 945.0 | 193.0 | 231.0 | 15.0 | 46.0 | 23.0 | 284.5 | 7:36 | ||||
| Median: Female | 1733.0 | 8545.0 | 64.0 | 729.2 | 970.5 | 235.0 | 270.0 | 21.0 | 46.5 | 19.5 | 288.0 | 7:12 | ||||
| Median: Male | 2516.0 | 8879.0 | 60.0 | 791.5 | 986.0 | 185.0 | 210.5 | 20.0 | 51.5 | 27.0 | 288.5 | 7:30 | ||||
| Median: All | 1875.0 | 8690.0 | 61.0 | 750.0 | 971.0 | 225.0 | 248.0 | 21.0 | 47.0 | 22.0 | 288.5 | 7:24 | ||||
| Mean: Healthy | 1947.0 | 8275.3 | 61.3 | 801.8 | 1000.8 | 219.3 | 252.0 | 21.8 | 50.8 | 25.6 | 281.5 | 7:06 | ||||
| Mean: Diseased | 2138.9 | 7719.5 | 61.0 | 798.9 | 998.5 | 203.4 | 244.0 | 21.2 | 52.8 | 28.7 | 278.2 | 6:48 | ||||
| Mean: Spain | 1976.8 | 8588.0 | 62.2 | 769.8 | 999.3 | 226.6 | 262.0 | 24.3 | 55.0 | 27.3 | 293.3 | 7:00 | ||||
| Mean: Hungary | 2081.9 | 7122.5 | 59.4 | 857.0 | 1001.3 | 190.1 | 225.9 | 16.7 | 45.2 | 25.6 | 256.8 | 6:54 | ||||
| Mean: Female | 1695.2 | 7682.5 | 64.0 | 781.8 | 981.6 | 222.0 | 258.6 | 21.8 | 46.1 | 20.1 | 281.6 | 7:06 | ||||
| Mean: Male | 2477.3 | 8671.4 | 57.3 | 827.1 | 1025.5 | 202.2 | 236.1 | 21.2 | 59.0 | 35.7 | 278.6 | 6:42 | ||||
| Mean: All | 2012.9 | 8084.2 | 61.2 | 800.8 | 1000.0 | 213.7 | 249.2 | 21.6 | 51.5 | 26.7 | 280.3 | 7:00 | ||||
| SD: Healthy | 423.2 | 3171.9 | 5.8 | 195.5 | 126.4 | 59.8 | 61.2 | 13.8 | 27.7 | 16.5 | 69.1 | 1:24 | ||||
| SD: Diseased | 569.0 | 3237.4 | 8.7 | 186.8 | 148.5 | 52.3 | 51.7 | 13.4 | 42.2 | 28.9 | 68.1 | 1:54 | ||||
| SD: Spain | 462.0 | 2735.1 | 6.7 | 135.3 | 115.4 | 47.6 | 53.6 | 15.2 | 34.1 | 19.9 | 62.4 | 1:18 | ||||
| SD: Hungary | 524.4 | 3768.4 | 7.1 | 257.4 | 164.0 | 66.6 | 58.9 | 8.4 | 31.6 | 24.8 | 73.3 | 2:00 | ||||
| SD: Female | 246.3 | 2204.8 | 6.9 | 196.6 | 119.0 | 54.1 | 52.0 | 13.9 | 25.8 | 11.0 | 59.4 | 1:30 | ||||
| SD: Male | 363.2 | 4196.1 | 4.9 | 183.5 | 150.1 | 60.7 | 63.4 | 13.4 | 40.8 | 28.7 | 79.8 | 1:42 | ||||
| SD: All | 486.9 | 3205.5 | 7.0 | 192.5 | 134.7 | 57.8 | 58.2 | 13.7 | 33.6 | 21.8 | 68.8 | 1:36 | ||||
Color coding: from orange (worse outcome relative to others) to yellow to green (better outcome). Participant 649 only provided energy and steps.

Figure A17.
Median values of TechROs (Fitbit) across the entire monitoring period: light+fair duration, fair duration, fair+vigorous duration, vigorous duration, active duration, sleep duration (2 of 2).
Energy Expenditure (Raw Family)
For the energy expenditure Fitbit behavioural marker, participants spent a mean ± SD energy of 2013 ± 487 kcal. 50% participants spent 1896 kcal. or more per day. Table A12 illustrates these results.
Participants with disease consumed 100–200 kcal. more than healthy participants per day, with medians (means) of 2000 and 1825 (2139 and 1951). We observed a similar difference between the participants from Hungary and Spain (difference of means 213 kcal). Men consumed more calories than women, with respective medians (means) of 2516 and 1720 (2477 and 1686), but also with higher variation, with male SD 363 kcal. vs. female 250 kcal.
Steps (Raw Family)
For the steps Fitbit behavioural marker, participants were active: they performed a median (mean ± SD) of 8690 (8084 ± 3205) measured steps per day. Table A12 illustrates these results.
Healthy participants performed on average 556 more steps than participants with disease, and with a median difference of 932 steps. Healthy and diseased participants had comparable variabilities in the step counts. Participants from Spain performed on average 1217 more steps than participants from Hungary and the devices measured more consistency. Men performed 1992 more steps on average than women. However, the 50% step counts are similar, partly due to four males who performed more than 12.000 median steps per day.
Heart Rate (Raw Family)
For the heart rate behavioural marker measured by Fitbit, the median and (mean ± SD) were 61 (61 ± 7) beats per minute. Table A12 illustrates these results.
Both healthy and diseased participants reported similar heart rate means and medians. Devices owned by participants with disease reported higher variability between daily measures than healthy participants with 8.77 bpm. and 5.81 bpm., respectively. Hungarian participant devices reported a lower median at 56 compared to 61 bpm. On average, men had 3 bpm. less than women.
Sedentary Duration (Processed Family)
For the behavioural marker of sedentary duration, the participants recorded 801 ± 192 mean minutes per day. Table A12 illustrates these results.
Participants with disease report more sedentary time than healthy participants, with means of 781 and 739 min, respectively. Participants from Hungary report 88 min more sedentary duration on average with 857 compared to 769; however, they report similar medians. Men also report 242 min. more sedentary time than women, with medians 971 and 729 min, respectively.
Light Intensity Physical Activity Duration (Processed Family)
For the duration of physical activity at a light intensity as reported by Fitbit, all participants spend on average 213 ± 57 min per day. Table A12 illustrates these results.
Healthy participants report approximately 20 min more per day with a median (mean) of 230 (219) compared to 199 (203). Participants from Spain also report 30 min more with 229 median min for Spain compared to 193 median min for Hungary. Females are more active in the light intensity spectrum by 20 min than males.
Fair Intensity Physical Activity Duration (Processed Family)
For the duration of physical activity at a fair intensity as reported by Fitbit, all participants spend on average 21 ± 13 min per day. Table A12 illustrates these results.
Regardless of their grouping criteria of health status, country, or gender, participants consistently report means and medians in the 16–22 min for the fair intensity physical activity.
Vigorous Intensity Physical Activity Duration (Processed Family)
For the duration of physical activity at a vigorous intensity as reported by Fitbit, all participants spend on average 26 ± 21 min. per day. Table A12 illustrates these results.
Regardless of their grouping criteria of health status or country, participants consistently report means and medians in the 19–28 min for the vigorous-intensity physical activity. Men may perform vigorous physical activity for 10–15 min more than women, as observed in their respective medians (means) of 27 (35) and 19 (20), but also with more variability as their standard deviation is 28 compared to 11.
Sleep Duration (Processed Family)
For the sleep duration, participants sleep on average 7 ± 1.6 h and 50% of the participants sleep 7 h and 30 min. Table A12 illustrates these results.
The healthy participants sleep on average 18 min more than those with mild disease.
Appendix C.2. Inferential Analysis (PROs vs. TechROs)
We depict the significant correlations between PROs and TechROs for the questionnaires assessing physical activity (Table A13), social support (Table A14), depression and anxiety (Table A15), Mediterranean nutrition (Table A16), nutrition (Table A17), memory (Table A18), sleep (Table A19), and health-related Quality of Life (Table A20). In all tables of this part, we highlight the significant correlations at ≥ 0.5.
Table A13.
Correlation coefficient (Spearman ) between TechROs from Fitbit (rows) and PROs of Physical Activity on the IPAQ scale (columns).
Table A13.
Correlation coefficient (Spearman ) between TechROs from Fitbit (rows) and PROs of Physical Activity on the IPAQ scale (columns).
| PRO | Work walking activity | Work Moderate Activity | Work Vigorous Activity | Work Total Activity | Transport Walking Activity | Transport Bicycle Activity | Transport Total Activity | Domestic Moderate Activity | Garden Moderate Activity | Garden Vigorous Activity | Domestic+Garden Total Activity | Leisure Walking Activity | Leisure Moderate Activity | Leisure Vigorous Activity | Leisure Total Activity | ||||||||||||||||||||||||||||||||
|---|---|---|---|---|---|---|---|---|---|---|---|---|---|---|---|---|---|---|---|---|---|---|---|---|---|---|---|---|---|---|---|---|---|---|---|---|---|---|---|---|---|---|---|---|---|---|---|
| Family | TechRO | Health | Both | Healthy | Diseased | Both | Healthy | Diseased | Both | Healthy | Diseased | Both | Healthy | Diseased | Both | Healthy | Diseased | Both | Healthy | Diseased | Both | Healthy | Diseased | Both | Healthy | Diseased | Both | Healthy | Diseased | Both | Healthy | Diseased | Both | Healthy | Diseased | Both | Healthy | Diseased | Both | Healthy | Diseased | Both | Healthy | Diseased | Both | Healthy | Diseased |
| Raw | Energy | ||||||||||||||||||||||||||||||||||||||||||||||
| Steps | |||||||||||||||||||||||||||||||||||||||||||||||
| Heart rate | |||||||||||||||||||||||||||||||||||||||||||||||
| Processed | Sedentary | ||||||||||||||||||||||||||||||||||||||||||||||
| Sedentary+light | |||||||||||||||||||||||||||||||||||||||||||||||
| Light | |||||||||||||||||||||||||||||||||||||||||||||||
| Light+fair | |||||||||||||||||||||||||||||||||||||||||||||||
| Fair | |||||||||||||||||||||||||||||||||||||||||||||||
| Fair+vigorous | |||||||||||||||||||||||||||||||||||||||||||||||
| Vigorous | |||||||||||||||||||||||||||||||||||||||||||||||
| Active | |||||||||||||||||||||||||||||||||||||||||||||||
| Sleep | |||||||||||||||||||||||||||||||||||||||||||||||
| CLR PA | Sedentary | ||||||||||||||||||||||||||||||||||||||||||||||
| Light | |||||||||||||||||||||||||||||||||||||||||||||||
| Fair | |||||||||||||||||||||||||||||||||||||||||||||||
| Vigorous | |||||||||||||||||||||||||||||||||||||||||||||||
| CLR PA+S | Sedentary | ||||||||||||||||||||||||||||||||||||||||||||||
| Light | |||||||||||||||||||||||||||||||||||||||||||||||
| Fair | |||||||||||||||||||||||||||||||||||||||||||||||
| Vigorous | |||||||||||||||||||||||||||||||||||||||||||||||
| Sleep | |||||||||||||||||||||||||||||||||||||||||||||||
| Raw | Total | 1 | 1 | 2 | 1 | 2 | 2 | 1 | 1 | 1 | 2 | 1 | 2 | 2 | 2 | 2 | 2 | 2 | 1 | 1 | 2 | 2 | 1 | 2 | 1 | 2 | 1 | 2 | |||||||||||||||||||
| Processed | Total | 2 | 2 | 2 | 5 | 2 | 3 | 5 | 1 | 2 | 2 | 1 | 5 | 1 | 1 | 4 | 2 | 4 | 4 | 4 | 2 | 4 | 6 | 1 | 2 | 6 | 3 | 4 | 1 | 3 | 4 | 3 | 3 | 3 | 4 | 1 | 6 | 2 | 4 | 4 | |||||||
| CLR PA | Total | 1 | 2 | 3 | 1 | 2 | 1 | 1 | 3 | 3 | 1 | 2 | 1 | 1 | 1 | 2 | 1 | 2 | 2 | 2 | 3 | 2 | 4 | 1 | 1 | 3 | 2 | 1 | 1 | 2 | 2 | 2 | 2 | ||||||||||||||
| CLR PA+S | Total | 3 | 2 | 1 | 1 | 2 | 2 | 1 | 2 | 2 | 2 | 3 | 3 | 2 | 2 | 3 | 3 | 1 | 2 | 2 | 2 | 1 | 2 | 3 | 2 | 3 | 1 | 1 | 1 | 1 | 1 | 2 | 2 | 1 | |||||||||||||
| All Families | Total | 5 | 7 | 8 | 3 | 6 | 10 | 6 | 9 | 11 | 4 | 8 | 8 | 4 | 9 | 6 | 4 | 7 | 5 | 6 | 2 | 8 | 11 | 6 | 7 | 10 | 4 | 3 | 7 | 12 | 8 | 7 | 5 | 4 | 4 | 5 | 7 | 7 | 5 | 1 | 1 | 12 | 5 | 4 | 9 | ||
Color coding: from orange (weaker correlation/fewer total correlations) to yellow to green (stronger correlation/more total correlations). Only significant correlations are shown. Only coefficients of 0.5 or above are highlighted.
Table A14.
Correlation coefficient (Spearman ) between TechROs from Fitbit (rows) and PROs of Social Support on the MSPSS scale (columns).
Table A14.
Correlation coefficient (Spearman ) between TechROs from Fitbit (rows) and PROs of Social Support on the MSPSS scale (columns).
| PRO | Q1: Special person: around when in need | Q2: Special person: share joys and sorrows | Q3: Family: tries to help | Q4: Family: gives emotional help and support | Q5: Special person: real source of comfort | Q6: Friends: try to help | Q7: Friends: counted on when things go wrong | Q8: Family: talk about problems | Q9: Friends: share my joys and sorrows | Q10: Special person: cares about feelings | Q11: Family: willing to help make decisions | Q12: Friends: talk about problems | Significant other numeric sub-score | Family numeric sub-score | Friends numeric sub-score | Categorical score | Numeric score | ||||||||||||||||||||||||||||||||||||
|---|---|---|---|---|---|---|---|---|---|---|---|---|---|---|---|---|---|---|---|---|---|---|---|---|---|---|---|---|---|---|---|---|---|---|---|---|---|---|---|---|---|---|---|---|---|---|---|---|---|---|---|---|---|
| Family | TechRO | Health | Both | Healthy | Diseased | Both | Healthy | Diseased | Both | Healthy | Diseased | Both | Healthy | Diseased | Both | Healthy | Diseased | Both | Healthy | Diseased | Both | Healthy | Diseased | Both | Healthy | Diseased | Both | Healthy | Diseased | Both | Healthy | Diseased | Both | Healthy | Diseased | Both | Healthy | Diseased | Both | Healthy | Diseased | Both | Healthy | Diseased | Both | Healthy | Diseased | Both | Healthy | Diseased | Both | Healthy | Diseased |
| Raw | Energy | ||||||||||||||||||||||||||||||||||||||||||||||||||||
| Steps | |||||||||||||||||||||||||||||||||||||||||||||||||||||
| Heart rate | |||||||||||||||||||||||||||||||||||||||||||||||||||||
| Processed | Sedentary | ||||||||||||||||||||||||||||||||||||||||||||||||||||
| Sedentary+light | |||||||||||||||||||||||||||||||||||||||||||||||||||||
| Light | |||||||||||||||||||||||||||||||||||||||||||||||||||||
| Light+fair | |||||||||||||||||||||||||||||||||||||||||||||||||||||
| Fair | |||||||||||||||||||||||||||||||||||||||||||||||||||||
| Fair+vigorous | |||||||||||||||||||||||||||||||||||||||||||||||||||||
| Vigorous | |||||||||||||||||||||||||||||||||||||||||||||||||||||
| Active | |||||||||||||||||||||||||||||||||||||||||||||||||||||
| Sleep | |||||||||||||||||||||||||||||||||||||||||||||||||||||
| CLR PA | Sedentary | ||||||||||||||||||||||||||||||||||||||||||||||||||||
| Light | |||||||||||||||||||||||||||||||||||||||||||||||||||||
| Fair | |||||||||||||||||||||||||||||||||||||||||||||||||||||
| Vigorous | |||||||||||||||||||||||||||||||||||||||||||||||||||||
| CLR PA+S | Sedentary | ||||||||||||||||||||||||||||||||||||||||||||||||||||
| Light | |||||||||||||||||||||||||||||||||||||||||||||||||||||
| Fair | |||||||||||||||||||||||||||||||||||||||||||||||||||||
| Vigorous | |||||||||||||||||||||||||||||||||||||||||||||||||||||
| Sleep | |||||||||||||||||||||||||||||||||||||||||||||||||||||
| Raw | Total | 1 | 1 | 1 | 1 | 1 | 1 | 1 | 1 | 1 | 1 | 1 | 1 | 1 | 1 | 1 | 1 | 1 | 1 | 1 | 1 | 1 | 1 | 1 | |||||||||||||||||||||||||||||
| Processed | Total | 2 | 5 | 4 | 2 | 6 | 5 | 3 | 6 | 2 | 2 | 4 | 2 | 4 | 6 | 2 | 4 | 7 | 3 | 3 | 6 | 3 | 4 | 5 | 2 | 6 | 2 | 2 | 7 | 3 | 5 | 6 | 1 | 2 | 7 | 2 | 2 | 7 | 4 | 4 | 7 | 3 | 6 | 2 | 4 | 7 | 1 | 4 | 7 | 4 | |||
| CLR PA | Total | 1 | 1 | 1 | 1 | 1 | 3 | 1 | 1 | 2 | 2 | 1 | 1 | 3 | 1 | 1 | 2 | 2 | 1 | 1 | 1 | 2 | 1 | 1 | 2 | 2 | 1 | 1 | 1 | 1 | 3 | 2 | 2 | 1 | 1 | 2 | 2 | ||||||||||||||||
| CLR PA+S | Total | 1 | 3 | 1 | 2 | 3 | 2 | 4 | 1 | 1 | 1 | 2 | 2 | 1 | 4 | 3 | 3 | 3 | 4 | 1 | 4 | 1 | 3 | 4 | 2 | 2 | 2 | 2 | 3 | 3 | 1 | 1 | 3 | 1 | 3 | 1 | 1 | 2 | 2 | 1 | 3 | 1 | |||||||||||
| All Families | Total | 4 | 9 | 5 | 5 | 10 | 6 | 7 | 14 | 3 | 3 | 6 | 2 | 7 | 9 | 3 | 5 | 14 | 4 | 9 | 11 | 5 | 10 | 10 | 1 | 5 | 13 | 5 | 6 | 12 | 5 | 10 | 10 | 2 | 6 | 13 | 3 | 3 | 10 | 6 | 6 | 11 | 1 | 8 | 12 | 4 | 7 | 11 | 4 | 8 | 13 | 5 | |
Color coding: from orange (weaker correlation/fewer total correlations) to yellow to green (stronger correlation/more total correlations). Only significant correlations are shown. Only coefficients of 0.5 or above are highlighted.
Table A15.
Correlation coefficient (Spearman ) between TechROs from Fitbit (rows) and PROs of Depression and Anxiety on the GADS scale (columns).
Table A15.
Correlation coefficient (Spearman ) between TechROs from Fitbit (rows) and PROs of Depression and Anxiety on the GADS scale (columns).
| PRO | Q1A: Keyed-up or on edge | Q2A: Worrying a lot? | Q3A: Irritable? | Q4A: Difficulty relaxing? | Q5A: Sleeping poorly? | Q6A: Headaches or neck aches? | Q7A: Trembling [...] urine? | Q8A: Worried about your health? | Q9A: Difficulty falling asleep? | Q1D: Lacking energy? | Q2D: Lost interest in things? | Q3D: Lost confidence in yourself? | Q4D: Hopeless? | Q5D: Difficulty concentrating? | Q6D: Lost weight due to poor appetite? | Q7D: Waking early? | Q8D: Slowed down? | Q9D: Worse in the mornings? | Numeric score | Categorical score | ||||||||||||||||||||||||||||||||||||||||||
|---|---|---|---|---|---|---|---|---|---|---|---|---|---|---|---|---|---|---|---|---|---|---|---|---|---|---|---|---|---|---|---|---|---|---|---|---|---|---|---|---|---|---|---|---|---|---|---|---|---|---|---|---|---|---|---|---|---|---|---|---|---|---|
| Family | TechRO | Health | Both | Healthy | Diseased | Both | Healthy | Diseased | Both | Healthy | Diseased | Both | Healthy | Diseased | Both | Healthy | Diseased | Both | Healthy | Diseased | Both | Healthy | Diseased | Both | Healthy | Diseased | Both | Healthy | Diseased | Both | Healthy | Diseased | Both | Healthy | Diseased | Both | Healthy | Diseased | Both | Healthy | Diseased | Both | Healthy | Diseased | Both | Healthy | Diseased | Both | Healthy | Diseased | Both | Healthy | Diseased | Both | Healthy | Diseased | Both | Healthy | Diseased | Both | Healthy | Diseased |
| Raw | Energy | |||||||||||||||||||||||||||||||||||||||||||||||||||||||||||||
| Steps | ||||||||||||||||||||||||||||||||||||||||||||||||||||||||||||||
| Heart rate | ||||||||||||||||||||||||||||||||||||||||||||||||||||||||||||||
| Processed | Sedentary | |||||||||||||||||||||||||||||||||||||||||||||||||||||||||||||
| Sedentary+light | ||||||||||||||||||||||||||||||||||||||||||||||||||||||||||||||
| Light | ||||||||||||||||||||||||||||||||||||||||||||||||||||||||||||||
| Light+fair | ||||||||||||||||||||||||||||||||||||||||||||||||||||||||||||||
| Fair | ||||||||||||||||||||||||||||||||||||||||||||||||||||||||||||||
| Fair+vigorous | ||||||||||||||||||||||||||||||||||||||||||||||||||||||||||||||
| Vigorous | ||||||||||||||||||||||||||||||||||||||||||||||||||||||||||||||
| Active | ||||||||||||||||||||||||||||||||||||||||||||||||||||||||||||||
| Sleep | ||||||||||||||||||||||||||||||||||||||||||||||||||||||||||||||
| CLR PA | Sedentary | |||||||||||||||||||||||||||||||||||||||||||||||||||||||||||||
| Light | ||||||||||||||||||||||||||||||||||||||||||||||||||||||||||||||
| Fair | ||||||||||||||||||||||||||||||||||||||||||||||||||||||||||||||
| Vigorous | ||||||||||||||||||||||||||||||||||||||||||||||||||||||||||||||
| CLR PA+S | Sedentary | |||||||||||||||||||||||||||||||||||||||||||||||||||||||||||||
| Light | ||||||||||||||||||||||||||||||||||||||||||||||||||||||||||||||
| Fair | ||||||||||||||||||||||||||||||||||||||||||||||||||||||||||||||
| Vigorous | ||||||||||||||||||||||||||||||||||||||||||||||||||||||||||||||
| Sleep | ||||||||||||||||||||||||||||||||||||||||||||||||||||||||||||||
| Raw | Total | 1 | 1 | 2 | 2 | 1 | 1 | 2 | 1 | 2 | 1 | 1 | 2 | 2 | 2 | 1 | 1 | 1 | 1 | 3 | 1 | 1 | 1 | |||||||||||||||||||||||||||||||||||||||
| Processed | Total | 6 | 1 | 4 | 2 | 2 | 3 | 2 | 1 | 2 | 1 | 4 | 1 | 5 | 1 | 4 | 2 | 2 | 3 | 3 | 3 | 4 | 1 | 3 | 6 | 1 | 2 | 2 | 1 | 1 | 2 | 2 | 5 | 2 | 1 | 2 | 4 | 4 | 1 | 3 | 1 | 1 | 2 | 2 | 2 | |||||||||||||||||
| CLR PA | Total | 1 | 1 | 2 | 1 | 1 | 2 | 1 | 1 | 1 | 1 | 2 | 1 | 4 | 1 | 1 | 4 | 1 | 1 | 3 | 2 | 1 | 3 | 1 | 1 | 1 | 1 | 1 | 1 | 3 | 3 | 1 | 2 | 1 | 1 | 1 | 1 | 2 | 1 | |||||||||||||||||||||||
| CLR PA+S | Total | 2 | 1 | 1 | 1 | 1 | 2 | 3 | 2 | 1 | 2 | 1 | 4 | 3 | 1 | 1 | 1 | 1 | 1 | 2 | 1 | 2 | 2 | 2 | 1 | 4 | 2 | 1 | 3 | 2 | 2 | 3 | 2 | 1 | 3 | 3 | 4 | 2 | 2 | 2 | 1 | 3 | 4 | 4 | 4 | 4 | 3 | 2 | ||||||||||||||
| All Families | Total | 3 | 1 | 2 | 1 | 2 | 11 | 4 | 7 | 6 | 4 | 8 | 4 | 6 | 6 | 3 | 2 | 7 | 4 | 7 | 4 | 10 | 4 | 4 | 8 | 7 | 7 | 10 | 8 | 3 | 5 | 12 | 3 | 5 | 5 | 2 | 5 | 4 | 5 | 4 | 4 | 1 | 12 | 7 | 3 | 2 | 1 | 3 | 7 | 8 | 3 | 6 | 8 | 2 | 6 | 8 | 1 | 5 | 5 | 1 | ||
Color coding: from orange (weaker correlation/fewer total correlations) to yellow to green (stronger correlation/more total correlations). Only significant correlations are shown. Only coefficients of 0.5 or above are highlighted.
Table A16.
Correlation coefficient (Spearman ) between TechROs from Fitbit (rows) and PROs of Mediterranean Nutrition on the PREDIMED scale (columns).
Table A16.
Correlation coefficient (Spearman ) between TechROs from Fitbit (rows) and PROs of Mediterranean Nutrition on the PREDIMED scale (columns).
| PRO | Q2: Olive oil use | Q3: Vegetables use | Q4: Fruits use | Q5: Red meat, hamburger, or meat use | Q6: Butter, margarine, or cream use | Q7: Sweet/carbonated beverage use | Q8: Wine use | Q9: Legumes use | Q10: Fish or shellfish use | Q11: Commercial sweets or pastries | Q12: Nuts use | Q14: Sofrito use | Numeric score | Categorical score | ||||||||||||||||||||||||||||||
|---|---|---|---|---|---|---|---|---|---|---|---|---|---|---|---|---|---|---|---|---|---|---|---|---|---|---|---|---|---|---|---|---|---|---|---|---|---|---|---|---|---|---|---|---|
| Family | TechRO | Health | Both | Healthy | Diseased | Both | Healthy | Diseased | Both | Healthy | Diseased | Both | Healthy | Diseased | Both | Healthy | Diseased | Both | Healthy | Diseased | Both | Healthy | Diseased | Both | Healthy | Diseased | Both | Healthy | Diseased | Both | Healthy | Diseased | Both | Healthy | Diseased | Both | Healthy | Diseased | Both | Healthy | Diseased | Both | Healthy | Diseased |
| Raw | Energy | |||||||||||||||||||||||||||||||||||||||||||
| Steps | ||||||||||||||||||||||||||||||||||||||||||||
| Heart rate | ||||||||||||||||||||||||||||||||||||||||||||
| Processed | Sedentary | |||||||||||||||||||||||||||||||||||||||||||
| Sedentary+light | ||||||||||||||||||||||||||||||||||||||||||||
| Light | ||||||||||||||||||||||||||||||||||||||||||||
| Light+fair | ||||||||||||||||||||||||||||||||||||||||||||
| Fair | ||||||||||||||||||||||||||||||||||||||||||||
| Fair+vigorous | ||||||||||||||||||||||||||||||||||||||||||||
| Vigorous | ||||||||||||||||||||||||||||||||||||||||||||
| Active | ||||||||||||||||||||||||||||||||||||||||||||
| Sleep | ||||||||||||||||||||||||||||||||||||||||||||
| CLR PA | Sedentary | |||||||||||||||||||||||||||||||||||||||||||
| Light | ||||||||||||||||||||||||||||||||||||||||||||
| Fair | ||||||||||||||||||||||||||||||||||||||||||||
| Vigorous | ||||||||||||||||||||||||||||||||||||||||||||
| CLR PA+S | Sedentary | |||||||||||||||||||||||||||||||||||||||||||
| Light | ||||||||||||||||||||||||||||||||||||||||||||
| Fair | ||||||||||||||||||||||||||||||||||||||||||||
| Vigorous | ||||||||||||||||||||||||||||||||||||||||||||
| Sleep | ||||||||||||||||||||||||||||||||||||||||||||
| Raw | Total | 1 | 1 | 1 | 1 | 1 | 1 | 1 | 2 | 1 | 1 | 2 | 1 | |||||||||||||||||||||||||||||||
| Processed | Total | 1 | 1 | 2 | 2 | 3 | 1 | 3 | 1 | 2 | 3 | 2 | 3 | 1 | 2 | 2 | 1 | 3 | 2 | 4 | 2 | |||||||||||||||||||||||
| CLR PA | Total | 1 | 1 | 1 | 1 | 2 | 1 | 1 | 1 | 1 | 1 | 1 | 1 | 1 | 3 | 1 | 1 | 1 | 4 | 1 | 3 | 2 | ||||||||||||||||||||||
| CLR PA+S | Total | 1 | 2 | 1 | 1 | 2 | 1 | 2 | 1 | 1 | 1 | 2 | 1 | 2 | 1 | 4 | 1 | 3 | 2 | 1 | 5 | 3 | 1 | 1 | 1 | 2 | ||||||||||||||||||
| All Families | Total | 2 | 4 | 3 | 4 | 5 | 7 | 4 | 5 | 1 | 4 | 2 | 2 | 4 | 5 | 4 | 3 | 2 | 1 | 5 | 2 | 6 | 1 | 7 | 3 | 7 | 5 | 9 | 4 | 10 | 6 | 1 | ||||||||||||
Color coding: from orange (weaker correlation/fewer total correlations) to yellow to green (stronger correlation/more total correlations). Only significant correlations are shown. Only coefficients of 0.5 or above are highlighted.
Table A17.
Correlation coefficient (Spearman ) between TechROs from Fitbit (rows) and PROs of Nutrition on the SelfMNA scale (columns).
Table A17.
Correlation coefficient (Spearman ) between TechROs from Fitbit (rows) and PROs of Nutrition on the SelfMNA scale (columns).
| PRO | Q1: Food Intake Declined | Q2: Weight Lost | Q4: Stressed or Severely Ill | Q5: Dementia and/or Severe Sadness | Numeric Score | Categorical Score | ||||||||||||||
|---|---|---|---|---|---|---|---|---|---|---|---|---|---|---|---|---|---|---|---|---|
| Family | TechRO | Health | Both | Healthy | Diseased | Both | Healthy | Diseased | Both | Healthy | Diseased | Both | Healthy | Diseased | Both | Healthy | Diseased | Both | Healthy | Diseased |
| Raw | Energy | |||||||||||||||||||
| Steps | ||||||||||||||||||||
| Heart rate | ||||||||||||||||||||
| Processed | Sedentary | |||||||||||||||||||
| Sedentary+light | ||||||||||||||||||||
| Light | ||||||||||||||||||||
| Light+fair | ||||||||||||||||||||
| Fair | ||||||||||||||||||||
| Fair+vigorous | ||||||||||||||||||||
| Vigorous | ||||||||||||||||||||
| Active | ||||||||||||||||||||
| Sleep | ||||||||||||||||||||
| CLR PA | Sedentary | |||||||||||||||||||
| Light | ||||||||||||||||||||
| Fair | ||||||||||||||||||||
| Vigorous | ||||||||||||||||||||
| CLR PA+S | Sedentary | |||||||||||||||||||
| Light | ||||||||||||||||||||
| Fair | ||||||||||||||||||||
| Vigorous | ||||||||||||||||||||
| Sleep | ||||||||||||||||||||
| Raw | Total | 1 | 1 | |||||||||||||||||
| Processed | Total | 2 | 3 | 3 | 2 | 1 | ||||||||||||||
| CLR PA | Total | 1 | 1 | 2 | 2 | 2 | ||||||||||||||
| CLR PA+S | Total | 2 | 2 | 1 | 1 | 2 | 2 | |||||||||||||
| All Families | Total | 6 | 7 | 4 | 3 | 6 | 5 | |||||||||||||
Color coding: from orange (weaker correlation/fewer total correlations) to yellow to green (stronger correlation/more total correlations). Only significant correlations are shown. Only coefficients of 0.5 or above are highlighted.
Table A18.
Correlation coefficient (Spearman ) between TechROs from Fitbit (rows) and PROs of Memory on the MFE scale (columns).
Table A18.
Correlation coefficient (Spearman ) between TechROs from Fitbit (rows) and PROs of Memory on the MFE scale (columns).
| PRO | Q1: Forgetting objects put | Q2: Failing to recognise places | Q3: Finding a television story difficult | Q4: Not remembering a change in daily routine | Q5: Checking whether something was done | Q6: Forgetting the time of events | Q7: Completely forgetting to take things | Q8: Being reminded about things | Q9: Reading anew something already read | Q10: Letting ramble about unimportant things | Q11: Failing to recognise close relatives or friends | Q12: Having difficulty picking up a new skill | Q13: Finding word is “on the tip of the tongue” | Q14: Forgetting to do planned things | Q15: Forgetting important details of done things | Q16: Forgetting the topic of an ongoing conversation | Q17: Failing to follow a story in a newspaper | Q18: Forgetting to tell somebody something important | Q20: Getting told details mixed up and confused | Q21: Telling someone a story or joke repeatedly | Q22: Forgetting details of things you do regularly | Q23: Finding famous faces unfamiliar | Q24: Forgetting where things are normally kept | Q25: Getting lost where you have OFTEN been before | Q26: Getting lost where you have been RARELY before | Q27: Doing some routine thing twice by mistake | Q28: Repeating to someone what you have just told them | Numeric score | Categorical score | ||||||||||||||||||||||||||||||||||||||||||||||||||||||||||||
|---|---|---|---|---|---|---|---|---|---|---|---|---|---|---|---|---|---|---|---|---|---|---|---|---|---|---|---|---|---|---|---|---|---|---|---|---|---|---|---|---|---|---|---|---|---|---|---|---|---|---|---|---|---|---|---|---|---|---|---|---|---|---|---|---|---|---|---|---|---|---|---|---|---|---|---|---|---|---|---|---|---|---|---|---|---|---|---|---|---|
| Family | TechRO | Health | Both | Healthy | Diseased | Both | Healthy | Diseased | Both | Healthy | Diseased | Both | Healthy | Diseased | Both | Healthy | Diseased | Both | Healthy | Diseased | Both | Healthy | Diseased | Both | Healthy | Diseased | Both | Healthy | Diseased | Both | Healthy | Diseased | Both | Healthy | Diseased | Both | Healthy | Diseased | Both | Healthy | Diseased | Both | Healthy | Diseased | Both | Healthy | Diseased | Both | Healthy | Diseased | Both | Healthy | Diseased | Both | Healthy | Diseased | Both | Healthy | Diseased | Both | Healthy | Diseased | Both | Healthy | Diseased | Both | Healthy | Diseased | Both | Healthy | Diseased | Both | Healthy | Diseased | Both | Healthy | Diseased | Both | Healthy | Diseased | Both | Healthy | Diseased | Both | Healthy | Diseased | Both | Healthy | Diseased |
| Raw | Energy | ||||||||||||||||||||||||||||||||||||||||||||||||||||||||||||||||||||||||||||||||||||||||
| Steps | |||||||||||||||||||||||||||||||||||||||||||||||||||||||||||||||||||||||||||||||||||||||||
| Heart rate | |||||||||||||||||||||||||||||||||||||||||||||||||||||||||||||||||||||||||||||||||||||||||
| Processed | Sedentary | ||||||||||||||||||||||||||||||||||||||||||||||||||||||||||||||||||||||||||||||||||||||||
| Sedentary+light | |||||||||||||||||||||||||||||||||||||||||||||||||||||||||||||||||||||||||||||||||||||||||
| Light | |||||||||||||||||||||||||||||||||||||||||||||||||||||||||||||||||||||||||||||||||||||||||
| Light+fair | |||||||||||||||||||||||||||||||||||||||||||||||||||||||||||||||||||||||||||||||||||||||||
| Fair | |||||||||||||||||||||||||||||||||||||||||||||||||||||||||||||||||||||||||||||||||||||||||
| Fair+vigorous | |||||||||||||||||||||||||||||||||||||||||||||||||||||||||||||||||||||||||||||||||||||||||
| Vigorous | |||||||||||||||||||||||||||||||||||||||||||||||||||||||||||||||||||||||||||||||||||||||||
| Active | |||||||||||||||||||||||||||||||||||||||||||||||||||||||||||||||||||||||||||||||||||||||||
| Sleep | |||||||||||||||||||||||||||||||||||||||||||||||||||||||||||||||||||||||||||||||||||||||||
| CLR PA | Sedentary | ||||||||||||||||||||||||||||||||||||||||||||||||||||||||||||||||||||||||||||||||||||||||
| Light | |||||||||||||||||||||||||||||||||||||||||||||||||||||||||||||||||||||||||||||||||||||||||
| Fair | |||||||||||||||||||||||||||||||||||||||||||||||||||||||||||||||||||||||||||||||||||||||||
| Vigorous | |||||||||||||||||||||||||||||||||||||||||||||||||||||||||||||||||||||||||||||||||||||||||
| CLR PA+S | Sedentary | ||||||||||||||||||||||||||||||||||||||||||||||||||||||||||||||||||||||||||||||||||||||||
| Light | |||||||||||||||||||||||||||||||||||||||||||||||||||||||||||||||||||||||||||||||||||||||||
| Fair | |||||||||||||||||||||||||||||||||||||||||||||||||||||||||||||||||||||||||||||||||||||||||
| Vigorous | |||||||||||||||||||||||||||||||||||||||||||||||||||||||||||||||||||||||||||||||||||||||||
| Sleep | |||||||||||||||||||||||||||||||||||||||||||||||||||||||||||||||||||||||||||||||||||||||||
| Raw | Total | 1 | 2 | 1 | 1 | 1 | 1 | 1 | 1 | 1 | 1 | 1 | 1 | 2 | 1 | 1 | 1 | 1 | 1 | 1 | 1 | 1 | 1 | 1 | 1 | ||||||||||||||||||||||||||||||||||||||||||||||||||||||||||||||||
| Processed | Total | 3 | 6 | 1 | 1 | 1 | 1 | 2 | 4 | 1 | 3 | 2 | 2 | 4 | 7 | 5 | 3 | 5 | 1 | 1 | 4 | 1 | 2 | 2 | 4 | 6 | 6 | 1 | 4 | 7 | 5 | 6 | 2 | 3 | 7 | 2 | 1 | 1 | 2 | 2 | 1 | 2 | 5 | 4 | 1 | 1 | 1 | 4 | 2 | 3 | 1 | 1 | 2 | 2 | 1 | 3 | 2 | 7 | 3 | 1 | 1 | 3 | 6 | 6 | 3 | 5 | 5 | ||||||||||||||||||||||
| CLR PA | Total | 1 | 1 | 3 | 1 | 1 | 1 | 1 | 1 | 2 | 2 | 3 | 3 | 1 | 1 | 1 | 2 | 1 | 2 | 2 | 1 | 2 | 1 | 3 | 1 | 1 | 3 | 2 | 2 | 3 | 2 | 1 | 1 | 1 | 2 | 2 | 2 | 2 | 1 | 2 | 2 | 2 | 1 | 2 | 1 | 2 | 1 | 3 | 2 | 2 | 2 | 2 | 1 | 1 | 2 | 3 | 2 | 2 | 1 | ||||||||||||||||||||||||||||||
| CLR PA+S | Total | 1 | 2 | 1 | 1 | 1 | 2 | 2 | 2 | 3 | 1 | 1 | 3 | 1 | 1 | 1 | 1 | 3 | 3 | 4 | 3 | 2 | 2 | 3 | 3 | 1 | 4 | 1 | 1 | 1 | 2 | 2 | 1 | 1 | 2 | 2 | 3 | 2 | 1 | 1 | 3 | 3 | 1 | 2 | 2 | 1 | 2 | 2 | 2 | 1 | 2 | 1 | 2 | 1 | 1 | 2 | 1 | ||||||||||||||||||||||||||||||||
| All Families | Total | 1 | 5 | 11 | 1 | 1 | 1 | 1 | 3 | 4 | 6 | 4 | 7 | 5 | 6 | 9 | 14 | 8 | 2 | 8 | 9 | 3 | 3 | 8 | 2 | 2 | 6 | 9 | 11 | 12 | 3 | 7 | 13 | 10 | 12 | 2 | 7 | 13 | 2 | 3 | 3 | 2 | 2 | 2 | 1 | 4 | 5 | 8 | 2 | 6 | 5 | 8 | 5 | 6 | 6 | 5 | 5 | 5 | 4 | 3 | 7 | 1 | 3 | 12 | 6 | 1 | 5 | 5 | 6 | 1 | 3 | 6 | 11 | 11 | 6 | 10 | 8 | ||||||||||||
Color coding: from orange (weaker correlation/fewer total correlations) to yellow to green (stronger correlation/more total correlations). Only significant correlations are shown. Only coefficients of 0.5 or above are highlighted.
Table A19.
Correlation coefficient (Spearman ) between TechROs from Fitbit (rows) and PROs of Sleep on the PSQI scale (columns).
Table A19.
Correlation coefficient (Spearman ) between TechROs from Fitbit (rows) and PROs of Sleep on the PSQI scale (columns).
| PRO | Q1: time gone to bed at night | Q2: duration taken to fall asleep | Q3: time gotten up in the morning | Q4: duration of actual sleep | Q5A: trouble sleeping: cannot get to sleep | Q5B: trouble sleeping: wake up in the middle of the night | Q5C: trouble sleeping: use the bathroom | Q5D: trouble sleeping: cannot breathe comfortably | Q5E: trouble sleeping: cough or snore loudly | Q5F: trouble sleeping: too cold | Q5G: trouble sleeping: too hot | Q5H: trouble sleeping: bad dreams | Q5I: trouble sleeping: pain | Q5J: trouble sleeping for other reason(s) | Q6: Frequency of medicine to help you sleep | Q7: Trouble staying awake while driving, eating, or socializing | Q8: Problem with keeping up enthusiasm to get things done | Q9: sleep quality overall | Q11: Duration stayed in bed | Numeric score | Categorical score | Quality numeric sub-score | Latency numeric sub-score | Duration numeric sub-score | Efficiency numeric sub-score | Disturbance numeric sub-score | Medication numeric sub-score | Daily dysfunction numeric sub-score | Efficiency numeric sub-score | ||||||||||||||||||||||||||||||||||||||||||||||||||||||||||||
|---|---|---|---|---|---|---|---|---|---|---|---|---|---|---|---|---|---|---|---|---|---|---|---|---|---|---|---|---|---|---|---|---|---|---|---|---|---|---|---|---|---|---|---|---|---|---|---|---|---|---|---|---|---|---|---|---|---|---|---|---|---|---|---|---|---|---|---|---|---|---|---|---|---|---|---|---|---|---|---|---|---|---|---|---|---|---|---|---|---|
| Family | TechRO | Health | Both | Healthy | Diseased | Both | Healthy | Diseased | Both | Healthy | Diseased | Both | Healthy | Diseased | Both | Healthy | Diseased | Both | Healthy | Diseased | Both | Healthy | Diseased | Both | Healthy | Diseased | Both | Healthy | Diseased | Both | Healthy | Diseased | Both | Healthy | Diseased | Both | Healthy | Diseased | Both | Healthy | Diseased | Both | Healthy | Diseased | Both | Healthy | Diseased | Both | Healthy | Diseased | Both | Healthy | Diseased | Both | Healthy | Diseased | Both | Healthy | Diseased | Both | Healthy | Diseased | Both | Healthy | Diseased | Both | Healthy | Diseased | Both | Healthy | Diseased | Both | Healthy | Diseased | Both | Healthy | Diseased | Both | Healthy | Diseased | Both | Healthy | Diseased | Both | Healthy | Diseased | Both | Healthy | Diseased |
| Raw | Energy | ||||||||||||||||||||||||||||||||||||||||||||||||||||||||||||||||||||||||||||||||||||||||
| Steps | |||||||||||||||||||||||||||||||||||||||||||||||||||||||||||||||||||||||||||||||||||||||||
| Heart rate | |||||||||||||||||||||||||||||||||||||||||||||||||||||||||||||||||||||||||||||||||||||||||
| Processed | Sedentary | ||||||||||||||||||||||||||||||||||||||||||||||||||||||||||||||||||||||||||||||||||||||||
| Sedentary+light | |||||||||||||||||||||||||||||||||||||||||||||||||||||||||||||||||||||||||||||||||||||||||
| Light | |||||||||||||||||||||||||||||||||||||||||||||||||||||||||||||||||||||||||||||||||||||||||
| Light+fair | |||||||||||||||||||||||||||||||||||||||||||||||||||||||||||||||||||||||||||||||||||||||||
| Fair | |||||||||||||||||||||||||||||||||||||||||||||||||||||||||||||||||||||||||||||||||||||||||
| Fair+vigorous | |||||||||||||||||||||||||||||||||||||||||||||||||||||||||||||||||||||||||||||||||||||||||
| Vigorous | |||||||||||||||||||||||||||||||||||||||||||||||||||||||||||||||||||||||||||||||||||||||||
| Active | |||||||||||||||||||||||||||||||||||||||||||||||||||||||||||||||||||||||||||||||||||||||||
| Sleep | |||||||||||||||||||||||||||||||||||||||||||||||||||||||||||||||||||||||||||||||||||||||||
| CLR PA | Sedentary | ||||||||||||||||||||||||||||||||||||||||||||||||||||||||||||||||||||||||||||||||||||||||
| Light | |||||||||||||||||||||||||||||||||||||||||||||||||||||||||||||||||||||||||||||||||||||||||
| Fair | |||||||||||||||||||||||||||||||||||||||||||||||||||||||||||||||||||||||||||||||||||||||||
| Vigorous | |||||||||||||||||||||||||||||||||||||||||||||||||||||||||||||||||||||||||||||||||||||||||
| CLR PA+S | Sedentary | ||||||||||||||||||||||||||||||||||||||||||||||||||||||||||||||||||||||||||||||||||||||||
| Light | |||||||||||||||||||||||||||||||||||||||||||||||||||||||||||||||||||||||||||||||||||||||||
| Fair | |||||||||||||||||||||||||||||||||||||||||||||||||||||||||||||||||||||||||||||||||||||||||
| Vigorous | |||||||||||||||||||||||||||||||||||||||||||||||||||||||||||||||||||||||||||||||||||||||||
| Sleep | |||||||||||||||||||||||||||||||||||||||||||||||||||||||||||||||||||||||||||||||||||||||||
| Raw | Total | 2 | 1 | 2 | 2 | 2 | 1 | 1 | 1 | 1 | 1 | 2 | 2 | 1 | 2 | 1 | 1 | 1 | 1 | 1 | 2 | 2 | 1 | 1 | 2 | 2 | 2 | 1 | 2 | 1 | 1 | 1 | 1 | 1 | 1 | 2 | 1 | 1 | 2 | 2 | |||||||||||||||||||||||||||||||||||||||||||||||||
| Processed | Total | 4 | 2 | 1 | 1 | 1 | 1 | 5 | 5 | 4 | 1 | 1 | 2 | 1 | 2 | 4 | 4 | 2 | 3 | 1 | 2 | 2 | 1 | 2 | 3 | 2 | 1 | 1 | 2 | 5 | 5 | 4 | 1 | 2 | 3 | 5 | 2 | 2 | 2 | 6 | 2 | 1 | 5 | 3 | 5 | 2 | 1 | 1 | 1 | 3 | 3 | 1 | 1 | 2 | 4 | 3 | 4 | 3 | 2 | ||||||||||||||||||||||||||||||
| CLR PA | Total | 1 | 1 | 2 | 1 | 1 | 1 | 3 | 3 | 2 | 1 | 1 | 1 | 1 | 2 | 1 | 4 | 3 | 3 | 1 | 2 | 1 | 1 | 1 | 1 | 1 | 1 | 4 | 3 | 1 | 1 | 1 | 1 | 1 | 1 | 3 | 3 | 2 | 1 | 2 | 1 | 1 | 1 | 1 | 2 | 1 | 3 | 2 | 2 | 2 | 2 | 2 | 1 | 3 | 3 | 1 | 3 | 2 | |||||||||||||||||||||||||||||||
| CLR PA+S | Total | 1 | 2 | 5 | 2 | 1 | 2 | 2 | 2 | 2 | 2 | 2 | 1 | 2 | 2 | 3 | 3 | 4 | 3 | 2 | 3 | 1 | 2 | 1 | 2 | 3 | 2 | 4 | 1 | 2 | 1 | 3 | 1 | 1 | 1 | 1 | 2 | 2 | 3 | 1 | 2 | 1 | 1 | 2 | 1 | 2 | 1 | ||||||||||||||||||||||||||||||||||||||||||
| All Families | Total | 6 | 4 | 2 | 7 | 6 | 4 | 4 | 5 | 2 | 11 | 11 | 6 | 4 | 5 | 4 | 4 | 5 | 2 | 7 | 10 | 4 | 3 | 7 | 7 | 2 | 4 | 1 | 3 | 5 | 1 | 7 | 3 | 4 | 6 | 4 | 2 | 1 | 5 | 1 | 1 | 14 | 10 | 5 | 5 | 7 | 1 | 5 | 8 | 5 | 4 | 8 | 2 | 5 | 8 | 4 | 3 | 6 | 1 | 5 | 8 | 5 | 4 | 7 | 3 | 8 | 8 | 1 | 4 | 5 | 1 | 2 | 3 | 2 | 1 | 1 | 10 | 9 | 7 | 8 | 5 | ||||||||
Color coding: from orange (weaker correlation/fewer total correlations) to yellow to green (stronger correlation/more total correlations). Only significant correlations are shown. Only coefficients of 0.5 or above are highlighted.
Table A20.
Correlation coefficient (Spearman ) between TechROs from Fitbit (rows) and PROs of Health-Related Quality of Life on the EQ-5D-3L scale (columns).
Table A20.
Correlation coefficient (Spearman ) between TechROs from Fitbit (rows) and PROs of Health-Related Quality of Life on the EQ-5D-3L scale (columns).
| PRO | Q1: Mobility | Q2: Self-Care | Q3: Usual Activities | Q4: Pain/Discomfort | Q5: Anxiety/Depression | Health Score | Mobility Numeric Score | Self-Care Numeric Score | Usual aCtivities Numeric Score | Pain/Discomfort Numeric Score | Anxiety/Depression Numeric Score | ||||||||||||||||||||||||
|---|---|---|---|---|---|---|---|---|---|---|---|---|---|---|---|---|---|---|---|---|---|---|---|---|---|---|---|---|---|---|---|---|---|---|---|
| Family | TechRO | Health | Both | Healthy | Diseased | Both | Healthy | Diseased | Both | Healthy | Diseased | Both | Healthy | Diseased | Both | Healthy | Diseased | Both | Healthy | Diseased | Both | Healthy | Diseased | Both | Healthy | Diseased | Both | Healthy | Diseased | Both | Healthy | Diseased | Both | Healthy | Diseased |
| Raw | Energy | ||||||||||||||||||||||||||||||||||
| Steps | |||||||||||||||||||||||||||||||||||
| Heart rate | |||||||||||||||||||||||||||||||||||
| Processed | Sedentary | ||||||||||||||||||||||||||||||||||
| Sedentary+light | |||||||||||||||||||||||||||||||||||
| Light | |||||||||||||||||||||||||||||||||||
| Light+fair | |||||||||||||||||||||||||||||||||||
| Fair | |||||||||||||||||||||||||||||||||||
| Fair+vigorous | |||||||||||||||||||||||||||||||||||
| Vigorous | |||||||||||||||||||||||||||||||||||
| Active | |||||||||||||||||||||||||||||||||||
| Sleep | |||||||||||||||||||||||||||||||||||
| CLR PA | Sedentary | ||||||||||||||||||||||||||||||||||
| Light | |||||||||||||||||||||||||||||||||||
| Fair | |||||||||||||||||||||||||||||||||||
| Vigorous | |||||||||||||||||||||||||||||||||||
| CLR PA+S | Sedentary | ||||||||||||||||||||||||||||||||||
| Light | |||||||||||||||||||||||||||||||||||
| Fair | |||||||||||||||||||||||||||||||||||
| Vigorous | |||||||||||||||||||||||||||||||||||
| Sleep | |||||||||||||||||||||||||||||||||||
| Raw | Total | 1 | 1 | 2 | 1 | 1 | 1 | 2 | |||||||||||||||||||||||||||
| Processed | Total | 1 | 2 | 4 | 2 | 3 | 2 | 3 | 4 | 1 | 1 | 2 | 4 | 2 | 3 | 2 | 3 | ||||||||||||||||||
| CLR PA | Total | 1 | 2 | 1 | 1 | 1 | 2 | 1 | 2 | 1 | |||||||||||||||||||||||||
| CLR PA+S | Total | 3 | 1 | 3 | 2 | 3 | 1 | ||||||||||||||||||||||||||||
| All Families | Total | 1 | 1 | 6 | 7 | 3 | 3 | 3 | 5 | 8 | 5 | 2 | 1 | 1 | 6 | 7 | 3 | 3 | 3 | 5 | |||||||||||||||
Color coding: from orange (weaker correlation/fewer total correlations) to yellow to green (stronger correlation/more total correlations). Only significant correlations are shown. Only coefficients of 0.5 or above are highlighted.
References
- Naghavi, M.; Abajobir, A.A.; Abbafati, C.; Abbas, K.M.; Abd-Allah, F.; Abera, S.F.; Aboyans, V.; Adetokunboh, O.; Afshin, A.; Agrawal, A.; et al. Global, regional, and national age-sex specific mortality for 264 causes of death, 1980–2016: A systematic analysis for the Global Burden of Disease Study 2016. Lancet 2017, 390, 1151–1210. [Google Scholar] [CrossRef]
- WHO Regional Office for Europe. Noncommunicable Diseases; WHO Regional Office for Europe: Copenhagen, Denmark, 2020. [Google Scholar]
- Anderson, G. Responding to the Growing Cost and Prevalence of People with Multiple Chronic Conditions. Ph.D. Thesis, Johns Hopkins Bloomberg School of Public Health, Baltimore, MD, USA, 2011. [Google Scholar]
- United States Office of the Assistant Secretary for Health. Healthy People: The Surgeon General’s Report on Health Promotion and Disease Prevention; United States Public Health Service: Washington, DC, USA, 1979.
- United Nations Department of Economic and Social Affairs. World Population Prospects 2019: Highlights; United Nations Department for Economic and Social Affairs: New York, NY, USA, 2019.
- Mayo, N.E.; Figueiredo, S.; Ahmed, S.; Bartlett, S.J. Montréal Accord on Patient-Reported Outcomes (PROs) use series–Paper 2: Terminology proposed to measure what matters in health. J. Clin. Epidemiol. 2017, 89, 119–124. [Google Scholar] [CrossRef] [PubMed]
- Sims, J.; Smith, F.; Duffy, A.; Hilton, S. The vagaries of self-reports of physical activity: A problem revisited and addressed in a study of exercise promotion in the over 65 s in general practice. Fam. Pract. 1999, 16, 152–157. [Google Scholar] [CrossRef] [PubMed]
- Anderson, K.N.; Catt, M.; Collerton, J.; Davies, K.; von Zglinicki, T.; Kirkwood, T.B.; Jagger, C. Assessment of sleep and circadian rhythm disorders in the very old: the Newcastle 85+ Cohort Study. Age Ageing 2014, 43, 57–63. [Google Scholar] [CrossRef] [PubMed]
- Van Den Berg, J.F.; Van Rooij, F.J.; Vos, H.; Tulen, J.H.; Hofman, A.; Miedema, H.M.; Neven, A.K.; Tiemeier, H. Disagreement between subjective and actigraphic measures of sleep duration in a population-based study of elderly persons. J. Sleep Res. 2008, 17, 295–302. [Google Scholar] [CrossRef] [PubMed]
- Wac, K. From quantified self to quality of life. In Digital Health; Springer: Berlin/Heidelberg, Germany, 2018; pp. 83–108. [Google Scholar]
- Sylvia, L.G.; Bernstein, E.E.; Hubbard, J.L.; Keating, L.; Anderson, E.J. Practical guide to measuring physical activity. J. Acad. Nutr. Diet. 2014, 114, 199–208. [Google Scholar] [CrossRef] [PubMed]
- Ferguson, T.; Rowlands, A.V.; Olds, T.; Maher, C. The validity of consumer-level, activity monitors in healthy adults worn in free-living conditions: A cross-sectional study. Int. J. Behav. Nutr. Phys. Act. 2015, 12, 42. [Google Scholar] [CrossRef]
- International Data Corporation. IDC Forecasts Sustained Double-Digit Growth for Wearable Devices Led by Steady Adoption of Smartwatches; International Data Corporation: San Mateo, CA, USA, 2019. [Google Scholar]
- Dominick, G.M.; Winfree, K.N.; Pohlig, R.T.; Papas, M.A. Physical activity assessment between consumer-and research-grade accelerometers: A comparative study in free-living conditions. JMIR mHealth uHealth 2016, 4, e110. [Google Scholar] [CrossRef]
- McMahon, S.K.; Lewis, B.; Oakes, M.; Guan, W.; Wyman, J.F.; Rothman, A.J. Older adults’ experiences using a commercially available monitor to self-track their physical activity. JMIR mHealth uHealth 2016, 4, e35. [Google Scholar] [CrossRef]
- Martinez, G.J.; Mattingly, S.M.; Mirjafari, S.; Nepal, S.K.; Campbell, A.T.; Dey, A.K.; Striegel, A.D. On the Quality of Real-world Wearable Data in a Longitudinal Study of Information Workers. In Proceedings of the 2020 IEEE International Conference on Pervasive Computing and Communications Workshops (PerCom Workshops), Austin, TX, USA, 23–27 March 2020; pp. 1–6. [Google Scholar]
- Adam Noah, J.; Spierer, D.K.; Gu, J.; Bronner, S. Comparison of steps and energy expenditure assessment in adults of Fitbit Tracker and Ultra to the Actical and indirect calorimetry. J. Med Eng. Technol. 2013, 37, 456–462. [Google Scholar] [CrossRef]
- Imboden, M.T.; Nelson, M.B.; Kaminsky, L.A.; Montoye, A.H. Comparison of four Fitbit and Jawbone activity monitors with a research-grade ActiGraph accelerometer for estimating physical activity and energy expenditure. Br. J. Sport. Med. 2018, 52, 844–850. [Google Scholar] [CrossRef] [PubMed]
- Van Camp, C. Accuracy of Predicted Energy Expenditure from a Fitbit Inspire HR Activity Monitor during Short-and Long-Duration Exercise. Master’s Thesis, Eastern Michigan University, Ypsilanti, MI, USA, 2020. [Google Scholar]
- CoME Consortium. Caregiver & ME (CoME): Application for Healthier Self-Management of Seniors. 2017. Available online: http://come-aal.eu/ (accessed on 1 August 2020).
- De Vet, H.; Terwee, C.; Mokkink, L.; Knol, D. Concepts, theories and models, and types of measurements. In Measurement in Medicine: A Practical Guide; Cambridge University Press: Cambridge, UK, 2011; pp. 7–29. [Google Scholar]
- Livingston, G.; Sommerlad, A.; Orgeta, V.; Costafreda, S.G.; Huntley, J.; Ames, D.; Ballard, C.; Banerjee, S.; Burns, A.; Cohen-Mansfield, J.; et al. Dementia prevention, intervention, and care. Lancet 2017, 390, 2673–2734. [Google Scholar] [CrossRef]
- Sindi, S.; Kåreholt, I.; Johansson, L.; Skoog, J.; Sjöberg, L.; Wang, H.X.; Johansson, B.; Fratiglioni, L.; Soininen, H.; Solomon, A.; et al. Sleep disturbances and dementia risk: A multicenter study. Alzheimer’s Dement. 2018, 14, 1235–1242. [Google Scholar] [CrossRef]
- Chen, J.C.; Espeland, M.A.; Brunner, R.L.; Lovato, L.C.; Wallace, R.B.; Leng, X.; Phillips, L.S.; Robinson, J.G.; Kotchen, J.M.; Johnson, K.C.; et al. Sleep duration, cognitive decline, and dementia risk in older women. Alzheimer’s Dement. 2016, 12, 21–33. [Google Scholar] [CrossRef]
- Benedict, C.; Byberg, L.; Cedernaes, J.; Hogenkamp, P.S.; Giedratis, V.; Kilander, L.; Lind, L.; Lannfelt, L.; Schiöth, H.B. Self-reported sleep disturbance is associated with Alzheimer’s disease risk in men. Alzheimer’s Dementia 2015, 11, 1090–1097. [Google Scholar] [CrossRef]
- The IPAQ Group. International Physical Activity Questionnaire. 2002. Available online: https://sites.google.com/site/theipaq/ (accessed on 1 August 2020).
- Zimet, G.D.; Dahlem, N.W.; Zimet, S.G.; Farley, G.K. The multidimensional scale of perceived social support. J. Personal. Assess. 1988, 52, 30–41. [Google Scholar] [CrossRef]
- Goldberg, D.; Bridges, K.; Duncan-Jones, P.; Grayson, D. Detecting anxiety and depression in general medical settings. Br. Med. J. 1988, 297, 897–899. [Google Scholar] [CrossRef]
- Estruch, R.; Ros, E.; Salas-Salvadó, J.; Covas, M.I.; Corella, D.; Arós, F.; Gómez-Gracia, E.; Ruiz-Gutiérrez, V.; Fiol, M.; Lapetra, J.; et al. Primary prevention of cardiovascular disease with a Mediterranean diet. N. Engl. J. Med. 2013, 368, 1279–1290. [Google Scholar] [CrossRef]
- Estruch, R.; Ros, E.; Salas-Salvadó, J.; Covas, M.I.; Corella, D.; Arós, F.; Gómez-Gracia, E.; Ruiz-Gutiérrez, V.; Fiol, M.; Lapetra, J.; et al. Primary prevention of cardiovascular disease with a Mediterranean diet supplemented with extra-virgin olive oil or nuts. N. Engl. J. Med. 2018, 378, e34. [Google Scholar] [CrossRef]
- Nestlé Nutrition Institute. Mini Nutritional Assessment (Self MNA®) for Adults 65 Years of Age and Older. 2012. Available online: https://www.mna-elderly.com/ (accessed on 1 August 2020).
- Sunderland, A.; Watts, K.; Baddeley, A.D.; Harris, J.E. Subjective memory assessment and test performance in elderly adults. J. Gerontol. 1986, 41, 376–384. [Google Scholar] [CrossRef] [PubMed]
- Carpenter, J.S.; Andrykowski, M.A. Psychometric evaluation of the Pittsburgh sleep quality index. J. Psychosom. Res. 1998, 45, 5–13. [Google Scholar] [CrossRef]
- EuroQol Research Foundation. EQ-5D-3L. 2020. Available online: https://euroqol.org/eq-5d-instruments/eq-5d-3l-about/ (accessed on 1 August 2020).
- Fitbit, Inc. Fitbit Official Website. 2020. Available online: https://www.fitbit.com/dk/home (accessed on 29 October 2020).
- Garriguet, D.; Tremblay, S.; Colley, R.C. Comparison of physical activity adult questionnaire results with accelerometer data. Health Rep. 2015, 26, 11. [Google Scholar] [PubMed]
- Brewer, W.; Swanson, B.T.; Ortiz, A. Validity of Fitbit’s active minutes as compared with a research-grade accelerometer and self-reported measures. BMJ Open Sport Exerc. Med. 2017, 3, e000254. [Google Scholar] [CrossRef]
- Rossi, A.; Frechette, L.; Miller, D.; Miller, E.; Friel, C.; Van Arsdale, A.; Lin, J.; Shankar, V.; Kuo, D.Y.; Nevadunsky, N.S. Acceptability and feasibility of a Fitbit physical activity monitor for endometrial cancer survivors. Gynecol. Oncol. 2018, 149, 470–475. [Google Scholar] [CrossRef]
- Meyer, J.; von Holdt, K.; Beck, E.; Brandes, M.; Pischke, C.; Voelcker-Rehage, C. Toy or tool? Activity trackers for the assessment of physical activity in the wild. In Proceedings of the 2019 IEEE International Conference on Healthcare Informatics (ICHI), Xi’an, China, 10–13 June 2019; pp. 1–9. [Google Scholar]
- Santomas, K. Passive Monitoring of Physical Activity Using a Fitbit Charge 3 in Individuals at Risk for Depression; Technical Report; University of Massachussetts Lowell: Lowell, MA, USA, 2020. [Google Scholar]
- Troxel, W.M.; Buysse, D.J.; Monk, T.H.; Begley, A.; Hall, M. Does social support differentially affect sleep in older adults with versus without insomnia? J. Psychosom. Res. 2010, 69, 459–466. [Google Scholar] [CrossRef]
- Carlson, J.A.; Sallis, J.F.; Conway, T.L.; Saelens, B.E.; Frank, L.D.; Kerr, J.; Cain, K.L.; King, A.C. Interactions between psychosocial and built environment factors in explaining older adults’ physical activity. Prev. Med. 2012, 54, 68–73. [Google Scholar] [CrossRef]
- McMurdo, M.E.; Argo, I.; Crombie, I.K.; Feng, Z.; Sniehotta, F.F.; Vadiveloo, T.; Witham, M.D.; Donnan, P.T. Social, environmental and psychological factors associated with objective physical activity levels in the over 65 s. PLoS ONE 2012, 7, e31878. [Google Scholar] [CrossRef]
- Ho, E.C.; Hawkley, L.; Dale, W.; Waite, L.; Huisingh-Scheetz, M. Social capital predicts accelerometry-measured physical activity among older adults in the US: A cross-sectional study in the National Social Life, Health, and Aging Project. BMC Public Health 2018, 18, 804. [Google Scholar] [CrossRef] [PubMed]
- Arigo, D.; Pasko, K.; Mogle, J.A. Daily relations between social perceptions and physical activity among college women. Psychol. Sport Exerc. 2019, 47, 101528. [Google Scholar] [CrossRef]
- Doryab, A.; Villalba, D.K.; Chikersal, P.; Dutcher, J.M.; Tumminia, M.; Liu, X.; Cohen, S.; Creswell, K.; Mankoff, J.; Creswell, J.D.; et al. Identifying Behavioral Phenotypes of Loneliness and Social Isolation with Passive Sensing: Statistical Analysis, Data Mining and Machine Learning of Smartphone and Fitbit Data. JMIR mHealth uHealth 2019, 7, e13209. [Google Scholar] [CrossRef]
- Adams, D.J.; Remick, R.A.; Davis, J.C.; Vazirian, S.; Khan, K.M. Exercise as medicine—the use of group medical visits to promote physical activity and treat chronic moderate depression: A preliminary 14-week pre–post study. BMJ Open Sport Exerc. Med. 2015, 1, e000036. [Google Scholar] [CrossRef] [PubMed]
- Helgadóttir, B.; Forsell, Y.; Ekblom, Ö. Physical activity patterns of people affected by depressive and anxiety disorders as measured by accelerometers: A cross-sectional study. PLoS ONE 2015, 10, e0115894. [Google Scholar] [CrossRef]
- Liau, A.K.; Neihart, M.; Teo, C.T.; Goh, L.S.; Chew, P. A Quasi-experimental study of a fitbit-based self-regulation intervention to improve physical activity, well-being, and mental health. Cyberpsychol. Behav. Soc. Netw. 2018, 21, 727–734. [Google Scholar] [CrossRef] [PubMed]
- Vidal Bustamante, C.M.; Rodman, A.M.; Dennison, M.J.; Flournoy, J.C.; Mair, P.; McLaughlin, K.A. Within-person fluctuations in stressful life events, sleep, and anxiety and depression symptoms during adolescence: A multiwave prospective study. J. Child Psychol. Psychiatry 2020, 61, 1116–1125. [Google Scholar] [CrossRef] [PubMed]
- Falck, R.S.; Landry, G.J.; Best, J.R.; Davis, J.C.; Chiu, B.K.; Liu-Ambrose, T. Cross-sectional relationships of physical activity and sedentary behavior with cognitive function in older adults with probable mild cognitive impairment. Phys. Ther. 2017, 97, 975–984. [Google Scholar] [CrossRef]
- Giannakos, M.N.; Sharma, K.; Papavlasopoulou, S.; Pappas, I.O.; Kostakos, V. Fitbit for learning: Towards capturing the learning experience using wearable sensing. Int. J. Hum. Comput. Stud. 2020, 136, 102384. [Google Scholar] [CrossRef]
- McLaren, B.; Andrews, S.C.; Glikmann-Johnston, Y.; Mercieca, E.C.; Murray, N.W.; Loy, C.; Bellgrove, M.A.; Stout, J.C. Feasibility and initial validation of ‘HD-Mobile’, a smartphone application for remote self-administration of performance-based cognitive measures in Huntington’s disease. J. Neurol. 2020, 1432–1459. [Google Scholar] [CrossRef]
- Sano, A.; Phillips, A.J.; Amy, Z.Y.; McHill, A.W.; Taylor, S.; Jaques, N.; Czeisler, C.A.; Klerman, E.B.; Picard, R.W. Recognizing academic performance, sleep quality, stress level, and mental health using personality traits, wearable sensors and mobile phones. In Proceedings of the 2015 IEEE 12th International Conference on Wearable and Implantable Body Sensor Networks (BSN), Cambridge, MA, USA, 9–12 June 2015; pp. 1–6. [Google Scholar]
- Peach, H.D.; Gaultney, J.F.; Ruggiero, A.R. Direct and indirect associations of sleep knowledge and attitudes with objective and subjective sleep duration and quality via sleep hygiene. J. Prim. Prev. 2018, 39, 555–570. [Google Scholar] [CrossRef]
- Thota, D. Evaluating the Relationship Between Fitbit Sleep Data and Self-Reported Mood, Sleep, and Environmental Contextual Factors in Healthy Adults: Pilot Observational Cohort Study. JMIR Form. Res. 2020, 4, e18086. [Google Scholar] [CrossRef]
- Lohne-Seiler, H.; Hansen, B.H.; Kolle, E.; Anderssen, S.A. Accelerometer-determined physical activity and self-reported health in a population of older adults (65–85 years): A cross-sectional study. BMC Public Health 2014, 14, 284. [Google Scholar] [CrossRef]
- Mobbs, R.J.; Phan, K.; Maharaj, M.; Rao, P.J. Physical activity measured with accelerometer and self-rated disability in lumbar spine surgery: A prospective study. Glob. Spine J. 2016, 6, 459–464. [Google Scholar] [CrossRef]
- Gresham, G.; Hendifar, A.E.; Spiegel, B.; Neeman, E.; Tuli, R.; Rimel, B.; Figlin, R.A.; Meinert, C.L.; Piantadosi, S.; Shinde, A.M. Wearable activity monitors to assess performance status and predict clinical outcomes in advanced cancer patients. NPJ Digit. Med. 2018, 1, 27. [Google Scholar] [CrossRef] [PubMed]
- Sasaki, S.; Kanai, M.; Shinoda, T.; Morita, H.; Shimada, S.; Izawa, K.P. Relation between health utility score and physical activity in community-dwelling ambulatory patients with stroke: A preliminary cross-sectional study. Top. Stroke Rehabil. 2018, 25, 475–479. [Google Scholar] [CrossRef] [PubMed]
- Twiggs, J.; Salmon, L.; Kolos, E.; Bogue, E.; Miles, B.; Roe, J. Measurement of physical activity in the pre-and early post-operative period after total knee arthroplasty for Osteoarthritis using a Fitbit Flex device. Med. Eng. Phys. 2018, 51, 31–40. [Google Scholar] [CrossRef] [PubMed]
- Laghouila, S.; Manea, V.; Estrada, V.; Wac, K. Digital Health Tools for Chronic Illness and Dementia Risk Assessment in Older Adults. In Annals of Behavioral Medicine; Oxford Univ Press Inc.: Oxford, UK, 2018; Volume 52, p. S291. [Google Scholar]
- Fitbit, Inc. Fitbit Developer API—Daily Activity Summary; Fitbit, Inc.: San Francisco, CA, USA, 2019. [Google Scholar]
- Rosenberger, M.E.; Fulton, J.E.; Buman, M.P.; Troiano, R.P.; Grandner, M.A.; Buchner, D.M.; Haskell, W.L. The 24-H Activity Cycle: A New Paradigm for Physical Activity. Med. Sci. Sport. Exerc. 2019, 51, 454–464. [Google Scholar] [CrossRef]
- Aitchison, J. The statistical analysis of compositional data. J. R. Stat. Soc. Ser. B Methodol. 1982, 44, 139–160. [Google Scholar] [CrossRef]
- Fitbit, Inc. Fitbit User Forums: Lightly Active vs. Active vs. Very Active; Fitbit, Inc.: San Francisco, CA, USA, 2019. [Google Scholar]
- Fitbit, Inc. Fitbit User Forums: How Activity Categories Are Determined; Fitbit, Inc.: San Francisco, CA, USA, 2019. [Google Scholar]
- Fitbit, Inc. What are Active Minutes? Fitbit, Inc.: San Francisco, CA, USA, 2019. [Google Scholar]
- Smith, G.L.; Banting, L.; Eime, R.; O’Sullivan, G.; Van Uffelen, J.G. The association between social support and physical activity in older adults: A systematic review. Int. J. Behav. Nutr. Phys. Act. 2017, 14, 56. [Google Scholar] [CrossRef]
- Spearman, C. The Proof and Measurement of Association between Two Things; Appleton-Century-Crofts: New York, NY, USA, 1961. [Google Scholar]
- The SciPy community. SciPy 1.5.0 Release Notes. 2020. Available online: https://docs.scipy.org/doc/scipy/reference/release.1.5.0.html (accessed on 1 August 2020).
- Wanner, M.; Probst-Hensch, N.; Kriemler, S.; Meier, F.; Autenrieth, C.; Martin, B.W. Validation of the long international physical activity questionnaire: influence of age and language region. Prev. Med. Rep. 2016, 3, 250–256. [Google Scholar] [CrossRef]
- Kent de Grey, R.G.; Uchino, B.N.; Trettevik, R.; Cronan, S.; Hogan, J.N. Social support and sleep: A meta-analysis. Health Psychol. 2018, 37, 787. [Google Scholar] [CrossRef]
- Monroe, C.M.; Thompson, D.L.; Bassett, D.R., Jr.; Fitzhugh, E.C.; Raynor, H.A. Usability of mobile phones in physical activity–related research: A systematic review. Am. J. Health Educ. 2015, 46, 196–206. [Google Scholar] [CrossRef]
- Feng, Y.; Chang, C.K.; Chang, H. An adl recognition system on smart phone. In International Conference on Smart Homes and Health Telematics; Springer: Cham, Switzerland, 2016; pp. 148–158. [Google Scholar]
- Feng, Y.; Chang, C.K.; Ming, H. Recognizing activities of daily living to improve well-being. IT Prof. 2017, 19, 31–37. [Google Scholar] [CrossRef]
- Simon, E.B.; Walker, M.P. Sleep loss causes social withdrawal and loneliness. Nat. Commun. 2018, 9, 1–9. [Google Scholar] [CrossRef]
- Wu, J.; Feng, Y.; Sun, P. Sensor fusion for recognition of activities of daily living. Sensors 2018, 18, 4029. [Google Scholar] [CrossRef] [PubMed]
- Hebden, L.; Cook, A.; Van Der Ploeg, H.P.; Allman-Farinelli, M. Development of smartphone applications for nutrition and physical activity behavior change. JMIR Res. Protoc. 2012, 1, e9. [Google Scholar] [CrossRef] [PubMed]
- Goldberg, R. Escala de Goldberg. 1993. Available online: http://www.sld.cu/galerias/pdf/sitios/rehabilitacion/goldberg-depresion.pdf (accessed on 1 August 2020).
- EuroQol Research Foundation. Available EQ-5D Versions. 2020. Available online: https://euroqol.org/eq-5d-instruments/all-eq-5d-versions/ (accessed on 1 August 2020).
- Carrasco, P.M.; Peña, M.M.; Sueiro, M.J. The memory failures of everyday questionnaire (MFE): Internal consistency and reliability. Span. J. Psychol. 2012, 15, 768. [Google Scholar] [CrossRef] [PubMed]
- Nestlé Nutrition Institute. Mini Nutritional Assessment (Self MNA®) Para Adultos a Partir de 65 Años. 2012. Available online: https://www.mna-elderly.com/forms/Self-MNA_Spanish.pdf (accessed on 1 August 2020).
- Centro de Investigacion Biomedica en Red. Estudio Predimed. 2020. Available online: http://www.predimed.es/uploads/8/0/5/1/8051451/p14_medas.pdf (accessed on 1 August 2020).
- The IPAQ Group. Cuestionario Internacional de Actividad Fisica. 2002. Available online: https://sites.google.com/site/theipaq/questionnaire_links/IPAQ_Spanish%28USA%29_self-admin_long.pdf (accessed on 1 August 2020).
- Universitat de Barcelona. Indice de calidad de sueño de Pittsburgh. 1998. Available online: http://www.ub.edu/psicobiologia/Pmemlleng/images/Index%20de%20Pittsburgh.pdf (accessed on 1 August 2020).
- American Academy of Pediatrics. Multidimensional Scale of Perceived Social Support (Spanish). 2010. Available online: http://www.heardalliance.org/wp-content/uploads/2011/04/Multidimensional-Scale-of-Perceived-Social-Support-Spanish.pdf (accessed on 1 August 2020).
- Orsolya, P.Z.; Zoltán, K.M.; Szilvia, J. A Multidimenzionális észlelt társas támogatás kérdőív magyar nyelvű validálása. Mentálhigiéné Pszichoszomatika 2017, 18, 230–262. [Google Scholar] [CrossRef]
- The IPAQ Group. Guidelines for Data Processing and Analysis of the International Physical Activity Questionnaire (IPAQ). 2005. Available online: https://docs.google.com/viewer?a=v&pid=sites&srcid=ZGVmYXVsdGRvbWFpbnx0aGVpcGFxfGd4OjE0NDgxMDk3NDU1YWRlZTM (accessed on 1 August 2020).
- Rasch, G. Probabilistic Models for Some Intelligence and Attainment Tests; ERIC: Washington, DC, USA, 1993.
- Inkin. Wearables: The Comprehensive List of Wearables on the Market. 2020. Available online: https://www.inkin.com/wearables/ (accessed on 29 October 2020).
- United States Food and Drug Administration. FDA Selects Participants for New Digital Health Software Precertification Pilot Program; United States Food and Drug Administration: Silver Spring, MD, USA, 2017.
- Kooiman, T.J.; Dontje, M.L.; Sprenger, S.R.; Krijnen, W.P.; van der Schans, C.P.; de Groot, M. Reliability and validity of ten consumer activity trackers. BMC Sports Sci. Med. Rehabil. 2015, 7, 24. [Google Scholar] [CrossRef]
- Keill, A. Validity of wearable fitness trackers on sleep measure. Med. Sci. Sports Exerc. 2016, 48, 10. [Google Scholar] [CrossRef]
- Lee, J.M.; Byun, W.; Keill, A.; Dinkel, D.; Seo, Y. Comparison of Wearable Trackers’ Ability to Estimate Sleep. Int. J. Environ. Res. Public Health 2018, 15, 1265. [Google Scholar] [CrossRef]
- Tedesco, S.; Sica, M.; Ancillao, A.; Timmons, S.; Barton, J.; O’Flynn, B. Validity Evaluation of the Fitbit Charge2 and the Garmin vivosmart HR+ in Free-Living Environments in an Older Adult Cohort. JMIR mHealth uHealth 2019, 7, e13084. [Google Scholar] [CrossRef]
- Paul, S.S.; Tiedemann, A.; Hassett, L.M.; Ramsay, E.; Kirkham, C.; Chagpar, S.; Sherrington, C. Validity of the Fitbit activity tracker for measuring steps in community-dwelling older adults. BMJ Open Sport Exerc. Med. 2015, 1, e000013. [Google Scholar] [CrossRef] [PubMed]
- Brooke, J. SUS-A quick and dirty usability scale. Usability Eval. Ind. 1996, 189, 4–7. [Google Scholar]
- Steinert, A.; Haesner, M.; Steinhagen-Thiessen, E. Activity-tracking devices for older adults: Comparison and preferences. Univers. Access Inf. Soc. 2018, 17, 411–419. [Google Scholar] [CrossRef]
- Cooper, C.; Gross, A.; Brinkman, C.; Pope, R.; Allen, K.; Hastings, S.; Bogen, B.E.; Goode, A. The impact of wearable motion sensing technology on physical activity in older adults. Exp. Gerontol. 2018, 112, 9–19. [Google Scholar] [CrossRef]
- Rothman, K.J. No adjustments are needed for multiple comparisons. Epidemiology 1990, 1, 43–46. [Google Scholar] [CrossRef]
Publisher’s Note: MDPI stays neutral with regard to jurisdictional claims in published maps and institutional affiliations. |
© 2020 by the authors. Licensee MDPI, Basel, Switzerland. This article is an open access article distributed under the terms and conditions of the Creative Commons Attribution (CC BY) license (http://creativecommons.org/licenses/by/4.0/).