Article

Behavioral and Psychological Symptoms of Dementia (BPSD): Clinical Characterization and Genetic Correlates in an Italian Alzheimer’s Disease Cohort

1
Genetics Unit, IRCCS Istituto Centro San Giovanni di Dio Fatebenefratelli, 25123 Brescia, Italy
2
Biological Psychiatry Unit, IRCCS Istituto Centro San Giovanni di Dio Fatebenefratelli, 25123 Brescia, Italy
3
Molecular Markers Laboratory, IRCCS Istituto Centro San Giovanni di Dio Fatebenefratelli, 25123 Brescia, Italy
4
Institute of Genomic Statistics and Bioinformatics, University of Bonn, 53127 Bonn, Germany
5
Alzheimer’s Research Unit-Memory Clinic, IRCCS Istituto Centro San Giovanni di Dio Fatebenefratelli, 25123 Brescia, Italy
6
Section of Biology and Genetic, Department of Molecular and Translational Medicine, University of Brescia, 25123 Brescia, Italy
*
Author to whom correspondence should be addressed.
These authors contributed equally to this work.
J. Pers. Med. 2020, 10(3), 90; https://doi.org/10.3390/jpm10030090
Submission received: 25 June 2020 / Revised: 5 August 2020 / Accepted: 12 August 2020 / Published: 14 August 2020
(This article belongs to the Special Issue Novel Biomarkers in Alzheimer’s Disease)

Abstract

:
Background: The occurrence of Behavioral and Psychological Symptoms of Dementia (BPSD) in Alzheimer’s Disease (AD) patients hampers the clinical management and exacerbates the burden for caregivers. The definition of the clinical distribution of BPSD symptoms, and the extent to which symptoms are genetically determined, are still open to debate. Moreover, genetic factors that underline BPSD symptoms still need to be identified. Purpose. To characterize our Italian AD cohort according to specific BPSD symptoms as well as to endophenotypes. To evaluate the associations between the considered BPSD traits and COMT, MTHFR, and APOE genetic variants. Methods. AD patients (n = 362) underwent neuropsychological examination and genotyping. BPSD were assessed with the Neuropsychiatric Inventory scale. Results. APOE and MTHFR variants were significantly associated with specific single BPSD symptoms. Furthermore, “Psychosis” and “Hyperactivity” resulted in the most severe endophenotypes, with APOE and MTHFR implicated as both single risk factors and “genexgene” interactions. Conclusions. We strongly suggest the combined use of both BPSD single symptoms/endophenotypes and the “genexgene” interactions as valid strategies for expanding the knowledge about the BPSD aetiopathogenetic mechanisms.

1. Introduction

The core clinical criteria for Alzheimer’s Disease (AD), the most common neurodegenerative dementing illness, focus on the presence of memory disturbance or other cognitive symptoms that interfere with the ability to function at work or in usual daily activities [1].
Although cognitive symptoms are the actual hallmark of disease, patients often show also a broad range of “non-cognitive” disturbances, more commonly known with the term “Behavioral and Psychological Symptoms of Dementia (BPSD)”. Highlighting the importance of these symptoms is pivotal because BPSD represents the leading reason for loss of independence and institutionalization for AD patients [2,3,4]. About up to 90% of people with AD can present neuropsychiatric disturbances including agitation, aggression, irritation, disinhibition, anxiety, depression, apathy, delusions, and hallucinations at onset or later in the course of the disease [5,6].
Furthermore, BPSD can be recognized individually, but more often they occur in association. Indeed, 50% of subjects with AD show at least four neuropsychiatric symptoms simultaneously [7]. Their clusterization into distinct domains based on their frequency of co-occurrence allowed the definition of distinct behavioral endophenotypes [8]. In systematic reviews of studies that applied unbiased approaches to cluster BPSD, the following domains were identified: Affective (anxiety and depression), Disinhibition/Hyperactivity (aggression, impulsivity, and motor hyperactivity), Apathy and Psychosis (hallucinations, delusions, and paranoia) [3,8,9]. However, the debate about the definition of an appropriate clusterization in dementia is still ongoing [3]. More importantly, the studies available to date are characterized by a high heterogeneity, also because a certain number of symptoms (i.e., apathy, sleep disorders, eating disturbances) are not adequately grouped [3].
The susceptibility to BPSD is somewhat unclear as well as the molecular link between BPSD and AD. Within this complex of aetiological interplay, genetic background has been considered one of the key players involved in predisposing patients to specific behavioral and psychological manifestations in AD [10]. Multiple genes, prevalently involved in the processes of neurotransmission/neurodevelopment, have been assessed for their putative influence on BPSD risk, whose findings have been often inconsistent (for review [10]). For instance, the Catechol-O-Methyltransferase (COMT) gene was investigated in five published papers, four of which were conducted by the same authors [11,12,13,14], and the association found with “frontal”/cognitive and “psychosis” endophenotypes was weak. COMT protein is one of the major enzymes involved in the synaptic dopamine catabolism and, thus, has a crucial role in the prefrontal cortex. The well-known functional single nucleotide polymorphism (SNP) is characterized by a G to A transition at codon 108/158 (soluble/membrane-bound COMT) resulting in a valine-to-methionine substitution, giving rise to a significant, three-to-four-fold reduction in its enzymatic activity. The presence of valine (H allele = high activity) in the coding sequence corresponds dose-dependently with reduced prefrontal dopamine levels, leading subsequently to the upregulation of striatal dopamine activity [15].
On the other hand, the Apolipoprotein E (APOE) gene, the main recognized genetic risk factor for late-onset AD (LOAD) (allele ε4) [16], seems to give more consistent results, with the well-known alleles ε4 and ε2 associated with specific BPSD symptoms (for review [10]).
Thus, further new biological and molecular mechanisms could be involved in BPSD genetics architecture. For instance, COMT also regulates the folate pathway [17]. Folate is a cofactor in one-carbon metabolism, where it promotes the remethylation of homocysteine (Hcy). Numerous studies associate the folate deficiency and the resultant increase of Hcy levels with AD [18]. Interestingly, circulating Hcy levels in AD patients with and without BPSD were higher compared to the control subjects, and the plasma Hcy concentration in AD patients with BPSD was the highest among the three considered groups [19]. Hyperhomocysteinemia has been also correlated with psychosis and depression [20,21,22]. The Methylene tetrahydrofolate reductase (MTHFR) gene, whose genetic defects lead to hyperhomocysteinemia, could be a good and new candidate in the aetiopathogenetic mechanisms of BPSD. Within this gene, the two most commonly studied SNPs are the C677T (rs1801133) and the A1298C (rs1801131). The T allele of the C677T polymorphism provokes the synthesis of an athermolabile variant of the enzyme leading to a reduced enzymatic activity, which in turn produce an increase in the blood Hcy levels [23,24]. Recent findings supported that this allele was associated with an increased risk of LOAD [25,26], and correlated with a significant increase of Hcy levels [27,28]. Concerning the A1298C, the C allele results in a reduced enzymatic activity, but does not influence its thermolability [29,30].
Based on this rationale, in this study we analyzed an Italian cohort of AD patients in order to: 1. define the clinical distribution of BPSD symptoms through the characterization of single BPSD symptoms as well as of endophenotype clusters; 2. confirm and clarify the aetiopathogenetic effect of APOE and COMT variants in relation to both single symptoms and behavioral endophenotypes, selecting functional polymorphisms such as rs429358 (Cys130Arg) and rs7412 (Arg176Cys) and Val108/158Met, respectively [15,16]; 3. evaluate for the first time the putative involvement of MTHFR in single BPSD symptoms and likewise behavioral endophenotypes, selecting functional polymorphisms such as C677T (rs1801133) and the A1298C (rs1801131) [23,24,29,30]; 4. highlight for individual symptoms and endophenotypes a “single gene” involvement and/or a “genexgene” interaction of APOE, COMT, and MTHFR.

2. Materials and Methods

2.1. Sample and Clinical Evaluation

The study was approved by the Local Ethics Committee (IRCCS Istituto Centro San Giovanni di Dio Fatebenefratelli, Brescia, Italy, n. 6/2006) and conducted in accordance with local clinical research regulations. Written informed consent was obtained from all participants.
AD subjects (n = 362) were recruited from the Alzheimer Unit of the IRCCS Istituto Centro San Giovanni di Dio Fatebenefratelli, Brescia, Italy. All patients were unrelated Caucasian subjects residing in Northern Italy with an Italian origin descent for at least two generations. All of them were assessed at their admittance with a complete sociodemographic and clinical data collection (cognitive, behavioral, neurological, functional, and physical abilities). A multidisciplinary clinical examination was performed and the diagnosis of probable AD was established based on criteria of the “National Institute of Neurological and Communicative Disorders” and the “Stroke-Alzheimer’s disease and Related Disorders Association” [31]. To assess cognitive decline, the Mini Mental State Examination (MMSE) test was used [32], in addition to the Cumulative Illness Rating Scale for Geriatrics (CIRS-G) [33]; function abilities were evaluated with the Basic Activity Daily Living (BADL), and the Instrumental Activity Daily Living (IADL) scales [34,35].
BPSD were assessed with the Neuropsychiatric Inventory (NPI) scale [36], a fully structured interview exploring 12 behavioral and neuropsychiatric domains (i.e., delusions, hallucinations, agitation/aggression, disphoria/depression, anxiety, apathy, irritability, euphoria, disinhibition, aberrant motor behavior, sleep behavior disturbances, besides appetite and eating abnormalities). It specifically provides an individual score for each explored cognitive domain specifically obtained by multiplying the severity of symptoms (1 = mild; 2 = moderate; 3 = severe) with their frequencies (4-point scale from 1 = occasionally to 4 = very frequently, more than once a day). The NPI then yields a domain rating of frequency times severity (range = 0–12). In agreement with a group of expert clinicians, each of the 12 behavioral/neuropsychiatric symptoms was classified in three groups, according to the “severity*frequency” score: 1—symptom-free (NPI = 0); 2—with low “severity*frequencies” score (NPI from 1 to 4); 3—with high “severity*frequencies” score (NPI from 6 to 12). Moreover, NPI provides a total score that globally evaluates the 12 domains for a complete clinical picture given by the sum of the individual scores (defining a range from 0 to 144).
The adopted exclusionary criteria for subjects were: (a) A history of schizophrenia, schizoaffective disorder, delusional disorder, mood disorder with psychotic features, major depressive disorder, substance use disorder, or mental retardation according to The Diagnostic and Statistical Manual of Mental Disorders (DSM-IV) criteria; (b) severe cerebrovascular disorders, hydrocephalus and intra-cranial mass, documented by Computed Tomography or Magnetic Resonance Imaging within the past 12 months; (c) abnormalities in serum folate and Vitamin B12, syphilis serology or altered thyroid hormone levels; (d) a history of traumatic brain injury or other neurological diseases (e.g., Parkinson’s Disease, Huntington Disease, seizure disorders); (e) current acute or poorly controlled medical problems (e.g., poorly controlled diabetes or hypertension; cancer within the past five years; clinically significant hepatic, renal, cardiac or pulmonary disorders); (f) absence of knowledgeable informant who could properly report information regarding the patient’s behavior.

2.2. Genetic Analysis

Genomic DNA (gDNA) was extracted from peripheral blood with the PureGene genomic DNA isolation kit (Gentra Systems, Minneapolis, MN, USA). The obtained gDNA was quantified by spectrophotometric quantification using the NanoDrop microvolume sample retention system (Thermo Fisher Scientific, Waltham, MA, USA) [37]. In order to verify the possible degradation, all samples were analyzed on a 0.8% agarose gel electrophoresis and a long Polymerase Chain Reaction (PCR) protocol was developed for exploring genetic variability in MTHFR, COMT, and APOE.
In all samples, the MTHFR [rs1801133 (C677T) and rs1801131 (A1298C)], COMT [rs4680 (Val158Met)], and APOE [rs429358 (Cys130Arg) and rs7412 (Arg176Cys)] polymorphisms were genotyped by using the SNaPshot assay [38]. Briefly, 100 ng of gDNA of each sample were amplified in the GeneAmp PCR System 9700 (Applied Biosystems, Foster City, CA, USA), and the PCR-amplification products were used as a template in a SNaPshot Multiplex assay performed according to the manufacturer’s instructions. Finally, samples were analyzed, and the allele peak determination was performed on an ABI 3130xl Genetic Analyzer. Electrophoresis results were analyzed using the GeneMapper ID software v4.0 (Applied Biosystems, Foster City, CA, USA).

2.3. Statistical Analyses

All statistical analyses were conducted by using the SPSS version 23.0 (SPSS Inc., Chicago, IL, USA). The Hardy-Weinberg equilibrium (HWE) was calculated using an online calculator (http://www.husdyr.kvl.dk/htm/kc/popgen/genetik/applets/kitest.htm) for the presence of multiallelic genotypes.

2.3.1. Principal Component Analysis (PCA)

In the first exploratory phase, the set of symptoms from the NPI scale was factorially analyzed to identify possible underlying latent variables. The Principal Component Analysis (PCA) method and Varimax rotation were performed. The number of factors was determined on the basis of eigenvalues greater than one of the Pearson’s correlation matrix, and by sharp breaks in the size of the eigenvalues using a scree plot [39]. Symptom-factor correlations, (i.e., factor loading) being greater than 0.40 in absolute value were chosen to identify a simple factor structure (i.e., factors with non-overlapping clusters of symptoms).

2.3.2. Classification and Regression Tree (CART) Analysis for Single BPSD Symptoms and Endophenotypes

The Classification and Regression Tree (CART) analysis using the exhaustive Chi-squared Automatic Interaction Detector (CHAID) algorithm was performed to explore the interaction between single BPSD symptoms as well as endophenotypes and all polymorphisms in APOE, MTHFR, and COMT genes in the BPSD cohort [40,41]. Specifically, we performed the analyses considering ε4 carriers (ε2ε4 + ε3ε4 + ε4ε4 genotypes) versus the others indicated as APOE ε4 non-carriers (ε2ε3 + ε3ε3 genotypes). APOE allele ε4 carriers, the carriers of both alleles in 677C/T MTHFR, in 1298A/C MTHFR, and in Val108/158Met COMT genes polymorphisms were used as a dominant model of inheritance. Moreover, the comparisons were performed incorporating “Free group” (NPI 0) along with “Low group” (NPI 1–4) versus “High group” (NPI 6–12). This is due to the evidence that “Low group” is present in our population with a frequency < 20%. As this study does not have a longitudinal design, we assumed causality in our CART model [https://www.epa.gov/caddis-vol4/caddis-volume-4-data-analysis-classification-and-regression-tree-cart-analysis].
The exhaustive CHAID data mining algorithm is a nonparametric procedure that makes no assumptions of the underlying data. In the CHAID analysis, nominal, ordinal, and continuous data can be used, where continuous predictors are split into categories with approximately an equal number of observations. CHAID creates all possible cross tabulations for each categorical predictor until the best outcome is achieved and no further splitting can be performed [42]. In the CHAID technique, we can visually see the relationships between the split variables and the associated related factor within the tree. The development of the decision, or classification tree, starts with identifying the target variable or dependent variable, which would be considered the root. CHAID analysis splits the target into two or more categories that are called the initial, or parent nodes, and then the nodes are split using statistical algorithms into child nodes.
The exhaustive CHAID data mining algorithm automatically pruning insignificant nodes in a decision tree was constructed through the IBM SPSS 23 statistical package program. It works on the basis of F test if a continuous dependent variable is used as in our study (endophenotypes), whereas, if the predictor variable has only two categories (single items), the 𝜒2-test for independence is performed for each pair of categories of the predictor variable in relation to the binary target variable. For non-significant outcomes, those paired categories are merged.
Minimum subject numbers for the parent and child nodes were fixed at 20 and 10 for constructing an optimal decision tree structure and improving the predictive performance of the algorithms. A ten-fold cross validation was activated in the study.
Since the analyses were conducted by using decision tree models, it was not needed to have transformed data.
SPSS automatically made a Bonferroni adjustment to calculate the adjusted p-values for the merged categories to control for the Type I error rate.
To exclude the influence of age and gender, we performed the univariate analyses (ANOVA) related to BPSD endophenotypes, including the variables age or gender. Selecting ENDOPHENOTYPES (“Psychosis”, “Hyperactivity”, “Mood”, “Frontal”) as a dependent variable, AGE as covariate, SEX as an independent variable, we did not find any significant association in separate analyses (Table S1—gender and Table S2—age, Supplementary Materials). The only significant association was observed in the “Mood” endophenotype (Table S1, F = 4.7; p = 0.032); data not confirmed by the exhaustive CHAID data mining algorithm. Thus, given the non-significant analyses, age and sex were not included in the calculations. Medications as well as comorbidity were not included in our analyses.
The Hosmer-Lemeshow goodness of fit test was used to confirm the suitability of the trees. The interactions were given by calculating the sum of the scores relative to “severity*frequencies” of the single BSPD symptoms components as a mean risk ± SD.
The stepwise multiple logistic regression was used to confirm the classification trees.

3. Results

Socio-demographic and clinical features of our Italian AD cohort, as well as the alleles, genotypes, and carriers frequencies of the all polymorphisms in APOE, MTHFR, and COMT genes are shown in Table 1 and Table 2. Table 1 describes also the clinical features according to stratification for gender; whereas in Table 2 we reported the HWE results where no HWE deviation was observed.

3.1. Clinical Characterization according to Single NPI Scores

Three hundred and eight patients were characterized by the NPI scale. Considering the NPI scores and the relative proposed ranges (Table 3), our population was mainly characterized by agitation, irritability, night-time behavior disturbances, and aberrant motor behavior. Within each group, we found that: 52% of AD patients showed higher severity in agitation symptomatology, 48% in irritability, 42% in night-time behavior disturbances and, finally, 39% showed higher severity in aberrant motor behavior.
Slightly less representative in our sample, there were: Apathy (28% higher severity), delusions (29% higher severity), anxiety (25% higher severity), depression (22% higher severity), and hallucinations (21% higher severity).
On the contrary, appetite and eating disturbances were referred in only a minority of patients, while no one presented disinhibition or euphoria according to their caregivers’ reports.

3.2. Clinical Characterization according to Behavioral Endophenotypes

The results of the exploratory factor analysis on BPSD in AD, conducted by PCA and Varimax rotation, are shown in Table 4. Using the criterion of eigenvalues greater than 1 and the scree plot, PCA allowed grouping the 12 explored BPSD symptoms in four endophenotypes. These factors explained the 56% of the total variance of data. Specifically, thanks to this approach, the following clinical categories were established in our cohort: (a) “Psychosis” characterized by delusions, hallucinations, agitation, aberrant motor behavior, and night-time behavioral symptoms; (b) “Hyperactivity” with agitation, irritability, appetite and eating disturbances; (c) “Mood” associated with high loadings on anxiety, depression, and apathy; (d) “Frontal” including disinhibition and euphoria.
The endophenotypes more representative in our population were “Psychosis” (37% higher severity), and “Hyperactivity” (39% higher severity). These were followed by the “Mood” and “Frontal” endophenotypes (Table 5).

3.3. APOE, MTHFR, and COMT Genetic Correlates in Endophenotype Clusterization and in Single BPSD Symptoms

All polymorphisms investigated in this study within the APOE, MTHFR, and COMT genes showed a prevalence comparable to that reported in https://www.alzforum.org/, considering Caucasian Populations (Table 2). Globally, the prevalence of ε2, ε3, and ε4 alleles for the APOE gene was estimated to be 8%, 78%, and 14%, respectively; for rs1801133 MTHFR gene to be 39% (allele T) and 61% (allele C); for rs1801131 MTHFR gene to be 34% (allele C) and 66% (allele A); for Val108/158Met COMT gene to be 49% (allele A) and 51% (allele G).
In order to explore the genetic correlates in both approaches, we exploited the potential of genetic analysis by using the exhaustive CHAID data mining algorithm to reveal “genexgene” interaction as aetiopathogenetic mechanisms in BPSD. The Hosmer-Lemeshow goodness of fit test confirmed the suitability of the trees (Table S3 Supplementary Materials). Moreover, the stepwise multiple logistic regression validated the classification trees (Tables S4 and S5 Supplementary Materials).

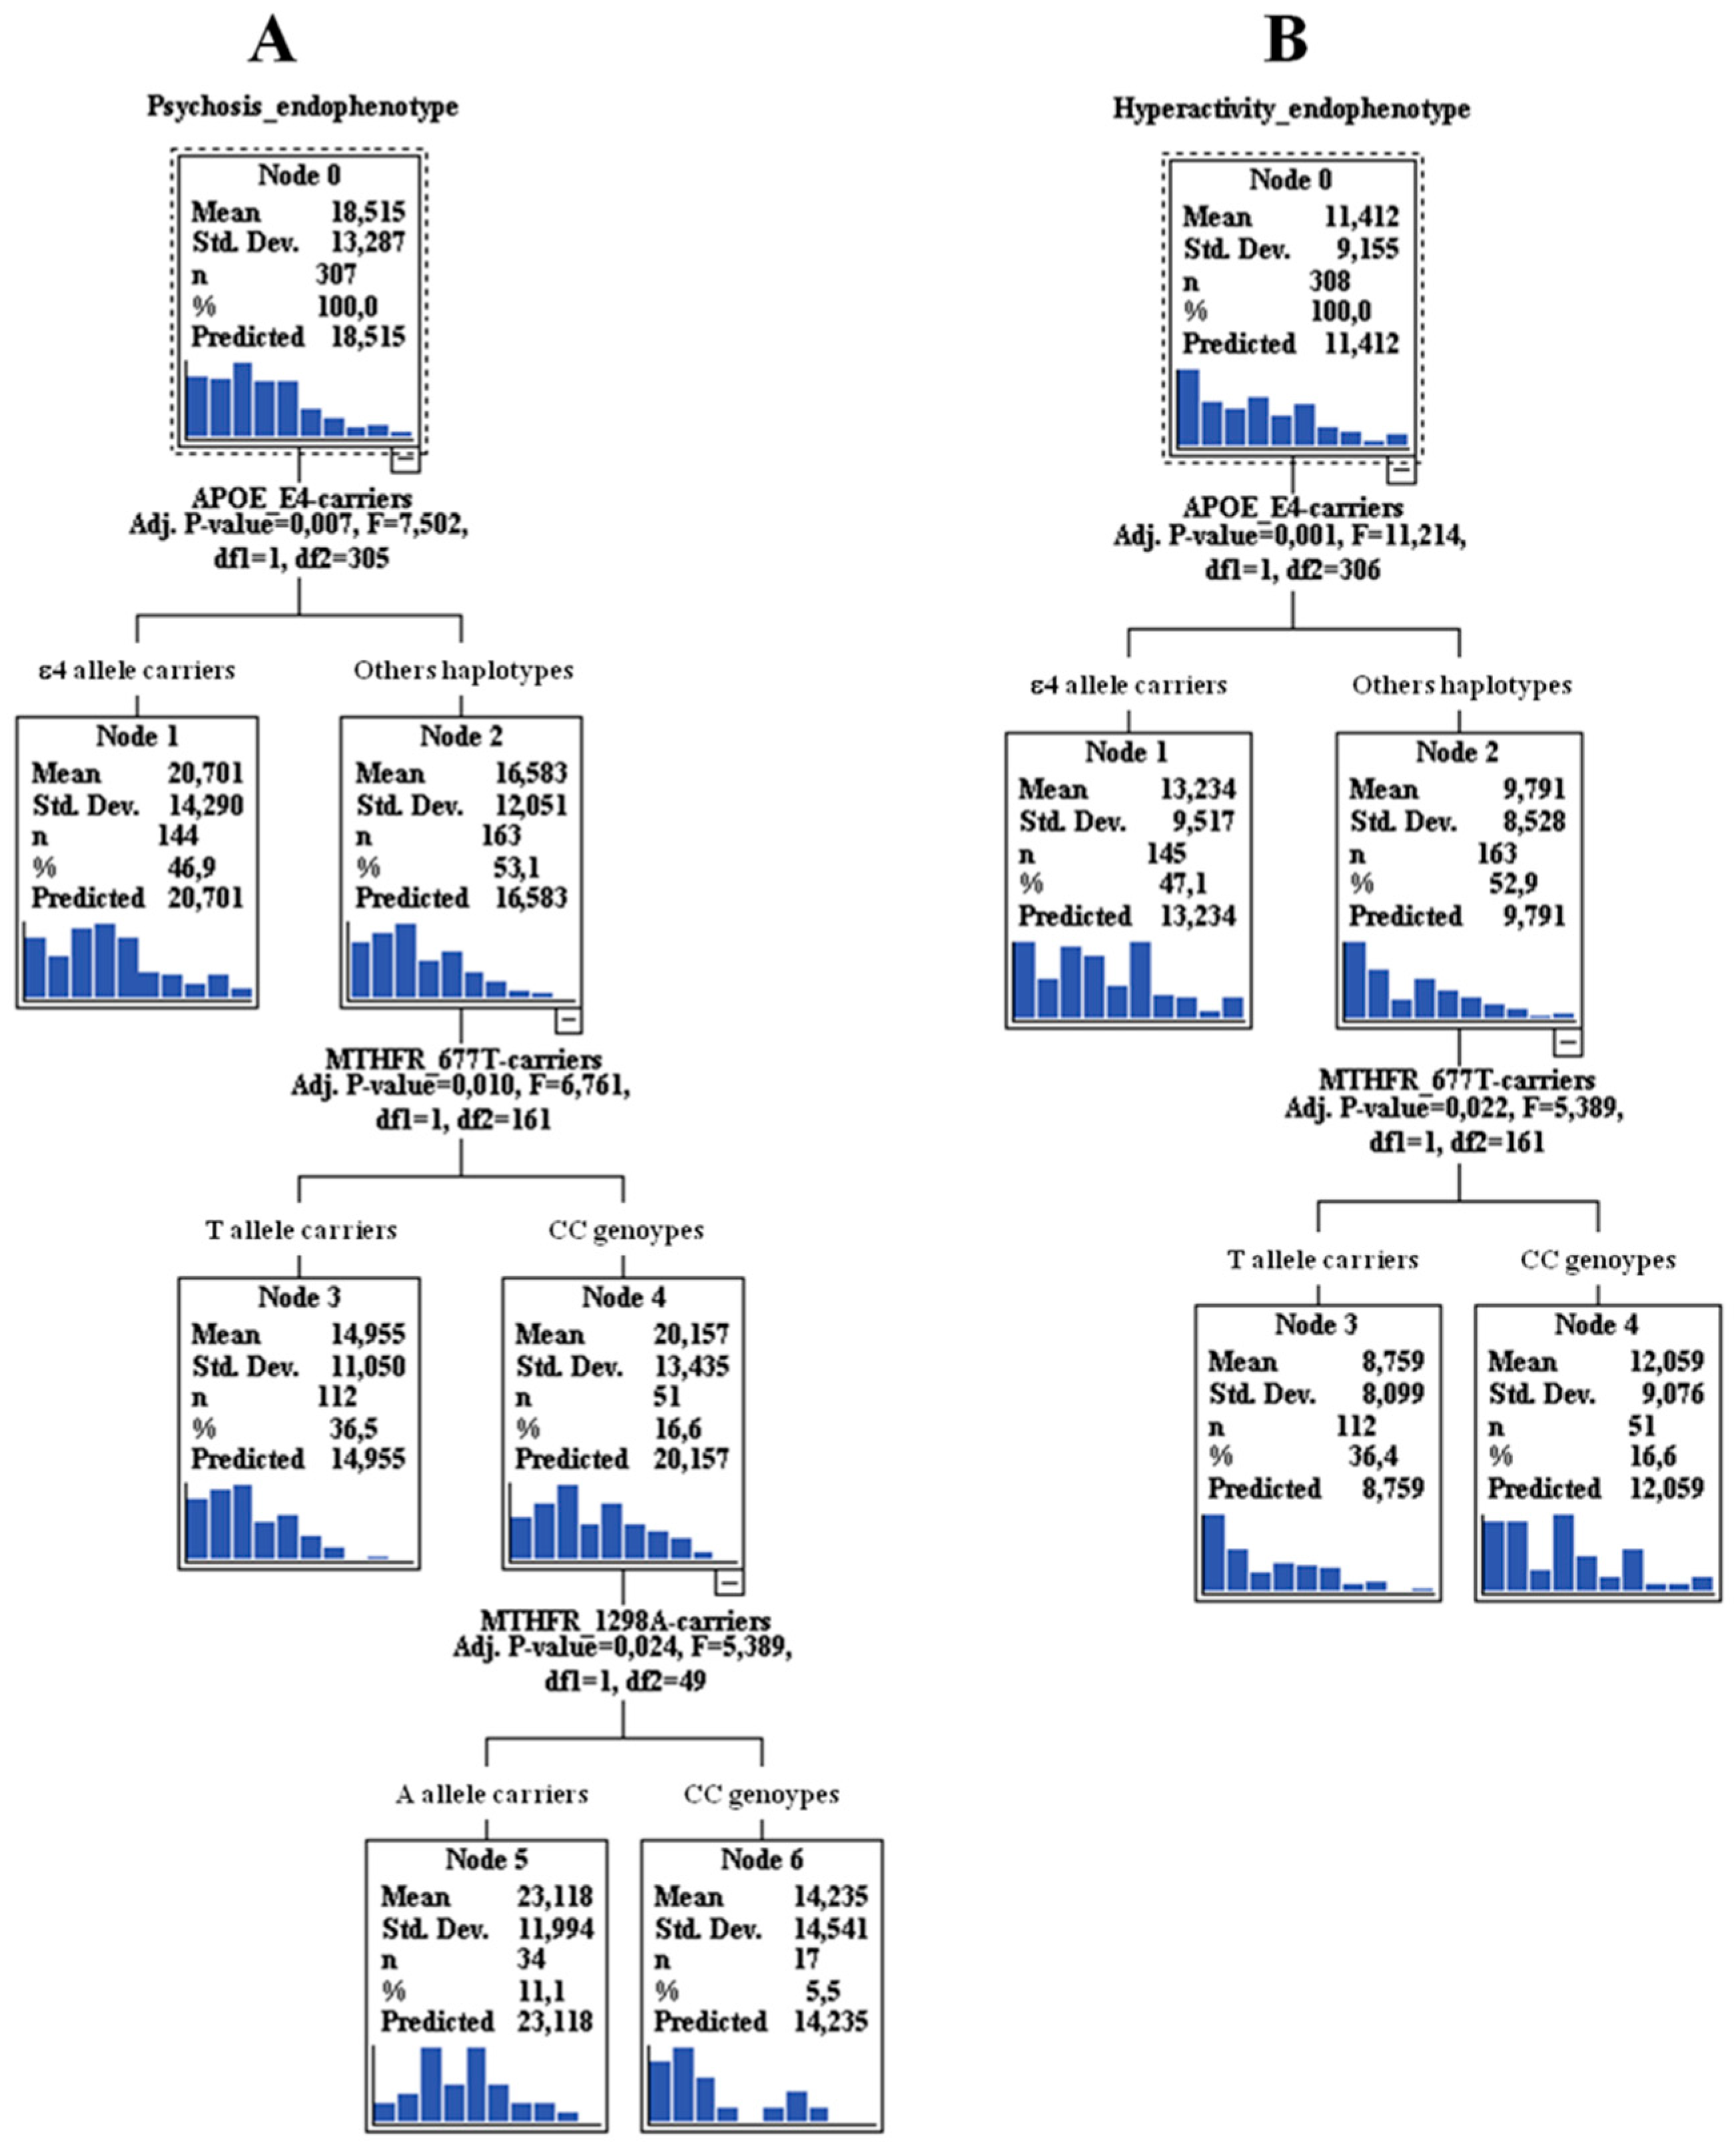
3.3.1. “Genexgene” Interactions in “Psychosis” Endophenotype and the Relative Single BPSD Symptoms

Table 6 reports the main significant results obtained in the genetic analyses performed on single BPSD symptoms. Starting by the agitation, we found that the APOE ε4 allele carriers showed a high risk to develop more severe symptoms (odd ratio (OR) = 1.87, 95% CI: 1.19–2.95). Concerning the aberrant motor behavior, we evidenced similar results with APOE ε4 allele carriers showing higher risk to develop high severity in this symptomatology (OR = 1.91, 95% CI: 1.20–3.04). In relation to MTHFR, we found that the homozygotes CC (C677T) showed a high risk to develop more severe delusions symptoms (OR = 1.75, 95% CI: 1.04–2.94).
On the contrary, no genetic correlates were observed for night-time behavior disturbances.
These results were further represented as decision model trees in Figure S1 (Supplementary Materials).
When we considered the “Psychosis” endophenotype as whole, we confirmed the effect of APOE ε4 allele alone (risk mean = 20.7, 95% CI: 18.5–22.9), but also a “genexgene” interaction with MTHFR for both polymorphisms. In particular, APOE ε4 non-carriers along with the homozygotes CC (C677T) showed a high risk to develop psychosis (risk mean = 20.2, 95% CI: 18.9–29.3), but also with the homozygotes CC (C677T) and with the 1298A allele carriers (risk mean = 23.1, 95% CI: 18.7–27.6) (Figure 1A).

3.3.2. “Genexgene” Interactions in “Hyperactivity” Endophenotype and the Relative Single BPSD Symptoms

For irritability symptoms, no genetic correlates were observed, whereas for agitation, the results are reported above. Although in an unrepresentative sample, a risk role of APOE ε4 allele was found with higher severity in appetite/eating abnormalities (OR = 2.06, 95% CI: 1.14–3.71) (Table 6). These results were further represented in Figure S1 (Supplementary Materials) as decision model trees.
When we consider the “Hyperactivity” endophenotype as a whole, the most significant result is represented by the risk role of APOE ε4 allele (risk mean = 13.2, 95% CI: 11.8–14.7). Moreover, an interaction with the MTHFR C677T CC genotype and APOE ε4 non-carriers was observed (risk mean = 12.1, 95% CI: 9.7–14.4) (Figure 1B).

3.3.3. “Genexgene” Interactions in “Mood”/”Frontal” Endophenotypes and the Relative Single BPSD Symptoms

No significant results were found for these endophenotype as well as for the relative single BPSD symptoms.

4. Discussion

This study wants to deeply define the clinical distribution of BPSD symptoms in an Italian cohort of AD patients by the NPI scale. To the best of our knowledge, this is the largest BPSD cohort investigated until now. In this population, “Psychosis” and “Hyperactivity” endophenotypes as well as “agitation” as single symptoms were revealed to be associated with a high severity in symptomatology. In addition, “Mood” was associated to lower mean values, and, for last there was the “Frontal” endophenotype. As major clinical information, we suggest two combinatorial approaches to characterize a BPSD cohort: through 12 individual symptoms as well as four specific behavioral and neuropsychiatric endophenotypes. This choice allows us to overcome the limitations linked to a single methodological approach, bringing to light the interconnected aspects of the complex pathogenic mechanisms of BPSD. Moreover, we strongly propose analyzing the genetic correlates also in relation to single BPSD symptoms as well as to BPSD endophenotypes. This represents a valid strategy for expanding the knowledge about the aetiopathogenetic mechanisms of BPSD. There is more. We strongly suggest the use of both strategies also in relation to the genetic approach “single gene” involvement/“genexgene” interaction, because this contributes to clarifying deeply the complex genetic architecture underlying BPSD. The main results obtained in this work are represented by the involvement of APOE as a “single gene” in the modulation of the severity in agitation, also reflected in ”Psychosis” as well as in “Hyperactivity” endophenotypes, and in aberrant motor behavior. Moreover, we found the involvement of APOE also in the “genexgene” interaction with MTHFR (both polymorphisms) as risk factors for “Psychosis”. MTHFR as a “single gene” was associated to higher severity of delusions. This implicates that specific functional variants in APOE and MTHFR genes can impact on the relative proteins’ translation and thus on their activity [16,23,24,29,30], to influence specific BPSD traits. No associations or minor relevant results include the “Frontal” endophenotype (euphoria and disinhibition) and the relation between APOE and appetite/eating abnormalities.
Neuropsychiatric symptoms are frequent in dementia and contribute significantly for burden caregiver and illness costs. Correct identification and evaluation of these symptoms is a crucial part of the clinical approach to dementia. Despite the added value and tentative efforts to group different symptoms into clusters (to facilitate clinical/diagnostic/treatments investigations), there is not yet an established model. Cerejeira et al., 2012 [3] reviewed different studies showing the heterogeneity in the clusterization of behavioral endophenotypes, even though a certain concordance can be found. Delusions and hallucinations have been consistently grouped in “Psychosis”. A distinct “Mood” or “Affective” cluster (depression and anxiety) has been suggested, in accordance with our study. On the contrary, some studies support that apathy and depression are distinct phenomena and belong to different neuropsychiatric syndromes, whereas others group both symptoms in the same factor [3], as in our case study. The frequencies of BPSD symptoms in the AD population can change [43]. As reported in Deardorff and Grossberg, 2019 [43], apathy is the most common BPSD symptom in AD (49%), followed by depression (42%), agitation and aggression (40%), psychosis (delusions, 31% and hallucinations, 16%), and sleep disturbances (39%). Such a distribution is different as compared to our BPSD/AD cohort.
These discrepancies could be related to different factors. First of all, the distribution of BPSD symptoms is strongly linked to differences in patient populations, their ethnicity, and composition (for instance whether the patients are affected by AD or by other neurodegenerative disorders). A small sample size is an important limitation. This study represents the larger cohort available to date, that permits performing a better stratification according to BPSD symptoms, where the range of symptoms has been precisely defined, besides being crucial to detect significant genetic associations. Indeed, genome-wide association studies and studies examining copy number variations performed in AD and psychosis have detected only suggestive underpowered associations in intronic SNPs (review in [44,45]). Moreover, individual symptoms evolve differently over the course of dementia. Notwithstanding the general impression that the overall level of psychopathology increases with dementia severity, they have a tendency to wax and wane, their severity fluctuating over time. For this reason, longitudinal studies are required to achieve significant insights into the evolution of BPSD during the course of disease [3]. Finally, the choice of setting for patient recruitment is a further important selection bias: Nursing home dwellers, inpatients, or patients treated in an ambulatory setting. The most inclusive population-based studies recruit “real-life” patients, making the results much more practical, although at a price of numerous medical, environmental, and drug-related confounders [10]. In our case, we have recruited patients from the department of our hospital, who in the majority of cases, enter for a control of BPSD. Thus, for definition, they are affected by disorders with a more prevalent “agitated” symptomatology rather than “apathy”.
If age is the greatest risk factor for AD, the ε4 allele of the APOE is the greatest genetic risk factor for LOAD [16]. ε4 carriers showed higher severity in agitation symptoms, grouping in “Hyperactivity”/”Psychosis” endophenotypes. The single association with agitation is confirmed in different studies, including recent reviews [10,46,47]. Based on neuroimaging studies, agitation is associated with volume loss in the frontal cortex, circulate cortex, insula, amygdala, and hippocampus [48]. Neurochemically, agitation is associated with decreased cholinergic activity in the frontal and temporal cortex. Interestingly, AD patients carrying the APOE ε4 allele show a more profound loss in cholinergic activity in the hippocampus and the cortex, and in neuroimaging studies the presence of the APOE ε4 allele was associated with a greater rate of hippocampal, cortical, and whole-brain atrophy [10]. On the other hand, there are also negative studies, reporting no associations of this gene with agitation [49]. These findings, thus, further emphasize the importance of sub-grouping BPSD in distinct neuropsychiatric syndromes. In fact, we found an association of APOE also within “Hyperactivity”/”Psychosis” endophenotypes. We therefore support the evidence on the role played by the allele ε4 as a risk factor in these endophenotypes, along with the importance of the BPSD clusterization.
The ε4 carriers showed also higher severity in aberrant motor behavior, the finding was confirmed also in other different studies [50,51,52], where they demonstrated that the APOE ε4 status increased the tendency toward this symptom.
Another more significant result of this work regarding the “genexgene” interactions between APOE and MTHFR (both polymorphisms) as risk factors for higher severity in the “Psychosis” endophenotype, underlies the important role played by MTHFR as a single gene in delusions (genotype CC of C677T). This interaction was observed also in “Hyperactivity”. What is highlighted from the CART analysis, is that also the other APOE ε4 non carriers can play a role, and this is performed through the interactions with the CC genotype (C677T) and/or 1298A allele carriers. Different studies supported the epistatic effect between MTHFR and APOE on cognitive performance in the elderly but also in AD [53,54,55]. Moreover, plasma homocysteine concentrations are associated with increased amyloid-β (Aβ) deposition in the brain [28]. Although this effect was supported, no studies are available to confirm this interaction also in the psychosis/hyperactivity dimension. The most probable hypotheses behind this result could be that MTHFR contributes to the regulation of relin [56], whose expression is decreased in the hippocampus of subjects suffering from schizophrenia and major depressive disorder (MDD) [57]. Relin binds to the receptor for APOE, and might thus similarly modulate glutamatergic neurotransmission, altered in psychosis. Moreover, a significant positive correlation of serum homocysteine levels was found with delusions [58].
In relation to COMT as a “single gene”, we did not confirm the results reported by Borroni et al., 2006 [12,13]. Further studies are needed to clarify the role of this gene, that seems to be less relevant as compared to the findings found for APOE and MTHFR genes, also in their interaction.
If we select in PubMed the following keywords “BPSD-gene-Alzheimer”, we found 32 results where the studies have been actively published until 2013, from 2013 to 2020 there are only seven works performed on the genetics of BPSD. To date, the classic limitations linked to genetic studies remain and there is still the necessity of: larger cohorts with appropriate assessment tools and statistical methods with correction for multiple testing. There are limitations regarding inconsistent data in genome-wide association studies with prevalently intronic SNPs detection and presence of confounders influencing the associations. In this study, appropriate statistical tools such as the exhaustive CHAID data mining algorithm were used allowing to obtain the adjusted p-values for multiple testing, and where age and sex did not influence the calculations. The only variable not included in our analyses was “Medications”. Medications as well as comorbidity are clinical information extremely heterogeneous in a BPSD population, including our cohort (Table 1). To include “Medications” or “Comorbidity” as variables in the statistical analyses would result in being overly complex, especially in a sample of sample sizes such as ours. Thus, we suggest that future studies should consider these variables, but starting from homogeneous groups for medications and for comorbidity, on which then to investigate the genetic correlates.
Although aware that further studies are still needed, we want to ignite the enthusiasm and encourage more research to deepen the etiopathogenetic mechanisms of BPSD in AD, starting by a well-defined BPSD population, appropriate statistical methods with multiple corrections, larger sample, and “genexgene” and possibly “genexenvironment” interactions. This permits not only to facilitate a clinical/diagnostic assessment, but also and mainly to define appropriate treatments chosen that, to date, represent the major concern for the clinicals.

5. Conclusions

We strongly suggest the combined use of both BPSD single symptoms/endophenotypes and the “genexgene” interactions as valid strategies for expanding the knowledge about the BPSD aetiopathogenetic mechanisms.

Supplementary Materials

The following are available online at https://www.mdpi.com/2075-4426/10/3/90/s1, Table S1: Univariate Analysis of Variance in our BPSD cohort: Tests of Between-Subjects Effects for Gender variable and BPSD endophenotypes, Table S2: Univariate Analysis of Variance in our BPSD cohort: Tests of Between-Subjects Effects for Age variable and BPSD endophenotypes, Table S3: Hosmer-Lemeshow goodness of fit test in single BSPD symptoms. Table S4: Stepwise multiple logistic regression for “Psychosis” endophenotype, Table S5: Stepwise multiple logistic regression for “Hyperactivity” endophenotype, Figure S1: Exaustive CHAID data mining algorithm analysis results (“gene × gene” interaction) for single BPSD symptoms according to different values of “severity*frequencies”.

Author Contributions

Conceptualization, C.S., M.C., and C.B.; data curation, M.C. and C.B.; formal analysis, M.C., C.M., and C.B.; investigation, C.B.; project administration, C.B.; validation, C.S. and C.B.; writing—review and editing, C.S., M.C., C.M., C.G., O.Z., M.G., and C.B. All authors have read and agreed to the published version of the manuscript.

Funding

This research was supported by grants from the Italian Ministry of Health [Ricerca Corrente].

Conflicts of Interest

The authors declare no conflict of interest.

References

  1. McKhann, G.M.; Knopman, D.S.; Chertkow, H.; Hyman, B.T.; Jack, C.R., Jr.; Kawas, C.H.; Klunk, W.E.; Koroshetz, W.J.; Manly, J.J.; Mayeux, R.; et al. The diagnosis of dementia due to Alzheimer’s disease: Recommendations from the National Institute on Aging-Alzheimer’s Association workgroups on diagnostic guidelines for Alzheimer’s disease. Alzheimers Dement. 2011, 7, 263–269. [Google Scholar] [CrossRef] [Green Version]
  2. Haupt, M.; Kurz, A.; Janner, M. A 2-year follow-up of behavioural and psychological symptoms in Alzheimer’s disease. Dement. Geriatr. Cogn. Disord. 2000, 11, 147–152. [Google Scholar] [CrossRef] [PubMed]
  3. Cerejeira, J.; Lagarto, L.; Mukaetova-Ladinska, E.B. Behavioral and psychological symptoms of dementia. Front. Neurol. 2012, 3, 73. [Google Scholar] [CrossRef] [PubMed] [Green Version]
  4. Cloak, N.; Al Khalili, Y. Behavioral and Psychological Symptoms in Dementia (BPSD); StatPearls Publishing LLC: Treasure Island, FL, USA, 2020. [Google Scholar]
  5. Angelucci, F.; Spalletta, G.; di Iulio, F.; Ciaramella, A.; Salani, F.; Colantoni, L.; Varsi, A.E.; Gianni, W.; Sancesario, G.; Caltagirone, C.; et al. Alzheimer’s disease (AD) and Mild Cognitive Impairment (MCI) patients are characterized by increased BDNF serum levels. Curr. Alzheimer Res. 2010, 7, 15–20. [Google Scholar] [CrossRef] [PubMed]
  6. Finkel, S.I.; Costa e Silva, J.; Cohen, G.; Miller, S.; Sartorius, N. Behavioral and psychological signs and symptoms of dementia: A consensus statement on current knowledge and implications for research and treatment. Int. Psychogeriatr. 1996, 8, 497–500. [Google Scholar] [CrossRef] [PubMed]
  7. Frisoni, G.B.; Rozzini, L.; Gozzetti, A.; Binetti, G.; Zanetti, O.; Bianchetti, A.; Trabucchi, M.; Cummings, J.L. Behavioral syndromes in Alzheimer’s disease: Description and correlates. Dement. Geriatr. Cogn. Disord. 1999, 10, 130–138. [Google Scholar] [CrossRef]
  8. van der Linde, R.M.; Dening, T.; Matthews, F.E.; Brayne, C. Grouping of behavioural and psychological symptoms of dementia. Int. J. Geriatr. Psychiatry 2014, 29, 562–568. [Google Scholar] [CrossRef] [Green Version]
  9. Mushtaq, R.; Pinto, C.; Tarfarosh, S.F.; Hussain, A.; Shoib, S.; Shah, T.; Shah, S.; Manzoor, M.; Bhat, M.; Arif, T. A Comparison of the Behavioral and Psychological Symptoms of Dementia (BPSD) in Early-Onset and Late-Onset Alzheimer’s Disease-A Study from South East Asia (Kashmir, India). Cureus 2016, 8, e625. [Google Scholar] [CrossRef] [Green Version]
  10. Flirski, M.; Sobow, T.; Kloszewska, I. Behavioural genetics of Alzheimer’s disease: A comprehensive review. Arch. Med. Sci. 2011, 7, 195–210. [Google Scholar] [CrossRef]
  11. Borroni, B.; Agosti, C.; Archetti, S.; Costanzi, C.; Bonomi, S.; Ghianda, D.; Lenzi, G.L.; Caimi, L.; Di Luca, M.; Padovani, A. Catechol-O-methyltransferase gene polymorphism is associated with risk of psychosis in Alzheimer Disease. Neurosci. Lett. 2004, 370, 127–129. [Google Scholar] [CrossRef]
  12. Borroni, B.; Grassi, M.; Agosti, C.; Archetti, S.; Costanzi, C.; Cornali, C.; Caltagirone, C.; Caimi, L.; Di Luca, M.; Padovani, A. Cumulative effect of COMT and 5-HTTLPR polymorphisms and their interaction with disease severity and comorbidities on the risk of psychosis in Alzheimer disease. Am. J. Geriatr. Psychiatry 2006, 14, 343–351. [Google Scholar] [CrossRef] [PubMed]
  13. Borroni, B.; Grassi, M.; Agosti, C.; Costanzi, C.; Archetti, S.; Franzoni, S.; Caltagirone, C.; Di Luca, M.; Caimi, L.; Padovani, A. Genetic correlates of behavioral endophenotypes in Alzheimer disease: Role of COMT, 5-HTTLPR and APOE polymorphisms. Neurobiol. Aging 2006, 27, 1595–1603. [Google Scholar] [CrossRef] [PubMed]
  14. Borroni, B.; Grassi, M.; Costanzi, C.; Zanetti, M.; Archetti, S.; Franzoni, S.; Caimi, L.; Padovani, A. Haplotypes in cathechol-O-methyltransferase gene confer increased risk for psychosis in Alzheimer disease. Neurobiol. Aging 2007, 28, 1231–1238. [Google Scholar] [CrossRef] [PubMed]
  15. Akil, M.; Kolachana, B.S.; Rothmond, D.A.; Hyde, T.M.; Weinberger, D.R.; Kleinman, J.E. Catechol-O-methyltransferase genotype and dopamine regulation in the human brain. J. Neurosci. 2003, 23, 2008–2013. [Google Scholar] [CrossRef] [Green Version]
  16. Lewandowski, C.T.; Maldonado Weng, J.; LaDu, M.J. Alzheimer’s disease pathology in APOE transgenic mouse models: The Who, What, When, Where, Why, and How. Neurobiol. Dis. 2020, 139, 104811. [Google Scholar] [CrossRef]
  17. Muller, T. Catechol-O-methyltransferase enzyme: Cofactor S-adenosyl-L-methionine and related mechanisms. Int. Rev. Neurobiol. 2010, 95, 49–71. [Google Scholar]
  18. Seshadri, S.; Beiser, A.; Selhub, J.; Jacques, P.F.; Rosenberg, I.H.; D’Agostino, R.B.; Wilson, P.W.; Wolf, P.A. Plasma homocysteine as a risk factor for dementia and Alzheimer’s disease. N. Engl. J. Med. 2002, 346, 476–483. [Google Scholar] [CrossRef]
  19. Zheng, Z.; Wang, J.; Yi, L.; Yu, H.; Kong, L.; Cui, W.; Chen, H.; Wang, C. Correlation between behavioural and psychological symptoms of Alzheimer type dementia and plasma homocysteine concentration. BioMed Res. Int. 2014, 2014, 383494. [Google Scholar] [CrossRef]
  20. Reif, A.; Pfuhlmann, B.; Lesch, K.P. Homocysteinemia as well as methylenetetrahydrofolate reductase polymorphism are associated with affective psychoses. Prog. Neuro-psychopharmacol. Biol. Psychiatry 2005, 29, 1162–1168. [Google Scholar] [CrossRef]
  21. Monji, A.; Yanagimoto, K.; Maekawa, T.; Sumida, Y.; Yamazaki, K.; Kojima, K. Plasma folate and homocysteine levels may be related to interictal "schizophrenia-like" psychosis in patients with epilepsy. J. Clin. Psychopharmacol. 2005, 25, 3–5. [Google Scholar] [CrossRef]
  22. Vogel, T.; Dali-Youcef, N.; Kaltenbach, G.; Andres, E. Homocysteine, vitamin B12, folate and cognitive functions: A systematic and critical review of the literature. Int. J. Clin. Pract. 2009, 63, 1061–1067. [Google Scholar] [CrossRef] [PubMed]
  23. Frosst, P.; Blom, H.J.; Milos, R.; Goyette, P.; Sheppard, C.A.; Matthews, R.G.; Boers, G.J.; den Heijer, M.; Kluijtmans, L.A.; van den Heuvel, L.P. A candidate genetic risk factor for vascular disease: A common mutation in methylenetetrahydrofolate reductase. Nat. Genet. 1995, 10, 111–113. [Google Scholar] [CrossRef] [PubMed]
  24. Rozen, R. Genetic predisposition to hyperhomocysteinemia: Deficiency of methylenetetrahydrofolate reductase (MTHFR). Thromb. Haemost. 1997, 78, 523–526. [Google Scholar] [CrossRef] [PubMed]
  25. Rai, V. Methylenetetrahydrofolate Reductase (MTHFR) C677T Polymorphism and Alzheimer Disease Risk: A Meta-Analysis. Mol. Neurobiol. 2017, 54, 1173–1186. [Google Scholar] [CrossRef]
  26. Stoccoro, A.; Tannorella, P.; Salluzzo, M.G.; Ferri, R.; Romano, C.; Nacmias, B.; Siciliano, G.; Migliore, L.; Coppede, F. The Methylenetetrahydrofolate Reductase C677T Polymorphism and Risk for Late-Onset Alzheimer’s disease: Further Evidence in an Italian Multicenter Study. J. Alzheimers Dis. 2017, 56, 1451–1457. [Google Scholar] [CrossRef]
  27. Hu, Q.; Teng, W.; Li, J.; Hao, F.; Wang, N. Homocysteine and Alzheimer’s Disease: Evidence for a Causal Link from Mendelian Randomization. J. Alzheimers Dis. 2016, 52, 747–756. [Google Scholar] [CrossRef]
  28. Roussotte, F.F.; Hua, X.; Narr, K.L.; Small, G.W.; Thompson, P.M. Alzheimer’s Disease Neuroimaging Initiative The C677T variant in MTHFR modulates associations between brain integrity, mood, and cognitive functioning in old age. Biol. Psychiatry Cogn. Neurosci. Neuroimaging 2017, 2, 280–288. [Google Scholar]
  29. van der Put, N.M.; Gabreels, F.; Stevens, E.M.; Smeitink, J.A.; Trijbels, F.J.; Eskes, T.K.; van den Heuvel, L.P.; Blom, H.J. A second common mutation in the methylenetetrahydrofolate reductase gene: An additional risk factor for neural-tube defects? Am. J. Hum. Genet. 1998, 62, 1044–1051. [Google Scholar] [CrossRef] [Green Version]
  30. Weisberg, I.; Tran, P.; Christensen, B.; Sibani, S.; Rozen, R. A second genetic polymorphism in methylenetetrahydrofolate reductase (MTHFR) associated with decreased enzyme activity. Mol. Genet. Metab. 1998, 64, 169–172. [Google Scholar] [CrossRef]
  31. McKhann, G.; Drachman, D.; Folstein, M.; Katzman, R.; Price, D.; Stadlan, E.M. Clinical diagnosis of Alzheimer’s disease: Report of the NINCDS-ADRDA Work Group under the auspices of Department of Health and Human Services Task Force on Alzheimer’s Disease. Neurology 1984, 34, 939–944. [Google Scholar] [CrossRef] [Green Version]
  32. Folstein, M.F.; Folstein, S.E.; McHugh, P.R. “Mini-mental state”. A practical method for grading the cognitive state of patients for the clinician. J. Psychiatr. Res. 1975, 12, 189–198. [Google Scholar] [CrossRef]
  33. Miller, M.D.; Paradis, C.F.; Houck, P.R.; Mazumdar, S.; Stack, J.A.; Rifai, A.H.; Mulsant, B.; Reynolds, C.F., 3rd. Rating chronic medical illness burden in geropsychiatric practice and research: Application of the Cumulative Illness Rating Scale. Psychiatry Res. 1992, 41, 237–248. [Google Scholar] [CrossRef]
  34. Katz, S.; Downs, T.D.; Cash, H.R.; Grotz, R.C. Progress in development of the index of ADL. Gerontologist 1970, 10, 20–30. [Google Scholar] [CrossRef] [PubMed]
  35. Lawton, M.P.; Brody, E.M. Assessment of older people: Self-maintaining and instrumental activities of daily living. Gerontologist 1969, 9, 179–186. [Google Scholar] [CrossRef] [PubMed]
  36. Cummings, J.L.; Mega, M.; Gray, K.; Rosenberg-Thompson, S.; Carusi, D.A.; Gornbein, J. The Neuropsychiatric Inventory: Comprehensive assessment of psychopathology in dementia. Neurology 1994, 44, 2308–2314. [Google Scholar] [CrossRef] [PubMed] [Green Version]
  37. Desjardins, P.; Conklin, D. NanoDrop microvolume quantitation of nucleic acids. J. Vis. Exp. 2010, 45, 2565. [Google Scholar] [CrossRef] [Green Version]
  38. Ingelsson, M.; Shin, Y.; Irizarry, M.C.; Hyman, B.T.; Lilius, L.; Forsell, C.; Graff, C. Genotyping of apolipoprotein E: Comparative evaluation of different protocols. Curr. Protoc. Hum. Genet. 2003, 38, 9–14. [Google Scholar] [CrossRef]
  39. Gorsuch, R. Factor Analysis; Erlbaum: Hillsdale, NJ, USA, 1983. [Google Scholar]
  40. Breiman, L.; Friedman, J.; Stone, C.J.; Olshen, R.A. Classification and Regression Trees; CRC Press: Boca Raton, FL, USA, 1984. [Google Scholar]
  41. Zhang, H.; Bonney, G. Use of classification trees for association studies. Genet. Epidemiol. 2000, 19, 323–332. [Google Scholar] [CrossRef]
  42. Biggs, D.; De Ville, B.; Suen, E. A method of choosing multiway partitions for classification and decision trees. J. Appl. Stat. 1991, 18, 49–62. [Google Scholar] [CrossRef]
  43. Deardorff, W.J.; Grossberg, G.T. Behavioral and psychological symptoms in Alzheimer’s dementia and vascular dementia. Handb. Clin. Neurol. 2019, 165, 5–32. [Google Scholar]
  44. Shah, C.; DeMichele-Sweet, M.A.; Sweet, R.A. Genetics of psychosis of Alzheimer disease. Am. J. Med. Genet. B Neuropsychiatr. Genet. 2017, 174, 27–35. [Google Scholar] [CrossRef] [PubMed] [Green Version]
  45. DeMichele-Sweet, M.A.A.; Weamer, E.A.; Klei, L.; Vrana, D.T.; Hollingshead, D.J.; Seltman, H.J.; Sims, R.; Foroud, T.; Hernandez, I.; Moreno-Grau, S.; et al. Genetic risk for schizophrenia and psychosis in Alzheimer disease. Mol. Psychiatry 2018, 23, 963–972. [Google Scholar] [CrossRef] [PubMed]
  46. Panza, F.; Frisardi, V.; Seripa, D.; D’Onofrio, G.; Santamato, A.; Masullo, C.; Logroscino, G.; Solfrizzi, V.; Pilotto, A. Apolipoprotein E genotypes and neuropsychiatric symptoms and syndromes in late-onset Alzheimer’s disease. Ageing Res. Rev. 2012, 11, 87–103. [Google Scholar] [CrossRef] [PubMed]
  47. Ruthirakuhan, M.; Lanctot, K.L.; Di Scipio, M.; Ahmed, M.; Herrmann, N. Biomarkers of agitation and aggression in Alzheimer’s disease: A systematic review. Alzheimers Dement. 2018, 14, 1344–1376. [Google Scholar] [CrossRef]
  48. Rosenberg, P.B.; Nowrangi, M.A.; Lyketsos, C.G. Neuropsychiatric symptoms in Alzheimer’s disease: What might be associated brain circuits? Mol. Asp. Med. 2015, 43–44, 25–37. [Google Scholar] [CrossRef] [Green Version]
  49. Banning, L.C.P.; Janssen, E.P.C.J.; Hamel, R.E.G.; de Vugt, M.; Kohler, S.; Wolfs, C.A.G.; Oosterveld, S.M.; Melis, R.J.F.; Olde Rikkert, M.G.M.; Kessels, R.P.C.; et al. Determinants of Cross-Sectional and Longitudinal Health-Related Quality of Life in Memory Clinic Patients Without Dementia. J. Geriatr. Psychiatry Neurol. 2019, 33, 256–264. [Google Scholar] [CrossRef]
  50. Garcia-Segura, M.E.; Fischer, C.E.; Schweizer, T.A.; Munoz, D.G. APOE varepsilon4/varepsilon4 Is Associated with Aberrant Motor Behavior Through Both Lewy Body and Cerebral Amyloid Angiopathy Pathology in High Alzheimer’s Disease Pathological Load. J. Alzheimers Dis. 2019, 72, 1077–1087. [Google Scholar] [CrossRef]
  51. Oliveira, F.F.; Chen, E.S.; Smith, M.C.; Bertolucci, P.H. Associations of cerebrovascular metabolism genotypes with neuropsychiatric symptoms and age at onset of Alzheimer’s disease dementia. Braz. J. Psychiatry. 2017, 39, 95–103. [Google Scholar] [CrossRef] [Green Version]
  52. Steinberg, M.; Corcoran, C.; Tschanz, J.T.; Huber, C.; Welsh-Bohmer, K.; Norton, M.C.; Zandi, P.; Breitner, J.C.; Steffens, D.C.; Lyketsos, C.G. Risk factors for neuropsychiatric symptoms in dementia: The Cache County Study. Int. J. Geriatr. Psychiatry 2006, 21, 824–830. [Google Scholar] [CrossRef]
  53. Polito, L.; Poloni, T.E.; Vaccaro, R.; Abbondanza, S.; Mangieri, M.; Davin, A.; Villani, S.; Guaita, A. High homocysteine and epistasis between MTHFR and APOE: Association with cognitive performance in the elderly. Exp. Gerontol. 2016, 76, 9–16. [Google Scholar] [CrossRef]
  54. Durmaz, A.; Kumral, E.; Durmaz, B.; Onay, H.; Aslan, G.I.; Ozkinay, F.; Pehlivan, S.; Orman, M.; Cogulu, O. Genetic factors associated with the predisposition to late onset Alzheimer’s disease. Gene 2019, 707, 212–215. [Google Scholar] [CrossRef] [PubMed]
  55. Yi, J.; Xiao, L.; Zhou, S.Q.; Zhang, W.J.; Liu, B.Y. The C677T Polymorphism of the Methylenetetrahydrofolate Reductase Gene and Susceptibility to Late-onset Alzheimer’s Disease. Open Med. 2019, 14, 32–40. [Google Scholar] [CrossRef] [PubMed]
  56. Chen, Z.; Schwahn, B.C.; Wu, Q.; He, X.; Rozen, R. Postnatal cerebellar defects in mice deficient in methylenetetrahydrofolate reductase. Int. J. Dev. Neurosci. 2005, 23, 465–474. [Google Scholar] [CrossRef] [PubMed]
  57. Fatemi, S.H.; Earle, J.A.; McMenomy, T. Reduction in Reelin immunoreactivity in hippocampus of subjects with schizophrenia, bipolar disorder and major depression. Mol. Psychiatry 2000, 5, 654–663. [Google Scholar] [CrossRef] [PubMed] [Green Version]
  58. Soni, R.M.; Tiwari, S.C.; Mahdi, A.A.; Kohli, N. Serum Homocysteine and Behavioral and Psychological Symptoms of Dementia: Is There Any Correlation in Alzheimer’s Disease? Ann. Neurosci. 2019, 25, 152–159. [Google Scholar] [CrossRef]
Figure 1. Exhaustive Chi-squared Automatic Interaction Detector (CHAID) data mining algorithm analysis results (“genexgene” interaction) for “Psychosis” (A) and “Hyperactivity” (B) endophenotypes. Note: Mean ± SD is given by the sum of the scores relative to “severity*frequencies” of the endophenotype components. For other haplotypes, we meant “APOE ε4 non-carriers”.
Jpm 10 00090 g001
Table 1. Clinical features of our Alzheimer’s Disease Italian cohort, stratified according to gender.
Gender (F/M)241/121FemaleMale
Age (years)80.5 ± 7.080.9 ± 7.179.7 ± 6.7
Schooling (years)6.0 ± 3.65.4 ± 2.97.4 ± 4.4
MMSE, total score11.7 ± 7.312.0 ± 6.910.9 ± 8.1
Onset (years)76.1 ± 7.976.5 ± 8.175.4 ± 7.6
Illness Duration (years)4.5 ± 2.94.4 ± 2.64.5 ± 3.5
BMI22.3 ± 4.122.2 ± 4.222.5 ± 3.8
IADL7.2 ± 1.57.4 ± 1.26.8 ± 1.9
BADL3.7 ± 1.93.6 ± 1.93.8 ± 1.8
Tinetti19.8 ± 5.419.8 ± 5.219.6 ± 5.9
CIRS12.7 ± 9.712.2 ± 9.513.8 ± 10.0
Hypertension27.9%29.5%24.8%
Cardiopathy28.7%26.1%33.9%
Hypercholesterolemia4.7%5.8%2.5%
Diabetes6.6%5.4%9.1%
Psychiatric diseases26.0%27.4%23.1%
AChEIs20.2%21.6%17.4%
Neuroleptics45.5%41.1%51.2%
Antidepressants45.6%46.9%43.0%
Benzodiazepines/hypnotics41.4%46.1%32.2%
Note: The measurement data are expressed as mean ± standard deviation (mean ± SD) or in percentual (%). MMSE: Mini-Mental State Examination; BMI: Body max index; IADL: Instrumental activities daily living; BADL: Basic activities of daily living; Tinetti; CIRS: Cumulative illness rating scales; AChEIs: Acetylcholinesterase inhibitors.
Table 2. Genetic distribution of our Alzheimer’s Disease Italian cohort for APOE, MTHFR, and COMT genes polymorphisms.
APOE Haplotypes
(rs429358 and rs7412)
MTHFR
(rs1801133: C677T)
MTHFR
(rs1801131: A1298C)
COMT
(rs4680: V158M)
HWEχ2 = 0.91p = 0.92HWEχ2 = 1.70p = 0.19HWEχ2 = 0.53p = 0.47HWEχ2 = 1.22p = 0.27
AllelesNfreqAllelesNfreqAllelesNfreqAllelesNfreq
ɛ2200.03T3140.43A4990.69A3300.46
ɛ35100.70C4100.57C2250.31G3940.54
ɛ41940.27
total7241.00total7241.00total7241.00total7241.00
GenotypesNfreqGenotypesNfreqGenotypesNfreqGenotypesNfreq
ɛ2 ɛ3160.04TT620.17AA1690.47AA700.19
ɛ2 ɛ440.01TC1900.52AC1610.44AG1900.52
ɛ3 ɛ31780.49CC1100.30CC320.09GG1020.28
ɛ3 ɛ41380.38
ɛ4 ɛ4260.07
total3621.00total3621.00total3621.00total3621.00
ɛ2 carriers200.06T carriers2520.70A carriers3300.91A carriers2600.72
ɛ3 carriers3320.92C carriers3000.83C carriers1930.53G carriers2920.81
ɛ4 carriers1680.46
Note: APOE: Apolipoprotein E; MTHFR: Methylenetetrahydrofolate Reductase; COMT: Catechol-O-Methyltransferase; HWE: Hardy-Weinberg equilibrium.
Table 3. Clinical distributions of single Behavioral and Psychological Symptoms of Dementia (BPSD) in our Italian Alzheimer’s Disease cohort.
“Severity*Frequencies” Groups
N Subjects (%) &
Symptoms (“Severity*Frequencies” = 0–12)Mean ± SD §Free Low High
(NPI 0)(NPI 1–4)(NPI 6–12)
Agitation4.96 ± 4.32102 (33.0)47 (15.2)160 (51.8)
Irritability4.57 ± 4.25109 (35.4)52 (16.9)147 (47.7)
Night-time behavior disturbances4.22 ± 4.55136 (44.0)44 (14.2)129 (41.7)
Aberrant motor behavior4.12 ± 4.72148 (48.2)39 (12.7)120 (39.1)
Apathy3.03 ± 4.19178 (58.0)42 (13.7)87 (28.3)
Delusions3.00 ± 4.00166 (54.1)52 (16.9)89 (29.0)
Anxiety2.53 ± 4.10200 (65.4)30 (9.8)76 (24.8)
Depression2.50 ± 3.90185 (60.3)53 (17.3)69 (22.5)
Hallucination2.30 ± 3.55187 (60.9)55 (17.9)65 (21.2)
Appetite and eating disturbances1.94 ± 3.59223 (72.2)28 (9.1)58 (18.8)
Disinhibition0.93 ± 2.44253 (82.4)28 (9.1)26 (8.5)
Euphoria0.12 ± 0.86299 (97.4)6 (2.0)2 (0.7)
NPI, total score (0–144)34.1 ± 22.6
NPI, n symptoms4.9 ± 2.4
Note: § Mean ± standard deviation (SD) of the scores relative to “severity*frequencies” of the single items. & Number (N) and percentage (%) of subjects present in each group (Free, Low, and High) compared to individual symptoms. Free: “severity*frequencies” score (NPI 0) for all the individual symptoms; Low: “severity*frequencies” score (NPI 1–4) for all the individual symptoms; High: “severity*frequencies” score (NPI 6–12) for all the individual symptoms.
Table 4. Principal component analysis (PCA) of the Behavioral and Psychological Symptoms of Dementia (BPSD) in our Italian Alzheimer’s Disease cohort.
SymptomsEndophenotype Components
Factor 1 Factor 2Factor 3Factor 4
MoodHyperactivityPsychosisFrontal
Delusions0.2760.3720.4630.144
Hallucination0.0220.0110.6900.248
Agitation0.0580.6540.4680.068
Depression0.8550.0580.1660.089
Anxiety0.8200.0620.1560.075
Euphoria−0.040−0.1090.1860.766
Apathy0.5790.292−0.212−0.184
Disinhibition0.1310.376−0.1660.687
Irritability0.0280.6450.3670.119
Aberrant motor behavior0.1040.3730.402−0.157
Night-time behavior disturbances0.0290.0560.621−0.087
Appetite and eating disturbances0.1910.671−0.1570.014
Note: Extraction method: Principal component analysis. Rotation Method: Varimax with Kaiser normalization. Coefficients with values over 0.4 are italicized and in bold.
Table 5. Clinical distributions of behavioral endophenotypes in our Italian Alzheimer’s Disease cohort.
Mean of N Subjects ± SD £
(% Mean of N Subjects ± SD) $
Endophenotypes
(Components; “Severity*Frequencies” Range)
Mean ± SD §FreeLowHigh
Psychosis (Delusions, Hallucination, Agitation, Aberrant motor behavior, Night-time behavior disturbances; 0–60)18.5 ± 13.3148 ± 32 (48.0 ± 10.5)47 ± 6 (15.4 ± 2.1)113 ± 37 (36.6 ± 11.8)
Hyperactivity (Agitation, Irritability, Appetite and eating disturbances; 0–36)11.4 ± 9.2145 ± 68 (46.9 ± 22.0)42 ± 13 (13.7 ± 4.1)122 ± 56 (39.4 ± 18.0)
Mood (Depression, Anxiety, Apathy; 0–36)8.1 ± 9.4188 ± 11 (61.2 ± 3.8)42 ± 12 (13.6 ± 3.7)77 ± 9 (25.0 ± 3.0)
Frontal (Euphoria, Disinhibition; 0–24)1.0 ± 2.7276 ± 33 (89.9 ± 10.6)17 ± 16 (5.5 ± 5.1)14 ± 17 (4.6 ± 5.5)
Note: § Mean ± standard deviation (SD) of the scores relative to “severity*frequencies” of the endophenotype components. Free: NPI = 0 for all the individual components involved in the endophenotype; Low: Sum of the “severity*frequencies” score (NPI 1–4) for all the individual components involved in the endophenotype; High: Sum of the “severity*frequencies” score (NPI 6–12) for all the individual components involved in the endophenotype. £ Mean number of subjects N ± SD present in each group (Free, Low, and High) compared to individual endophenotypes. $ Percentage (%) of the mean of the number of subjects (N ± SD) present in each group (Free, Low, and High) compared to individual endophenotypes.
Table 6. Genetic correlates related to single BPSD symptoms in our Italian Alzheimer’s Disease cohort according to different values of “severity*frequencies” (exhaustive CHAID data mining algorithm).
GeneFree + Low &High &
N (Freq.)N (Freq.)
AgitationAPOE χ2 = 7.435, padjusted = 0.006
OR = 1.87; 95% CI: 1.19–2.95
Ɛ4-carriers58 (0.39)86 (0.54)
Ɛ4-non-carriers91 (0.61)72(0.46)
total149 (1.00)158 (1.00)
Aberrant motor behaviorAPOE χ2 = 7.553, padjusted = 0.006
OR = 1.91; 95% CI: 1.20–3.04
4-carriers76 (0.41)68 (0.57)
Ɛ4-non-carriers111 (0.59)52 (0.43)
total187 (1.00)120 (1.00)
DelusionsMTHFR χ2 = 4.363, padjusted = 0.037
OR = 1.75; 95% CI: 1.04–2.94
CC 59 (0.27)35 (0.39)
Genotypes_C677T159 (0.73)54 (0.61)
T-carriers_C677T218 (1.00)89 (1.00)
Appetite/eating abnormalitiesAPOE χ2 = 5.922, padjusted = 0.015
OR = 2.06; 95% CI: 1.14–3.71
Ɛ4-carriers109 (0.44)35 (0.60)
Ɛ4-non-carriers141 (0.56)22 (0.40)
total250 (1.00)57 (1.00)
Note: & Free + Low: “severity*frequencies” scores (NPI 0–4) for all individual symptoms; High: “severity*frequencies” scores (NPI 6–12) for all the individual symptoms. OR: Odd ratio.

