Abstract
Background: Prostate cancer (PC) is the most frequently diagnosed cancer among men worldwide. The poor prognosis of PC is largely due to late diagnosis of the disease when it has progressed to advanced stages marked by androgen-independence. We interrogated proteomic signatures that embody the transition of PC from an androgen-dependent (AD) to an androgen-independent (AI) state. Methods: We have previously established AD and AI murine PC cell lines, PLum-AD and PLum-AI, respectively, which recapitulate primary and progressive PC at phenotypic and subcellular levels. We statistically surveyed global protein expression profiles in these cell lines. Differential profiles were functionally interrogated by pathways and protein–protein interaction network analyses. Results: Protein expression pattern analysis revealed a total of 683 proteins, among which 99 were significantly differentially altered in PLum-AI cells as compared to PLum-AD cells (45 increased and 54 decreased). Principal component analysis (PCA) revealed that the two different cell lines clearly separated apart, indicating a significant proteome expression difference between them. Four of the proteins (vimentin, catalase, EpCAM, and caspase 3) that were differentially expressed in PLum-AI cells compared to PLum-AD cells were subjected to biochemical validation by Western blotting. Biological process gene ontology (GO) analysis of the differentially expressed proteins demonstrated enrichment of biological functions and pathways in PLum-AI cells that are central to PI3 kinase and androgen receptor pathways. Besides, other relevant biological processes that are enriched in PLum-AI cells included cell adhesion and cell migration processes, cell and DNA damage, apoptosis, and cell cycle regulation. Conclusions: Our protein expression analysis of a murine in vitro model of PC progression identified differential protein spots that denote this progression and that comprise high-potential targets for early treatment of PC with a personalized patient-specific approach. Efforts are underway to functionally assess the potential roles of these proteins as therapeutic targets for PC progression.
1. Introduction
Prostate cancer (PC) is the most frequently diagnosed cancer among men worldwide and the second leading cause of male deaths from cancer globally [1]. It is an indolent tumor that grows unhurriedly but poses significant threat to patients’ lives on the long-term [2]. Evidence showed that during early androgen-dependent stages of the disease, tumor cells are mainly influenced by androgen production as a major mediator for their growth and survival using several axes [3,4,5,6]; therefore, patients with primary androgen-dependent PC respond well to androgen-deprivation therapy (ADT) [5,7,8]. However, the disease progresses over time in around one fifth of patients to a metastatic and advanced androgen-independent stage known as castration-resistant prostate cancer (CRPC) [9]. Upon progression, tumor cells tailor different cellular pathways and mechanisms to survive the androgen-depleted environment [8]. Proven mechanisms of such adaptation include androgen receptor (AR) gene amplification, AR gene mutations, involvement of AR co-regulators such as AR-associated proteins, ligand-independent activation of the AR, and the involvement of cancer stem cells (CSCs) [10,11,12,13].
Management of advanced PC propounds substantial challenges and various therapeutic approaches are then considered including radical prostatectomy (RP) surgery, chemotherapy, and radiation therapy [14]. In this regard, the success rates of the different therapeutic modalities used for treating PC can be greatly improved if the disease is diagnosed at an early stage [15]. Currently, there are no reliable and effective biomarkers for PC that can specifically distinguish patients from healthy individuals, and patients who need aggressive therapy to stop progression of their disease from those who should avoid overtreatment [15,16], which paves the way to personalized patient-specific therapy. Therefore, efforts have been made in order to identify the parameters that accurately predict the prognosis and clinical outcome following RP, which can greatly aid in planning for the appropriate postoperative therapy that should be used in each patient [17]. Those parameters include clinicopathological factors, such as prostate specific antigen (PSA), Gleason score (GS), and pathological stage, among others [18,19,20,21].
PC progression from androgen-dependence (AD) to androgen-independence (AI) is tightly linked to dismal prognosis, warranting the need for new strategies for early detection and treatment of progressive PC. Detecting the molecular signatures and proteomic aberrations pertaining to this progression will greatly help in understanding the disease and shaping its management accordingly [22,23]. In this regard, protein expression analysis enables the identification of pathways and biological processes that are aberrantly modulated in human diseases and specific phenotypes [24,25,26,27,28,29,30], thus providing a viable framework for underscoring potential biomarkers and therapeutic drug targets [26,31]. Proteomic analysis also offers the capability to screen and uncover the expression levels of tens and hundreds of proteins simultaneously and objectively [32].
We have recently established two murine PC cell lines that represent AD (PLum-AD) and AI (PLum-AI) PC [12]. However, we have a poor understanding of the mechanisms underlying the clinical progression of PC. Therefore, using proteomic analysis and a novel model which we have previously developed signifying the development of AI, we aimed to fill these voids, first by understanding global signaling cues in the progression of AD-to-AI PC and next by identifying from these cues candidate biomarkers for early human PC progression. Such proteomic-based approaches will help researchers set novel strategies to better understand PC and treat PC patients, inaugurating a new era of “personalized medicine”.
2. Materials and Methods
2.1. Cell Lines, Culture Conditions, and Reagents
Mouse PLum-AD (androgen-dependent) and PLum-AI (androgen-independent) PC cells, that were established in our laboratory, were cultivated in PrEBM™ prostate epithelial cell growth basal medium (Lonza, Switzerland; cat #CC-3165) supplemented with PrEBM™ SingleQuots™ supplements (Lonza, Switzerland; cat #CC-4177), as previously described [12]. PLum-AD cells grew in serum-free media while 5% of heat-inactivated fetal bovine serum (FBS; Sigma-Aldrich, St. Louis, MO, USA; cat #F9665) was added to the culture medium of PLum-AI cells. For both cell lines, media was supplemented with 1% penicillin/streptomycin (Biowest, Nuaillé, France; cat #L0022-100) and Plasmocin™ prophylactic (Invivogen; cat #ant-mpp). Cells were incubated at 37 °C in a humidified incubator containing 5% CO2.
Cells were seeded in triplicates in 75 cm2 plates at a density of 5 × 10⁵ cells per plate and cultured for 6–10 days until reaching 80% confluency. Cells were then washed twice with 10 mL of Dulbecco’s phosphate buffered saline (D-PBS) (Sigma-Aldrich, St. Louis, MO, USA; cat #D8537-500ML) and detached by 2.5 mL trypsin–ethylenediaminetetraacetic acid (EDTA) solution (Sigma-Aldrich, St. Louis, MO, USA; cat #T4049). Then, 2.5 mL of fresh culture medium was added to neutralize trypsin. Harvested cells were centrifuged at 900 rpm for 5 min and cell pellets were collected, washed twice with D-PBS, and stored at −20 °C for proteomic analysis.
Formic acid (FA; Sigma-Aldrich, St. Louis, MO, USA; cat #F0507), 1,4-dithiothreitol (DTT; Sigma-Aldrich, St. Louis, MO, USA; cat #D0632), iodoacetamide (IAA; Sigma-Aldrich, St. Louis, MO, USA; cat #I1149), ammonium bicarbonate (ABC; Sigma-Aldrich, St. Louis, MO, USA; cat #09830), and sodium deoxycholate (SDC; Sigma-Aldrich, St. Louis, MO, USA; cat #D6750) were obtained from Sigma-Aldrich (St. Louis, MO, USA). Trypsin/Lys-C mix, mass spectrometry grade was obtained from Promega (Madison, WI, USA; cat #V5071). High-performance liquid chromatography (HPLC) grade methanol (Cat #A452-1), acetonitrile (Cat #A21-1), and water (Cat #W71) were obtained from Thermo Fisher Scientific (San Jose, CA, USA).
The study with all its experimental protocols was conducted under the Institutional Review Board (IRB) approval of the American University of Beirut (AUB) (Date: March 2020; project identification code: WAK2020). The work described herein has been carried out in accordance with relevant guidelines and regulations.
2.2. Protein Extraction, Denaturation, and Digestion
Three biological replicates of cells from PLum-AD and PLum-AI cell lines were suspended in 200 μL of 50 mM ABC buffer (pH 8.0) with 5% SDC and lysed using a beads beating homogenizer (Benchmark Scientific, Edison, NJ, USA) at 4 °C [33]. The beads beating homogenizer was set to 4 rounds, shaking 30 s for each round with a 30 s break between each round to reduce the heat. After beads beating, samples were sonicated using an ultrasonic bath (Thermo Fisher Scientific, San Jose, CA, USA) for 1 h. While sonicating, ice was added into the water to keep the cold temperature (adding ice periodically to ensure they were not completely melted). After sonication, samples were centrifuge at 1000× g for 10 min. Supernatants were collected. Then, a 2 μL of cell lysate was taken out to determine the protein concentration through a Micro BCA Protein Assay Kit (Thermo Fisher Scientific, San Jose, CA, USA). The remaining samples were denatured at 90 °C for 15 min and reduced by 5 mM DTT at 60 °C for 45 min. After reduction, samples were alkylated by IAA at 37 °C for 45 min in the dark. Then, another 5 mM DTT was added to the samples and incubate at 37 °C for 30 min to quench the alkylation reaction. Next, additional ABC buffer was added to the sample to adjust the final concentration of SDC to 0.5%. Then, trypsin/Lys-C mix was added following a 1/25 (enzyme/protein, µg/µg) ratio, and incubated at 37 °C in a water bath for 18 h. After tryptic digestion, 1% FA (final concentration) was added to the samples and vortex thoroughly to precipitate SDC. Then, samples were centrifuged at 21,100× g for 10 min to remove SDC. Supernatants containing digested peptides were dried and ready to be analyzed by LC-MS/MS.
2.3. Liquid Chromatography (LC)–Mass Spectrometer (MS)/MS Analysis
Peptides samples were resuspended in 2% acetonitrile (ACN) (with 0.1% FA) solution and centrifuged at 21,100× g for 10 min before injecting to LC-MS/MS. A Dionex Ulitimate 3000 nanoLC system (Thermo Fisher Scientific, San Jose, CA, USA) and a Linear Trap Quadropole (LTQ) Orbitrap Velos mass spectrometer (Thermo Fisher Scientific, San Jose, CA, USA) were utilized for the proteomic analysis. LC was interfaced with MS via a nanoESI source. Peptides digested from 1 μg of proteome were injected for each sample. An online purification was performed using a trap column (Acclaim PepMap 100 C18, 75 µm I.D. × 2 cm, 3 µm particle sizes, 100 Å pore sizes, Thermo Scientific, San Jose, CA, USA) to remove possible salts and trap the peptides. The separation of peptides was performed on an Acclaim PepMap C18 column (75 µm I.D. × 15 cm, 2 µm particle sizes, 100 Å pore sizes, Thermo Fisher Scientific, San Jose, CA, USA). A 120 min gradients was utilized to separate peptides. The column temperature was set to 29.5 °C. Mobile phase A was 2% ACN in water with 0.1% FA, while mobile phase B was 100% ACN with 0.1% FA. The gradient of mobile phase B was set as following: 0–10 min, 5% B; 10–65 min, 5–20% B; 65–90 min, 20–30% B, 90–110 min, 30–50% B; 110–111 min, 50–80% B; 111–115 min, 80% B; 115–116 min, 80–5% B, and 116–120 min, 5% B.
The resolution of full MS was set to 60,000 with the m/z range of 400–2000. Collision-induced dissociation (CID) was performed for MS/MS scan with a normalized collision energy of 35%, Q-value of 0.25, and activation time of 10 ms. A data-dependent acquisition mode was utilized. The top 10 most intense ions observed in the full MS scan were selected to conduct MS/MS scan. A repeat count of 2, repeat duration of 30 s, exclusion list size of 200, and exclusion duration of 90 s was set for dynamic exclusion.
2.4. Protein Identification and Quantification
LC-MS/MS data were first converted to a general format (*.mgf) using Proteome Discover software, and search against a UniProt database (2014_06, Mus musculus, 16,677 entries) using Mascot software (Matrix Science Inc., Boston, MA, USA). Carbamidomethylation of cysteine was set to be the fix modification while oxidation of methionine was the variable modification. The m/z tolerance of full MS was set to 6 ppm. The m/z tolerance of MS/MS was 0.8 Da. Maximum peptide miss cleavage was set to 2. Peptides identified by Mascot were further verified and quantified using Scaffold software. The peptide and protein identification probabilities were set to 95% and 99%, respectively. A protein identification was accepted only when it contained more than 2 identified peptides. Spectra count was employed as a protein quantitation method. Normalized quantitative values were used to represent the expression levels of proteins in each sample. After Scaffold quantitation, a secondary filter was added to keep the proteins that were detected in at least two replicates.
2.5. Bioinformatics Analysis of the Differentially Abundant Proteins
We used the Search Tool for the Retrieval of Interacting Genes/Proteins database (STRING v11.0) [34] to construct the protein–protein interaction (PPI) network associated with the differentially expressed proteins in PLum-AI vs. PLum-AD cells, by inputting the protein spots into the STRING database (https://string-db.org/). We then determined the relationships among the differentially expressed proteins in PLum-AI cells vs. PLum-AD cells via The Elsevier’s Pathway Studio version 10.0 (Ariadne Genomics, Elsevier) and the Ariadne ResNet database [35,36]. “Subnetwork Enrichment Analysis” (SNEA) was pursued to identify the biological and functional pathways that display statistically significant alterations in PLum-AI cells vs. PLum-AD cells.
2.6. Western Blot Analysis
Cellular protein extracts were prepared in Radio-Immunoprecipitation Assay (RIPA) lysis buffer (Santa Cruz, CA, USA; cat #sc-24948). Protein extracts were quantified using the DC Bio-Rad Protein Assay (Bio-Rad Laboratories, Hercules, CA, USA) according to the manufacturer’s protocol. Protein samples were mixed with 10% β-mercaptoethanol and 2X Laemmli sample buffer (Bio-Rad, CA, USA) for gel electrophoresis. An equal amount of protein lysate was separated on 10% sodium dodecyl sulfate–polyacrylamide gel electrophoresis (SDS–PAGE) for 2h at 90 V then transferred onto 0.45μm nitrocellulose membrane (Bio-Rad, CA, USA) in transfer buffer overnight at 40 °C. Membranes were blocked with 5% skim milk in tris-buffered saline with 0.1% tween 20 (TBST) for 1 h and then incubated overnight at 4 °C with rabbit polyclonal anti-vimentin (1:50 dilution; Santa Cruz Biotechnology, CA, USA), rabbit monoclonal anti-EpCAM (1:200 dilution; Abcam Inc., Cambridge, MA, USA; cat #ab32392), mouse monoclonal anti-catalase (1:1000 dilution; Sigma-Aldrich, St. Louis, MO, USA; cat #C0979), and rabbit monoclonal anti-caspase 3 (1:500 dilution, Cell Signaling Technology, Danvers, MA, USA; cat #9662S). Membranes were then washed three times with TBST and incubated with the diluted (1:1000) Horseradish Peroxidase (HRP)-conjugated secondary antibody (goat anti-mouse (cat #sc-516102) and mouse anti-rabbit (Santa Cruz Biotechnology, CA, USA; cat #sc-2357)) for 1 h at room temperature. Hybridization with glyceraldehyde 3-phosphate dehydrogenase (GAPDH)-HRP (6C5) (1:10,000–20,000; Abnova, Taipei, Taiwan; cat #MAB5476) coupled antibody was performed for 30 min at room temperature as housekeeping gene. Target proteins were detected using the Enhanced Chemiluminescence (ECL) system (Bio-Rad, CA, USA). Images were generated and quantified using ChemiDoc™ Imaging Systems (Bio-Rad, CA, USA).
2.7. Statistical Analysis
One-way ANOVA was employed to investigate the statistical differences between PLum-AD and PLum-AI cell groups (n = 3) using IBM Statistical Package for the Social Sciences (SPSS) Statistics ver. 20.0 (IBM Co., Armonk, NY, USA). Protein expressions were considered altered when p-values were less than 0.05. Fisher’s test was used for SNEA to look for nonrandom associations between the two categorical variables. Data significance in the Western blot experiments was determined using Student’s t-test. p-values of p < 0.05 (*) and p < 0.01 (**) were labeled significant and highly significant, respectively.
3. Results
3.1. Protein Expression Profiles of PLum-AI vs. PLum-AD Cell Lines
LC-MS/MS-based bottom-up proteomics was performed for each cell line. A total of 683 proteins were identified. Proteins that identified in only one replicate were filtered out, and the remaining proteins were utilized for the differential expression analysis. One-way ANOVA was employed to estimate the statistical significance of the differences between PLum-AI and PLum-AD cell lines. Any proteins with p < 0.05 were considered to have the expression change. Overall, 99 proteins exhibited the expression changes between PLum-AI and Plum-AD cell lines (Table 1, Supporting Information Table S1). Figure 1 depicts the expression discrepancy of these proteins.

Table 1.
Altered differential protein spots in the PLum-AI cells vs. PLum-AD cells. A total of 99 altered differential protein spots were identified in PLum-AI cells as compared to PLum-AD cells under significance less than 0.05. (45 increased and 54 decreased, PLum-AI cells vs. PLum-AD cells).
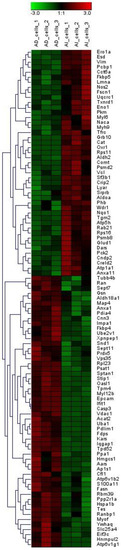
Figure 1.
Heatmap of proteins whose expressions exhibited significant differences between PLum-AI and PLum-AD cells. Expression alterations were observed among these proteins.
Compared to PLum-AD cells, 45 proteins were upregulated in PLum-AI cells while 54 proteins were downregulated. Among them, 8 proteins (Nos2, Oxr1, Pck2, Grb10, Cat, Nqo1, Comt, and Rps11) were only identified in PLum-AI cells (and not in PLum-AD cells) while 12 proteins (Hnrnpul2, Xpnpep1, Hmgcs1, Oasl1, Ifit1, Acat2, Fdps, Epcam, Casp3, Tpd52, Ap1s1, and Atp6v1g1) were exclusively identified in PLum-AD cells (and not in PLum-AI cells).
3.2. Unsupervised Principal Component Analysis (PCA)
PCA is a mathematical method that decreases the dimensions of a complex dataset which contains a series of related independent variables. It can convert the data to a set of principal components through an orthogonal transformation to display the similarity of data groups by plotting points on a map [37]. Figure 2 depicts the PCA analysis of the two cell lines, including their triplicates. Plots having the same color and shape represent the same cell line. The difference between each sample can be observed via primary principal component (PC1) and secondary principal component (PC2). Three triplicates of the same cell line are clustered together, suggesting a satisfactory reproducibility of LC-MS/MS based proteomic analysis in this study. Two different cell lines are clearly separated apart, indicating a significant proteome expression difference between these two cell lines.
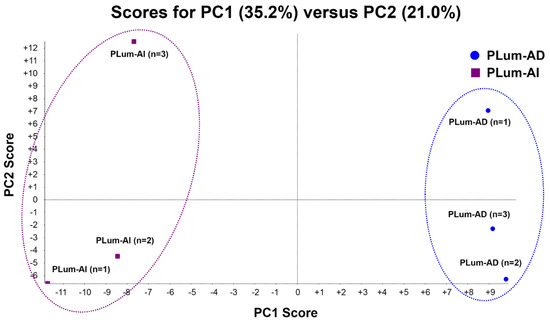
Figure 2.
Principle component analysis (PCA) of protein profiles. PCA projection of protein profiles of PLum-AI and PLum-AD cells obtained from three independent biological samples for each cell line.
3.3. Validation of Some of the Differentially Expressed Proteins in PLum-AI vs. PLum-AD Cells
Four of the proteins that were differentially expressed in PLum-AI cells compared to PLum-AD cells were subjected to biochemical validation by Western blotting. We selected two proteins that were found to be highly upregulated (catalase and vimentin) and two proteins that were highly downregulated (EpCAM and caspase 3) in PLum-AI cells. Selection of those four proteins depended on the availability of their antibodies, literature relevance, and their levels of differential expression. Western blotting results were consistent with the proteomics data where analyses revealed a statistically significant increase in protein expression of catalase and vimentin (p < 0.05; student’s t-test) and a decrease in expression of caspase 3 and EpCAM (p < 0.05; student’s t-test) in PLum-AI cell samples when compared to PLum-AD cells (Figure 3). The densitometry readings/intensity ratio of each band in addition to whole blot (uncropped blots) are included in Supporting Information Figure S1.
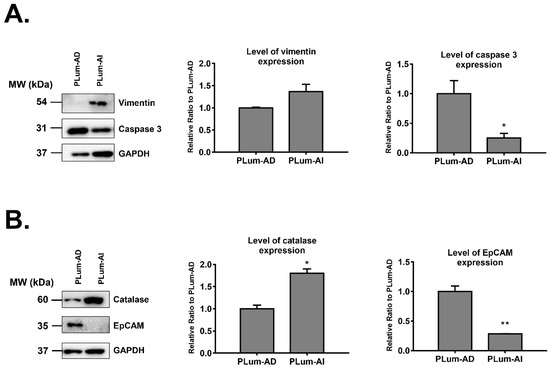
Figure 3.
Western blot validation of four proteins identified by mass spectrometry to be differentially expressed in PLum-AI relative to PLum-AD cells (n = 3). (A) Western blot validation of vimentin and caspase 3 proteins. (B) Western blot validation of catalase and EpCAM proteins. Bands were detected by enhanced chemiluminescence (ECL) using the ChemiDoc MP Imaging System. Protein expression was quantified using Image Lab software, relative to the expression of glyceraldehyde 3-phosphate dehydrogenase (GAPDH), a housekeeping gene equally expressed in treated and non-treated cells/spheres. Results are expressed as relative ratio to control. Data represent an average of three independent experiments. The data are reported as mean ± SEM. (* p < 0.05, ** p < 0.01; PLum-AI cells compared to PLum-AD cells, student independent t-test).
3.4. Construction of the Protein–Protein Interaction (PPI) Network Associated with the Differentially Expressed Proteins in PLum-AI vs. PLum-AD Cells
Using the Search Tool for the Retrieval of Interacting Genes/Proteins database (STRING v11.0) [34], we constructed the protein–protein interaction (PPI) network associated with the differentially expressed proteins in PLum-AI vs. PLum-AD cells. We inserted the list of 99 differentially expressed protein spots as input and allowed the STRING database (https://string-db.org/) to search for neighbor interactors and proteins that possess interactions with the inputted proteins. The PPI network was then built involving all proteins and interactions between them (Figure 4).
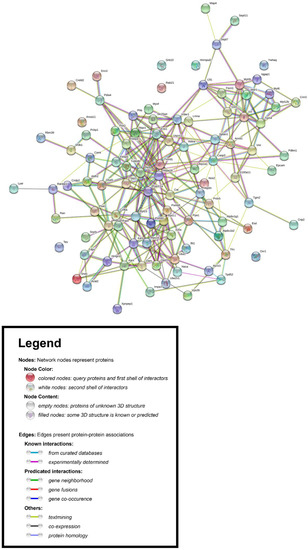
Figure 4.
Protein–protein interaction (PPI) network associated with the differentially expressed proteins in PLum-AI vs. PLum-AD cells. The Retrieval of Interacting Genes/Proteins database (STRING v11.0) [34] was used to construct the PPI network.
3.5. Subnetwork Analyses of Pathways Associated with the Differentially Expressed Proteins in PLum-AI vs. PLum-AD Cells
Global subnetwork analyses of PLum-AI cells in comparison to PLum-AD cells showed differences in the involvement of protein pathways relevant to PC progression (Figure 5 and Figure 6). Indeed, biologically statistically significant protein interaction analysis showed enrichment of biological functions and pathways in PLum-AI cells that are central to cell migration, cell cycle regulation, cell damage, cell survival, DNA damage, and cell adhesion (Figure 5A and Supporting Information Table S2). Targeted analysis of PC interactome in PLum-AI cells vs. PLum-AD cells revealed dysregulation of proteins involved in cell differentiation, cell proliferation, cell cycle, and apoptosis (Figure 5B and Supporting Information Table S3). In addition, biological process gene ontology (GO) enrichment analysis of the differentially expressed proteins demonstrated enrichment of biological functions in PLum-AI cells that are central to PI3 kinase (Figure 6A) and androgen receptor (Figure 6B) pathways (Supporting Information Tables S4 and S5, respectively).
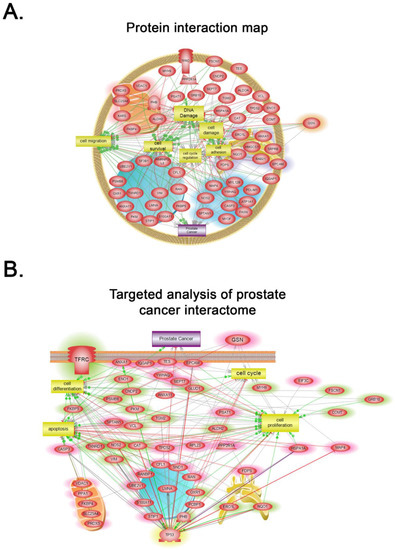
Figure 5.
Systems biology analysis. (A) Biologically statistically significant protein interaction map showing enrichment of biological functions and pathways in PLum-AI cells that are central to cell migration, cell cycle regulation, cell damage, cell survival, DNA damage, and cell adhesion (Supporting Information Table S2). (B) Targeted analysis of prostate cancer interactome in PLum-AI cells vs. PLum-AD cells revealed dysregulation of proteins involved in cell differentiation, cell proliferation, cell cycle, and apoptosis (Supporting Information Table S3). Relationships among the differentially expressed proteins in PLum-AI cells vs. PLum-AD cells were determined using Elsevier’s Pathway Studio version 10.0 (Ariadne Genomics, Elsevier) and the Ariadne ResNet database [35,36].
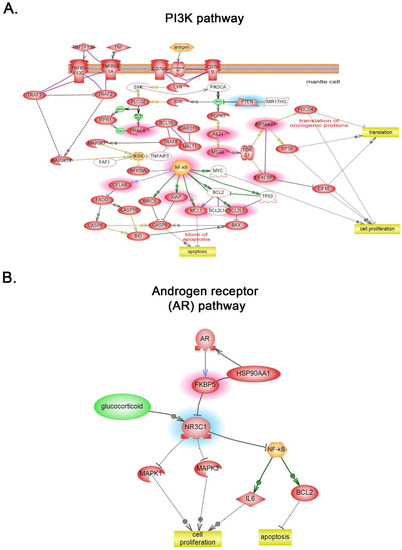
Figure 6.
Global subnetwork analyses. Biological process gene ontology (GO) enrichment analysis of the differentially expressed proteins demonstrated enrichment of biological functions in PLum-AI cells that are central to PI3 kinase (A) and androgen receptor (B) pathways (Supporting Information Tables S4 and S5, respectively). Relationships among the differentially expressed proteins in PLum-AI cells vs. PLum-AD cells were determined using Elsevier’s Pathway Studio version 10.0 (Ariadne Genomics, Elsevier) and the Ariadne ResNet database [35,36].
4. Discussion
This work involves the use of LC-MS/MS-based bottom-up proteomics analysis of two murine PC cell lines that represent the sequence of AD-to-AI PC progression, to identify evolutionarily conserved expression changes in PC progression that could serve as potential biomarkers and therapeutic drug targets. We used our previously developed murine PC cell line models (PLum-AD and PLum-AI cells) that signify the development of androgen independence [12] and harbor the same genetic background (Pten−/−TP53−/−) [38,39]. Our results identified a total of 683 gene products that were differentially expressed between PLum-AI and PLum-AD cells. Among those, 99 were significantly differentially expressed. Global subnetwork analyses revealed differences in the involvement of protein pathways relevant to PC progression and enrichment of biological functions and pathways in PLum-AI cells that are central to cell migration, cell cycle regulation, cell damage, and cell adhesion among other.
Two major hypotheses have been postulated to decipher the mechanisms underlying progression of PC to CRPC: the adaptive mechanism and the selective mechanism [40]. On one hand, the former suggests that this progression might be highly attributed to gene mutations in PC cells, including AR gene amplifications and mutations, dysregulation of gene expression, and involvement of AR co-regulators such as AR-associated proteins [40]. The androgen receptor (AR) is not only important for normal prostate development, but also promotes PC initiation and growth. Investigating its role in the advancement of PC shows that during the androgen-dependent stage, PC cells rely on AR for growth and survival using several axes [3,4]. Later, and upon the progression of cancer to an androgen-independent stage, affected cells tend to tailor different cellular pathways and mechanisms to survive the androgen-depleted environment. In our study, biological process GO enrichment analysis of the differentially expressed proteins in PLum-AI cells relative to PLum-AD cells revealed enrichment of biological functions that are central to the AR pathway (Figure 6B), supporting the ‘‘adaptation’’ model hypothesis. Indeed, this model proposes that castration-resistant cells originate from genetic mutations of previously androgen-dependent cells during conditions of androgen deprivation [41].
On the other hand, the selective mechanism suggests that pre-existing castration-resistant subclones in primary PC tissues and CSC selection dominate CRPC development [40]. This “clonal selection’’ model suggests that castration resistance emerges from a previously quiescent population of rare castration-resistant cells, such as CSCs that are AR negative, and therefore insensitive to androgen deprivation [41]. This subpopulation of androgen-independent CSCs resides within the tumor bulk and has been associated with PC recurrence [8,10,11,12,42]. Interestingly, our results demonstrated upregulation of a number of proteins in PLum-AI cells that are associated with CSCs, suggesting involvement of these cells with CRPC development. For instance, aldehyde dehydrogenase (ALDH)-2 and phosphoenolpyruvate carboxykinase isoform 2 (PCK2) were upregulated in PLum-AI cells compared to PLum-AD cells. Review of the literature reveals that high expression levels of PCK2 are crucial for the metabolic switch and the maintenance of CSCs in PC [43]. Furthermore, ALDHs have been shown to play an important role in the maintenance and survival of CSCs via promoting chemoresistance [44]. ALDH is commonly known to oxidize acetaldehyde to acetate in the pathway of ethanol metabolism. Several stem cells population were shown to exhibit high ALDH activity, including PC stem cells [44]. High ALDH activity was associated with increased expression of putative PC stem cell markers CD44 and integrin α2β1 and was found to be positively correlated with Gleason score and pathologic stage, and inversely associated with patient survival [45,46]. In this context, biological process GO enrichment analysis of the differentially expressed proteins in PLum-AI cells also demonstrated enrichment of biological functions related to the PI3K pathway, which is critical for PC stem-like cell maintenance as previously illustrated by Dubrovska et al. [47]. Importantly, biological functions central to androgen receptor pathways were also enriched in PLum-AI cells, an example of which is the peptidyl-prolyl cis-trans isomerase (FKBP5), a major player in the androgen signaling pathway in PC [48]. Other proteins that have been found to be significantly highly expressed in PLum-AI relative to PLum-AD cells included Comt. Comt is an enzyme responsible for inactivation of endogenous catecholamines and catechol drugs. Comt enzyme activity has been found to be reduced by 4-fold upon substitution of valine (Val) by methionine (Met) at codon 158, hence contributing to the accumulation of mutagenic catechol compounds leading to PC [49,50].
A critical mechanism that embodies development of metastatic CRPC is epithelial-to-mesenchymal transition (EMT) [17,51,52]. This process marks a key step in the invasion and malignant progression of PC and plays a substantial role in therapeutic resistance to antiandrogens and radiotherapy. During EMT, epithelial cells lose their adhesion molecules and gain a motile mesenchymal phenotype [53]. Particularly, EMT is characterized by loss of E-cadherin and decreased expression of cytokeratins and tight junctions, such as zona occludens and occludin, complemented with an increase in mesenchymal markers such as vimentin and N-cadherin [54], rendering cells capable of invading the extracellular matrix (ECM) and metastasize [55,56]. The role of EMT in PC metastasis has been studied [17,56], revealing significant interplay between EMT-related genes and alterations in signaling pathways involved in prostate organogenesis, such as transforming growth factor-beta (TGF-β) [57], epidermal growth factor receptor (EGFR) [58], IL-6 [59,60], AR variants [61,62], fibroblast growth factor (FGF) [63], and Wnt/β-catenin [64,65]. In our study, biologically statistically significant protein interaction analysis of PLum-AI cells showed enrichment of biological functions and pathways that are central to the EMT process. Indeed, we found upregulation of vimentin (mesenchymal marker) and downregulation of epithelial cell adhesion molecule (EpCAM) (epithelial marker) proteins in PLum-AI cells at the proteomics level and validated them using Western blotting analysis. Fascin, another marker expressed widely in mesenchymal tissues and associated with aggressive PC, was upregulated in PLum-AI cells at the proteomics level [66]. Taken together, these results signify activation of the EMT process in PLum-AI cells that represent advanced CRPC.
5. Conclusions
Decoding the molecular networks underlying the progression of the disease from a primary stage to an advanced one is highly warranted to better comprehend the pathobiology of CRPC and unveil its aggressive characteristics. This will ultimately prompt the identification of new potential biomarkers and pave the way for tailored and targeted treatments that are patient-specific [67,68]. It is becoming apparent that this new emerging bioinformatics technology is vital in deciphering mechanistic changes underlying PC and identifying new biomarkers for early diagnosis and predicting patient prognosis of this cancer. Through assessing the proteomic profiles of our previously established PLum-AD and PLum-AI cell lines that represent primary and advanced stages of PC, respectively, and performing a detailed functional proteomics analysis, our results pave the way for understanding the mechanisms exploited in AD-to-AI PC progression. New expression biomarkers and therapeutic targets have been recognized in our study that might help to improve the processes of diagnosing, managing, or even curing the disease. Future studies warrant further validation of these biomarkers at the transcript and protein level.
Supplementary Materials
The following are available online at https://www.mdpi.com/2075-4426/10/3/83/s1, Figure S1: Densitometry readings/intensity ratio of each band in addition to whole blot (uncropped blots) in PLum-AI vs. PLum-AD cell samples; Table S1: Altered differential protein spots in the PLum-AI cells vs. PLum-AD cells. A total of 99 altered differential protein spots were identified in PLum-AI cells as compared to PLum-AD cells under significance less than 0.05. (45 increased and 54 decreased, PLum-AI cells vs. PLum-AD cells); Table S2: Biologically statistically significant protein interaction analysis in PLum-AI cells vs. PLum-AD cells; Table S3: Targeted analysis of prostate cancer interactome in PLum-AI cells vs. PLum-AD cells, Table S4: Biological process gene ontology (GO) enrichment analysis of the differentially expressed proteins in PLum-AI cells vs. PLum-AD cells demonstrated enrichment of biological functions in PLum-AI cells that are central to PI3 kinase pathway; Table S5: Biological process gene ontology (GO) enrichment analysis of the differentially expressed proteins in PLum-AI cells vs. PLum-AD cells demonstrated enrichment of biological functions in PLum-AI cells that are central to the androgen receptor (AR) pathway.
Author Contributions
Conceptualization, H.F.B.; data curation, W.P., R.Z., F.K. and Y.M.; formal analysis, H.F.B., W.P., R.Z., A.M., M.K.E., F.K. and W.A.-K.; funding acquisition, Y.M. and W.A.-K.; investigation, H.F.B., W.P., R.Z., F.B., F.K., Y.M. and W.A.-K.; methodology, W.P., R.Z., F.B., A.M., F.K. and Y.M.; project administration, F.K., W.A.-K, and Y.M.; resources, H.F.B., F.K., Y.M. and W.A.-K.; software, W.P. and R.Z.; supervision, Y.M. and W.A.-K.; validation, H.F.B., W.P., F.B. and A.M.; visualization, Y.M. and W.A.-K.; writing—original draft, H.F.B., W.P. and R.Z.; writing—review and editing, F.B., A.M., M.K.E., F.K., Y.M. and W.A.-K. All authors have read and agreed to the published version of the manuscript.
Funding
This work was supported by the Medical Practice Plan (MPP) at the American University of Beirut—Faculty of Medicine (AUB-FM) (to W.A.K.) and by Department of Chemistry and Biochemistry, Texas Tech University (to Y.M.).
Acknowledgments
We would like to thank all members in the Abou-Kheir’s Laboratory (The WAK Lab), Kobeissy’s Laboratory, and Mechref’s Laboratory for their help on this work. In addition, we would like to thank members of the core facilities in the DTS Building at the American University of Beirut (AUB) for their help and support.
Conflicts of Interest
The authors declare no conflict of interest. The funders had no role in the design of the study; in the collection, analyses, or interpretation of data; in the writing of the manuscript, or in the decision to publish the results.
References
- Siegel, R.L.; Miller, K.D.; Jemal, A. Cancer statistics. CA A Cancer J. Clin. 2020, 70, 7–30. [Google Scholar] [CrossRef] [PubMed]
- Shahait, M.; Mukherji, D.; Hamieh, N.; Nassif, S.; Jabbour, M.; Khauli, R.; Bulbul, M.; Abou Kheir, W.; El Hajj, A. Second primary malignancy after radical prostatectomy in a cohort from the Middle East. Prostate Int. 2018, 6, 46–49. [Google Scholar] [CrossRef] [PubMed]
- Wen, S.; Chang, H.C.; Tian, J.; Shang, Z.; Niu, Y.; Chang, C. Stromal androgen receptor roles in the development of normal prostate, benign prostate hyperplasia, and prostate cancer. Am. J. Pathol. 2015, 185, 293–301. [Google Scholar] [CrossRef] [PubMed]
- Heinlein, C.A.; Chang, C. Androgen Receptor in Prostate Cancer. Endocr. Rev. 2004, 25, 276–308. [Google Scholar] [CrossRef]
- Crawford, E.D.; Heidenreich, A.; Lawrentschuk, N.; Tombal, B.; Pompeo, A.C.L.; Mendoza-Valdes, A.; Miller, K.; Debruyne, F.M.J.; Klotz, L. Androgen-targeted therapy in men with prostate cancer: Evolving practice and future considerations. Prostate Cancer Prostatic Dis. 2019, 22, 24–38. [Google Scholar] [CrossRef]
- Tan, M.H.E.; Li, J.; Xu, H.E.; Melcher, K.; Yong, E.-L. Androgen receptor: Structure, role in prostate cancer and drug discovery. Acta Pharm. Sin. 2015, 36, 3–23. [Google Scholar] [CrossRef]
- Saranyutanon, S.; Srivastava, S.K.; Pai, S.; Singh, S.; Singh, A.P. Therapies Targeted to Androgen Receptor Signaling Axis in Prostate Cancer: Progress, Challenges, and Hope. Cancers 2020, 12, 51. [Google Scholar] [CrossRef]
- Tsai, Y.C.; Chen, W.Y.; Abou-Kheir, W.; Zeng, T.; Yin, J.J.; Bahmad, H.; Lee, Y.C.; Liu, Y.N. Androgen deprivation therapy-induced epithelial-mesenchymal transition of prostate cancer through downregulating SPDEF and activating CCL2. Biochim. Et Biophys. Acta Mol. Basis Dis. 2018, 1864, 1717–1727. [Google Scholar] [CrossRef]
- Fujita, K.; Nonomura, N. Role of Androgen Receptor in Prostate Cancer: A Review. World J. Mens. Health 2019, 37, 288–295. [Google Scholar] [CrossRef]
- Pienta, K.J.; Bradley, D. Mechanisms Underlying the Development of Androgen-Independent Prostate Cancer. Clin. Cancer Res. 2006, 12, 1665–1671. [Google Scholar] [CrossRef]
- Bahmad, H.F.; Samman, H.; Monzer, A.; Hadadeh, O.; Cheaito, K.; Abdel-Samad, R.; Hayar, B.; Pisano, C.; Msheik, H.; Liu, Y.N.; et al. The synthetic retinoid ST1926 attenuates prostate cancer growth and potentially targets prostate cancer stem-like cells. Mol. Carcinog. 2019, 58, 1208–1220. [Google Scholar] [CrossRef] [PubMed]
- Daoud, G.; Monzer, A.; Bahmad, H.; Chamaa, F.; Hamdar, L.; Mouhieddine, T.H.; Shayya, S.; Eid, A.; Kobeissy, F.; Liu, Y.N.; et al. Primary versus castration-resistant prostate cancer: Modeling through novel murine prostate cancer cell lines. Oncotarget 2016, 7, 28961–28975. [Google Scholar] [CrossRef] [PubMed]
- Agarwal, S.; Hynes, P.G.; Tillman, H.S.; Lake, R.; Abou-Kheir, W.G.; Fang, L.; Casey, O.M.; Ameri, A.H.; Martin, P.L.; Yin, J.J.; et al. Identification of Different Classes of Luminal Progenitor Cells within Prostate Tumors. Cell Rep. 2015, 13, 2147–2158. [Google Scholar] [CrossRef] [PubMed]
- Cattrini, C.; Castro, E.; Lozano, R.; Zanardi, E.; Rubagotti, A.; Boccardo, F.; Olmos, D. Current Treatment Options for Metastatic Hormone-Sensitive Prostate Cancer. Cancers 2019, 11, 1355. [Google Scholar] [CrossRef]
- Madu, C.O.; Lu, Y. Novel diagnostic biomarkers for prostate cancer. J. Cancer 2010, 1, 150–177. [Google Scholar] [CrossRef]
- Shahait, M.; Nassif, S.; Tamim, H.; Mukherji, D.; Hijazi, M.; El Sabban, M.; Khauli, R.; Bulbul, M.; Abou Kheir, W.; El Hajj, A. Ki-67 expression predicts biochemical recurrence after radical prostatectomy in the setting of positive surgical margins. BMC Urol. 2018, 18, 13. [Google Scholar] [CrossRef]
- Cheaito, K.A.; Bahmad, H.F.; Hadadeh, O.; Saleh, E.; Dagher, C.; Hammoud, M.S.; Shahait, M.; Mrad, Z.A.; Nassif, S.; Tawil, A.; et al. EMT Markers in Locally-Advanced Prostate Cancer: Predicting Recurrence? Front. Oncol. 2019, 9, 131. [Google Scholar] [CrossRef]
- Quinn, D.I.; Henshall, S.M.; Haynes, A.-M.; Brenner, P.C.; Kooner, R.; Golovsky, D.; Mathews, J.; O’Neill, G.F.; Turner, J.J.; Delprado, W. Prognostic significance of pathologic features in localized prostate cancer treated with radical prostatectomy: Implications for staging systems and predictive models. J. Clin. Oncol. 2001, 19, 3692–3705. [Google Scholar] [CrossRef]
- Karakiewicz, P.I.; Eastham, J.A.; Graefen, M.; Cagiannos, I.; Stricker, P.D.; Klein, E.; Cangiano, T.; Schröder, F.H.; Scardino, P.T.; Kattan, M.W. Prognostic impact of positive surgical margins in surgically treated prostate cancer: Multi-institutional assessment of 5831 patients. Urology 2005, 66, 1245–1250. [Google Scholar] [CrossRef]
- Wright, J.L.; Dalkin, B.L.; True, L.D.; Ellis, W.J.; Stanford, J.L.; Lange, P.H.; Lin, D.W. Positive surgical margins at radical prostatectomy predict prostate cancer specific mortality. J. Urol. 2010, 183, 2213–2218. [Google Scholar] [CrossRef]
- Carvalhal, G.F.; Daudi, S.N.; Kan, D.; Mondo, D.; Roehl, K.A.; Loeb, S.; Catalona, W.J. Correlation between serum prostate-specific antigen and cancer volume in prostate glands of different sizes. Urology 2010, 76, 1072–1076. [Google Scholar] [CrossRef] [PubMed]
- Lu, M.; Zhan, X. The crucial role of multiomic approach in cancer research and clinically relevant outcomes. EPMA J. 2018, 9, 77–102. [Google Scholar] [CrossRef] [PubMed]
- Latonen, L.; Afyounian, E.; Jylhä, A.; Nättinen, J.; Aapola, U.; Annala, M.; Kivinummi, K.K.; Tammela, T.T.L.; Beuerman, R.W.; Uusitalo, H.; et al. Integrative proteomics in prostate cancer uncovers robustness against genomic and transcriptomic aberrations during disease progression. Nat. Commun. 2018, 9, 1176. [Google Scholar] [CrossRef] [PubMed]
- Abou-Abbass, H.; Abou-El-Hassan, H.; Bahmad, H.; Zibara, K.; Zebian, A.; Youssef, R.; Ismail, J.; Zhu, R.; Zhou, S.; Dong, X.; et al. Glycosylation and other PTMs alterations in neurodegenerative diseases: Current status and future role in neurotrauma. Electrophoresis 2016, 37, 1549–1561. [Google Scholar] [CrossRef]
- Abou-Abbass, H.; Bahmad, H.; Abou-El-Hassan, H.; Zhu, R.; Zhou, S.; Dong, X.; Hamade, E.; Mallah, K.; Zebian, A.; Ramadan, N.; et al. Deciphering glycomics and neuroproteomic alterations in experimental traumatic brain injury: Comparative analysis of aspirin and clopidogrel treatment. Electrophoresis 2016, 37, 1562–1576. [Google Scholar] [CrossRef]
- Alaaeddine, R.; Fayad, M.; Nehme, E.; Bahmad, H.F.; Kobeissy, F. The Emerging Role of Proteomics in Precision Medicine: Applications in Neurodegenerative Diseases and Neurotrauma. Adv. Exp. Med. Biol. 2017, 1007, 59–70. [Google Scholar] [CrossRef]
- Jaber, Z.; Aouad, P.; Al Medawar, M.; Bahmad, H.; Abou-Abbass, H.; Ghandour, H.; Mondello, S.; Kobeissy, F. Role of Systems Biology in Brain Injury Biomarker Discovery: Neuroproteomics Application. Methods Mol. Biol. (Clifton N. J.) 2016, 1462, 157–174. [Google Scholar] [CrossRef]
- Jaber, Z.; Aouad, P.; Al Medawar, M.; Bahmad, H.; Abou-Abbass, H.; Kobeissy, F. Application of Systems Biology to Neuroproteomics: The Path to Enhanced Theranostics in Traumatic Brain Injury. Methods Mol. Biol. (Clifton N. J.) 2016, 1462, 139–155. [Google Scholar] [CrossRef]
- Kobeissy, F.H.; Guingab-Cagmat, J.D.; Zhang, Z.; Moghieb, A.; Glushakova, O.Y.; Mondello, S.; Boutté, A.M.; Anagli, J.; Rubenstein, R.; Bahmad, H.; et al. Neuroproteomics and Systems Biology Approach to Identify Temporal Biomarker Changes Post Experimental Traumatic Brain Injury in Rats. Front. Neurol. 2016, 7, 198. [Google Scholar] [CrossRef]
- Abou-El-Hassan, H.; Sukhon, F.; Assaf, E.J.; Bahmad, H.; Abou-Abbass, H.; Jourdi, H.; Kobeissy, F.H. Degradomics in Neurotrauma: Profiling Traumatic Brain Injury. Methods Mol. Biol. (Clifton N. J.) 2017, 1598, 65–99. [Google Scholar] [CrossRef]
- Duarte, T.T.; Spencer, C.T. Personalized Proteomics: The Future of Precision Medicine. Proteomes 2016, 4, 29. [Google Scholar] [CrossRef] [PubMed]
- Gulcicek, E.E.; Colangelo, C.M.; McMurray, W.; Stone, K.; Williams, K.; Wu, T.; Zhao, H.; Spratt, H.; Kurosky, A.; Wu, B. Proteomics and the analysis of proteomic data: An overview of current protein-profiling technologies. Curr. Protoc. Bioinform. 2005. [Google Scholar] [CrossRef] [PubMed]
- Peng, W.; Zhang, Y.; Zhu, R.; Mechref, Y. Comparative membrane proteomics analyses of breast cancer cell lines to understand the molecular mechanism of breast cancer brain metastasis. Electrophoresis 2017, 38, 2124–2134. [Google Scholar] [CrossRef]
- Szklarczyk, D.; Franceschini, A.; Wyder, S.; Forslund, K.; Heller, D.; Huerta-Cepas, J.; Simonovic, M.; Roth, A.; Santos, A.; Tsafou, K.P.; et al. STRING v10: Protein-protein interaction networks, integrated over the tree of life. Nucleic Acids Res. 2015, 43, D447–D452. [Google Scholar] [CrossRef] [PubMed]
- Bonnet, A.; Lagarrigue, S.; Liaubet, L.; Robert-Granié, C.; Sancristobal, M.; Tosser-Klopp, G. Pathway results from the chicken data set using GOTM, Pathway Studio and Ingenuity softwares. BMC Proc. 2009, 3, S11. [Google Scholar] [CrossRef]
- Yuryev, A.; Kotelnikova, E.; Daraselia, N. Ariadne′s ChemEffect and Pathway Studio knowledge base. Expert Opin. Drug Discov. 2009, 4, 1307–1318. [Google Scholar] [CrossRef]
- Abdi, H.; Williams, L.J. Principal component analysis. Wiley Interdiscip. Rev. Comput. Stat. 2010, 2, 433–459. [Google Scholar] [CrossRef]
- Abou-Kheir, W.; Hynes, P.G.; Martin, P.; Yin, J.J.; Liu, Y.-N.; Seng, V.; Lake, R.; Spurrier, J.; Kelly, K. Self-Renewing Pten-/-TP53-/- Protospheres Produce Metastatic Adenocarcinoma Cell Lines with Multipotent Progenitor Activity. PLoS ONE 2011, 6, e26112. [Google Scholar] [CrossRef]
- Abou-Kheir, W.G.; Hynes, P.G.; Martin, P.L.; Pierce, R.; Kelly, K. Characterizing the contribution of stem/progenitor cells to tumorigenesis in the Pten-/-TP53-/- prostate cancer model. Stem. Cells (Dayt. Ohio) 2010, 28, 2129–2140. [Google Scholar] [CrossRef]
- Zhang, K.; Zhou, S.; Wang, L.; Wang, J.; Zou, Q.; Zhao, W.; Fu, Q.; Fang, X. Current Stem Cell Biomarkers and Their Functional Mechanisms in Prostate Cancer. Int. J. Mol. Sci. 2016, 17, 1163. [Google Scholar] [CrossRef]
- Shen, M.M.; Abate-Shen, C. Molecular genetics of prostate cancer: New prospects for old challenges. Genes. Dev. 2010, 24, 1967–2000. [Google Scholar] [CrossRef]
- Bahmad, H.F.; Cheaito, K.; Chalhoub, R.M.; Hadadeh, O.; Monzer, A.; Ballout, F.; El-Hajj, A.; Mukherji, D.; Liu, Y.-N.; Daoud, G.; et al. Sphere-Formation Assay: Three-Dimensional in vitro Culturing of Prostate Cancer Stem/Progenitor Sphere-Forming Cells. Front Oncol 2018, 8, 347. [Google Scholar] [CrossRef] [PubMed]
- Zhao, J.; Li, J.; Fan, T.W.M.; Hou, S.X. Glycolytic reprogramming through PCK2 regulates tumor initiation of prostate cancer cells. Oncotarget 2017, 8, 83602–83618. [Google Scholar] [CrossRef] [PubMed]
- Clark, D.W.; Palle, K. Aldehyde dehydrogenases in cancer stem cells: Potential as therapeutic targets. Ann. Transl. Med. 2016, 4, 518. [Google Scholar] [CrossRef] [PubMed]
- Li, T.; Su, Y.; Mei, Y.; Leng, Q.; Leng, B.; Liu, Z.; Stass, S.A.; Jiang, F. ALDH1A1 is a marker for malignant prostate stem cells and predictor of prostate cancer patients’ outcome. Lab. Investig. A J. Tech. Methods Pathol. 2010, 90, 234–244. [Google Scholar] [CrossRef] [PubMed]
- Yu, C.; Yao, Z.; Jiang, Y.; Keller, E.T. Prostate cancer stem cell biology. Minerva Urol. E Nefrol. Ital. J. Urol. Nephrol. 2012, 64, 19–33. [Google Scholar]
- Dubrovska, A.; Kim, S.; Salamone, R.J.; Walker, J.R.; Maira, S.M.; García-Echeverría, C.; Schultz, P.G.; Reddy, V.A. The role of PTEN/Akt/PI3K signaling in the maintenance and viability of prostate cancer stem-like cell populations. Proc. Natl. Acad. Sci. USA 2009, 106, 268–273. [Google Scholar] [CrossRef]
- Li, L.; Lou, Z.; Wang, L. The role of FKBP5 in cancer aetiology and chemoresistance. Br. J. Cancer 2011, 104, 19–23. [Google Scholar] [CrossRef]
- Suzuki, M.; Kurosaki, T.; Arai, T.; Sawabe, M.; Hosoi, T.; Kitamura, T. The Val158Met polymorphism of the catechol-O-methyltransferase gene is not associated with the risk of sporadic or latent prostate cancer in Japanese men. Int. J. Urol. 2007, 14, 800–804. [Google Scholar] [CrossRef]
- Suzuki, K.; Nakazato, H.; Matsui, H.; Koike, H.; Okugi, H.; Kashiwagi, B.; Nishii, M.; Ohtake, N.; Nakata, S.; Ito, K.; et al. Genetic polymorphisms of estrogen receptor alpha, CYP19, catechol-O-methyltransferase are associated with familial prostate carcinoma risk in a Japanese population. Cancer 2003, 98, 1411–1416. [Google Scholar] [CrossRef]
- Chao, Y.; Wu, Q.; Acquafondata, M.; Dhir, R.; Wells, A. Partial mesenchymal to epithelial reverting transition in breast and prostate cancer metastases. Cancer Microenviron. Off. J. Int. Cancer Microenviron. Soc. 2012, 5, 19–28. [Google Scholar] [CrossRef] [PubMed]
- Liu, Y.N.; Abou-Kheir, W.; Yin, J.J.; Fang, L.; Hynes, P.; Casey, O.; Hu, D.; Wan, Y.; Seng, V.; Sheppard-Tillman, H.; et al. Critical and reciprocal regulation of KLF4 and SLUG in transforming growth factor β-initiated prostate cancer epithelial-mesenchymal transition. Mol. Cell. Biol. 2012, 32, 941–953. [Google Scholar] [CrossRef] [PubMed]
- Nawshad, A.; Lagamba, D.; Polad, A.; Hay, E.D. Transforming growth factor-beta signaling during epithelial-mesenchymal transformation: Implications for embryogenesis and tumor metastasis. Cells Tissues Organs 2005, 179, 11–23. [Google Scholar] [CrossRef] [PubMed]
- Kalluri, R.; Weinberg, R.A. The basics of epithelial-mesenchymal transition. J. Clin. Investig. 2009, 119, 1420–1428. [Google Scholar] [CrossRef] [PubMed]
- Grant, C.M.; Kyprianou, N. Epithelial mesenchymal transition (EMT) in prostate growth and tumor progression. Transl. Androl. Urol. 2013, 2, 202–211. [Google Scholar] [CrossRef] [PubMed]
- Lo, U.G.; Lee, C.-F.; Lee, M.-S.; Hsieh, J.-T. The Role and Mechanism of Epithelial-to-Mesenchymal Transition in Prostate Cancer Progression. Int. J. Mol. Sci. 2017, 18, 2079. [Google Scholar] [CrossRef]
- Chen, C.L.; Mahalingam, D.; Osmulski, P.; Jadhav, R.R.; Wang, C.M.; Leach, R.J.; Chang, T.C.; Weitman, S.D.; Kumar, A.P.; Sun, L.; et al. Single-cell analysis of circulating tumor cells identifies cumulative expression patterns of EMT-related genes in metastatic prostate cancer. Prostate 2013, 73, 813–826. [Google Scholar] [CrossRef]
- Tsai, Y.C.; Zeng, T.; Abou-Kheir, W.; Yeh, H.L.; Yin, J.J.; Lee, Y.C.; Chen, W.Y.; Liu, Y.N. Disruption of ETV6 leads to TWIST1-dependent progression and resistance to epidermal growth factor receptor tyrosine kinase inhibitors in prostate cancer. Mol. Cancer 2018, 17, 42. [Google Scholar] [CrossRef]
- Nguyen, D.P.; Li, J.; Tewari, A.K. Inflammation and prostate cancer: The role of interleukin 6 (IL-6). BJU Int. 2014, 113, 986–992. [Google Scholar] [CrossRef]
- Rojas, A.; Liu, G.; Coleman, I.; Nelson, P.S.; Zhang, M.; Dash, R.; Fisher, P.B.; Plymate, S.R.; Wu, J.D. IL-6 promotes prostate tumorigenesis and progression through autocrine cross-activation of IGF-IR. Oncogene 2011, 30, 2345–2355. [Google Scholar] [CrossRef]
- Sun, F.; Chen, H.G.; Li, W.; Yang, X.; Wang, X.; Jiang, R.; Guo, Z.; Chen, H.; Huang, J.; Borowsky, A.D.; et al. Androgen receptor splice variant AR3 promotes prostate cancer via modulating expression of autocrine/paracrine factors. J. Biol. Chem. 2014, 289, 1529–1539. [Google Scholar] [CrossRef] [PubMed]
- Xu, J.; Qiu, Y. Role of androgen receptor splice variants in prostate cancer metastasis. Asian J. Urol. 2016, 3, 177–184. [Google Scholar] [CrossRef] [PubMed]
- Huang, Y.; Jin, C.; Hamana, T.; Liu, J.; Wang, C.; An, L.; McKeehan, W.L.; Wang, F. Overexpression of FGF9 in prostate epithelial cells augments reactive stroma formation and promotes prostate cancer progression. Int. J. Biol. Sci. 2015, 11, 948–960. [Google Scholar] [CrossRef] [PubMed]
- Yang, Y.; Jiao, L.; Hou, J.; Xu, C.; Wang, L.; Yu, Y.; Li, Y.; Yang, C.; Wang, X.; Sun, Y. Dishevelled-2 silencing reduces androgen-dependent prostate tumor cell proliferation and migration and expression of Wnt-3a and matrix metalloproteinases. Mol. Biol. Rep. 2013, 40, 4241–4250. [Google Scholar] [CrossRef]
- Baruah, M.M.; Khandwekar, A.P.; Sharma, N. Quercetin modulates Wnt signaling components in prostate cancer cell line by inhibiting cell viability, migration, and metastases. Tumour Biol. 2016, 37, 14025–14034. [Google Scholar] [CrossRef]
- Darnel, A.D.; Behmoaram, E.; Vollmer, R.T.; Corcos, J.; Bijian, K.; Sircar, K.; Su, J.; Jiao, J.; Alaoui-Jamali, M.A.; Bismar, T.A. Fascin regulates prostate cancer cell invasion and is associated with metastasis and biochemical failure in prostate cancer. Clin. Cancer Res. An Off. J. Am. Assoc. Cancer Res. 2009, 15, 1376–1383. [Google Scholar] [CrossRef]
- Kumar-Sinha, C.; Chinnaiyan, A.M. Molecular markers to identify patients at risk for recurrence after primary treatment for prostate cancer. Urology 2003, 62, 19–35. [Google Scholar] [CrossRef]
- Varambally, S.; Yu, J.; Laxman, B.; Rhodes, D.R.; Mehra, R.; Tomlins, S.A.; Shah, R.B.; Chandran, U.; Monzon, F.A.; Becich, M.J.; et al. Integrative genomic and proteomic analysis of prostate cancer reveals signatures of metastatic progression. Cancer Cell 2005, 8, 393–406. [Google Scholar] [CrossRef]


© 2020 by the authors. Licensee MDPI, Basel, Switzerland. This article is an open access article distributed under the terms and conditions of the Creative Commons Attribution (CC BY) license (http://creativecommons.org/licenses/by/4.0/).