Improving Remote Health Monitoring: A Low-Complexity ECG Compression Approach


Abstract
:1. Introduction
2. Methods
2.1. Data Used
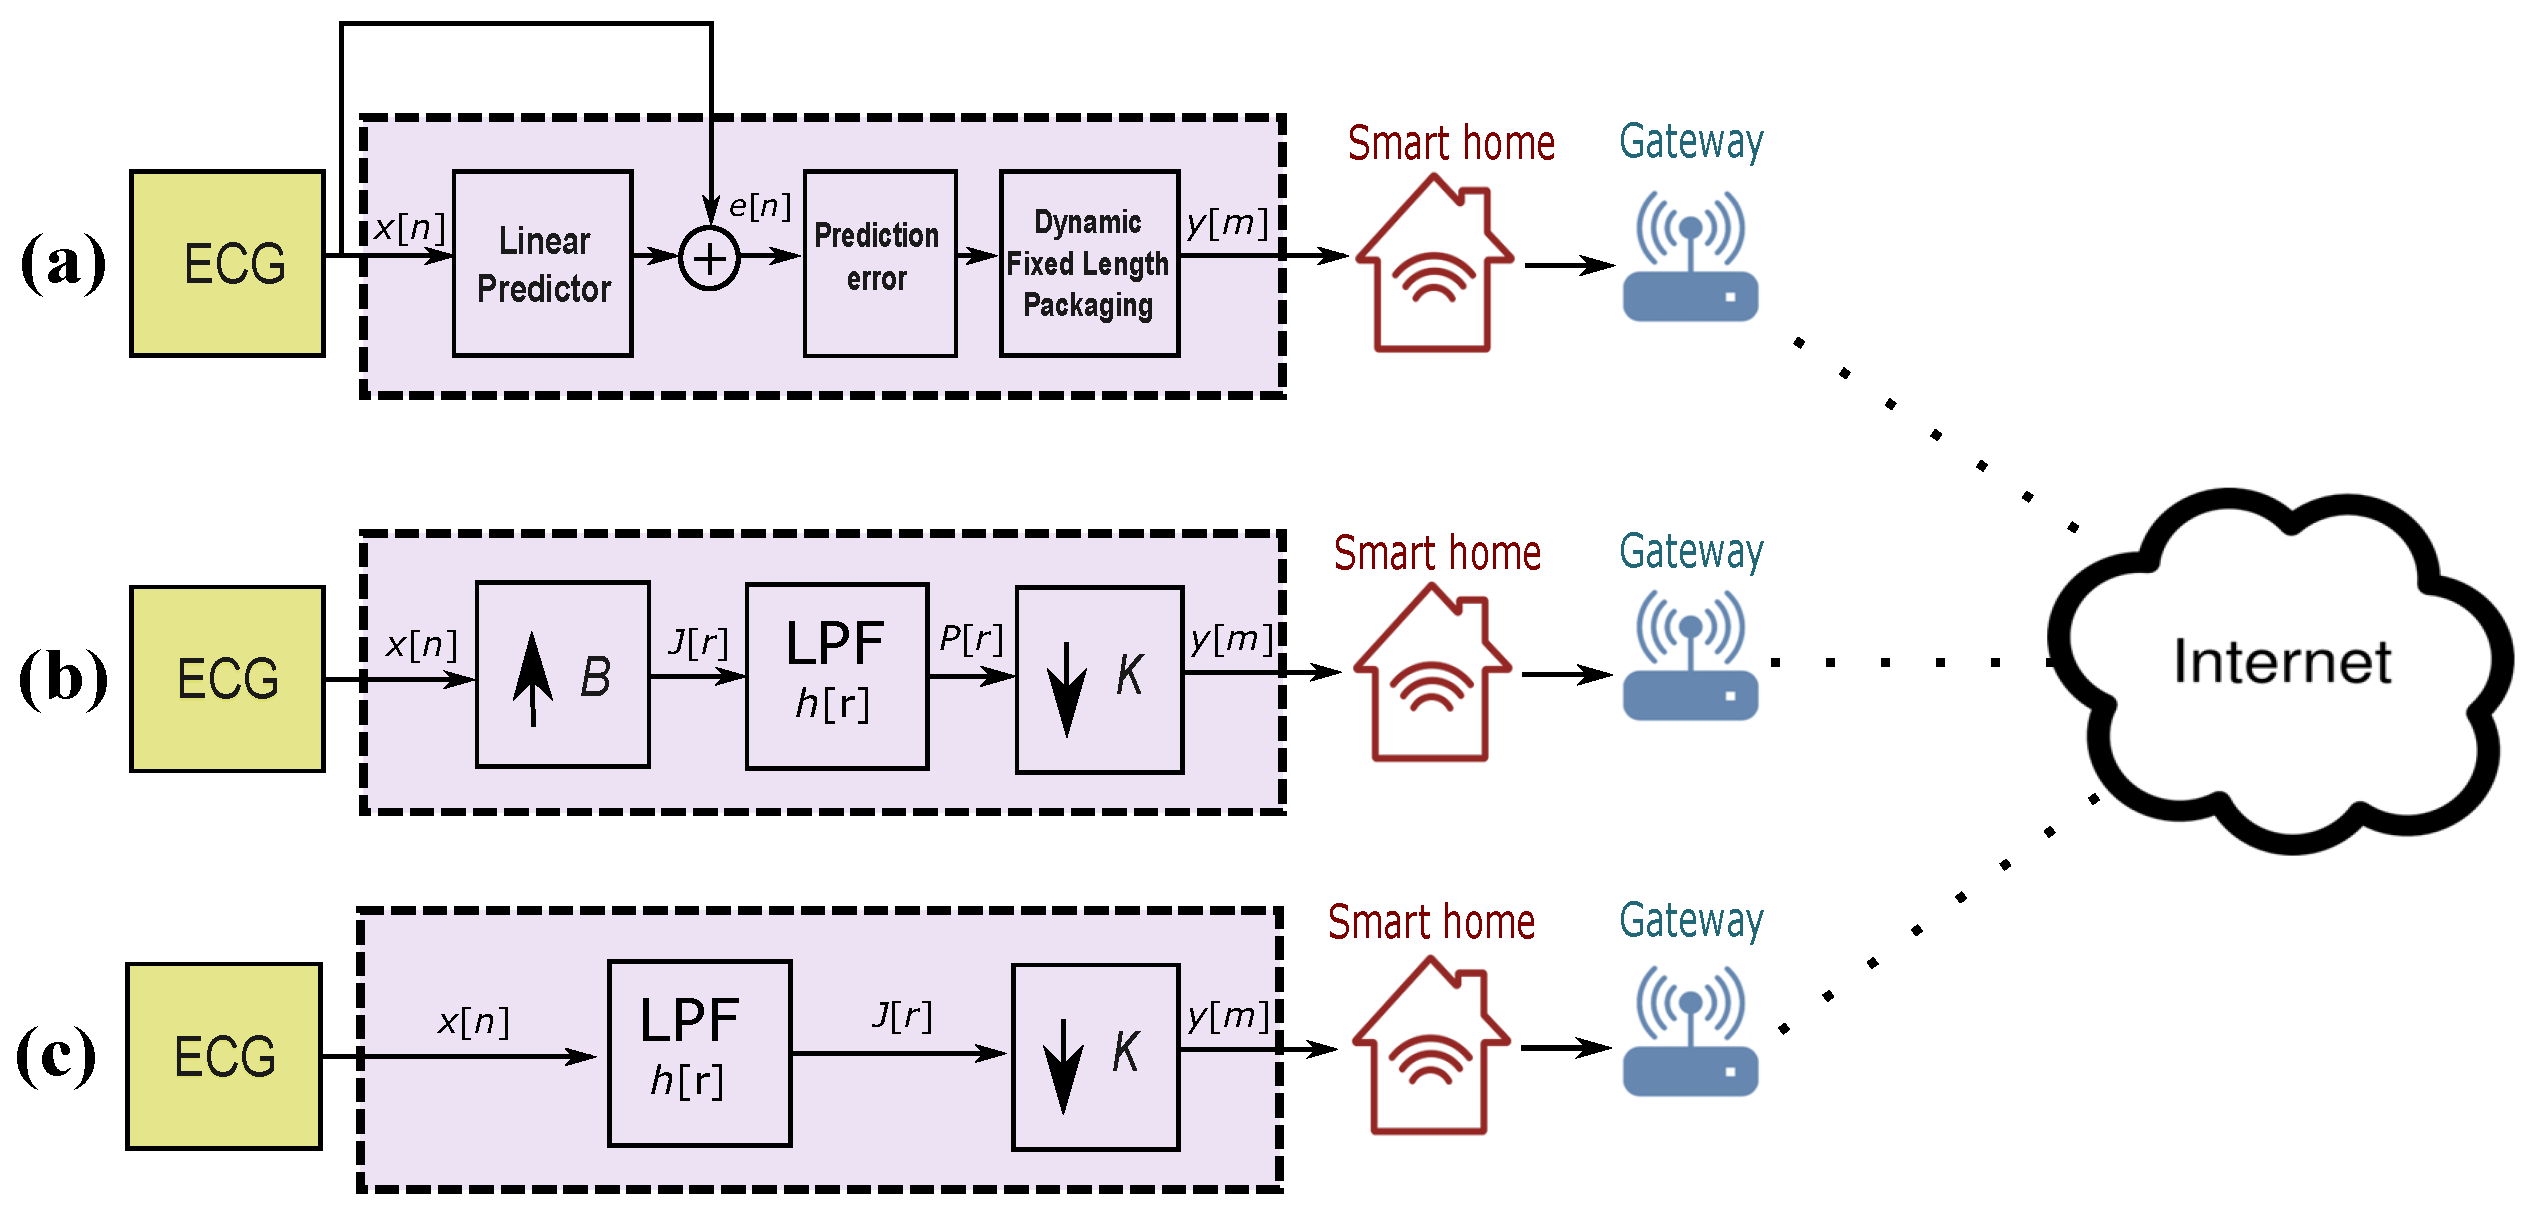
2.2. Benchmark Method I: Adaptive Linear Prediction
2.3. Benchmark Compression Method II: Decimating by a Factor
2.4. Proposed Compression Method III: Decimating by Factor K
2.5. QRS Detection
2.6. Compression Ratio
3. Results and Discussion
3.1. Methods Implementation
3.2. Method Performance
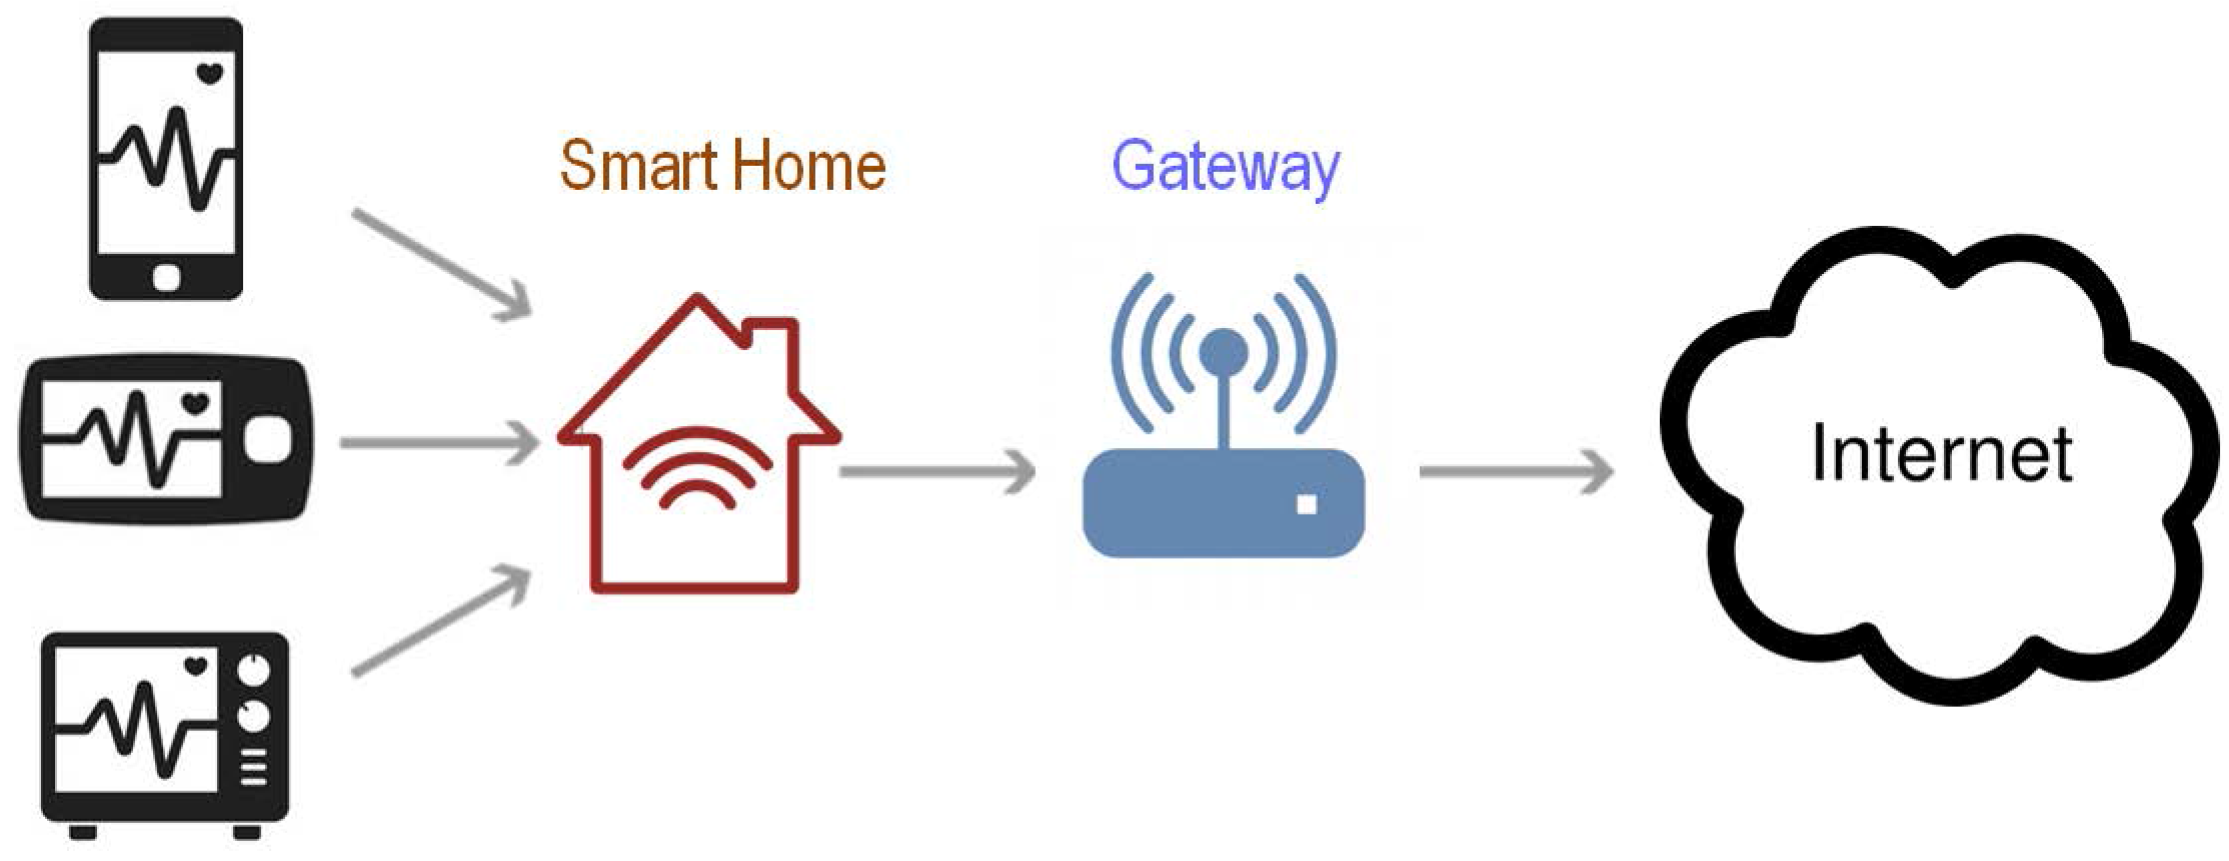
3.3. Smart Homes
- Scenario 1: The lossy compression method is applied on the sensor unit and the analysis of ECG signals such QRS detection can be implemented on the gateway(s) or the processing unit (computers, internet, etc.). This will depend on the gateway computational capability in terms of processing and memory.
- Scenario 2: The lossy compression method is applied on the gateway unit and the analysis of ECG signals such QRS detection can be implemented on the processing unit (computers, internet, etc.).
3.4. Global Health
4. Conclusions
Acknowledgments
Author Contributions
Conflicts of Interest
References
- Alwan, A. Global Status Report on Noncommunicable Diseases 2010; World Health Organization: Geneva, Switzerland, 2011. [Google Scholar]
- Dilaveris, P.E.; Gialafos, E.J.; Sideris, S.K.; Theopistou, A.M.; Andrikopoulos, G.K.; Kyriakidis, M.; Gialafos, J.E.; Toutouzas, P.K. Simple electrocardiographic markers for the prediction of paroxysmal idiopathic atrial fibrillation. Am. Heart J. 1998, 135, 733–738. [Google Scholar] [CrossRef]
- Elgendi, M.; Eskofier, B.; Dokos, S.; Abbott, D. Revisiting QRS Detection Methodologies for Portable, Wearable, Battery-Operated, and Wireless ECG Systems. PLoS ONE 2014, 9, 1–18. [Google Scholar] [CrossRef] [PubMed] [Green Version]
- Elgendi, M.; Jonkman, M.; De Boer, F. Improved QRS detection algorithm using dynamic thresholds. Int. J. Hybrid Inf. Technol. 2009, 2, 65–80. [Google Scholar]
- Elgendi, M.; Jonkman, M.; De Boer, F. Premature atrial complexes detection using the Fisher Linear Discriminant. In Proceedings of the 7th IEEE International Conference on Cognitive Informatics (ICCI 2008), Stanford, CA, USA, 14–16 August 2008; pp. 83–88. [Google Scholar]
- Scilingo, E.P.; Valenza, G. Recent Advances on Wearable Electronics and Embedded Computing Systems for Biomedical Applications. Electronics 2017, 6, 12. [Google Scholar] [CrossRef]
- Fanucci, L.; Saponara, S.; Bacchillone, T.; Donati, M.; Barba, P.; Sánchez-Tato, I.; Carmona, C. Sensing devices and sensor signal processing for remote monitoring of vital signs in CHF patients. IEEE Trans. Instrum. Meas. 2013, 62, 553–569. [Google Scholar] [CrossRef]
- Saponara, S.; Donati, M.; Fanucci, L.; Celli, A. An Embedded sensing and communication platform, and a healthcare model for remote monitoring of chronic diseases. Electronics 2016, 5, 47. [Google Scholar] [CrossRef]
- Donati, M.; Bacchillone, T.; Fanucci, L.; Saponara, S.; Costalli, F. Operating protocol and networking issues of a telemedicine platform integrating from wireless home sensors to the hospital information system. J. Comput. Netw. Commun. 2013, 2013, 781620. [Google Scholar] [CrossRef]
- Chen, M.; Wan, J.; González-Valenzuela, S.; Liao, X.; Leung, V.C. A Survey of Recent Developments in Home M2M Networks. IEEE Commun. Surv. Tutor. 2014, 16, 98–114. [Google Scholar] [CrossRef]
- Baig, M.M.; GholamHosseini, H.; Connolly, M.J. Mobile healthcare applications: System design review, critical issues and challenges. Australas. Phys. Eng. Sci. Med. 2015, 38, 23–38. [Google Scholar] [CrossRef] [PubMed]
- Bansal, A.; Kumar, S.; Bajpai, A.; Tiwari, V.N.; Nayak, M.; Venkatesan, S.; Narayanan, R. Remote health monitoring system for detecting cardiac disorders. IET Syst. Biol. 2015, 9, 309–314. [Google Scholar] [CrossRef] [PubMed]
- Jung, S.J.; Myllylä, R.; Chung, W.Y. Wireless machine-to-machine healthcare solution using android mobile devices in global networks. IEEE Sens. J. 2013, 13, 1419–1424. [Google Scholar] [CrossRef]
- Spinsante, S.; Gambi, E. Remote health monitoring by OSGi technology and digital TV integration. IEEE Trans. Consum. Electron. 2012, 58. [Google Scholar] [CrossRef]
- Lin, B.S.; Hsiao, P.C.; Cheng, P.H.; Lee, I.J.; Jan, G.E. Design and Implementation of a Set-Top Box–Based Homecare System Using Hybrid Cloud. Telemed. e-Health 2015, 21, 916–922. [Google Scholar] [CrossRef] [PubMed]
- Rahmani, A.M.; Thanigaivelan, N.K.; Gia, T.N.; Granados, J.; Negash, B.; Liljeberg, P.; Tenhunen, H. Smart e-health gateway: Bringing intelligence to internet-of-things based ubiquitous healthcare systems. In Proceedings of the 2015 12th Annual IEEE Consumer Communications and Networking Conference (CCNC), Las Vegas, NV, USA, 9–12 January 2015; pp. 826–834. [Google Scholar]
- Martin, S.; Kelly, G.; Kernohan, W.G.; McCreight, B.; Nugent, C. Smart Home Technologies for Health and Social Care Support; The Cochrane Collaboration; John Wiley & Sons, Ltd.: Hoboken, NJ, USA, 2008. [Google Scholar]
- Vashist, S.K.; Schneider, E.M.; Luong, J.H. Commercial smartphone-based devices and smart applications for personalized healthcare monitoring and management. Diagnostics 2014, 4, 104–128. [Google Scholar] [CrossRef] [PubMed]
- Baig, M.M.; Gholamhosseini, H. Smart health monitoring systems: An overview of design and modeling. J. Med. Syst. 2013, 37, 9898. [Google Scholar] [CrossRef] [PubMed]
- Jacobson, N. Dignity and health: A review. Soc. Sci. Med. 2007, 64, 292–302. [Google Scholar] [CrossRef] [PubMed]
- Collins, A.; Leier, B. Can medical assistance in dying harm rural and remote palliative care in Canada? Can. Fam. Physician 2017, 63, 186–190. [Google Scholar] [PubMed]
- Elgendi, M.; Mohamed, A.; Ward, R. Efficient ECG Compression and QRS Detection for E-Health Applications. Sci. Rep. 2017, 7, 459. [Google Scholar] [CrossRef] [PubMed]
- Kannan, R.; Eswaran, C. Lossless compression schemes for ECG signals using neural network predictors. EURASIP J. Appl. Signal Process. 2007, 2007, 102. [Google Scholar] [CrossRef]
- Calhoun, B.H.; Lach, J.; Stankovic, J.; Wentzloff, D.D.; Whitehouse, K.; Barth, A.T.; Brown, J.K.; Li, Q.; Oh, S.; Roberts, N.E.; et al. Body sensor networks: A holistic approach from silicon to users. Proc. IEEE 2012, 100, 91–106. [Google Scholar] [CrossRef]
- Moody, G.B.; Mark, R.G. The impact of the MIT-BIH Arrhythmia Database. IEEE Eng. Med. Biol. Mag. 2001, 20, 45–50. [Google Scholar] [CrossRef] [PubMed]
- Elgendi, M. Fast QRS Detection with an Optimized Knowledge-Based Method: Evaluation on 11 Standard ECG Databases. PLoS ONE 2013, 8, e73557. [Google Scholar] [CrossRef] [PubMed]
- Laguna, P.; Mark, R.G.; Goldberg, A.; Moody, G.B. A database for evaluation of algorithms for measurement of QT and other waveform intervals in the ECG. IEEE Comput. Cardiol. 1997, 24, 673–676. [Google Scholar]
- Kyrkos, A.; Giakoumakis, E.; Carayannis, G. QRS detection through time recursive prediction techniques. Signal Process. 1988, 15, 429–436. [Google Scholar] [CrossRef]
- Lin, K.P.; Chang, W.H. QRS feature extraction using linear prediction. IEEE Trans. Biomed. Eng. 1989, 36, 1050–1055. [Google Scholar] [PubMed]
- Deepu, C.J.; Lian, Y. A Joint QRS detection and data compression scheme for wearable sensors. IEEE Trans. Biomed. Eng. 2015, 62, 165–175. [Google Scholar] [CrossRef] [PubMed]
- Kovacevic, J.; Vetterli, M. Perfect reconstruction filter banks with rational sampling factors. IEEE Trans. Signal Process. 1993, 41, 2047–2066. [Google Scholar]
- Tao, R.; Deng, B.; Zhang, W.Q.; Wang, Y. Sampling and sampling rate conversion of band limited signals in the fractional Fourier transform domain. IEEE Trans. Signal Process. 2008, 56, 158–171. [Google Scholar] [CrossRef]
- Elgendi, M. TERMA Framework for Biomedical Signal Analysis: An Economic-Inspired Approach. Biosensors 2016, 6, 55. [Google Scholar] [CrossRef] [PubMed]
- Hamilton, P.; Tompkins, W. Quantitative investigation of QRS detection rules using the MIT/BIH arrhythmiac database. IEEE Trans. Biomed. Eng. 1986, 33, 1157–1165. [Google Scholar] [CrossRef] [PubMed]
- Poli, R.; Cagnoni, S.; Valli, G. Genetic design of optimum linear and nonlinear QRS detectors. IEEE Trans. Biomed. Eng. 1995, 42, 1137–1141. [Google Scholar] [CrossRef] [PubMed]
- Afonso, V.; Tompkins, W.; Nguyen, T.; Luo, S. ECG beat detection using filter banks. IEEE Trans. Biomed. Eng. 1999, 46, 192–202. [Google Scholar]
- Martínez, J.P.; Almeida, R.; Olmos, S.; Rocha, A.P.; Laguna, P. A wavelet-based ECG delineator: Evaluation on standard databases. IEEE Trans. Biomed. Eng. 2004, 51, 570–581. [Google Scholar] [CrossRef] [PubMed]
- Chen, S.W.; Chen, H.C.; Chan, H.L. A real-time QRS detection method based on moving-averaging incorporating with wavelet denoising. Comput. Methods Progr. Biomed. 2006, 82, 187–195. [Google Scholar] [CrossRef] [PubMed]
- Ieong, C.I.; Mak, P.I.; Lam, C.P.; Dong, C.; Vai, M.I.; Mak, P.U.; Pun, S.H.; Wan, F.; Martins, R.P. A 0.83-QRS detection processor using quadratic spline wavelet transform for wireless ECG acquisition in 0.35-CMOS. IEEE Trans. Biomed. Circuits Syst. 2012, 6, 586–595. [Google Scholar] [CrossRef] [PubMed]
- Nallathambi, G.; Principe, J.C. Integrate and fire pulse train automaton for qrs detection. IEEE Trans. Biomed. Eng. 2014, 61, 317–326. [Google Scholar] [CrossRef] [PubMed]
- Zhang, F.; Lian, Y. QRS detection based on multiscale mathematical morphology for wearable ECG devices in body area networks. IEEE Trans. Biomed. Circuits Syst. 2009, 3, 220–228. [Google Scholar] [CrossRef] [PubMed]
- Chua, E.; Fang, W.C. Mixed bio-signal lossless data compressor for portable brain-heart monitoring systems. IEEE Trans. Consum. Electron. 2011, 57, 267–273. [Google Scholar] [CrossRef]
- Chen, S.L.; Wang, J.G. VLSI implementation of low-power cost-efficient lossless ECG encoder design for wireless healthcare monitoring application. Electron. Lett. 2013, 49, 91–93. [Google Scholar] [CrossRef]
- Chen, S.L.; Lee, H.Y.; Chen, C.A.; Huang, H.Y.; Luo, C.H. Wireless body sensor network with adaptive low-power design for biometrics and healthcare applications. IEEE Syst. J. 2009, 3, 398–409. [Google Scholar] [CrossRef]
- Deepu, C.J.; Zhang, X.; Liew, W.S.; Wong, D.; Lian, Y. An ECG-SoC with 535nW/channel lossless data compression for wearable sensors. In Proceedings of the IEEE Asian Solid-State Circuits Conference, Singapore, 11–13 November 2013; pp. 145–148. [Google Scholar]
- Mamaghanian, H.; Khaled, N.; Atienza, D.; Vandergheynst, P. Compressed sensing for real-time energy-efficient ECG compression on wireless body sensor nodes. IEEE Trans. Biomed. Eng. 2011, 58, 2456–2466. [Google Scholar] [CrossRef] [PubMed]
- Ansari-Ram, F.; Hosseini-Khayat, S. ECG signal compression using compressed sensing with nonuniform binary matrices. In Proceedings of the 2012 16th CSI International Symposium on Artificial Intelligence and Signal Processing, Shiraz, Iran, 2–3 May 2012; pp. 305–309. [Google Scholar]
- Kumar, R.; Kumar, A.; Pandey, R.K. Beta wavelet based ECG signal compression using lossless encoding with modified thresholding. Comput. Electr. Eng. 2013, 39, 130–140. [Google Scholar] [CrossRef]
- Polania, L.F.; Carrillo, R.E.; Blanco-Velasco, M.; Barner, K.E. Exploiting prior knowledge in compressed sensing wireless ECG systems. IEEE J. Biomed. Health Inform. 2015, 19, 508–519. [Google Scholar] [CrossRef] [PubMed]
- Polania, L.F.; Carrillo, R.E.; Blanco-Velasco, M.; Barner, K.E. Compressed sensing based method for ECG compression. In Proceedings of the 2011 IEEE International Conference on Acoustics, Speech and Signal Processing, Prague, Czech Republic, 22–27 May 2011; pp. 761–764. [Google Scholar]
- Mishra, A.; Thakkar, F.; Modi, C.; Kher, R. ECG signal compression using Compressive Sensing and wavelet transform. In Proceedings of the 2012 Annual International Conference of the IEEE Engineering in Medicine and Biology Society, San Diego, CA, USA, 28 August–1 September 2012; pp. 3404–3407. [Google Scholar]
- Casson, A.J.; Rodriguez-Villegas, E. Signal agnostic compressive sensing for body area networks: Comparison of signal reconstructions. In Proceedings of the 2012 Annual International Conference of the IEEE Engineering in Medicine and Biology Society, San Diego, CA, USA, 28 August–1 September 2012; pp. 4497–4500. [Google Scholar]
- Chae, D.H.; Alem, Y.F.; Durrani, S.; Kennedy, R.A. Performance study of compressive sampling for ECG signal compression in noisy and varying sparsity acquisition. In Proceedings of the 2013 IEEE International Conference on Acoustics, Speech and Signal Processing, Vancouver, BC, Canada, 26–31 May 2013; pp. 1306–1309. [Google Scholar]
- Arnavut, Z. ECG signal compression based on Burrows-Wheeler transformation and inversion ranks of linear prediction. IEEE Trans. Biomed. Eng. 2007, 54, 410–418. [Google Scholar] [CrossRef] [PubMed]
- Miaou, S.G.; Chao, S.N. Wavelet-based lossy-to-lossless ECG compression in a unified vector quantization framework. IEEE Trans. Biomed. Eng. 2005, 52, 539–543. [Google Scholar] [CrossRef] [PubMed]
- Zhang, Z.; Jung, T.P.; Makeig, S.; Rao, B.D. Compressed sensing of EEG for wireless telemonitoring with low energy consumption and inexpensive hardware. IEEE Trans. Biomed. Eng. 2013, 60, 221–224. [Google Scholar] [CrossRef] [PubMed]
- Fauvel, S.; Ward, R.K. An energy efficient compressed sensing framework for the compression of electroencephalogram signals. Sensors 2014, 14, 1474–1496. [Google Scholar] [CrossRef] [PubMed]
- Zhang, J.; Gu, Z.; Yu, Z.L.; Li, Y. Energy-Efficient ECG Compression on Wireless Biosensors via Minimal Coherence Sensing and Weighted \ell_1 Minimization Reconstruction. IEEE J. Biomed. Health Inform. 2015, 19, 520–528. [Google Scholar] [CrossRef] [PubMed]
- Moraes, J.C.T.B.; Freitas, M.M.; Vilani, F.N.; Costa, E.V. A QRS complex detection algorithm using electrocardiogram leads. IEEE Comput. Cardiol. 2002, 205–208. [Google Scholar] [CrossRef]
- Elgendi, M.; Jonkman, M.; De Boer, F. Frequency Bands Effects on QRS Detection. In Proceedings of the International Joint Conference on Biomedical Engineering Systems and Technologies (BIOSIGNALS 2010), Valencia, Spain, 20–23 January 2010; pp. 428–431. [Google Scholar]
- Elgendi, M.; Eskofier, B.; Abbott, D. Fast T wave detection calibrated by clinical knowledge with annotation of P and T waves. Sensors 2015, 15, 17693–17714. [Google Scholar] [CrossRef] [PubMed]
- Elgendi, M.; Meo, M.; Abbott, D. A Proof-of-Concept Study: Simple and Effective Detection of P and T Waves in Arrhythmic ECG Signals. Bioengineering 2016, 3, 26. [Google Scholar] [CrossRef] [PubMed]
- Liu, X.; Zheng, Y.; Phyu, M.W.; Endru, F.; Navaneethan, V.; Zhao, B. An ultra-low power ECG acquisition and monitoring ASIC system for WBAN applications. IEEE J. Emerg. Sel. Top. Circuits Syst. 2012, 2, 60–70. [Google Scholar] [CrossRef]
- Mazomenos, E.B.; Biswas, D.; Acharyya, A.; Chen, T.; Maharatna, K.; Rosengarten, J.; Morgan, J.; Curzen, N. A low-complexity ECG feature extraction algorithm for mobile healthcare applications. IEEE J. Biomed. Health Inform. 2013, 17, 459–469. [Google Scholar] [CrossRef] [PubMed]
- Yuce, M.R. Implementation of wireless body area networks for healthcare systems. Sens. Actuators A Phys. 2010, 162, 116–129. [Google Scholar] [CrossRef]
- Elgendi, M.; Howard, N.; Lovell, N.; Cichocki, A.; Brearley, M.; Abbott, D.; Adatia, I. A Six-Step Framework on Biomedical Signal Analysis for Tackling Noncommunicable Diseases: Current and Future Perspectives. JMIR Biomed. Eng. 2016, 1, e1. [Google Scholar] [CrossRef]


| K | No. Beats | TP | FP | FN | SE | PP | g |
|---|---|---|---|---|---|---|---|
| 360 | 109,985 | 109,742 | 126 | 250 | 99.78 | 99.87 | 99.83 |
| 180 | 109,985 | 109,756 | 144 | 236 | 99.79 | 99.85 | 99.83 |
| 120 | 109,985 | 109,786 | 167 | 223 | 99.80 | 99.83 | 99.82 |
| 90 | 109,985 | 109,788 | 204 | 212 | 99.81 | 99.79 | 99.81 |
| 72 | 109,985 | 109,786 | 259 | 219 | 99.80 | 99.73 | 99.78 |
| 60 | 109,985 | 109,818 | 196 | 208 | 99.81 | 99.80 | 99.82 |
| 51 | 109,985 | 109,867 | 252 | 197 | 99.83 | 99.75 | 99.80 |
| 45 | 109,985 | 109,800 | 217 | 222 | 99.80 | 99.78 | 99.80 |
| Record | No. of Beats | TP | FP | FN | SE(%) | +P(%) | g(%) |
|---|---|---|---|---|---|---|---|
| 100 | 2274 | 2274 | 0 | 0 | 100.00 | 100.00 | 100.00 |
| 101 | 1866 | 1866 | 3 | 0 | 100.00 | 99.84 | 99.92 |
| 102 | 2187 | 2187 | 0 | 0 | 100.00 | 100.00 | 100.00 |
| 103 | 2084 | 2084 | 0 | 0 | 100.00 | 100.00 | 100.00 |
| 104 | 2229 | 2231 | 27 | 0 | 100.00 | 98.80 | 99.40 |
| 105 | 2602 | 2602 | 5 | 0 | 100.00 | 99.81 | 99.90 |
| 106 | 2026 | 2025 | 4 | 1 | 99.95 | 99.80 | 99.88 |
| 107 | 2136 | 2137 | 0 | 0 | 100.00 | 100.00 | 100.00 |
| 108 | 1763 | 1791 | 42 | 2 | 99.89 | 97.71 | 98.79 |
| 109 | 2533 | 2533 | 0 | 0 | 100.00 | 100.00 | 100.00 |
| 111 | 2123 | 2123 | 3 | 0 | 100.00 | 99.86 | 99.93 |
| 112 | 2539 | 2539 | 0 | 0 | 100.00 | 100.00 | 100.00 |
| 113 | 1794 | 1794 | 3 | 0 | 100.00 | 99.83 | 99.92 |
| 114 | 1890 | 1881 | 9 | 9 | 99.52 | 99.52 | 99.52 |
| 115 | 1953 | 1953 | 0 | 0 | 100.00 | 100.00 | 100.00 |
| 116 | 2395 | 2395 | 1 | 0 | 100.00 | 99.96 | 99.98 |
| 117 | 1535 | 1535 | 1 | 0 | 100.00 | 99.93 | 99.97 |
| 118 | 2278 | 2278 | 1 | 0 | 100.00 | 99.96 | 99.98 |
| 119 | 1988 | 1988 | 0 | 0 | 100.00 | 100.00 | 100.00 |
| 121 | 1863 | 1863 | 0 | 0 | 100.00 | 100.00 | 100.00 |
| 122 | 2476 | 2476 | 0 | 0 | 100.00 | 100.00 | 100.00 |
| 123 | 1519 | 1519 | 0 | 0 | 100.00 | 100.00 | 100.00 |
| 124 | 1619 | 1619 | 0 | 0 | 100.00 | 100.00 | 100.00 |
| 200 | 2601 | 2601 | 6 | 0 | 100.00 | 99.77 | 99.88 |
| 201 | 1949 | 1949 | 13 | 0 | 100.00 | 99.34 | 99.67 |
| 202 | 2138 | 2133 | 0 | 5 | 99.77 | 100.00 | 99.88 |
| 203 | 2988 | 2979 | 10 | 11 | 99.63 | 99.67 | 99.65 |
| 205 | 2656 | 2655 | 0 | 1 | 99.96 | 100.00 | 99.98 |
| 207 | 2324 | 2163 | 3 | 167 | 92.83 | 99.86 | 96.22 |
| 208 | 2953 | 2947 | 0 | 6 | 99.80 | 100.00 | 99.90 |
| 209 | 3006 | 3006 | 0 | 0 | 100.00 | 100.00 | 100.00 |
| 210 | 2652 | 2650 | 1 | 2 | 99.92 | 99.96 | 99.94 |
| 212 | 2748 | 2748 | 0 | 0 | 100.00 | 100.00 | 100.00 |
| 213 | 3250 | 3249 | 0 | 1 | 99.97 | 100.00 | 99.98 |
| 214 | 2262 | 2260 | 1 | 2 | 99.91 | 99.96 | 99.93 |
| 215 | 3362 | 3362 | 1 | 0 | 100.00 | 99.97 | 99.99 |
| 217 | 2208 | 2208 | 1 | 0 | 100.00 | 99.95 | 99.98 |
| 219 | 2154 | 2154 | 0 | 0 | 100.00 | 100.00 | 100.00 |
| 220 | 2048 | 2048 | 0 | 0 | 100.00 | 100.00 | 100.00 |
| 221 | 2427 | 2427 | 0 | 0 | 100.00 | 100.00 | 100.00 |
| 222 | 2485 | 2485 | 4 | 0 | 100.00 | 99.84 | 99.92 |
| 223 | 2604 | 2604 | 0 | 0 | 100.00 | 100.00 | 100.00 |
| 228 | 2060 | 2059 | 39 | 1 | 99.95 | 98.14 | 99.04 |
| 230 | 2256 | 2256 | 1 | 0 | 100.00 | 99.96 | 99.98 |
| 231 | 1571 | 1571 | 0 | 0 | 100.00 | 100.00 | 100.00 |
| 232 | 1783 | 1783 | 14 | 0 | 100.00 | 99.22 | 99.61 |
| 233 | 3077 | 3077 | 1 | 0 | 100.00 | 99.97 | 99.98 |
| 234 | 2751 | 2751 | 2 | 0 | 100.00 | 99.93 | 99.96 |
| 48 Records | 109,985 | 109,818 | 196 | 208 | 99.81 | 99.80 | 99.81 |
| Ref. | Method | (%) | (%) |
|---|---|---|---|
| Hamilton and Tompkins [34] | Band-pass filter/Search-back | 99.69 | 99.77 |
| Poli et al. [35] | Genetic Algorithm | 99.60 | 99.51 |
| Afonso et al. [36] | Filter Banks | 99.59 | 99.56 |
| Martínez et al. [37] | Wavelet Delineation | 99.66 | 99.56 |
| Chen et al. [38] | Wavelet De-noising | 99.55 | 99.49 |
| Zhang and Lian [41] | Multiscale Morphology | 99.81 | 99.80 |
| Ieong et al. [39] | Quadratic Spline wavelet | 99.31 | 99.70 |
| Nallathambi and Principe [40] | Pulse Train | 99.58 | 99.55 |
| Method I | Adaptive Predictor | 99.64 | 99.81 |
| Method II | Decimating By A Factor | 99.78 | 99.92 |
| Method III | Decimating By A Factor K | 99.81 | 99.80 |
| Compression Type | Method | Year | No. Records Used | BCR | PRD | Ref. |
|---|---|---|---|---|---|---|
| Simple Predictor/Huffman Coding | 2009 | N/R | 1.92 | ≈0 | [44] | |
| Delta Predictor/Rice Golomb Coding | 2011 | N/R | 2.38 | ≈0 | [42] | |
| Lossless | Adaptive Predictor/Huffman Coding | 2013 | N/R | 2.43 | ≈0 | [43] |
| Slope Predictor/Fixed-length Packaging | 2013 | N/R | 2.25 | ≈0 | [45] | |
| Method I | 2015 | All records in MIT-BIH Arrhythmia DB | 2.28 | ≈0 | [30] | |
| Simultaneous Orthogonal Matching Pursuit | 2011 | One record from MIT-BIH Arrhythmia DB | 7.23 | 2.57 | [50] | |
| Compressive Sensing | 2011 | All records in MIT-BIH Arrhythmia DB | 3.44 | 9 | [46] | |
| Wavelet Transform | 2012 | 10 records from MIT-BIH Arrhythmia DB | 4.0 | 1.66 | [51] | |
| Nonuniform Binary Matrices | 2012 | N/R | 5.0 | 8.58 | [47] | |
| Compressive Sensing | 2012 | 3 records from MIT-BIH Arrhythmia DB | 2.5 | 2.6 | [52] | |
| Lossy | Encoding with Modified Thresholding | 2013 | 4 records from MIT-BIH Arrhythmia DB | 5.4 | 2.7 | [48] |
| Compressive Sampling | 2013 | One record from MIT-BIH Arrhythmia DB | 2.5 | 9 | [53] | |
| Compressive Sensing | 2015 | 11 records from MIT-BIH Arrhythmia DB | 6.4 | 3.75 | [49] | |
| Method II | 2017 | All records from MIT-BIH Arrhythmia DB | 4.5 | 0.53 | [22] | |
| Method III | 2017 | All records in MIT-BIH Arrhythmia DB | 6 | 1.88 | – |
| Record | No. of Beats | TP | FP | FN | SE(%) | +P(%) |
|---|---|---|---|---|---|---|
| 100 | 1134 | 1134 | 0 | 0 | 100.00 | 100.00 |
| 102 | 1088 | 1088 | 0 | 0 | 100.00 | 100.00 |
| 103 | 1048 | 1048 | 0 | 0 | 100.00 | 100.00 |
| 104 | 1109 | 1118 | 0 | 0 | 100.00 | 100.00 |
| 114 | 867 | 866 | 3 | 1 | 99.88 | 99.65 |
| 116 | 1186 | 1186 | 0 | 0 | 100.00 | 100.00 |
| 117 | 766 | 766 | 0 | 0 | 100.00 | 100.00 |
| 123 | 756 | 756 | 0 | 0 | 100.00 | 100.00 |
| 213 | 1641 | 1641 | 0 | 0 | 100.00 | 100.00 |
| 221 | 1247 | 1247 | 1 | 0 | 100.00 | 99.92 |
| 223 | 1309 | 1309 | 0 | 0 | 100.00 | 100.00 |
| 230 | 1077 | 1077 | 0 | 0 | 100.00 | 100.00 |
| 231 | 732 | 732 | 0 | 0 | 100.00 | 100.00 |
| 232 | 866 | 866 | 2 | 0 | 100.00 | 99.77 |
| 233 | 1532 | 1532 | 0 | 0 | 100.00 | 100.00 |
| 301 | 1352 | 1352 | 0 | 0 | 100.00 | 100.00 |
| 302 | 1501 | 1501 | 0 | 0 | 100.00 | 100.00 |
| 306 | 1040 | 1040 | 0 | 0 | 100.00 | 100.00 |
| 307 | 853 | 853 | 0 | 0 | 100.00 | 100.00 |
| 308 | 1294 | 1294 | 3 | 0 | 100.00 | 99.77 |
| 310 | 2012 | 2012 | 0 | 0 | 100.00 | 100.00 |
| 803 | 1026 | 1026 | 0 | 0 | 100.00 | 100.00 |
| 808 | 903 | 903 | 5 | 0 | 100.00 | 99.45 |
| 811 | 704 | 704 | 0 | 0 | 100.00 | 100.00 |
| 820 | 1159 | 1159 | 0 | 0 | 100.00 | 100.00 |
| 821 | 1557 | 1557 | 0 | 0 | 100.00 | 100.00 |
| 840 | 1180 | 1180 | 0 | 0 | 100.00 | 100.00 |
| 847 | 803 | 801 | 8 | 2 | 99.75 | 99.01 |
| 853 | 1113 | 1113 | 0 | 0 | 100.00 | 100.00 |
| 871 | 917 | 917 | 1 | 0 | 100.00 | 99.89 |
| 872 | 990 | 990 | 0 | 0 | 100.00 | 100.00 |
| 873 | 859 | 859 | 0 | 0 | 100.00 | 100.00 |
| 883 | 892 | 892 | 0 | 0 | 100.00 | 100.00 |
| 891 | 1267 | 1267 | 0 | 0 | 100.00 | 100.00 |
| 16265 | 1031 | 1031 | 0 | 0 | 100.00 | 100.00 |
| 16272 | 851 | 851 | 0 | 0 | 100.00 | 100.00 |
| 16273 | 1112 | 1112 | 0 | 0 | 100.00 | 100.00 |
| 16420 | 1063 | 1063 | 0 | 0 | 100.00 | 100.00 |
| 16483 | 1087 | 1087 | 0 | 0 | 100.00 | 100.00 |
| 16539 | 922 | 922 | 0 | 0 | 100.00 | 100.00 |
| 16773 | 1008 | 1008 | 0 | 0 | 100.00 | 100.00 |
| 16786 | 925 | 925 | 0 | 0 | 100.00 | 100.00 |
| 16795 | 761 | 761 | 0 | 0 | 100.00 | 100.00 |
| 17453 | 1047 | 1047 | 0 | 0 | 100.00 | 100.00 |
| 104 | 804 | 804 | 0 | 0 | 100.00 | 100.00 |
| 106 | 897 | 897 | 17 | 0 | 100.00 | 98.14 |
| 107 | 823 | 822 | 25 | 1 | 99.88 | 97.05 |
| 110 | 872 | 872 | 15 | 0 | 100.00 | 98.31 |
| 111 | 908 | 907 | 161 | 1 | 99.89 | 84.93 |
| 112 | 684 | 684 | 12 | 0 | 100.00 | 98.28 |
| 114 | 698 | 698 | 1 | 0 | 100.00 | 99.86 |
| 116 | 560 | 560 | 16 | 0 | 100.00 | 97.22 |
| 121 | 1434 | 1434 | 2 | 0 | 100.00 | 99.86 |
| 122 | 1414 | 1414 | 0 | 0 | 100.00 | 100.00 |
| 124 | 1121 | 1121 | 0 | 0 | 100.00 | 100.00 |
| 126 | 945 | 945 | 0 | 0 | 100.00 | 100.00 |
| 129 | 672 | 671 | 184 | 1 | 99.85 | 78.48 |
| 133 | 840 | 838 | 2 | 2 | 99.76 | 99.76 |
| 136 | 810 | 810 | 0 | 0 | 100.00 | 100.00 |
| 166 | 813 | 813 | 4 | 0 | 100.00 | 99.51 |
| 170 | 897 | 897 | 0 | 0 | 100.00 | 100.00 |
| 203 | 1246 | 1246 | 1 | 0 | 100.00 | 99.92 |
| 210 | 1063 | 1063 | 5 | 0 | 100.00 | 99.53 |
| 211 | 1575 | 1575 | 0 | 0 | 100.00 | 100.00 |
| 303 | 1045 | 1045 | 0 | 0 | 100.00 | 100.00 |
| 405 | 1216 | 1216 | 0 | 0 | 100.00 | 100.00 |
| 406 | 959 | 959 | 3 | 0 | 100.00 | 99.69 |
| 409 | 1737 | 1737 | 0 | 0 | 100.00 | 100.00 |
| 411 | 1202 | 1202 | 0 | 0 | 100.00 | 100.00 |
| 509 | 1028 | 1028 | 0 | 0 | 100.00 | 100.00 |
| 603 | 869 | 869 | 0 | 0 | 100.00 | 100.00 |
| 604 | 1031 | 1031 | 1 | 0 | 100.00 | 99.90 |
| 606 | 1442 | 1442 | 0 | 0 | 100.00 | 100.00 |
| 607 | 1184 | 1184 | 0 | 0 | 100.00 | 100.00 |
| 609 | 1127 | 1127 | 0 | 0 | 100.00 | 100.00 |
| 612 | 751 | 751 | 1 | 0 | 100.00 | 99.87 |
| 704 | 1094 | 1094 | 0 | 0 | 100.00 | 100.00 |
| 30 | 1018 | 1018 | 4 | 0 | 100.00 | 99.61 |
| 31 | 1087 | 1087 | 0 | 0 | 100.00 | 100.00 |
| 32 | 1196 | 1197 | 2 | 0 | 100.00 | 99.83 |
| 33 | 527 | 527 | 0 | 0 | 100.00 | 100.00 |
| 34 | 897 | 897 | 0 | 0 | 100.00 | 100.00 |
| 35 | 882 | 882 | 101 | 0 | 100.00 | 89.73 |
| 36 | 948 | 948 | 1 | 0 | 100.00 | 99.89 |
| 37 | 682 | 682 | 62 | 0 | 100.00 | 91.67 |
| 38 | 1563 | 1563 | 0 | 0 | 100.00 | 100.00 |
| 39 | 1171 | 1171 | 3 | 0 | 100.00 | 99.74 |
| 40 | 1069 | 1069 | 1 | 0 | 100.00 | 99.91 |
| 41 | 1366 | 1366 | 0 | 0 | 100.00 | 100.00 |
| 42 | 1247 | 1247 | 0 | 0 | 100.00 | 100.00 |
| 43 | 1430 | 1430 | 0 | 0 | 100.00 | 100.00 |
| 44 | 1337 | 1340 | 6 | 0 | 100.00 | 99.55 |
| 45 | 971 | 971 | 0 | 0 | 100.00 | 100.00 |
| 46 | 856 | 856 | 1 | 0 | 100.00 | 99.88 |
| 47 | 886 | 886 | 0 | 0 | 100.00 | 100.00 |
| 48 | 1398 | 1398 | 0 | 0 | 100.00 | 100.00 |
| 49 | 833 | 833 | 2 | 0 | 100.00 | 99.76 |
| 50 | 661 | 661 | 0 | 0 | 100.00 | 100.00 |
| 51 | 749 | 749 | 0 | 0 | 100.00 | 100.00 |
| 52 | 1411 | 1411 | 0 | 0 | 100.00 | 100.00 |
| 17152 | 1628 | 1628 | 0 | 0 | 100.00 | 100.00 |
| 14046 | 1260 | 1260 | 0 | 0 | 100.00 | 100.00 |
| 14157 | 1081 | 1081 | 0 | 0 | 100.00 | 100.00 |
| 14172 | 663 | 663 | 0 | 0 | 100.00 | 100.00 |
| 15814 | 1036 | 1036 | 0 | 0 | 100.00 | 100.00 |
| 105 Records | 111,201 | 111,206 | 656 | 8 | 99.99 | 99.31 |
| Ref. | No. of Beats | (%) | (%) |
|---|---|---|---|
| Aristotle [37] | 86,892 | 97.20 | 99.46 |
| Martínez et al. [37] | 86,892 | 99.92 | 99.88 |
| Pan and Tompkins [26] | 111,201 | 97.99 | 99.05 |
| Elgendi [26] | 111,201 | 99.99 | 99.67 |
| Method II ( Decimator) | 111,201 | 99.90 | 99.84 |
| Method III (K Decimator) | 111,201 | 99.99 | 99.31 |
© 2018 by the authors. Licensee MDPI, Basel, Switzerland. This article is an open access article distributed under the terms and conditions of the Creative Commons Attribution (CC BY) license (http://creativecommons.org/licenses/by/4.0/).
Share and Cite
Elgendi, M.; Al-Ali, A.; Mohamed, A.; Ward, R. Improving Remote Health Monitoring: A Low-Complexity ECG Compression Approach. Diagnostics 2018, 8, 10. https://doi.org/10.3390/diagnostics8010010
Elgendi M, Al-Ali A, Mohamed A, Ward R. Improving Remote Health Monitoring: A Low-Complexity ECG Compression Approach. Diagnostics. 2018; 8(1):10. https://doi.org/10.3390/diagnostics8010010
Chicago/Turabian StyleElgendi, Mohamed, Abdulla Al-Ali, Amr Mohamed, and Rabab Ward. 2018. "Improving Remote Health Monitoring: A Low-Complexity ECG Compression Approach" Diagnostics 8, no. 1: 10. https://doi.org/10.3390/diagnostics8010010
APA StyleElgendi, M., Al-Ali, A., Mohamed, A., & Ward, R. (2018). Improving Remote Health Monitoring: A Low-Complexity ECG Compression Approach. Diagnostics, 8(1), 10. https://doi.org/10.3390/diagnostics8010010